Embed Size (px)
Citation preview
September 2010
“UNUSUALLY UNCERTAIN”
Patrick O’Toole, CGA, CFAVice-President, CIBC Global Asset Management

2 2
CIBC Global Asset Management
History: Our firm has focused on the active management of assets since 1972. We are committed to our clients, which helps explain why many have been with us for more than 30 years.
Depth: Clients with more than 250 mandates have chosen CIBC Global Asset Management Inc. as their investment partner, with $58 billion in assets managed on their behalf.
Strength: CIBC Global Asset Management has the dedication of 136 employees, including 54 investment professionals. We also benefit from the resources, reliability, and stability of CIBC.
Assets Under Management ($BN) at Dec. 31, 2009
Bonds$28
Money Market$12
Stocks$18

3 3
MESSAGE
CREDIT CRISIS FALLOUT WILL LAST 5+ YEARS– YEAR 2 HAS PASSED
ECONOMIES STILL NEED LIFE SUPPORT– SECULAR HEADWINDS ARE FORMIDABLE
CENTRAL BANKS WILL MOVE SLOWLY TO RAISE RATES– THIS IS NOT A TYPICAL POSTWAR RECESSION/RECOVERY

4 4
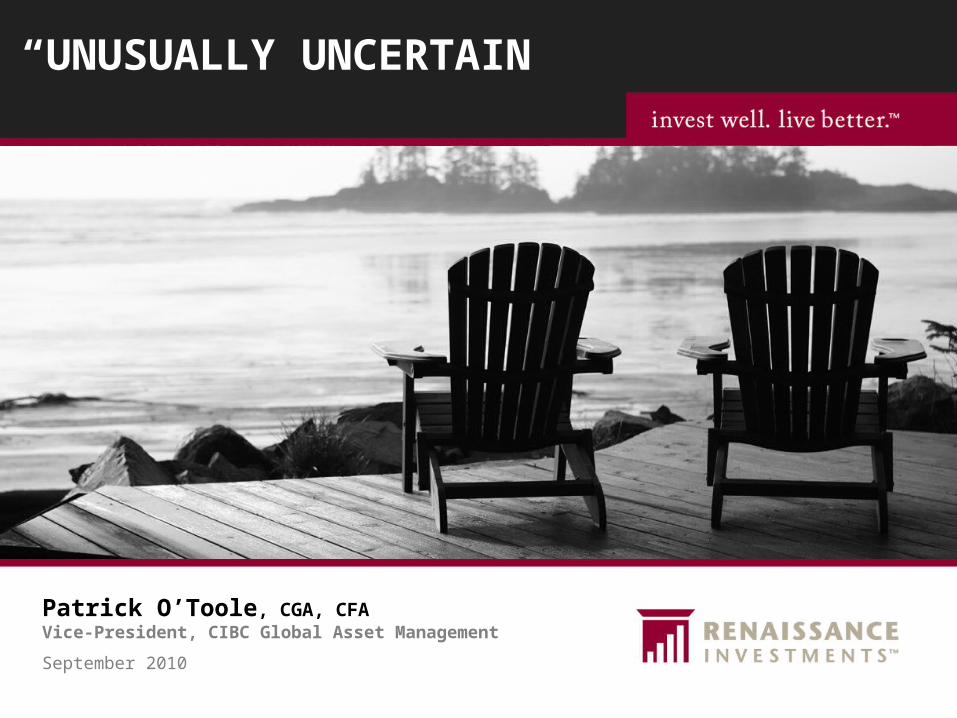
Economy – National Bureau of Economic Research Indicators
Source: Datastream and CIBC Global Asset Management Inc.
Both industrial production and manufacturing suffered a record fall during this recession.
At this pace, they’ll take several more years to achieve prior heights.
Unfortunately, recent indicators point to them topping out.
U.S. Manufacturing & Trade Sales
Current vs. Average Expansions
The Good
100
102
104
106
108
110
112
114
JUN 07 DEC 07 JUN 08 DEC 08 JUN 09 DEC 09 JUN 10 DEC 10
Current Expansion of Manufacturing & Trade SalesAverage Expansions
U.S. Manufacturing & Trade Sales Expansion vs. Average Expansions
Source: Datastream & CIBC Global Asset Management Inc. Calculations
Assuming recession ended in June 2009 (=100)
U.S. Industrial Production
Current vs. Average Expansions
100
104
108
112
116
JUN 07 DEC 07 JUN 08 DEC 08 JUN 09 DEC 09 JUN 10 DEC 10
Current Expansion of Industrial ProductionAverage Expansions
U.S. Industrial Production Expansion vs. Average Expansions
Source: Datastream & CIBC Global Asset Management Inc. Calculations
Assuming recession ended in June 2009 (=100)
5 5
The Bad
Source: Datastream and CIBC Global Asset Management Inc.
Both income growth and employment are tracking well below prior recoveries.
Lack of income growth is a serious headwind.
A slow recovery in employment is hindering income growth.
Argues for a “square root” shaped recovery.
U.S. Personal Income Less Transfers
Current vs. Average Expansions
99
100
101
102
103
104
105
JUN 07 DEC 07 JUN 08 DEC 08 JUN 09 DEC 09 JUN 10 DEC 10
Current Expansion of Personal Income less TransfersAverage Expansions
U.S. Personal Income less Transfers Expansion vs. Average Expansions
Source: Datastream & CIBC Global Asset Management Inc. Calculations
Assuming recession ended in June 2009 (=100)
U.S. Nonfarm Payroll
Current vs. Average Expansions
100
101
102
103
104
105
JUN 07 DEC 07 JUN 08 DEC 08 JUN 09 DEC 09 JUN 10 DEC 10
Current Expansion of Nonfarm PayrollsAverage Expansions
U.S. Nonfarm Payroll Expansion vs. Average Expansions
Source: Datastream & CIBC Global Asset Management Inc. Calculations
Assuming recession ended in June 2009 (=100)
Economy – National Bureau of Economic Research Indicators
6 6
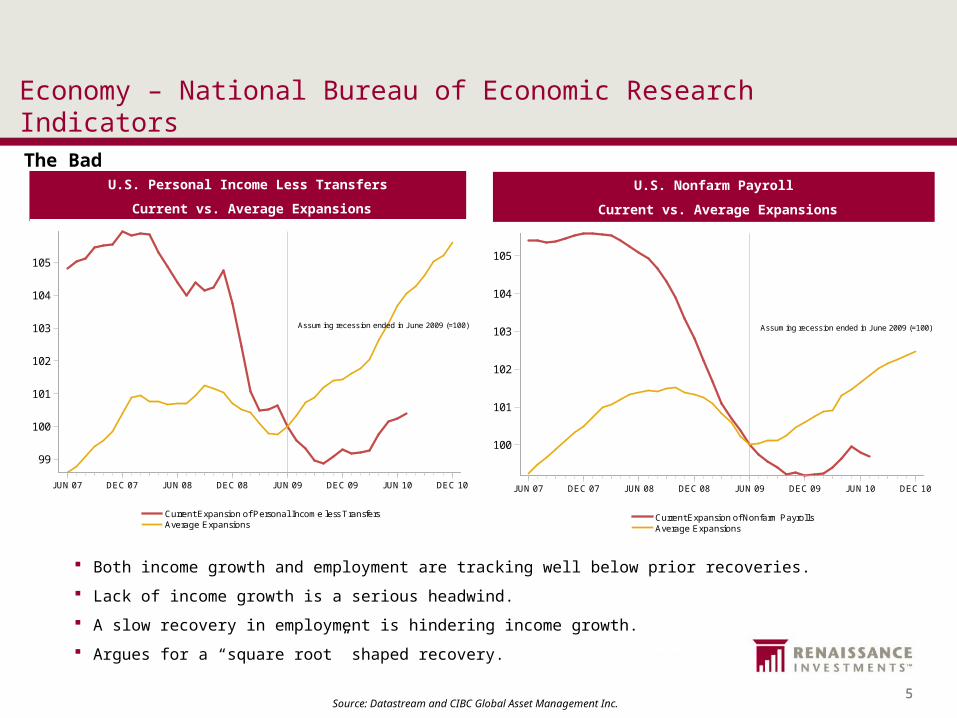
Economy – Housing
Source: Datastream
An unprecedented run-up in prices has led to an unprecedented supply of homes.
House prices aren’t done falling in the U.S.
Our valuation model for Canada suggests a period of weaker prices.
The feedback loop from housing to consumers’ spending attitudes is another headwind.
U.S. Months’ Supply of Existing Homes
The Ugly
4
5
6
7
8
9
10
11
12
1999 2000 2001 2002 2003 2004 2005 2006 2007 2008 2009 2010
U.S. Total Existing Homes
U.S. Months' Supply of Existing Homes
Source: Datastream
Months
- 50000
50000
150000
250000
350000
1980 1985 1990 1995 2000 2005 2010
CDN
$
-20
-10
0
10
20
30
40
50
60
70
80
90
100
110
120
130
deviations from fair value home prices fair value
Canadian Housing Valuation: home prices vs. fair value & deviations from fair value (%)
7 7
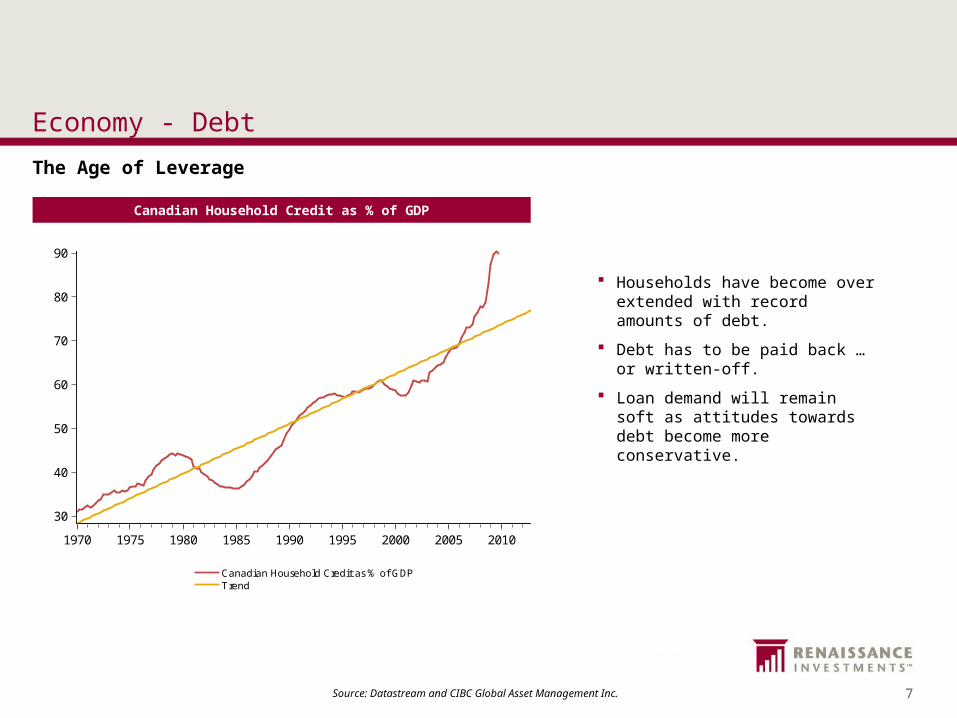
Economy - Debt
Source: Datastream and CIBC Global Asset Management Inc.
Households have become over extended with record amounts of debt.
Debt has to be paid back … or written-off.
Loan demand will remain soft as attitudes towards debt become more conservative.
The Age of Leverage
30
40
50
60
70
80
90
1970 1975 1980 1985 1990 1995 2000 2005 2010
Canadian Household Credit as % of GDPTrend
Canadian Household Credit as % of GDP
Source: Datastream & CIBC Global Asset Management Inc. Calculations
Canadian Household Credit as % of GDP
8 8
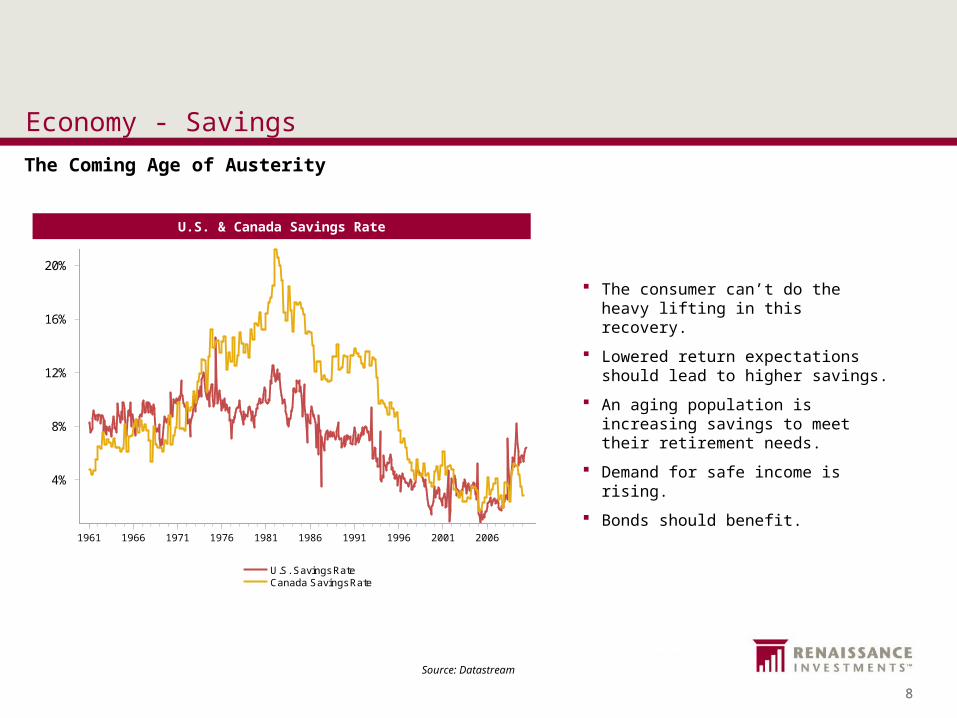
Economy - Savings
Source: Datastream
The consumer can’t do the heavy lifting in this recovery.
Lowered return expectations should lead to higher savings.
An aging population is increasing savings to meet their retirement needs.
Demand for safe income is rising.
Bonds should benefit.
U.S. & Canada Savings Rate
The Coming Age of Austerity
4%
8%
12%
16%
20%
1961 1966 1971 1976 1981 1986 1991 1996 2001 2006
U.S. Savings RateCanada Savings Rate
U.S. & Canada Savings Rate
Source: Datastream
9 9
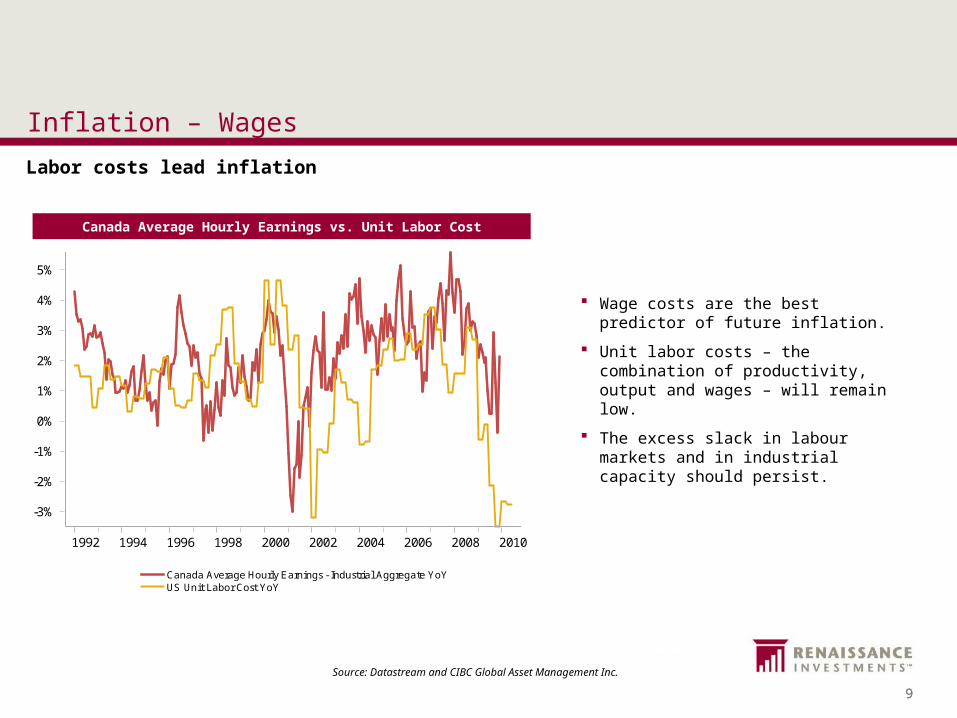
Inflation – Wages
Source: Datastream and CIBC Global Asset Management Inc.
Wage costs are the best predictor of future inflation.
Unit labor costs – the combination of productivity, output and wages – will remain low.
The excess slack in labour markets and in industrial capacity should persist.
Canada Average Hourly Earnings vs. Unit Labor Cost
Labor costs lead inflation
-3%
-2%
-1%
0%
1%
2%
3%
4%
5%
1992 1994 1996 1998 2000 2002 2004 2006 2008 2010
Canada Average Hourly Earnings - Industrial Aggregate YoYUS Unit Labor Cost YoY
Canada Average Hourly Earnings vs U.S. Unit Labor Cost
Source: Datastream & CIBC Global Asset Management Inc. Calculations

10 10
Inflation - CPI
Source: Datastream and CIBC Global Asset Management Inc.
Inflation remains low in deleveraging periods.
Commodity prices are a small component of inflation.
A strong Canadian dollar is a restraining force on prices.
Low and stable inflation is expected.
CPI – Total (Year-To-Year Changes)
Inflation has remained stable for years
0%
2%
4%
6%
8%
10%
12%
14%
60 65 70 75 80 85 90 95 00 05 10
U.S. CPI Total YoYCanadian CPI Total YoY
CPI - Total (Year-to-Year Changes)
Source: Datastream & CIBC Global Asset M anag ement Inc. Calculations
11 11
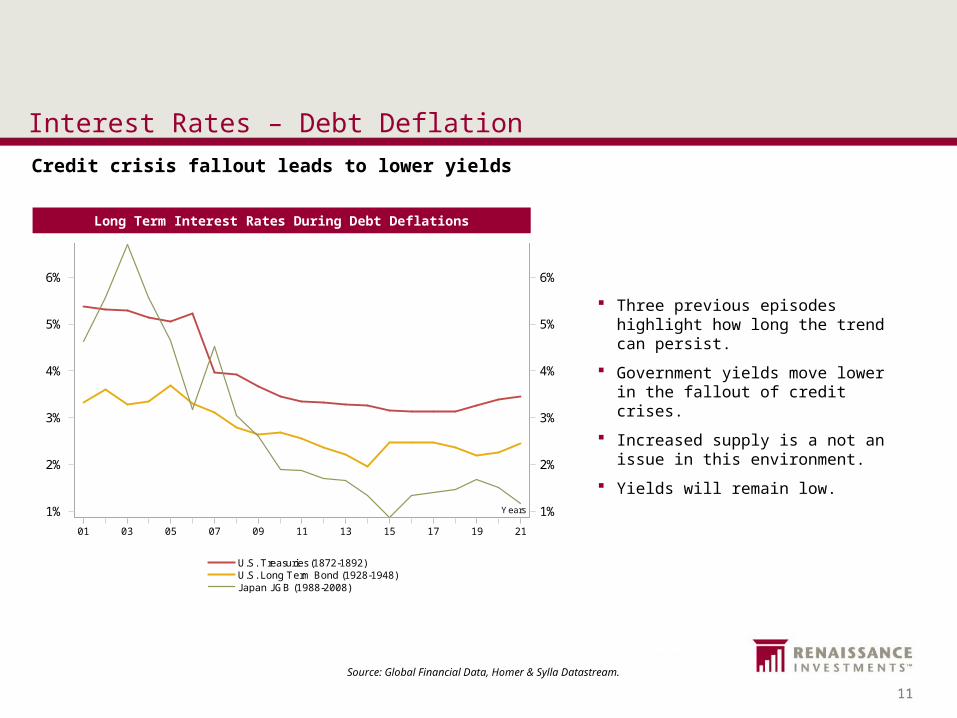
Interest Rates – Debt Deflation
Source: Global Financial Data, Homer & Sylla Datastream.
Three previous episodes highlight how long the trend can persist.
Government yields move lower in the fallout of credit crises.
Increased supply is a not an issue in this environment.
Yields will remain low.
Long Term Interest Rates During Debt Deflations
1%
2%
3%
4%
5%
6%
1%
2%
3%
4%
5%
6%
01 03 05 07 09 11 13 15 17 19 21
U.S. Treasuries (1872-1892)U.S. Long Term Bond (1928-1948)Japan JGB (1988-2008)
Long Term Interest Rates during Debt Deflations
Source: Global Financial Data, Homer & Sylla, Datastream
Y ears
Credit crisis fallout leads to lower yields
12 12
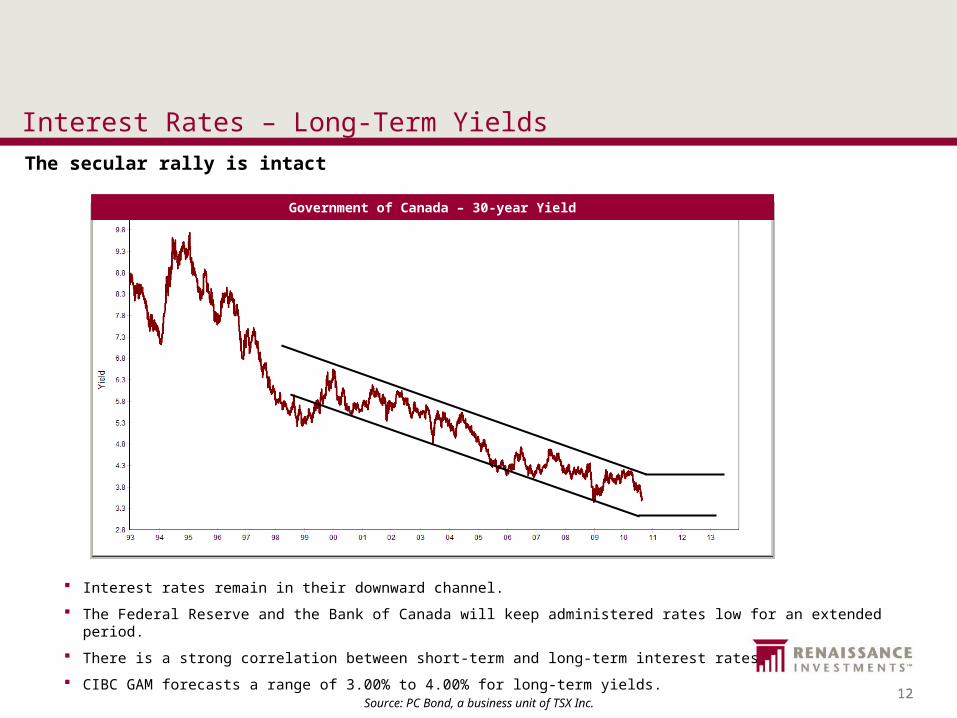
Interest Rates – Long-Term YieldsThe secular rally is intact
Government of Canada – 30-year Yield
Interest rates remain in their downward channel.
The Federal Reserve and the Bank of Canada will keep administered rates low for an extended period.
There is a strong correlation between short-term and long-term interest rates.
CIBC GAM forecasts a range of 3.00% to 4.00% for long-term yields.
Source: PC Bond, a business unit of TSX Inc.

13 13
Yield Curve - 30yr less 2yr
Interest Rates – Yield CurveA steep curve cures bankers’ ills
An extended period of low short-term rates relieves pressure on rising bond yields.
Current “steepness” is needed as financial institutions repair their balance sheets.
Source: PC Bond, a business unit of TSX Inc.
14 14
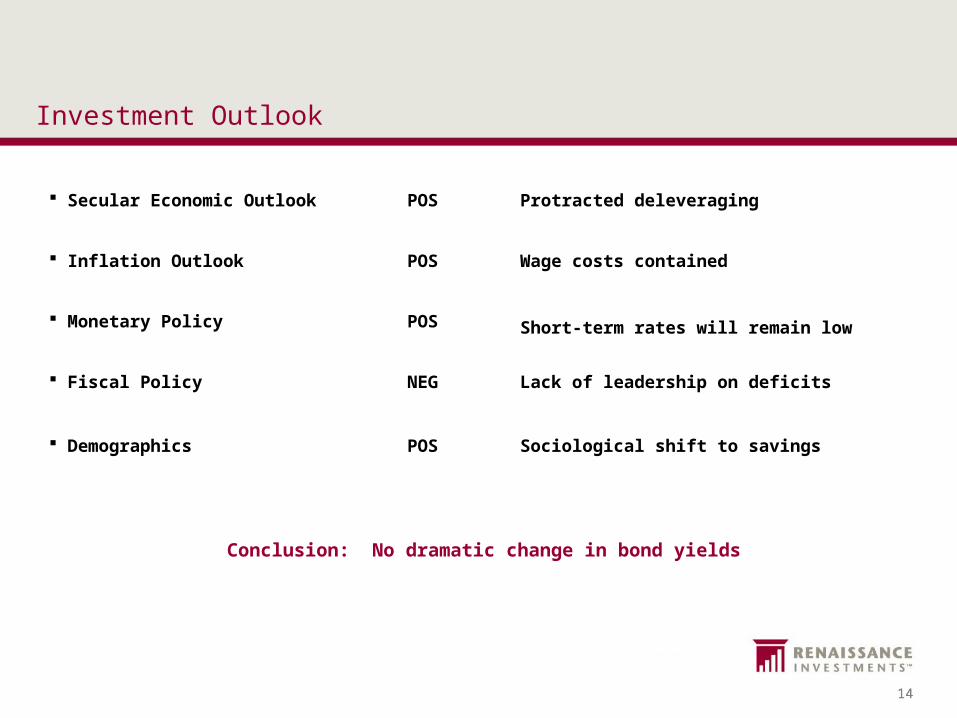
Investment Outlook
Conclusion: No dramatic change in bond yields
Secular Economic Outlook POS Protracted deleveraging
Inflation Outlook POS Wage costs contained
Monetary Policy POS Short-term rates will remain low
Fiscal Policy NEG Lack of leadership on deficits
Demographics POS Sociological shift to savings
15 15
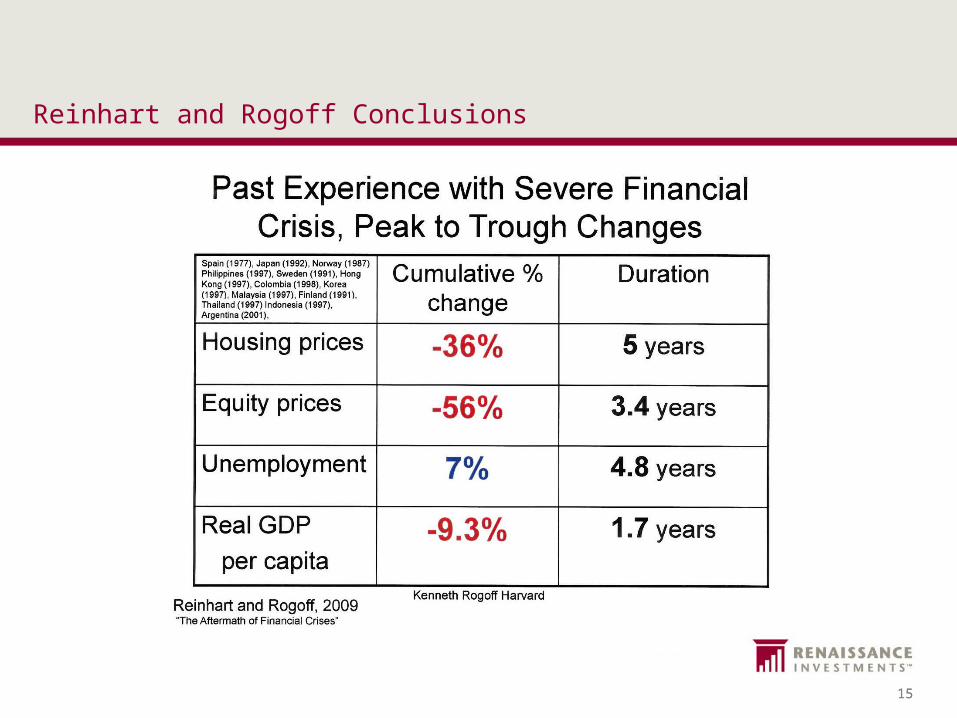
Reinhart and Rogoff Conclusions
16 16
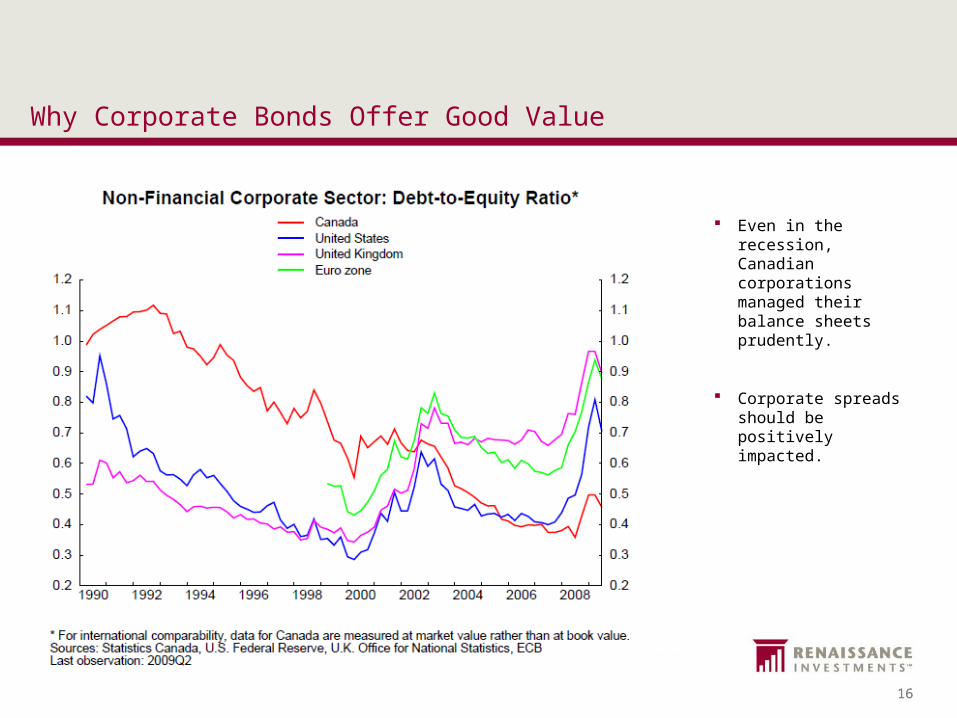
Even in the recession, Canadian corporations managed their balance sheets prudently.
Corporate spreads should be positively impacted.
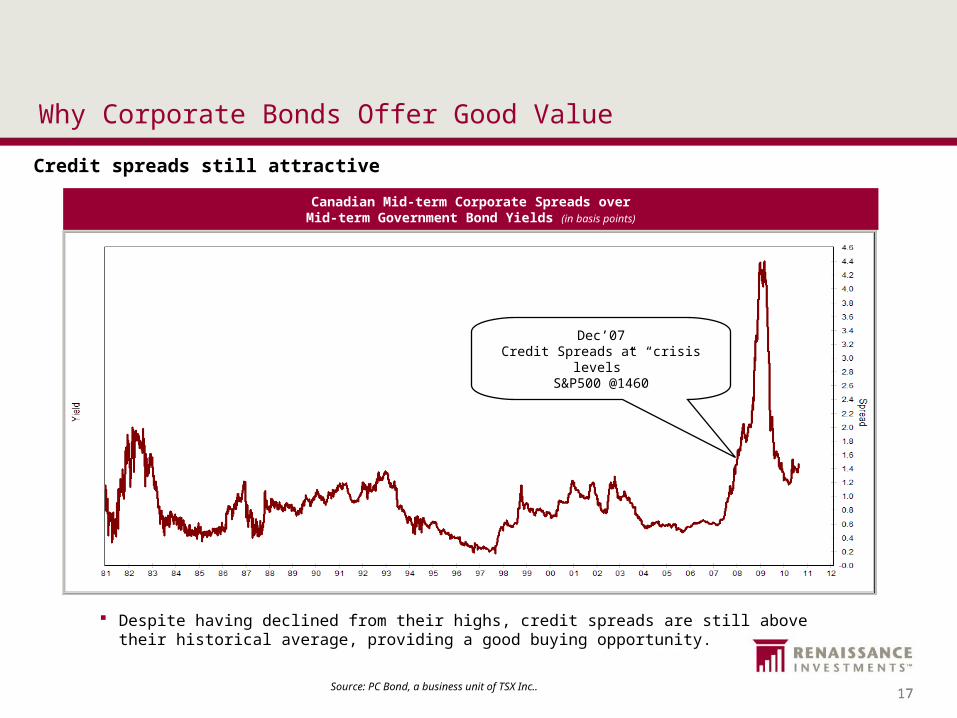
Why Corporate Bonds Offer Good Value
17 17
Why Corporate Bonds Offer Good Value
Dec’07Credit Spreads at “crisis levels”
S&P500 @1460
Canadian Mid-term Corporate Spreads overMid-term Government Bond Yields (in basis points)
Source: PC Bond, a business unit of TSX Inc..
Despite having declined from their highs, credit spreads are still above their historical average, providing a good buying opportunity.
Credit spreads still attractive
18 18
0
300
600
900
1,200
1,500
1,800
2,100
J ul-95 J ul-96 J ul-97 J ul-98 J ul-99 J ul-00 J ul-01 J ul-02 J ul-03 J ul-04 J ul-05 J ul-06 J ul-07 J ul-08 J ul-09 J ul-10
Year
Sp
read
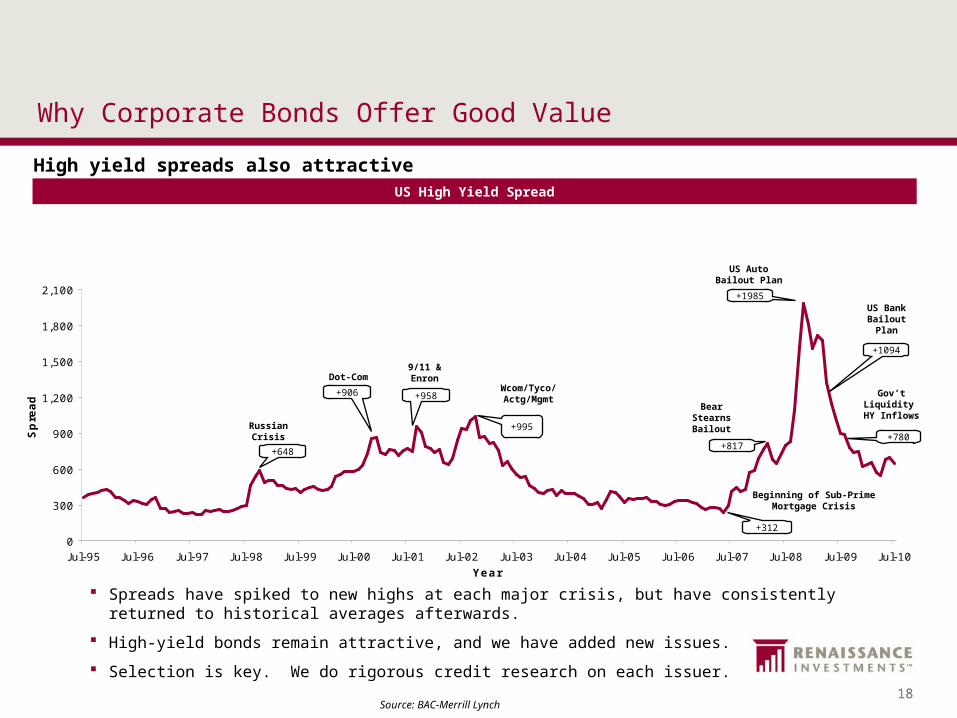
+648
+906
Dot-Com
+958
9/11 & Enron
+995
Wcom/Tyco/Actg/Mgmt
+312
Beginning of Sub-Prime Mortgage Crisis
+1094
US Bank Bailout
Plan
+817
RussianCrisis
Bear Stearns Bailout
US Auto Bailout Plan
+1985
+780
Gov’t Liquidity HY Inflows
Why Corporate Bonds Offer Good Value
US High Yield Spread
Source: BAC-Merrill Lynch
High yield spreads also attractive
Spreads have spiked to new highs at each major crisis, but have consistently returned to historical averages afterwards.
High-yield bonds remain attractive, and we have added new issues.
Selection is key. We do rigorous credit research on each issuer.

19 19
Why Corporate Bonds Offer Good Value
0%
4%
8%
12%
16%
20%
80 82 84 86 88 90 92 94 96 98 00 02 04 06 08 10
Cumulative Excess Returns
Cumulative Excess Returns of DEX Corporates vs DEX Canada Universe
Source: Datastream & CIBC Global Asset Management Inc. Calculations
Cumulative Excess Returns of DEX Corporatesvs. DEX Canada Universe
Over the long-run, corporate bonds have beat the DEX Canada Universe
Source: PC Bond, a business unit of TSX Inc..

20 20
Renaissance Corporate Bond Capital Yield Fund
A tax efficient way to gain exposure to corporate bonds
Who should invest?– Clients seeking tax efficient monthly distributions– Clients looking for Corporate Bond exposure– Clients looking to diversify their fixed income holdings
Product specifications– Manager: CGAM (Patrick O’Toole – Jeff Waldman)– Target 3% distribution
Benchmark Range
DEX Corporate Bond Universe Index (Investment Grade) 80%
BAC-ML US High Yield Cash Pay Index (100% hedged) 14%
10%-30%
BAC-ML Canadian High Yield index (100% hedged) 6%
21 21
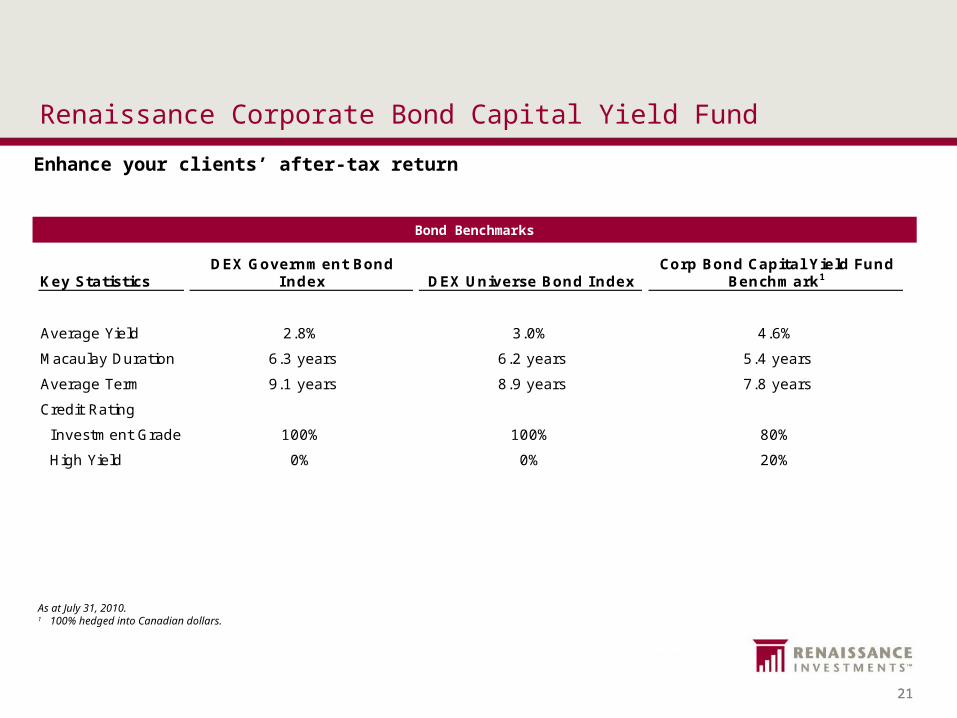
Renaissance Corporate Bond Capital Yield Fund
Bond Benchmarks
As at July 31, 2010.1 100% hedged into Canadian dollars.
Key Statistics DEX Government Bond
Index DEX Universe Bond Index Corp Bond Capital Yield Fund
Benchmark1
Average Yield 2.8% 3.0% 4.6%
Macaulay Duration 6.3 years 6.2 years 5.4 years
Average Term 9.1 years 8.9 years 7.8 years
Credit Rating
Investment Grade 100% 100% 80%
High Yield 0% 0% 20%
Enhance your clients’ after-tax return
22 22
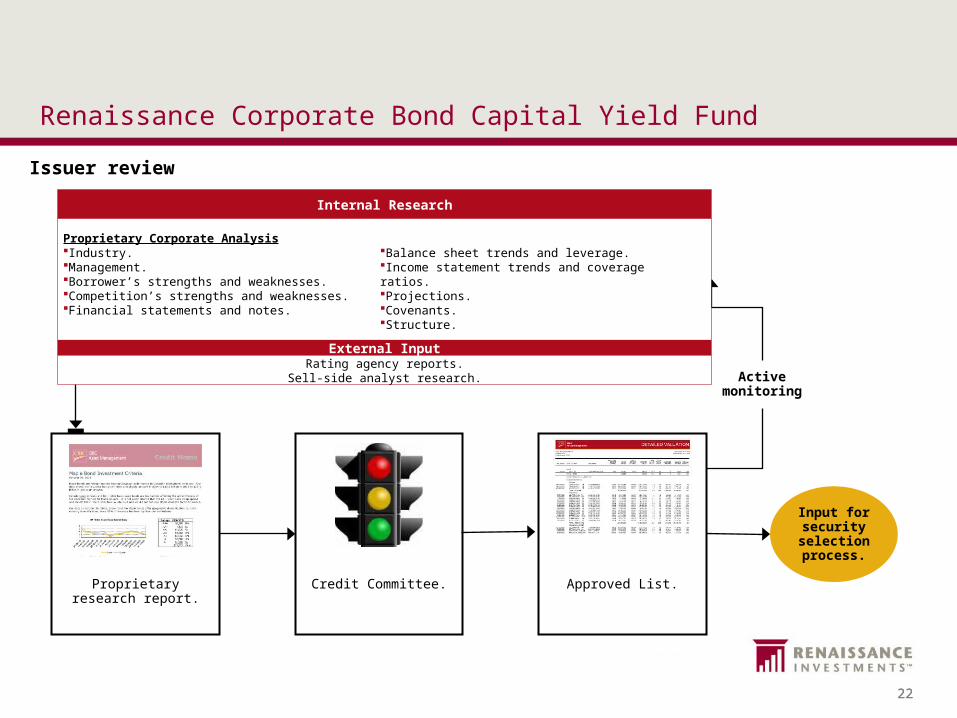
Active monitoring
Proprietary research report.
Input for security selection process.
Credit Committee. Approved List.
Renaissance Corporate Bond Capital Yield Fund
Issuer review
Internal Research
External InputRating agency reports.
Sell-side analyst research.
Proprietary Corporate AnalysisIndustry.Management.Borrower’s strengths and weaknesses.Competition’s strengths and weaknesses.Financial statements and notes.
Balance sheet trends and leverage.Income statement trends and coverage ratios.Projections.Covenants.Structure.
23 23
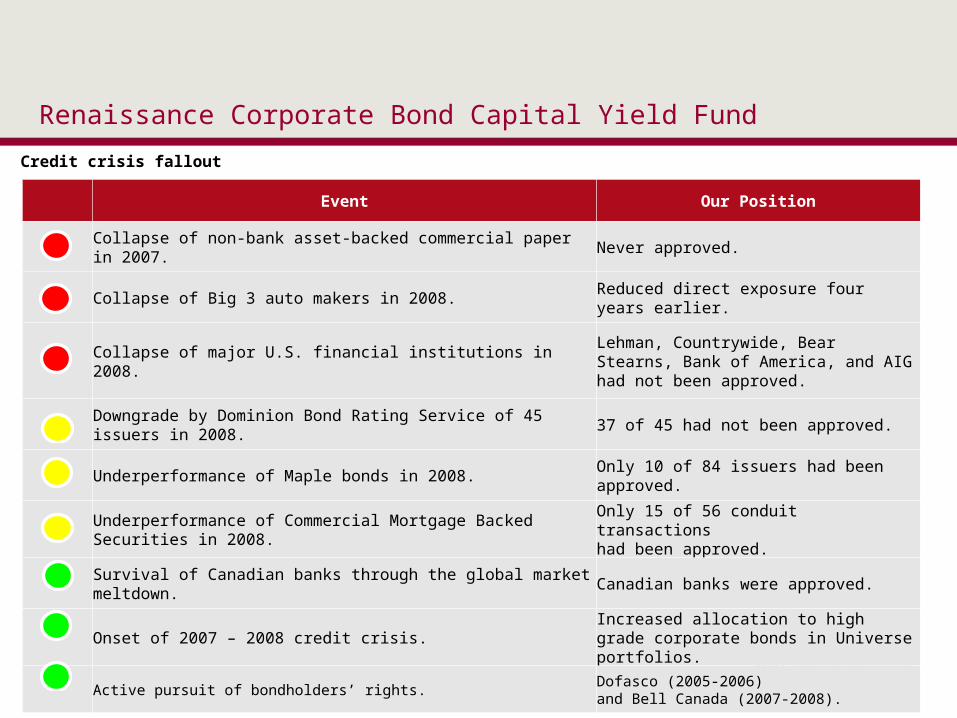
Renaissance Corporate Bond Capital Yield Fund
Credit crisis fallout
Event Our Position
Collapse of non-bank asset-backed commercial paper in 2007. Never approved.
Collapse of Big 3 auto makers in 2008.Reduced direct exposure four years earlier.
Collapse of major U.S. financial institutions in 2008.Lehman, Countrywide, Bear Stearns, Bank of America, and AIG had not been approved.
Downgrade by Dominion Bond Rating Service of 45 issuers in 2008.
37 of 45 had not been approved.
Underperformance of Maple bonds in 2008.Only 10 of 84 issuers had been approved.
Underperformance of Commercial Mortgage Backed Securities in 2008.
Only 15 of 56 conduit transactionshad been approved.
Survival of Canadian banks through the global market meltdown.
Canadian banks were approved.
Onset of 2007 – 2008 credit crisis.Increased allocation to high grade corporate bonds in Universe portfolios.
Active pursuit of bondholders’ rights.Dofasco (2005-2006)and Bell Canada (2007-2008).

24 24
Renaissance Corporate Bond Capital Yield Fund
Renaissance Corporate Bond Capital Yield Fund 4.3%
Benchmark 4.6%
Credit Mix - % Weight vs. Benchmark
-4
3
-1
7
-1
-14
10
-20 -15 -10 -5 0 5 10 15
CCC
B
BB
BBB
A
AA
AAA
Industry Mix - % Weight vs. Benchmark
5
1
-10
8
-2
-3
-3
4
-15 -10 -5 0 5 10
Sec'n
R/E
Infra
I nd'l
Fin'l
Energy
Comm'ns
Cash
As at July 31, 2010.Source: PC Bond, a business unit of TSX Inc. and CIBC Global Asset Management Inc.
25 25
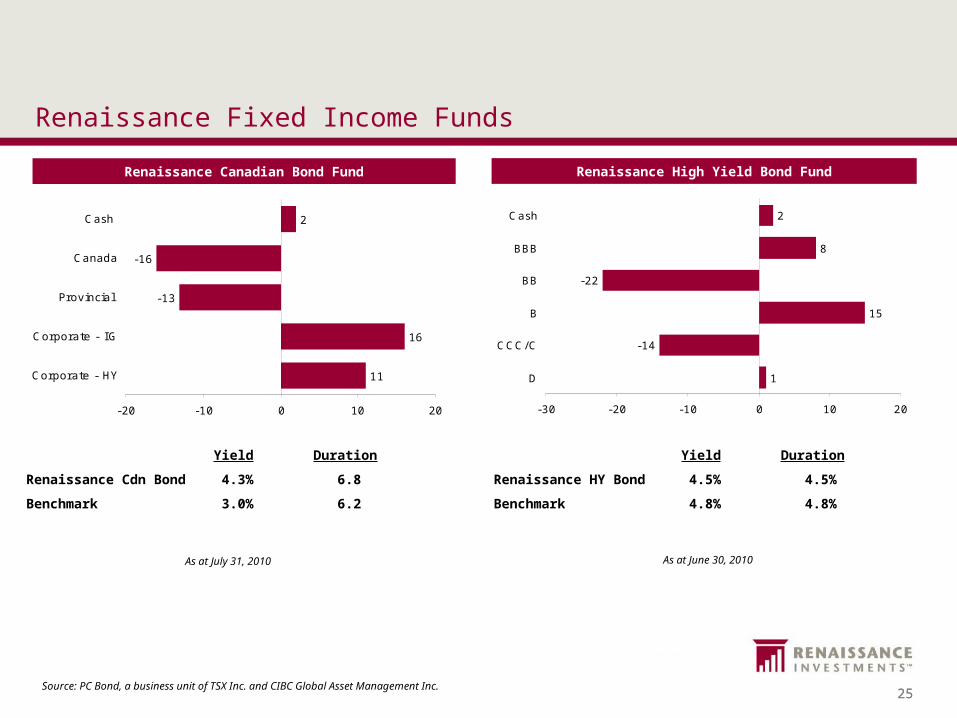
Renaissance Fixed Income Funds
Yield Duration
Renaissance Cdn Bond 4.3% 6.8
Benchmark 3.0% 6.2
Renaissance Canadian Bond Fund
11
16
-13
-16
2
-20 -10 0 10 20
Corporate - HY
Corporate - I G
Provincial
Canada
Cash
Renaissance High Yield Bond Fund
1
-14
15
-22
8
2
-30 -20 -10 0 10 20
D
CCC/C
B
BB
BBB
Cash
Yield Duration
Renaissance HY Bond 4.5% 4.5%
Benchmark 4.8% 4.8%
As at July 31, 2010 As at June 30, 2010
Source: PC Bond, a business unit of TSX Inc. and CIBC Global Asset Management Inc.
26 26
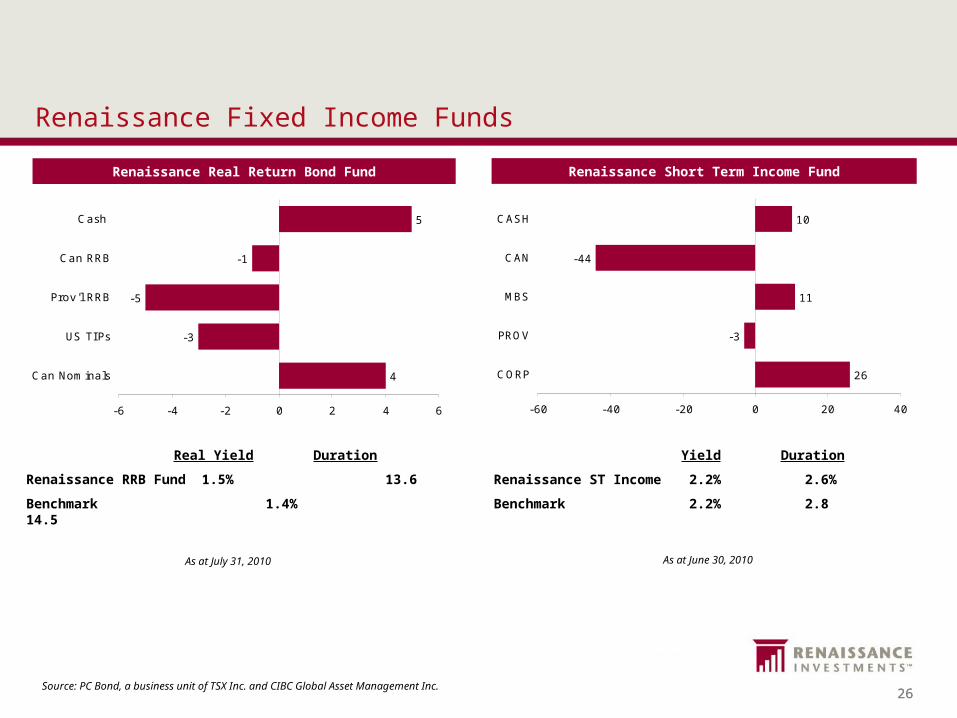
Real Yield Duration
Renaissance RRB Fund 1.5% 13.6
Benchmark 1.4% 14.5
Renaissance Real Return Bond Fund
4
-3
-5
-1
5
-6 -4 -2 0 2 4 6
Can Nominals
US TI Ps
Prov'l RRB
Can RRB
Cash
Renaissance Short Term Income Fund
26
-3
11
-44
10
-60 -40 -20 0 20 40
CORP
PROV
MBS
CAN
CASH
Yield Duration
Renaissance ST Income 2.2% 2.6%
Benchmark 2.2% 2.8
Renaissance Fixed Income Funds
As at July 31, 2010 As at June 30, 2010
Source: PC Bond, a business unit of TSX Inc. and CIBC Global Asset Management Inc.
27 27
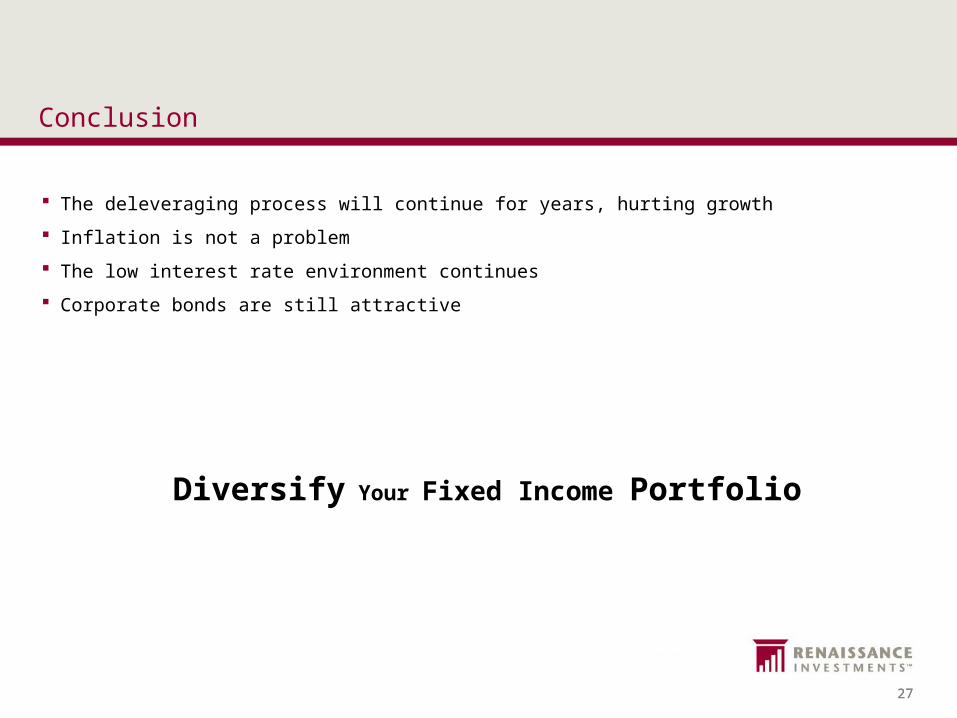
Conclusion
The deleveraging process will continue for years, hurting growth
Inflation is not a problem
The low interest rate environment continues
Corporate bonds are still attractive
Diversify Your Fixed Income Portfolio
28 28
Thank You
© 2010 CIBC Global Asset Management Inc. operates under the name of CIBC Asset Management in Canada and is a member of the CIBC Group of Companies. CIBC Asset Management is a Registered Trade-mark of CIBC / CIBC Global Asset Management Inc. licensee.
The user agrees that TSX Inc. and the parties from whom TSX Inc. obtains data do not have any liability for the accuracy or completeness of the data provided or for delays, interruptions or omissions therein or the results to be obtained through the use of this data. The user further agrees that neither TSX Inc. nor the parties from whom it obtains data make any representation, warranty or condition, either express or implied, as to the results to be obtained from the use of the data, or as to the merchantable quality or fitness of the data for a particular purpose.
PC-Bond, a business unit of TSX Inc. Copyright © TSX Inc. All rights reserved. The information contained herein may not be redistributed, sold or modified or used to create any derivative work without the prior written consent of TSX Inc.
APT® is a software solution that provides enhanced analytics, research, models and proprietary data to empower investment professionals to make strategic investment decisions.
This material was prepared for investment professionals only and is not for public distribution. It is for informational purposes only and is not intended to convey investment, legal, or tax advice. All information in this document is as of June 30, 2010 unless otherwise indicated, and is subject to change. The views expressed by the team(s) throughout this document may differ from the views of other teams within CIBC Global Asset Management Inc.The material and/or its contents may not be reproduced without the express written consent of CIBC Asset Management. ™ CIBC Asset Management is a registered trademark of Canadian Imperial Bank of Commerce. ™Renaissance Investments and "invest well. live better." are registered trademarks of CIBC Asset Management Inc.
29 29
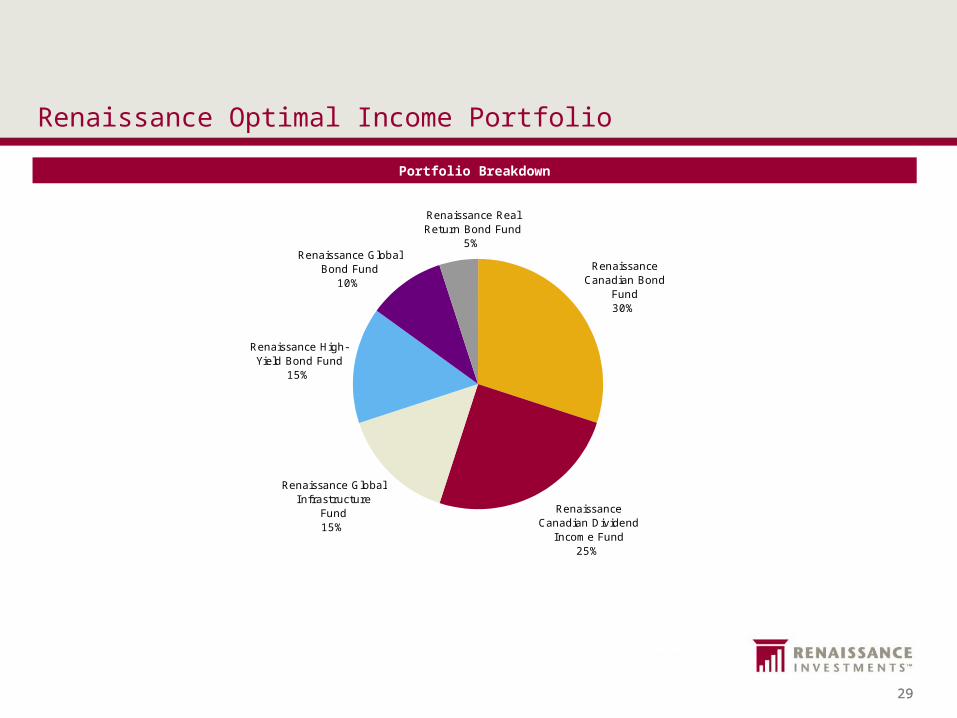
Renaissance Optimal Income Portfolio
Portfolio Breakdown
Renaissance Canadian Bond
Fund30%
Renaissance Canadian Dividend
Income Fund25%
Renaissance Global Infrastructure
Fund15%
Renaissance High-Yield Bond Fund
15%
Renaissance Real Return Bond Fund
5%Renaissance Global
Bond Fund10%
30 30
Renaissance Optimal Income Portfolio
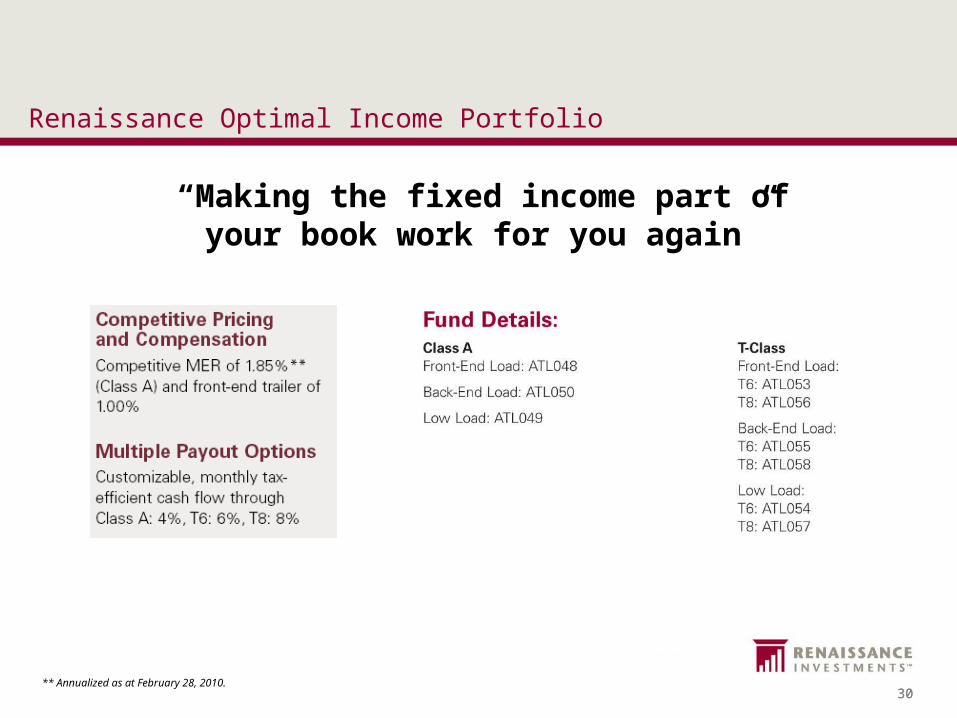
“Making the fixed income part of your book work for you again”
** Annualized as at February 28, 2010.
31 31
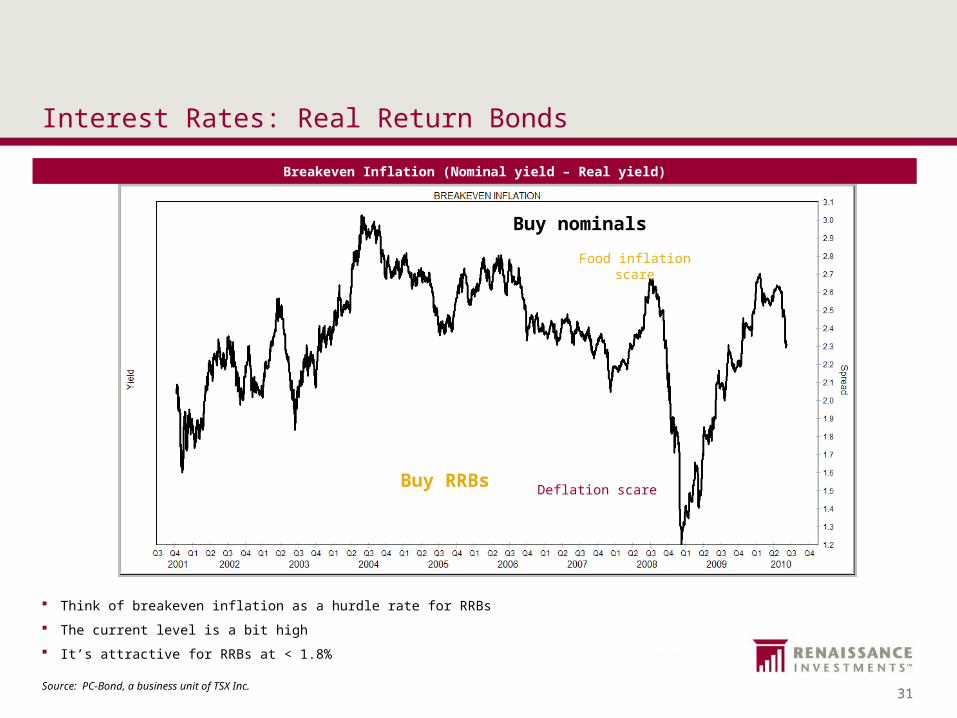
Think of breakeven inflation as a hurdle rate for RRBs
The current level is a bit high
It’s attractive for RRBs at < 1.8%
Food inflation scare
Deflation scare
Buy nominals
Buy RRBs
Interest Rates: Real Return Bonds
Source: PC-Bond, a business unit of TSX Inc.
Breakeven Inflation (Nominal yield – Real yield)

32 32
Questions &
Answers