Embed Size (px)
Citation preview

+
Senvion S.A., Luxembourg Interim Report as of March 31, 2017 January 1, 2017 – March 31, 2017

Senvion S.A., Interim Report March 31, 2017 2
2017/01/01- 2016/01/01-
2017/03/31 2016/03/31
k EUR k EUR
Revenues 392,262 364,295
EBITDA (before extraordinary items) 21,379 19,198
EBITDA (after extraordinary items) -11,399 19,198
Adjusted EBITDA 21,379 27,175
EBIT (before extraordinary items) -20,783 -20,275
EBIT (after extraordinary items) -53,561 -20,275
Adjusted EBIT 4,842 13,689
Net Result -49,348 -32,412
2017/03/31 2016/12/31
Order Book1 for WTG´s (m EUR) 2,899 3,040
Order Book for O&M services (m EUR) 2,345 2,265
Net working capital (m EUR) -5.4 -82.8
1 Order Book includes conditional orders and net firm orders.
Guidance 20171
Financial year 2017
Revenues (bn EUR) 2.0-2.1
Adjusted EBITDA ~8.0-8.5%
Guidance 2017confirmed
1 Potential delays in the conversion of the 300 MW Chile order beyond couple of months may lead to a partial (or full) shift of
revenues and corresponding EBITDA to 2018. The exact impact on financials can be ascertained once the order becomes firm.
Key Financials

Senvion S.A., Interim Report March 31, 2017 3
Key Highlights
Revenues increased by 7.7% to EUR 392.3m Implementation of program to secure competitiveness. Announced production footprint optimization with closing of three factories in Germany and net planned ~660 headcount reduction
Events after the reporting date: Sucessful refinancing of high yield bond leading to reduction in annual interest-costs by ca. EUR 14m Senvion wins major contract in the UK. 151 MW for three wind farms including 20 years operations and maintenance
Conditional contract signed for 300 MW in Australia First Irish contract for five MM82 (11 MW); first order from Czech Republic (26 MW) Framework contract signed in Portugal up to 216 MW valid until end of 2019; services for five years
(extension 20 years)

Senvion S.A., Interim Report March 31, 2017 4
Senvion is a leading global manufacturer of onshore and offshore wind turbines. The company develops,
produces and markets wind turbines for almost any location - with rated outputs of 2 MW to 6.15 MW and rotor
diameters of 82 meters to 152 meters. Furthermore, the company offers its customers project specific solutions in
the areas of turnkey, service and maintenance, transport and installation, as well as foundation planning and
construction. The systems are designed at the Senvion TechCenter in Osterrönfeld as well as in Bangalore, India.
Senvion manufactures at its German plants in Husum (North Friesland), Trampe (Brandenburg) and
Bremerhaven, as well as Portugal. With approximately 4,500 employees worldwide, the company makes use of
the experience gained from the manufacture and installation of more than 6,600 wind turbines around the world.
The company's operational subsidiary Senvion GmbH is based in Hamburg, Germany, and represented by
distribution partners, subsidiaries and participations in European markets such as France, Belgium, the
Netherlands, the UK, Italy, Romania, Portugal, Sweden, and Poland as well as on a global level in the USA,
China, Australia, Japan, India and Canada. Senvion S.A. is listed on the Prime Standard of the Frankfurt Stock
Exchange.
Introduction

Senvion S.A., Interim Report March 31, 2017 5
1 Performance 6
a. Consolidated Income Statement 6 b. Segment Reporting 8 c. Consolidated statements of financial position 9 d. Consolidated statement of cash flow 12 e. Key performance indicators 13
2 Consolidated financial statements as of March, 31 2017 15
a. Consolidated statement of financial position 15 b. Consolidated income statement 17 c. Consolidated statement of comprehensive income 18 d. Consolidated statement of cash flow 19 e. Consolidated statement of changes in shareholders´ equity 20 f. Information on Segment Reporting 21
3 Financial Calendar 23
4 Forward-Looking Statement 24
Contents

Senvion S.A., Interim Report March 31, 2017 6
2017/01/01- 2016/01/01-
m EUR 2017/03/31 2016/03/31 Comments
Revenue 392.3 364.3 In Q1 2017 revenues slightly over last year mainly driven by increased Offshore revenue.
EBITDA (before extraordinary items)
21.4 19.2 EBITDA is higher than Q1 2016 due to lower OPEX, driven by the Move Forward program.
EBITDA (after extraordinary items) -11.4 19,2
Includes reorganization expenses for
closing factories in Germany of EUR
32.8m in Q1 2017 (provision as of March
31, 2017: EUR 28.8 m).
Adjusted EBITDA 21.4 27.2 Decrease of adjusted EBITDA due to
lower FX income.
EBIT (before extraordinary items) -20.8 -20.3
EBIT before extraordinaries on similar level, following the trend at EBITDA level.
EBIT (after extraordinary items) -53.6 -20.3
Includes reorganization expenses for
closing factories in Germany of EUR
32.8m in Q1 2017.
Adjusted EBIT 4.8 13.7 Adjusted EBIT in Q1 2017 lower than in 2016 driven by lower FX income and higher depreciation & amortization.
Net result -49.3 -32.4
Net result in Q1 2017 lower than last year´s quarter mainly due to reorganization expenses in Q1 2017 whereas Q1 2016 was impacted by transactions costs and higher PPA effects.
1 Performance
a. Consolidated Income Statement

Senvion S.A., Interim Report March 31, 2017 7
Revenues by segment and by geograhies
2017/01/01- 2016/01/01-
m EUR 2017/03/31 2016/03/31 Comments
Revenues from sale of onshore wind turbines
227.3 262.4 Onshore revenues declined in Q1 2017 compared to Q1 2016 mainly due to lower revenues in the Portugal market.
Europe 211.7 240.4 Decline mainly relates to Portugal but was partially compensated by increase of sales in UK and Italy.
Americas 9.8 21.6 The revenues decline in Q1 2017 compared to Q1 2016 due to less installations of turbines in Canada.
Asia-Pacific 5.8 0.4 In Q1 2017 we installed and commissioned more turbines in APAC than in Q1 2016.
Revenues from sale of offshore wind turbines
90.6 28.5 In Q1 2017 we started with the installation of Nordsee One, this had a positive impact on the revenues.
Services 72.6 72.6
Other 1.8 0.8
Revenues 392.3 364.3 Total revenues in Q1 2017 slightly over last year due to higher Offshore revenues.

Senvion S.A., Interim Report March 31, 2017 8
b. Segment Reporting
Segment Reporting for the first quarter of financial year 2017
Segments 2017/01/01-2017/03/31 m EUR
Onshore Offshore Services and Maintanance
Segments total Reconciliation
Group financials
Revenue 227.3 90.6 84.8 402.7 -10.4 392.3
Cost of materials/ Cost of purchased Services
-169.4 -68.8 -29.1 -267.3
Personnel expenses -5.9 -2.4 -15.4 -23.7
Other operating expenses -6.4 -2.6 -5.0 -14.0
Contribution Margin I 45.6 16.8 35.3 97.7
Segment Reporting for the first quarter of financial year 2016
Segments 2016/01/01-2016/03/31 m EUR
Onshore Offshore Services and Maintanance
Segments total Reconciliation
Group financials
Revenue 262.4 28.5 89.0 379.9 -15.6 364.3
Cost of materials/Cost of purchased Services
-181.5 -19.7 -27.8 -229.0
Personnel expenses -3.9 -0.4 -13.1 -17.4
Other operating expenses -7.9 -0.9 -4.5 -13.3
Contribution Margin I 69.1 7.5 43.6 120.2
Comments:
Segmental results show strong impact of onshore business, which contributes almost 50% to Group
contribution margin I. The contribution margin 1 (CM 1) of onshore wind turbines slightly decreased from
26.3 % to 20.1% due to a change in product mix.
Offshore revenues mainly relate to the projects Nordergründe and Nordsee One. The increase in total
CM1 relates to the installation of the project Nordsee One. The decrease in contribution margin from
26.3% in Q1 2016 to 18.5% in Q1 2017 mainly relates to a positive impact from a settlement agreement
in Q1 2016.
The CM1 of the service business decreased from 49.0% in Q1 2016 to 41.6% in Q1 2017 mainly due to the change in allocation of service provision to the service segment from unallocated expenses. Without that allocation the CM1 of the service business would be at 46.2%.
Senvion S.A., Interim Report March 31, 2017 9
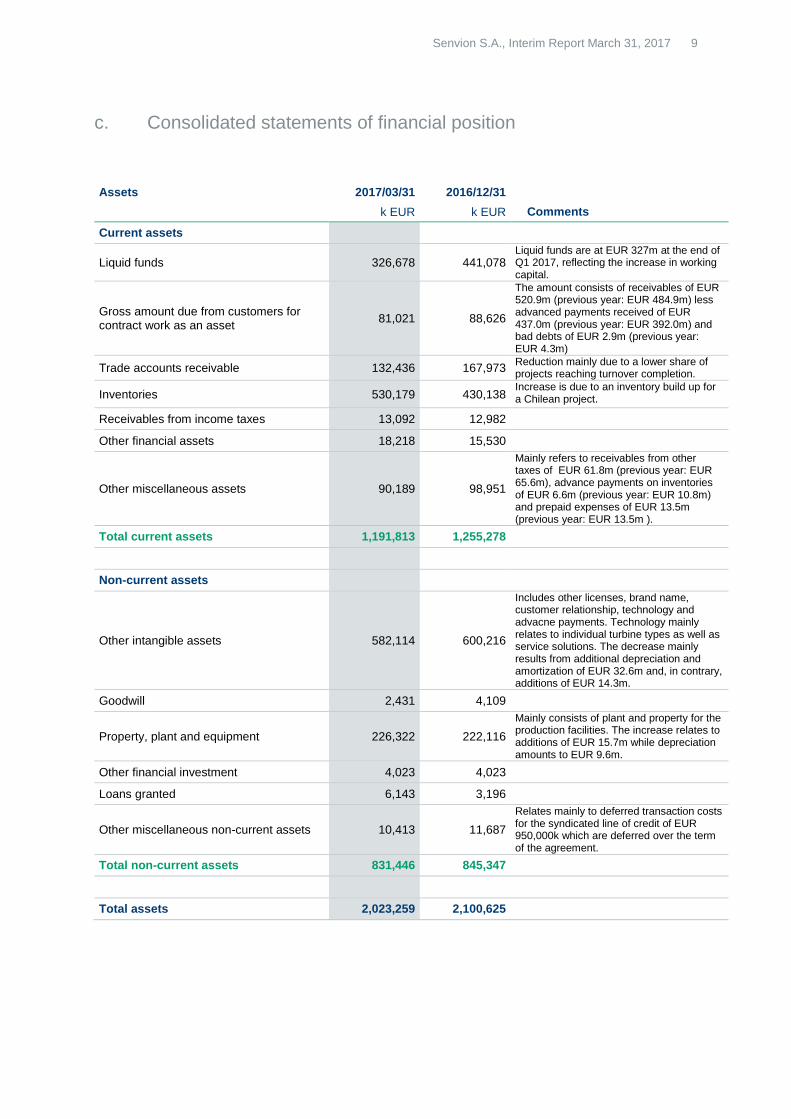
c. Consolidated statements of financial position
Assets 2017/03/31 2016/12/31
k EUR k EUR Comments
Current assets
Liquid funds 326,678 441,078 Liquid funds are at EUR 327m at the end of Q1 2017, reflecting the increase in working capital.
Gross amount due from customers for contract work as an asset
81,021 88,626
The amount consists of receivables of EUR 520.9m (previous year: EUR 484.9m) less advanced payments received of EUR 437.0m (previous year: EUR 392.0m) and bad debts of EUR 2.9m (previous year: EUR 4.3m)
Trade accounts receivable 132,436 167,973 Reduction mainly due to a lower share of projects reaching turnover completion.
Inventories 530,179 430,138 Increase is due to an inventory build up for a Chilean project.
Receivables from income taxes 13,092 12,982
Other financial assets 18,218 15,530
Other miscellaneous assets 90,189 98,951
Mainly refers to receivables from other taxes of EUR 61.8m (previous year: EUR 65.6m), advance payments on inventories of EUR 6.6m (previous year: EUR 10.8m) and prepaid expenses of EUR 13.5m (previous year: EUR 13.5m ).
Total current assets 1,191,813 1,255,278
Non-current assets
Other intangible assets 582,114 600,216
Includes other licenses, brand name, customer relationship, technology and advacne payments. Technology mainly relates to individual turbine types as well as service solutions. The decrease mainly results from additional depreciation and amortization of EUR 32.6m and, in contrary, additions of EUR 14.3m.
Goodwill 2,431 4,109
Property, plant and equipment 226,322 222,116
Mainly consists of plant and property for the production facilities. The increase relates to additions of EUR 15.7m while depreciation amounts to EUR 9.6m.
Other financial investment 4,023 4,023
Loans granted 6,143 3,196
Other miscellaneous non-current assets 10,413 11,687
Relates mainly to deferred transaction costs for the syndicated line of credit of EUR 950,000k which are deferred over the term of the agreement.
Total non-current assets 831,446 845,347
Total assets 2,023,259 2,100,625

Senvion S.A., Interim Report March 31, 2017 10
Shareholder equity and liability 2017/03/31 2016/12/31
k EUR k EUR Comments
Current liabilities
Short-term loans and current portion of long-term loans
7,010 7,566
Trade accounts payable 404,045 430,966 The reduction in trade accounts payable is due to normal fluctuations.
Advance payments received 186,824 189,242
Advance payments from customers for orders for which no production work has been carried out are reported as advance payments received. These remained on the same level as at year end.
Gross amounts due to customers for contract work as a liability
125,961 122,248
The amount consists of receivables of EUR 459.4m (previous year: EUR 385.1m) less advanced payments received of EUR 585.3m (previous year: EUR 507.3m).
Provisions 314,025 289,270
The increase in provisions is mainly due to provisions for reorganization of EUR 28.8m. On March 13, 2017 the Group decided to start a program to secure its long-term competitiveness. Amongst others the planned measures will lead to a reduction of jobs mainly at Senvion’s production sites in Husum, Trampe and Bremerhaven in Germany and an addition of jobs in low cost locations; leading to a net planned 660 jobs reductions. The provision for reorganization mainly includes employee termination benefits of EUR 21.9m, repayments of goverment grants of EUR 6.0m and legal and consulting costs of EUR 0.9m. Furthermore provisions refer to specific warranty provisions of EUR 226.1m (previous year: EUR 230.9m); general warranty provisions of EUR 24.6m (previous year: EUR 28.1m) and other provisions of EUR 34.5m (previous year: EUR 30.3m).
Deferred income 48,143 34,983
Deferred income essentially relates to service income paid in advance. Deferred income is reversed in profit and loss on a straight-line basis over the term of the service rendered. Increase relates to the commen settlement periods.
Income tax liabilities 34,479 37,447
Other financial liabilities 43,533 41,832
Mainly consists of liabilities to employees EUR 32.0m (previous year: EUR 29.6m) and deferred interests on high yield bond of EUR 9.9m (previous year: EUR 3.3m)
Other miscellaneous liabilities 27,544 40,329
Mainly relates to liabilities from other taxes of EUR 20.1m (previous year: EUR 30.2m) and social security liabilities of EUR 1.4m (previous year: EUR 1.7m)
Total current liabilities 1,191,564 1,193,883

Senvion S.A., Interim Report March 31, 2017 11
Non-current liabilities
Long-term loans 5,189 6,980
Deferred taxes 155,042 173,053
The decrease of deferred tax liabilities is mainly related to an increase of deferred tax assets for loss carryforwards (EUR 22.2m).
Other non-current financial liabilities 393,314 392,919
Consists of book value of high yield bond with a nominal value EUR 400m and a fixed (nominal) interest rate of 6.625%. Due to the sucessfull refinancing in April 2017 the current high yield bond will be replaced by a new high yield bond on May 5, 2017, with a nominal value of EUR 400m, fixed (nominal) interest rate of 3.875 % and a term ending October 2022.
Total non-current liabilities 553,545 572,952
Equity
Subscribed capital 642 645 The decrease in subscribed and additional paid-in capital of EUR 3,742k mainly result from the acquisition of 317,838 treasury shares in Q1 2017.
Additional paid-in capital 499,380 503,119
Other reserves -5,714 -3,164
Retained earnings -216,158 -166,810
Equity attributable to shareholders of the parent company
278,150 333,790
Total equity 278,150 333,790
Total equity and liabilities 2,023,259 2,100,625

Senvion S.A., Interim Report March 31, 2017 12
d. Consolidated statement of cash flow
m EUR
2017/01/01- 2016/01/01- Comments
2017/03/31 2016/03/31
Cash and cash equivalents at the beginning of the period
433.5 413.4
Cash flow from operating activities -79.2 40.7
The negative cashflow is due a change in working capital of EUR -86,2m, with the main contributors being the increase of inventories and the decrease of trade liabilities partly compensated by the decrease of trade receivables.
Cash flow from investing activities -29.5 -18.7
Driven by higher investments in technical equipment (+ EUR 6.5m) and increased capitalisation of development costs (+ EUR 2.2m)
Cash flow from financing activities -5.1 -1.7
Mainly includes payments for the acquisition of treasury shares of EUR 3.7m (previous year: EUR 0m) and repayments of amounts borrowed of EUR 1.4m (previous year: 1.7m EUR).
Increase/decrease in cash and cash equivalents
-113.8 20.3
Cash and cash equivalents at the end of the period
319.7 433.7

Senvion S.A., Interim Report March 31, 2017 13
e. Key performance indicators
Order book and Order Intake
Order book für WTGs m EUR
2017/03/31 2016/12/31 Comments
Order book for WTGs 2,899 3,039
Conditional orders (1)
1,580 1,765
Conditional orders decreased mainly due to conversion into net firm orders for projects in the UK and Czech. In addition lower conditional orders in Q1 2017 driven by Germany (new auction model from May 2017 on).
Net firm orders (2)
1,319 1,274 Net firm orders increased due to conversion of signed contracts into net firm order.
Net firm orders for WTGs by geography
Germany 356 306 Increase due to conversion into net firm orders for german projects with BlmSchG in Q4 2016.
United Kingdom 265 221 Increase due to conversion of signed contracts into net firm oders.
Canada 12 19 Decline due to realization of projects.
France 148 166 Decline due to realization of projects.
Portugal 5 14
Offshore 274 365 Offhore net firm orders are impacted by project progress on Nordergründe and Nordsee One project.
Rest of the world 259 183 Increase in Rest of the World due to order intake in Czech, Ireland and Austria.
Order book for O&M services 2,345 2,265
(1) Conditional orders is defined as Senvion Group´s orders received from WTGs from customers as of a specific date by means of a formal binding agreement that is subject to conditions precedent or is otherwise not fully effective.
(2) Net firm orders is defined as Senvion Group´s firm orders received from WTGs from customers by means of a formal binding agreement after all conditions precedent have been fulfilled as of a defined date, less any revenues already realized under the percentage of completion method.

Senvion S.A., Interim Report March 31, 2017 14
Net Working Capital: Total current assets (adjusted for liquid funds) minus total current liabilities
(adjusted for short-term loans and current portion of long-term loans and provisions)
m EUR
2017/03/31 2016/12/31 Comments
Total current assets 1,191.8 1,255.3
Net working capital increased in Q1 2017 due to inventory build up for a Chilean project.
Adjustment to total current assets -326.7 -441.1
Thereof:
Liquid funds -326.7 -441.1
Total current liabilities -1,191.5 -1,193.9
Adjustment to total current liabilities 321.0 296.9
Thereof:
Short-Term loans and current portion of long-term loans
7.0 7.6
Provisions 314.0 289.3
Net working capital -5.4 -82.8
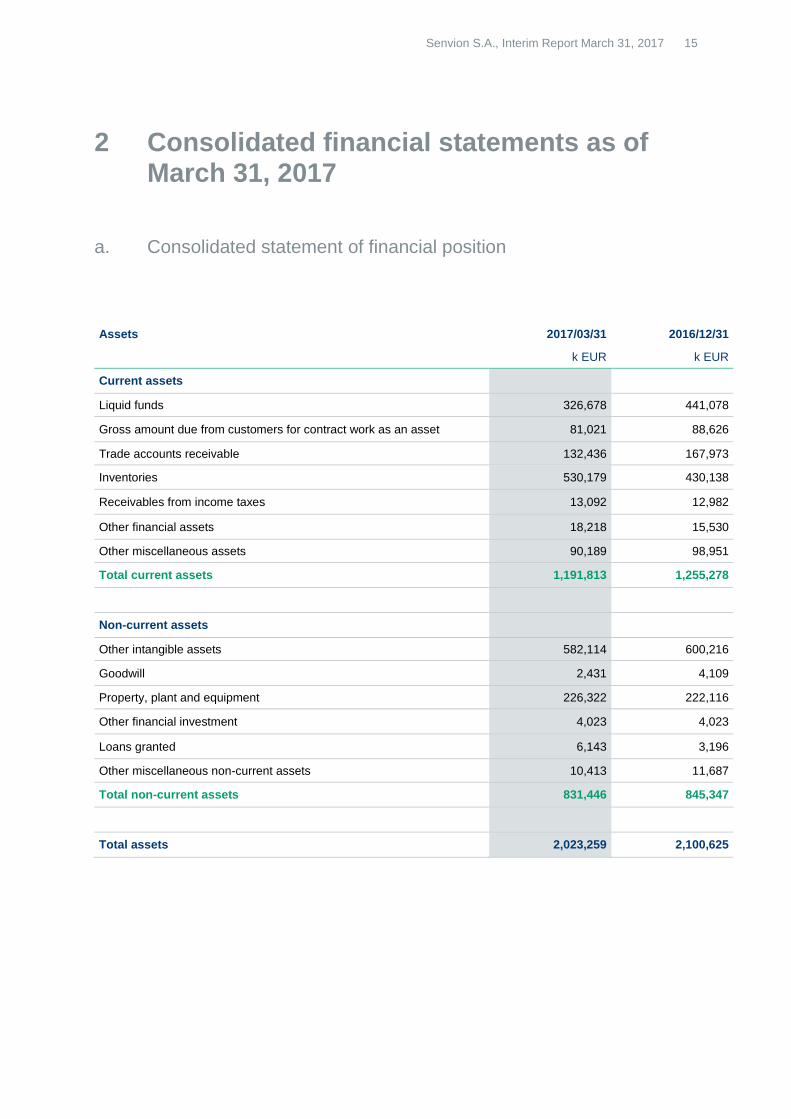
Senvion S.A., Interim Report March 31, 2017 15
Assets 2017/03/31 2016/12/31
k EUR k EUR
Current assets
Liquid funds 326,678 441,078
Gross amount due from customers for contract work as an asset 81,021 88,626
Trade accounts receivable 132,436 167,973
Inventories 530,179 430,138
Receivables from income taxes 13,092 12,982
Other financial assets 18,218 15,530
Other miscellaneous assets 90,189 98,951
Total current assets 1,191,813 1,255,278
Non-current assets
Other intangible assets 582,114 600,216
Goodwill 2,431 4,109
Property, plant and equipment 226,322 222,116
Other financial investment 4,023 4,023
Loans granted 6,143 3,196
Other miscellaneous non-current assets 10,413 11,687
Total non-current assets 831,446 845,347
Total assets 2,023,259 2,100,625
2 Consolidated financial statements as of March 31, 2017
a. Consolidated statement of financial position

Senvion S.A., Interim Report March 31, 2017 16
Shareholder equity and liability 2017/03/31 2016/12/31
k EUR k EUR
Current liabilities
Short-term loans and current portion of long-term loans 7,010 7,566
Trade accounts payable 404,045 430,966
Advance payments received 186,824 189,242
Gross amounts due to customers for contract work as a liability 125,961 122,248
Provisions 314,025 289,270
Deferred income 48,143 34,983
Income tax liabilities 34,479 37,447
Other financial liabilities 43,533 41,832
Other miscellaneous liabilities 27,544 40,329
Total current liabilities 1,191,564 1,193,883
Non-current liabilities
Long-term loans 5,189 6,980
Deferred taxes 155,042 173,053
Other non-current financial liabilities 393,314 392,919
Total non-current liabilities 553,545 572,952
Equity
Subscribed capital 642 645
Additional paid-in capital 499,380 503,119
Other reserves -5,714 -3,164
Currency translation -6,369 -5,430
Cash flow hedging reserve 655 2,266
Retained earnings -216,158 -166,810
Equity attributable to shareholders of the parent company
278,150 333,790
Non-controlling interests
Total equity 278,150 333,790
Total equity and liabilities 2,023,259 2,100,625

Senvion S.A., Interim Report March 31, 2017 17
2017/01/01- 2016/01/01-
2017/03/31 2016/03/31
k EUR k EUR
Revenues 392,262 364,295
Changes in work in progress 109,545 97,646
Work performed by the entity and capitalized 12,992 10,566
Total performance 514,799 472,507
Other operating income 13,399 17,577
Cost of materials/cost of purchased services -391,404 -352,226
Personnel expenses -71,002 -61,552
Depreciation of property, plant and equipment and amortization of intangible assets
-42,162 -39,473
Other operating expenses -44,413 -57,108
Result from operating activities before reorganization expense
-20,783 -20,275
Reorganization expenses -32,778 0
Result from operating activities -53,561 -20,275
Interest and similar financial income 644 554
Interest and similar financial expenses -12,212 -22,602
Result before income taxes -65,129 -42,323
Income tax expense 15,781 9,911
Net result for the period -49,348 -32,412
Share of net result for the period attributable to non-controlling interests 0 -1,040
Share of net result for the period attributable to shareholders of the parent
-49,348 -31,372
Weighted average number of shares outstanding1 64,300,615 63,084,165
Earnings per share(basic/diluted) - in EUR per share -0.77 -0.51
1The calculation has been adjusted retrospectively to reflect increase of share capital from additional paid in capital.
b. Consolidated income statement

Senvion S.A., Interim Report March 31, 2017 18
2017/01/01- 2016/01/01-
2017/03/31 2016/03/31
k EUR k EUR
Net result for the period -49,348 -32,412
Other comprehensive income to be reclassified to profit or loss in subsequent periods (net of tax)
Cash flow hedges -1,611 474
Currency translation -939 -120
Other comprehensive income -2,549 354
Total comprehensive income -51,898 -32,058
Share of total comprehensive income for the period attributable to non-controlling interests
0 -1,026
Share of total comprehensive income for the period attributable to shareholders of the parent company
-51,898 -31,032
c. Consolidated statement of other comprehensive income

Senvion S.A., Interim Report March 31, 2017 19
2017/01/01- 2016/01/01-
2017/03/31 2016/03/31
k EUR k EUR
Cash flow from operating activities
Result before income taxes -65,129 -42,323
Adjustments for:
Depreciation on property, plant and equipment, amortization of intangible assets 42,162 39,473
Interest income -644 -554
Interest expenses 12,212 22,602
Increase/decrease in provisions 24,755 4,865
Profit/loss from sales of property, plant and equipment, intangible and other long-term assets -2 5
Change in working capital -86,213 22,147
Interest received 643 554
Interest paid -3,908 -4,503
Income tax paid -3,049 -1,526
Cash flow from operating activities -79,173 40,740
Cash flow from investing activities
Cash receipts from the sale of property, plant and equipment, intangible and other long-term assets 3,462 2,011
Cash payments for the purchase of intangible assets -14,283 -10,913
Cash payments from purchase of property, plant and equipment and other long-term assets -18,712 -9,826
Cash flow from investing activities -29,533 -18,728
Cash flow from financing activities
Acquisition of treasury shares -3,743 0
Cash repayments of amounts borrowed -1,395 -1,662
Cash flow from financing activities -5,138 -1,662
Increase/decrease in cash and cash equivalents -113,844 20,350
Cash and cash equivalents at the beginning of the period 433,512 413,419
Cash and cash equivalents at the end of the period 319,668 433,769
Liquid funds 326,678 439,411
Short-term bank liabilities -7,010 -5,642
Cash and cash equivalents at the end of the period 319,668 433,769
d. Consolidated statement of cash flow

Senvion S.A., Interim Report March 31, 2017 20
k EUR Subscribed
capital
Additional paid-in capital
Currency translation
Cash flow hedging reserve
Retained earnings
Equity attributable to shareholders of the parent
company
Non-controlling
interests Total
equity
Balance at 2016/01/01 78 26,510 -240 6,740 -102,616 -69,528 171 -69,357
Net result for the period -31,372 -31,372 -1,040 -32,412
Cash flow hedges 474 474 474
Currency translation -135 -135 15 -120
Comprehensive Income 0 0 -135 474 -31,372 -31,033 -1,025 -32,058
Capital increase 572 483,687 484,259 855 485,114
Balance at 2016/03/31 650 510,197 -375 7,214 -133,988 383,698 0 383,698
Balance at 2017/01/01 645 503,120 -5,430 2,266 -166,810 333,790 0 333,790
Net result for the period -49,348 -49,348 -49,348
Cash flow hedges -1,611 -1,611 -1,611
Currency translation -939 -939 -939
Comprehensive Income 0 0 -939 -1,611 -49,348 -51,898 0 -51,898
Aquisition of treasury shares
-3 -3,740 -3,743 -3,743
Balance at 2017/03/31 642 499,380 -6,369 655 -216,158 278,150 0 278,150
e. Consolidated statement of changes in shareholders´ equity

Senvion S.A., Interim Report March 31, 2017 21
Segments 2017/03/31 - 2017/01/01 Onshore Offshore
Service and Maintenance
Segments total Reconciliation
Senvion S.A. IFRS group
financials
m EUR 2017/01/01- 2017/03/31
2017/01/01- 2017/03/31
2017/01/01- 2017/03/31
Revenues 227.3 90.6 84.8 402.7 -10.4 392.3
> thereof external revenues 227.3 90.6 72.6 390.5 1.8
> thereof intersegment revenues 12.2 12.2 -12.2
Cost of materials/cost of purchased service
-169.4 -68.8 -29.1 -267.3
Personnel expenses -5.9 -2.4 -15.4 -23.7
Other operating expenses -6.4 -2.6 -5.0 -14.0
Contribution Margin I 45.6 16.8 35.3 97.7
Intersegment elemination and unallocated revenues
-10.4
Unallocated Changes in work in progress & cost of materials/cost of purchased services
-14.5
Work performed by the entity and capitalized
13.0
Other operating income 13.4
Unallocated personnel expenses -47.3
Unallocated other operating expenses
-30.5
Adjusted EBITDA 21.4
Depreciation and amortization -16.6
Adjusted EBIT 4.8
Reorganization expenses -32.8
Effects from purchase price allocation -25.6
Result from operating activities (EBIT) -53.6 -53.6
Interest result -11.5
Result before income taxes (EBT) -65.1 -65.1
f. Information on Segment Reporting

Senvion S.A., Interim Report March 31, 2017 22
Segments 2016/03/31 - 2016/01/01 Onshore Offshore
Service and Maintenance
Segments total Reconciliation
Senvion S.A. IFRS group
financials
m EUR 2016/01/01- 2016/03/31
2016/01/01- 2016/03/31
2016/01/01- 2016/03/31
Revenues 262.4 28.5 89.0 379.9 -15.6 364.3
Cost of materials/cost of purchased service
-181.5 -19.7 -27.8 -229.0
Personnel expenses -3.9 -0.4 -13.1 -17.4
Other operating expenses -7.9 -0.9 -4.5 -13.3
Contribution Margin I 69.1 7.5 43.6 120.2
Intersegment elemination and unallocated revenues
-15.6
Unallocated Changes in work in progress & cost of materials/cost of purchased services
-24.2
Work performed by the entity and capitalized
10.6
Other operating income 17.6
Unallocated personnel expenses -44.1
Unallocated other operating expenses
-37.3
Adjusted EBITDA 27.2
Depreciation and amortization -13.5
Adjusted EBIT 13.7
Aquisition related and other transaction costs
0.0
IPO costs -6.5
Specific provision related to 6XM WTG series
0.0
Effects from purchase price allocation
-27.5
Result from operating activities (EBIT) -20.3 -20.3
Interest result -22.0
Result before income taxes (EBT) -42.3 -42.3

Senvion S.A., Interim Report March 31, 2017 23
Annual General Meeting
May 31, 2017
Luxembourg Congrès, Luxembourg
May 31, 2017
Q2 2017 results August 11, 2017
Q3 2017 results November 10, 2017
3 Financial Calendar

Senvion S.A., Interim Report March 31, 2017 24
This presentation may contain forward-looking statements that are subject to risks and uncertainties, including those pertaining to the anticipated benefits to be realized from the proposals described herein. Forward-looking statements may include, in particular, statements about future events, future financial performance, plans, strategies, expectations, prospects, competitive environment, regulation and supply and demand. Senvion S.A. has based these forward-looking statements on its views and assumptions with respect to future events and financial performance. Actual financial performance could differ materially from that projected in the forward-looking statements due to the inherent uncertainty of estimates, forecasts and projections, and financial performance maybe better or worse than anticipated. Given these uncertainties, readers should not put undue reliance on any forward-looking statements. The information contained in this presentation is subject to change without notice and Senvion S.A. does not undertake any duty to update the forward-looking statements, and the estimates and assumptions associated with them, except to the extent required by applicable laws and regulations. Due to rounding, numbers presented through out this and other documents may not add up precisely to the totals provided and percentages may not precisely reflect the absolute figures.
4 Forward-Looking Statement
Senvion S.A., Interim Report March 31, 2017 25
Investor Relations Contacts
Dhaval Vakil
VP Capital Markets and M&A +44 20 7034 7992 [email protected] Anja Siehler
Sr. Manager Capital Markets +352 26 00 5285 [email protected] Julia Stargardt
Manager Capital Markets +49 40 5555 090 3517
Senvion S.A.
46a, Avenue John F. Kennedy
L-1855 Luxembourg
Grand Duchy of Luxembourg
T + 352 2600 5285
F + 352 2600 5301
www.senvion.com
Legal reference
This Financial Report for the first three month of fiscal year 2017 contains statements oriented to
future developments which are based on our current assumptions and prognoses. As a result of
known as well as unknown risks, uncertainty and influences, the actual results, financial situation or
development may deviate from the assumptions presented in this document. We shall not assume
any obligation to update any statements tuned to future developments.
For our international contacts, please visit:
www.senvion.com