Embed Size (px)
Citation preview

S E N S O R Y A N D PREPARATORY F A C T O R S I N R E S P O N S E L A T E N C Y
I . The visual intensity function
VIDKUNN COUCHERON THRANE
Forsvarets psykologiske avdeling, Norwegian Armed Forces, Oslo, Norway
THRANE, V. C. Sensory and preparatory factors in response latency. I. The visual intensity function. Scund. J . Psychol., Z, 82-96.-Simple reaction times under irregular order of stimulus presentation are studied as a function of three luminous intensities viewed foveally and covering five log I units at the upper half of the brightness scale. Response latency varies inversely and rectilinearly with log I within this range. Respondents tend to converge in average latency but differ more in variability as stimulus strength is reduced, the more variable subjects even at high intensity suffering relatively greater loss in speed. Both positive and negative practice effects are observed, which seem partly dependent on stimulus intensity.
In a previous report it was shown by the writer (Jarl, 1957) that relatively small variations in the brightness of moderately intense visual stimuli, spanning in all little more than one log unit, will give differences in simple reaction time (RT) which are consistent enough to encourage the use of latency measures in supra-liminal perceptual research. The proviso had to be made, however, that experimental conditions must be arranged so as to prevent the respondent from adopting differential preparatory sets to stimuli of varying sensory ade- quacy. Only then may systematic changes in response latency be ascribed to receptor or stimulus (.%)factors alone.
Any regular order of presenting stimulus variants will, on the other hand, give the re- spondent foreknowledge of the immediate stimulus for each reaction, thus permitting the additional operation of preparatory organismic (0-)factors. The latter may in turn conceal the sensory effect under study. Since other investigators of simple R T have employed regular order of stimulus presentation, a reexamination of response latency as a function of stimulus dimensions seemed called for. The present experiment is a first step in this direc- tion. I t has previously been reported on in summary form only (Jarl, 1941).
RETROSPECT
As originally claimed by Wundt (1874) on very scant evidence (cf. Jarl, I957), and later often referred to as his law, R T appeared to be rather independent of stimulus strength except at the very extremes of the scales. I n Baldwin’s encyclopzdic dictionary of 1911 it was merely stated (by Warren & Baldwin, p. 417) that ‘With stimuli of very small intensity the time is lengthened.’ The two main studies up to that time were those by Berger (1886) and Cattell (1886), working jointly in Wundt’s laboratory, and by Froeberg (1907) in Cattell’s,
82 Scand.J. Psychol., Vol. I , 1960

83 SENSORY AND PREPARATORY FACTORS IN RESPONSE LATENCY. I
both primarily based on visual stimuli of known relative intensity. Essentially no new evi- dence was added by PiCron (1g14), so these are the principal classical studies in this field.
In the Leipzig experiment an electric spark in a vacuum tube served as light source. By means of smoked glass filters relative intensity could be varied in five unequal steps from 1000 to I , the weakest being ‘just strong enough to be seen’ (Cattell, p. 5x3). Two stronger stimuli, different in size and form and of unknown relative values, were obtained by means of condensing lenses, and the brightest was characterized by Berger (p. 77) as ‘blinding’. I t would thus appear that the total visible range under dark-adaptation was covered, resulting in maximal differential effects on R T of 123 ms (Cattell) and 140 ms (Berger). This is 3-4 times as much as reported by Exner (1873), but the discrepancy may be attributed entirely to the decidedly longer latencies for the two weakest stimuli, particularly the one close to threshold.
The experiment lasted ten days, with the stimuli ‘always in new sequencies’ (Berger, p. 56), each day providing 1 5 simple reactions per intensity and subject. These 15 were interspersed, however, in groups of 5 with an equal number of both discriminative and choice reactions, so that at least for this reason frequent changes in preparatory set were called for. The simple reaction consisted in pressing down a key with the right forefinger upon the warning ‘now’ (always preceded by noise from starting the clock), and releasing the key when stimulus was perceived (whereby it disappeared). The respondent sat in the dark and, when warned, brought one eye before a telescopic tube, the outline of which could just be seen.
No premature reactions occurred (ADS 13-30 ms), one reason probably being that no attempt was made to bring about maximal attention in preparing for the response. ‘We reacted much more without straining attention noticeably, since it naturally is easier to maintain quite an ordinary degree of attention over a long period of time than an unusually high one’ (Berger, p. 55). Perhaps Martius (1892), who with practice and intensified attention found little differen- tial effect of loudness, included Berger and Cattell among the less prudent performers when he attributed earlier positive findings to ‘sorgloser Ausfuhrung der Reaction’.
Berger described their results quite adequately as follows (p. 76): ‘As stimulus strength is increased, reaction time becomes smaller, and it decreases particularly rapidly in the neigh- borhood of the stimulus threshold. For middle intensities it is almost constant within rather wide limits, although in general a still further decrease is shown.’ The very last point made has later usually been overlooked, although it refers to an added differential effect of 15-25 ms at the high end of the scale, which is as much as for two log I units at the ‘middle’ range. The reason for this oversight is most likely the fact that the two strongest stimuli were not photometrically determined, hence cannot be included in graphical presentations. The latter therefore tend to emphasize lack of differential effect for intensities above 1-2 log units from stimulus threshold, and especially if the abscissa is not laid out in logarithmic units. (See e.g. Woodworth, 1938, p. 317 f.)
Even Berger, after presenting graphs of both types, arrived at a too limiting conclusion (p. 77): ‘The curves do not give a definite law; negatively they show, however, that the reaction time does not increase arithmetically when the intensity decreases in geometrical order, but that it increases much more rapidly.’-We note the expectation which evidently had been enter- tained, that R T would vary in conformity with Weber’s law.-Nor was Cattell able to ‘formulate a general law from the table’ @. 513). He merely pointed out the inverse relation which holds ‘with one accidental exception’, but did not say why this particular average RT-value should be considered accidental. Keeping in mind that all values are approximations which may be more or less influenced by experimental inadequacies, these results do not preclude the possibility that Weber’s law holds for simple visual RTs when stimulus intensity exceeds a rather low critical value.
On these premisses only can we agree with Woodworth when he states (1938, p. 318) that Froeberg’s results do not differ essentially from Berger’s (and Cattell’s). Their data for measured intensities have been replotted in Fig. I against log I relative to assumed threshold,
Scand. r. Psychol., Vol. I, rg6o

84 VIDKUNN COUCHERON THRANE
using the RT-values reported by Berger. (Cattell subtracted 30 ms from these, representing the minimum lag of an electromagnetically operated armature used in measuring time.)
Froeberg (1907) undertook to vary the size (area) and duration as well as intensity of visual stimuli (daylight reflected from paper of varying degrees of brightness). Precautions were taken to keep the illumination as constant as possible under the circumstances, which in turn
~
W L E VISUAL REAGTW T M E (FOVEA)
cI--p BERGER 8 CATTELL (1886)
0 ....... 0 FROEBERG ( 190n
A----A &RON (1914)
I I I I 0 I 2 3 4
L W INTENSrrY RE Ti-RESHOLD
FIG. I . Simple reaction time for the darkadapted fovea as a function of luminous intensity expressed in lo- garithmic units relative to stimulus threshold (approximately). Six sub- jects from the three main earlier studies, as indicated.
prevented 'as wide a variation of intensity and time of exposure as would have been desirable' (p. 6). The nine relative intensity values ranged from 7.5 to 1000, only slightly more than two log units. 'The lowest intensity was a velvet black and nothing blacker than this could be obtained. It was still a considerable distance above the threshold. By decreasing the time of exposure (from 48 ms) . . . the threshold was reached when this stimulus was exposed for about 5 (ms) . . .' (p. 14). For our purposes we have therefore assumed that the lowest intensity was about one log unit above threshold (see Fig. I). Yet Froeberg maintained that 'the stimuli chosen were approximately in the middle of the scale of size and duration as well as intensity'
One inexperienced (R) and another highly practiced (W) respondent (upper and lower curve) served under all conditions of this experiment, which was divided into three parts. Only the five higher intensities (100-1000) were employed during the first two parts. In part I, exposure time was always 48 ms, and stimulus area was kept constant at 48 x 48 mm for all brightnesses except the highest, where it was also successively reduced by 3/4 down to 3 x 3 mm. In part 2,
this smallest size was kept constant, together with an exposure time of 3 ms for all but the highest brightness, where it was also successively doubled up to 48 ms. Thus, the one combina- tion common to these parts was the smallest visual figure with the highest relative intensity exposed for 48 ms. Part 3 also included this combination in addition to the lower brightnesses of the same size and exposure time. Parts I and 2 consisted of separate series of 16 sittings with 25 reactions for each of nine stimulus variants (in rotated order) on every sitting, giving 400 reactions in all per variant and subject. In part 3, five sittings with 40 trials per variant gave totals of 200 reactions for the lower brightnesses. Two more subjects served in part I with variation of stimulus size only, giving IOO (H) and 225 (F) reactions per variant. A sitting lasted about one hour, with brief pauses between stimulus variants.
(P. 27).
Scad. J. Psychol., Vol. I, 1960

SENSORY AND PREPARATORY FACTORS I N RESPONSE LATENCY. I
TABLE I. Simple reaction times in milliseconds for visual stimuli of varying strength. (Data from Froeberg, 1907)
Relative intensity 1000
85
Part I (exposure 48 m)
Area in nun’ 9 36 I44 576 2304
I94 187 184 181 I77 I75 169 165 161 I 62 I95 I 88 184 I 82 I79 176 172 170 I73 172
Part 2 (area 9 mmz)
Exposure in ms 3 6 I 2 24 48
Subject
H F R W
R W
Relative intensity (exposure 48 ms) ,
7.5 21.6 31.2 66.6 I 0 0 160 250 560 1000
Part I , (area 2304 mm2)
192 188 186 183 I79 R 184 181 179 176 172 W
Part 3 (area 9 mmc)
226 220 215 210 206 207 204 202 I99 196
(adjusted RTs) Part 2 (area 9 mme)
228 222 217 212 208 20 I I97 I94 192 R 195 I93 191 I 88 185 183 180 176 I73 W
About 35 cm from the respondent’s eyes was a square aperture of adjustable size. When a covering screen was raised about 14 sec. before stimulus exposure, the black aperture was fixated, with ‘the fmgers of his right hand on a telegraph key’. A wheel rotating at a rate of I mm per ms carried stimulus papers of appropriate widths (to regulate time of exposure) past the aperture. (Since the exposure of the largest stimulus could not be decreased to 3 ms with this set-up, the smallest size had to be used in part 2 for varying stimulus duration.) Except for the two largest stimuli (aperture openings) the background is said to have presented an absoIute black.
Froeberg’s results for visual stimuli, all recalculated on the basis of the daily means given, are summarized in Table I . Variability measures are not included, since his derivation of probable errors from the means of daily average deviations is not acceptable. I t should also be noted that in his tables of differences, PE (no subscript) is not an ordinary PE, but the arithmetic average of the PEs for the two means being compared, and that the differences
Scand. J. Psychol., Vol. I, 1960

86 VIDKUNN COUCHERON THRANE
for W in Froeberg’s Table 8 do not correspond with the means given in Table 6. The daily AD values are relatively small, varying e.g. from 5 to 18 ms over 16 sittings for 25 reactions with the higher brightnesses, and they seem to be quite independent of stimulus strength.
Area. As a stimulus area of 9 mm2 is quadrupled four times, R T decreases by 6, 3, 2 , and 2 ms for the four subjects combined. It is well to recall, however, that the two largest stimuli were seen against less dark backgrounds than the rest, which would tend to counteract the effect of increased area. An attempt was made to reduce area still further by increasing the distance between aperture and respondent, but the factors of size and intensity per unit area are thereby confounded. I t is stated that this arrangement gave a decrease of the same nature as the one before, although it sometimes happened that the weakest stimulus thus produced was below threshold ‘so that no experiments could be taken on that day’ (p. 21). Our conclusion must be that under the conditions of this investigation, including regular order of stimulus presentation, an inverse relation between stimulus area and response latency is demonstrated, but not the exact nature of the function as claimed by Froeberg (pp. 23-24): ‘Over a limited range this increase (in RT) is made by approximately equal arithmetical increments as the size of the stimulus decreases geometrically, but as the threshold is approached the increase becomes more rapid.’
Duration. Both respondents have increments in R T of about 2 ms with every halving of exposure time for the smallest but brightest stimulus. Reducing its duration to 1/16 has not far from the same effect on latency, though in opposite direction, as increasing its area 16 times (from 9 to 144 mm2) when background is kept constant.
Intensity. The total effect of this variable is brought out by juxtaposing the results in parts 2 and 3. In the latter the common stimulus variant gives a 2 ms shorter mean latency for R but I I ms longer for W. The means for the lower brightnesses must be adjusted accordingly by being multiplied by 207.9/206.2 and I 85.0/196.0, respectively (the last denominator is misprinted in Froeberg’s report, p. 15). Original as well as adjusted values are included in Table I , and the comparable RTs are plotted in Figure I . It will be seen that over the range from I to 3 log I units above threshold, response latency varies inversely as an approximately constant function of log I. The two respondents tend to come farther apart in speed as intensity is decreased, R always exhibiting somewhat greater differential effect of stimulus strength than W, and par- ticularly when dealing with the relatively weaker stimuli. At least in the case of W there is no indication of a levelling off at the highest intensities used; in fact, R shows a further decrease of 13 ms in part I, where the area of the brighter stimuli is sixteen times as large. Nor is there any inflexion in the curves at the low end for either respondent.
The directly comparable RTs with respect to duration and intensity of the smallest stimulus (the two blocks of results for part 2 in Table I), tell us that the dopes of the nearly perfectly straight lines for duration are less steep than for brightness within the common range (1.9-3.1 log units). The total differential effects on R T of brightnesses 67-1000 are 20 and 15 ms for R and W, while the effects of the corresponding durations (3-48 m ~ ) are g and 8 ms. Thus, a given proportional decrease along the two stimulus dimensions tends to produce an absolute lengthening of response latency which is constant, although twice as large for intensity as for duration. I t should be emphasized that we are here dealing with stimuli falling at least two log units in strength above the absolute threshold, and that all exposure times appear to be below the critical durations or retinal action times (cf. Wood- worth & Schlosberg, 1954, p. 373). The evidence for stimulus area is less clear, but indications are that it exerts an influence which is similar to that of duration.
Scand. J. Psychol., Vol. I, 1960

SENSORY AND PREPARATORY FACTORS IN RESPONSE LATENCY. I 87
The data from Pitron (1914) are also included in Fig. I , although means are based on only I 5-20 measures (ADS I 1-45 ms). The weakest intensity is said to be at threshold value, but it is difficult to see how mean RTs could be determined at this point. Again we note that the slower respondent is most affected by changes in intensity, the total differential effect being 240 ms as compared with 92 ms, and the faster subject has aremarkably small R T ‘at thresh- old’. The results may be regarded as rather similar to those of Berger and Cattell, how- ever, and PiCron applied the following formula (but with a different nomenclature) to both
sets of data: R T = D m m / o + B, where I is expressed in multiples of stimulus threshold, B stands for a limital or basal R T at ‘very great’ intensity (empirically determined or assumed), and D,, is the obtained or assumed maximal differential effect of intensity (i.e. R T near threshold minus B). The calculated values deviated up to 17 ms from the empirical ones, which was considered satisfactory (p. 63 f.).
3
3
According to PiCron (1914, p. 69, cf. p. 95) the quantity Dm,/lh represents exclusively, and practically all of, the sensorially determined part of R T at any given intensity, only an irreducible and negligible portion remaining in B. D,, alone therefore stands for the latency of sensory excitation at stimulus threshold. B, on the other hand, is primarily ‘the non- sensorial part of the time, independent of intensity of stimulation’ (p. 69). It ‘constitutes a constant for a given sensation, a given subject, and a given mental attidude. When studying the influence of mental attitude, of attention, etc., then (B) is a variable’ which may fluctuate considerably (footnote, p. 69 f.). We may add, however, that only in so far as organismic factors operate independently of stimulus intensity, will they be gauged by B in PiCron’s formula. If, e.g., Johnson’s (1923) hypothesis of a compensatory relationship between S- and 0-factors holds, D,, or any intermediate differential effects of stimulus strength will be reduced, and we are no longer dealing with unadulterated sensory latencies, as assumed.
METHOD
Examination of previous investigations showed that no visual stimuli of measured intensity above about four log units re threshold had been employed in studying response latency as a function of stimulus strength. Between this upper limit and a lower critical limit around one log unit, results were somewhat inconsistent, but the best evidence suggested that linear logarithmic functions might obtain, differing in slope with individuals as well as with various dimensions of stimulus strength. I t was also indicated that such functions might extend to higher ranges on the intensity scales, giving upper critical limits for ‘basal’ RTs beyond those hitherto envisaged, at least if organismic factors are prevented from interfering with the independent operation of the stimulus factor under study. These propositions were the basis for an experiment performed at the Johns Hopkins University, U.S.A.
Nine graduate students of psychology, 6 men and 3 women, acted as respondents. Six of the subjects (4 men and z women) had served half a year earlier in a similar experiment, the others had much less or no previous experience in the given task. The immediate reaction signal was a circular area of foveal size and one of three luminous intensities, covering a range of nearly five log I units at the upper half of the brightness scale.
On each of six sittings (five only for subject Le), lasting about 3-40 minutes without rest pause, every stimulus variant appeared 30 times intermixed with the others in two predeter-
Scand. J. Psychol., Vol. I, 1960

88 VIDKUNN COUCHERON THRAh’E
mined random orders. An auditory warning signal of constant loudness and 0.25 second duration was followed by one of three preparatory intervals lasting 1.25, 1.50, and 1.75 sec. These intervals were also randomly mixed, each being used 10 times with every stimulus variant. The respondent sat at a table which was fastened to the floor of a large and windowless room with a high ceiling, dimly illuminated from above and slightly to the rear of the subject’s head by a 25 W lamp. A few minutes of adaptation, not rigidly controlled in view of the random order of stimulus presentation, preceded each session.
The following instructions were given orally as well as in writing, the latter being always present on the table:
This is a reaction time experiment to light stimuli. Your task is to press the key on the table with the index finger of your best hand as quickly as possible after a light-stimulus has appeared on the screen in front of you. In order that you may be optimally prepared for your response to the light, a warning signal will be given with a buzzer at slightlyvarying intervals before the stimulus appears. Your reaction is measured in thousandths of a second. If you react before the stimulus is given, this is easily detected, and recorded as a failure. Keep your finger on the key continuously, but do not press it down between reactions, during which time you are supposed to relax. Rest your arms on the table, your head being approximately vertical to the edge of the table.
When the warning signal comes, focus your attention on the screen, and do your best to press the key as soon as you see the light.
Apparatus
The respondent operated a Dunlap (1909) double-lever balanced reaction key, constructed to prevent minor variations in exerted pressure from breaking the circuit, thus permitting high perceptive as well as motor readiness. The subject was free to choose a convenient position for the key on the table. Since no head-rest was provided, the distance between his eyes and the stimulus surface could vary somewhat around the 7 feet as measured from the edge of the table, his side. At this distance the stimulus figure, which was 3.5 inches in diameter, subtended a visual angle of 2O24’. It also served as fixation target, its opaque surface being sharply out- lined against the dull black partition which separated respondent and experimenter.
The light from a spectroscope with a 250 W Mazda lamp was brought to focus at the point of intersection of a large and heavy pendulum of the type described by Dunlap (1912). A triangular steel frame with levelling screws at the 26 in. base carried a 45 in. rod, swinging on knife bearings mounted to a cross bar at the top. The latter also carried four adjustable com- mutator discs, which served the same purpose of making and breaking electric circuits at appropriate times as the contact switches in the original model. Reduction of sparks at the contacts was effected by means of a 0.5 mfd condenser.
At the lower end of the pendulum rod, and sufficiently clear of a heavy bob shaped for low air resistance, was an armature by which electromagnets on the frame could catch and hold the pendulum deflected at either extreme of the swing. Also attached to the rod, and at right angles to the light beam, was a stiff cardboard shield which ordinarily interrupted the beam. This and other reflecting surfaces were painted dull black. A 6 inches long, curved slit in the shield would expose the beam for approximately 0.15 sec. as the swing of the pendulum in one and the same direction gained maximum speed. (While the pendulum was returned, a temporarily inserted shield interrupted the beam.) Thus, a very fast and uniform build-up of illumination at the ground-glass stimulus plate was achieved.
On the respondent’s side, at a distance of 7 feet, this strongest intensity (referred to as A) gave an illumination of 170 footcandles as measured by a Macbeth illuminometer. (Dr. Willis C . Beasly made the measurements and produced the filters used.) Two sets of glass-covered neutral density filters, made photographically, could be moved by means of a sliding frame into
Scand. J. Psychol., Val. I, 1960
SENSORY AND PREPARATORY FACTORS IN RESPONSE LATENCY. I
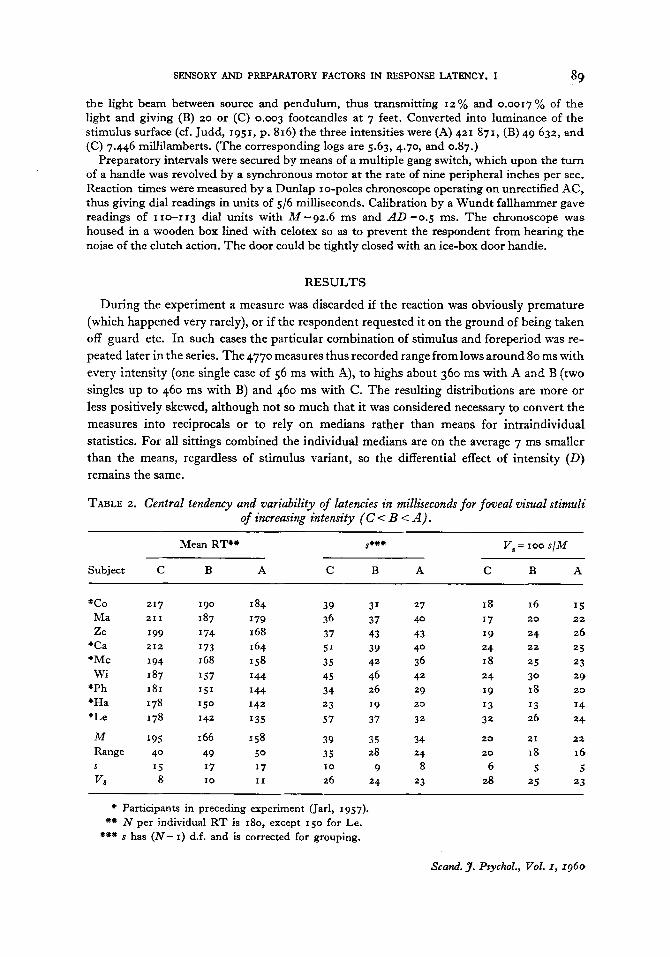
the light beam between source and pendulum, thus transmitting 12% and 0.0017% of the light and giving (B) 20 or (C) 0.003 footcandles at 7 feet. Converted into luminance of the stimulus surface (cf. Judd, 1951, p. 816) the three intensities were (A) 421 871, (B) 49 632, and (C) 7.446 millilamberts. (The corresponding logs are 5.63, 4.70, and 0.87.)
Preparatory intervals were secured by means of a multiple gang switch, which upon the turn of a handle was revolved by a synchronous motor at the rate of nine peripheral inches per sec. Reaction times were measured by a Dunlap 10-poles chronoscope operating on unrectified AC, thus giving dial readings in units of 5/6 milliseconds. Calibration by a Wundt fallhammer gave readings of I 1-113 dial units with M=92.6 ms and AD =0.5 ms. The chronoscope was housed in a wooden box lined with celotex so as to prevent the respondent from hearing the noise of the clutch action. The door could be tightly closed with an ice-box door handle.
89
RESULTS
During the experiment a measure was discarded if the reaction was obviously premature (which happened very rarely), or if the respondent requested it on the ground of being taken off guard etc. In such cases the particular combination of stimulus and foreperiod was re- peated later in the series. The 4770 measures thus recorded range from lows around 80 ms with every intensity (one single case of 56 ms with A), to highs about 360 ms with A and B (two singles up to 460 ms with B) and 460 ms with C. The resulting distributions are more or less positively skewed, although not so much that it was considered necessary to convert the measures into reciprocals or to rely on medians rather than means for intraindividual statistics. For all sittings combined the individual medians are on the average 7 ms smaller than the means, regardless of stimulus variant, so the differential effect of intensity ( D ) remains the same.
TABLE 2. Central tendency and variability of latencies in milliseconds for foveal visual stimuli of increasing intensity (C < B < A ) .
Mean RT*+ s+c# V s = 100 s / M
Subject C B A C B A C B A
* c o Ma Ze
"Ca "Mc Wi
"Ph "Ha "Le
39 31 27 34 37 40 37 43 43 51 39 40 35 42 36 45 46 42 34 26 29 23 19 20
57 37 32
I 8 16 15 17 20 22
19 24 26 24 22 25
24 30 29
13 13 14
18 25 23
19 18 20
32 26 24
M * 95 I 66 158 39 35 34 20 21 22
Range 40 49 5 0 35 28 24 20 I8 16 15 I7 I7 I 0 9 8 6 5 5
VS 8 I 0 11 26 24 23 28 25 23 S
* Participants in preceding experiment (Jarl, 1957). +* N per individual RT is 180, except 1 5 0 for Le.
*** s has ( N - I ) d.f. and is corrected for grouping.
Scand. J. Psychol., Vol. I, 1960

90 700
600
500
400
L
h $
\9 8 3-00
ZOOC
/oo
0
VIDKUNN COUCHERON THRANE
I i
I !
/N TEN51 TIES A
C
-__-_ ........ ....... ..
.~... 60 90 /ZO /50 /80 210 240 270 300 3.0 360 390 420 450 460 9 0 540 510 600
REACT/ON 7 7 ~ ~ IN UNITS O F ~ M S
FIG. 2. Distributions of 1590 response latencies per stimulus intensity obtained from nine subjects over six sittings (in original dial units).
Our nine subjects form a rather homogeneous group in regard to speed of response, their mean RTs never differing more than 49 ms or varying beyond s = 17 ms. True, there are some individual differences also with respect to variability, skewness, and kurtosis of distributions, which suggest that the statistical analysis should not be based on a pooling of original measures for all subjects. Fig. 2 nevertheless brings out rather well some of the over-all trends.
The extremes in speed are represented by two of the six subjects who took part in the preceding experiment with much weaker intensities, where they also had extreme RTs. Moreover, the same three respondents fall above and below the median in both studies, only
G, 2
FIG. 3. Averages of eight individual mean reaction times ( N = 30) for three visual stimuli of decreasing intensity (A-C) in the course of six experimental sittings.
I 2 3 4 5 6 Si7TlNGS
Scad. J. Psychol., Vol. I, 1960
SENSORY AND PREPARATORY FACTORS IN RESPONSE LATENCY. I
\O LE t A -
t a
I I I I 0 I 2 3 4 5
91
LOG STlMUtUS INTENSITY ( M L )
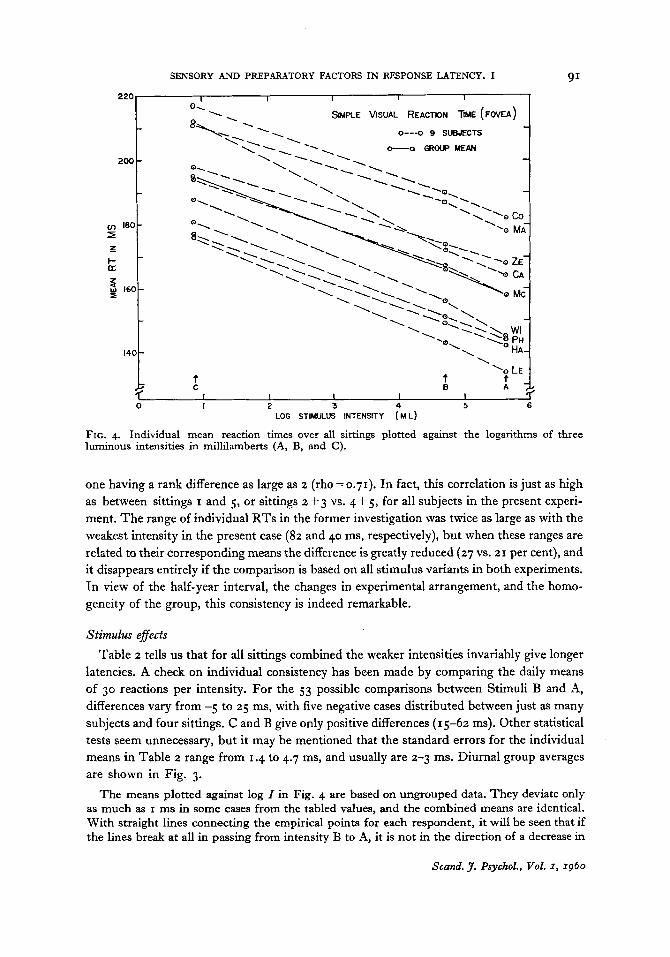
FIG. 4. Individual mean reaction times over all sittings plotted against the logarithms of three luminous intensities in millilamberts (A, B, and C ) .
one having a rank difference as large as 2 (rho=o.71). In fact, this correlation is just as high as between sittings I and 5, or sittings 2 + 3 vs. 4 + 5, for all subjects in the present experi- ment. The range of individual RTs in the former investigation was twice as large as with the weakest intensity in the present case (82 and 40 ms, respectively), but when these ranges are related to their corresponding means the difference is gready reduced (27 VS. 21 per cent), and it disappears entirely if the comparison is based on all stimulus variants in both experiments. In view of the half-year interval, the changes in experimental arrangement, and the homo- geneity of the group, this consistency is indeed remarkable.
Stimulus effects
Table 2 tells us that for all sittings combined the weaker intensities invariably give longer latencies. A check on individual consistency has been made by comparing the daily means of 30 reactions per intensity. For the 53 possible comparisons between Stimuli B and A, differences vary from -5 to 25 ms, with five negative cases distributed between just as many subjects and four sittings. C and B give only positive differences (15-62 ms). Other statistical tests seem unnecessary, but it may be mentioned that the standard errors for the individual means in Table 2 range from 1.4 to 4.7 ms, and usually are 2-3 ms. Diurnal group averages are shown in Fig. 3.
The means plotted against log I in Fig. 4 are based on ungrouped data. They deviate only as much as I ms in some cases from the tabled values, and the combined means are identical. With straight lines connecting the empirical points for each respondent, it will be seen that if the lines break at all in passing from intensity B to A, it is not in the direction of a decrease in
Scand. J. Psychol., Vol. I, 1960

92 VIDKUNN COUCHERON THRANE
slope. Subject Ca is the only exception to this rule. Rectiiinear logarithmic functions will there- fore describe the given data most adequately, notwithstanding the precariousness of operating with only three empirical values. What happens beyond either end of the present range of intensity is another question.
The exceptional subject mentioned is also the only one who changes relative position as to speed in passing from the stronger to the weakest stimulus. At the two highest intensities the rank orders are identical, with Ca just below average in speed (rank 4), and measures of indi- vidual differences in speed are nearly the same (lower half of Table 2) . However, Ca reacts relatively much slower to the weakest stimulus (rank 2), and exhibits thereby the greatest total differential effect of intensity ( D c - ~ = 4 8 ms as against 38 ms for the group as a whole).
Variability In reviewing previous studies, it was suggested that general slowness of response may be
associated with large differential effect of stimulus intensity. Yet we have seen that Ca is not exceptionally slow at high intensities. Moreover, the slowest respondent of all has nearly the smallest total D, and the fastest has next to the largest, indicating an inverse relation between R T and D. (All three belong to the previously practiced subjects.) To avoid any duplication of error variance in the measures compared, RTA has been correlated with DC-B, giving a rank-difference coefficient of - 0.57. If the D is expressed as a percentage of RTA, the corre- lation becomes - 0.75. There is, in other words, a clear indication that the more efficiently a subject responds under nearly optimal stimulus conditions, the more he tends to lose in efficiency as the sensory adequacy of the stimulus is reduced. As a result of this tendency, individual differences in speed are reduced in step with the decreasing intensity, whether these differences are measured in absolute or relative terms.
Turning to intraindividual variability of response, there is no consistent tendency for these subjects to vary more as the stimulus becomes weaker (within the given limits), although for absolute measures there is a small average tendency in this direction. For relative Variability the tendency is rather an opposite one, although weak. On the other hand, individual differences in variability show, for both types of measure, a small but consistent increase as intensity is decreased. Thus, our subjects differ less with regard to speed but more with respect to variability of this particular response as the stimulus is reduced 47 decibels from the rather high intensity A.
These respondents do not maintain their ranks with respect to variability as well as in regard to speed. Stimuli A and B, which differ relatively little in brightness, give a rho around 0.90 for both absolute and relative variability measures, but when either of them is paired with C, rho reduces to about 0.70 for relative and 0.50 for absolute measures. This stems from the fact that intraindividual variability sometimes increases and other times decreases with stimulus strength, although the latter occurs more often. The net result, as already noted, is that the respondents differ more in variability as intensity is reduced.
One might expect average latency and variability of response to be related measures, since the reciprocals of both may be looked upon as indices of response efficiency. But at least in our small and rather homogeneous group, their intercorrelations (by ranks) are not impressive:
S .18 .23 .28 Vb - .I2 - .22 - .I0
Scand. J. Psychol., Vol. r, 1960

SENSORY AND PREPARATORY FACTORS I N RESPONSE LATENCY. I 93
The coefficients for absolute variability are positive, as expected, and their decreasing value with intensity is in harmony with the facts that our subjects differ less in speed but more in variability as stimulus strength is reduced. But why is the relationship so slight as to even be- come negative for relative variability?
Perhaps a suggestion may be derived from a comparison of the two fastest respondents. Le always ranks 9 in speed but average or lower in variability, culminating with a rank of I for both absolute and relative variability under the weakest stimulus. It is as if he achieves the short average latencies through great effort but at a cost in stability of response, a cost which becomes higher the weaker the stimulus. In fact, his average speed also decreases relatively rapidly with intensity, DC-A being 43 ms or next to the largest in the group. Subject Ha, on the other hand, maintains throughout an efficiency rank of 9 in variability, and his decrease in speed with intensity is z ms less than average. It is as if he has adopted a more ‘natural’ general preparatory set, which is less easily disturbed, just as Berger claimed for himself and Cattell. (I t may be added that observations made of the subjects during the experiment do not contradict such an interpretation.)
This leads us to a closer examination of the relations between response variability under the given intensities and the total differential effect of these intensities on average latency. The latter may also be thought of as a reciprocal index of efficiency,-of sensorily determined effi- ciency according to Pieron. It can be expressed in absolute units or as a proportional increase of the latency at high intensity, the two measures being intercorrelated to the extent of 0.88. The rank-difference coefficients for latency-differences vs. variability are as follows:
S vs C B A C A B
Absolute total D .SO .c9 - .o j .73 -40 . 3 0 Relative total D .47 -15 .02 .78 -52 -12
We may conclude that there is a decrement in response efficiency from high to low stimulus intensities as measured by average latencies of reasonably well practiced subjects. This decre- ment is to some extent a function of the respondent’s variability, especially if the latter is measured in relative terms. True enough, for any given intensity there is very little relation between average latency and variability. However, reduction of stimulus strength tends to increase variability proportionately more for those subjects who lose the most in average speed.
Practice effects
The claim by Martius (1892) that the differential effect of stimulus intensity may be reduced or even disappear with practice and proper straining of attention has never been substantiated, although such a result is conceivable under regular order of stimulus presenta- tion if the respondents develop compensatory preparatory sets as suggested by Johnson (1923). The three main studies reviewed have all used highly practiced subjects, and the effects of practice have not been analyzed. In Froeberg’s data, however, there is evidence that practice may bring about deterioration as well as improvement in the response efficiency of well-trained individuals.
All our respondents show some improvement in speed over the first three sittings, although t o different extents and not always consistently. From then on the picture is even more
S c a d J. Psychol., Val. I, 1960

94 VIDKUNN COUCHERON THRANE
varied. Rank-difference correlations for adjacent sittings range from 0.64 to 0.88, the lowest being for sitting 3 vs. 4. For the group as a whole Fig. 3 would indicate very little change in the differential effect of intensity with practice, but the matter needs further scrutiny since improvement and deterioration in speed may have opposite effects on D. For this purpose an index of average speed has been arrived at by combining the two strong stimuli and averag- ing the means for A + B and C. Similarly, a measure of the average differential effect of extreme intensities is provided by the difference RTcRTA+a, referred to as D.
Group Ia_._ c
\, GroupIb
’DC
FIG. 5 . Upper graph Diurnal variations in reaction time relative to first sitting for experienced (Ia) and inexper- ienced (Ib) respondents with strong (A+B) and weaker (C) stimuli.-Lower graph: Corresponding differential effect of intensity (8) in milliseconds.
1 2 3 4 5 6 Sitting
The six subjects with recent RT experience were first equally divided into two groups of relatively quick and slow respondents, ranging 158-164 and 178-202 ms in average speed. Both groups show optimal efficiency midway in the experiment after latency reductions of 16-20 ms, and end up only 8-13 ms better than when they started. In fact, one person in each group is slower on the last than on the first sitting by z and 17 ms. The five of these subjects who served on all sittings, have therefore been combined into one group (I a) for a comparison with the three inexperienced respondents (Ib), whose optimal RTs fall on one of the two last sittings. The resulting groups are very similar in average speed (4 ms in favor of I a), but the effects of practice are markedly different as may be seen in Fig. 5 . Changes in reponse latency are here expressed in per cent of RTs on the first sitting, separately for the weakest and the two strong stimuli, and below are given the corresponding absolute Ds.
The experienced group reaches optimal speed on the fourth sitting after a total reduction of about 9 % ( I 5 and 18 ms for strong and weak stimuli), whereupon there is a small but progressive deterioration of 7 ms, in all, on the last two sittings. Both in absolute and in relative terms this deterioration is greatest for the weaker stimulus. Again subject Ca represents the extreme, reacting as slowly on the last as on the first sitting to stimulus A, 6 ms slower to B and 30 ms slower to C, thus exhibiting a record-breaking total D of 68 ms. It may be added that the excluded subject Le behaves similarly to this group during his five sittings.
The inexperienced group, on the other hand, starts out 19 ms slower than I a but ends up 13 ms quicker, showing progressive improvements totalling 42 ms or zo”:,. This is 2-3 times as much as Ia gained at-best. The rate of improvement varies at the start with intensity. After an exceptionally small D on the first sitting, R T is reduced 27 ms for stimulus A, 15 ms for B, and 7 ms for C (relative reductions differing even more), whereby D increases to 38 ms. In fact, there are seven subjects in all who show appreciable improvement in speed from sitting I to 2, and for all but one of them this improvement is greater for A than for either B or C. I t is
Scand. J . Psychol., Vol. I, 1960

SENSORY AND PREPARATORY FACTORS IN RESPONSE LATENCY. I 95
therefore suggested that the strongest stimulus produces a startling effect, which requires some practice to be overcome. Relative to the second sitting, the rate of change in R T is practically the same for weak and strong intensities, and D varies irregularly between 38 and 27 ms.
These results indicate that when widely differing stimuli are presented in irregular order, the respondents may need some practice before they can adopt a general preparatory set which serves all stimulus variants equally effectively. Once such a set is attained, however, the differential effect of stimulus intensity remains fairly constant, or may decrease slightly, as long as the subjects continue to improve their speed generally. After optimal speed has been reached, decrements in response efficiency seem to be greater for weak than for strong stimuli, thus producing an increase in the differential effect of intensity.
DISCUSSION
We have seen ( I ) that respondents who are relatively quick at high intensities tend to lose more in speed when intensity is reduced, under strictly comparable conditions otherwise, and (2) that this loss is associated with increased variability of response; furthermore, (3) that diurnal variations in general response efficiency, as measured by average latency, is to some extent a function of stimulus strength, so that for any given respondent the differential effect of intensity varies inversely with his speed. These findings suggest that central organismic factors may play a role in determining the differential effect of intensity, even when the respondent cannot expect a specific variant of the stimulus, but only a given range of intensity. Irregular order of stimulus presentation forces the respondent to adopt a general preparatory set at any one time, but such sets may vary from time to time and from one subject to another, and these variations may be more or less favorable for the different intensities of sensory stimulation. If this be so, PiCron’s analysis of the total response latency into a sensory and a non-sensory component is open to question, and D cannot be looked upon as a measure of individual sensitivity, pure and simple, even under irregular order of stimulus presentation.
The so-called basal R T is supposed to represent the ‘physiological’ limit of response efficiency at an upper critical intensity. It has generally been assumed that this critical intensity is rather low ‘in comparison with the height of sense’, as Bryan (1893) expressed it. Our results show that R T continues to decrease systematically at luminous intensities which are higher than any employed so far, and that respondents differ consistently in speed at such intensities. So far there is no evidence available concerning upper critical luminosities as judged by simple response latency.
The intensity function over the total visible range, and with maximal isolation of the sensory factor under study, remains yet to be determined. Indications are, however, that rectilinear logarithmic functions will obtain for intensities spanning most of the brightness scale. This conclusion needs not to be modified, in fact is strongly supported, by a recent study of Bartlett & Macleod (1954). Their data, with the authors as highly practiced subjects, are in conformity with such a function for luminosities ranging from z to 6 log units above stimulus threshold. I t may therefore be questioned whether it serves any useful purpose to fit continuous hyperbolic curves to latencies over the total range of stimulus intensity, in their case extending down to 5 decibels above threshold. Such a procedure may perhaps
Scand. J. Psyckol., VoZ. r, 1960

VIDKUNN COUCHERON THRANE 96
conceal a fundamental difference in the function below and above a certain lower critical intensity, which in all probability lies somewhere between one and two log units above stimulus threshold.
R E F E R E N C E S
BALDWIN, J. M., Ed. (1911). Dictionary o j Philosophy and Psychology. Vol. 2. New York: Macmillan.
BARTLETT, N. R., and MACLEOD, S. (1954). Effect of flash and field luminance upon human reaction time. J. Opt. SOC. Amer., 44,306-3 I I.
BERGER, G. 0. (1886). Uber den Einfluss der Reizstarke auf die Dauer einfacher psychischer Vorgtinge mit besonderer Rucksicht auf Lichtreize. Phil. Stud., 3, 38-93.
BRYAN, W. L. (1893). Note upon the controversy regarding the relation of the intensity of the stimulus to the reaction-time. In Proc. Amer. Psychol. Ass. 1892. New York: Macmillan. Pp. 9-10. (Abstract)
CATTELL, J. McK. (1886). The influence of the intensity of the stimulus on the length of the reaction time. Brain, 8, 512-515.
DLINLAP, K. (1909). A new key for reaction-time work. Psychol. Monogr., 10, No. I (Whole No. 40).
- (1912). A new laboratory pendulum. Psychol.
E m , S. (1873). Experhentelle Untersuchung der einfachsten psychischen Processe. Pjiig. Arch. ges. Physiol., 7, 601-660.
FROEBERG, S. (1907). The relation between the
Rm., 19, 240-245.
magnitude of stimulus and the time of reac- tion. Arch. Psychol., Nau York, No. 8.
JARL, V. C. (1941). Intensity as a determinant of the simple visual reaction. Virginia J. Sci., 2 ,
228-229. (Abstract) - (1957). Method of stimulus presentation as
antecedent variable in reaction time experi- ments. Acta Psychol., r3, 225-241 (& Nord.
JOHNSON, H. M. (1923). Reaction-time measure- ments. Psychol. Bull., 20, 562-589.
JUDD, D. B. (1951). Basic correlates of the visual stimulus. In S. S. Stevens (Ed.). Handbook of Experimental Psychology. New York: Wiley.
MARTIUS, G. (1892). Uber den Einfluss der Intensitat der Reize auf die Reactionszeit der Klange. Phil. Stud., 7,469-486.
P I ~ O N , H. (1914). Recherches sur les lois d-: variation des temps de latence sensorielle er. fonction des intensitts excitatrices. Annie
WOODWORTH, R. S. (1938). Experimental Psycho- logy. New York Holt.
WOODWORTH, R. S., and SCHLOSBERG, H. (1954). Experimental Psychology. Rev. ed. New York Holt.
WUNDT, W. (1874). Grundziige der Physiologischen Psychologie. Leipzig: Engelmann.
Psykol., 9 , 167-183).
psychol., 20, 17-96.
Scand. J. Psychol., Vol. I, 1960