Embed Size (px)
Citation preview

SSeennssoorrss && TTrraannssdduucceerrss
IInntteerrnnaattiioonnaall OOffffiicciiaall JJoouurrnnaall ooff tthhee IInntteerrnnaattiioonnaall FFrreeqquueennccyy SSeennssoorr AAssssoocciiaattiioonn ((IIFFSSAA)) DDeevvootteedd ttoo
RReesseeaarrcchh aanndd DDeevveellooppmmeenntt ooff SSeennssoorrss aanndd TTrraannssdduucceerrss
VVoolluummee 220000,, IIssssuuee 55,, MMaayy 22001166
Editor-in-Chief Prof., Dr. Sergey Y. YURISH
IFSA Publishing: Barcelona Toronto

Copyright 2016 IFSA Publishing, S. L. All rights reserved. This journal and the individual contributions in it are protected under copyright by IFSA Publishing, and the following terms and conditions apply to their use: Photocopying: Single photocopies of single articles may be made for personal use as allowed by national copyright laws. Permission of the Publisher and payment of a fee is required for all other photocopying, including multiple or systematic copyright, copyright for advertising or promotional purposes, resale, and all forms of document delivery. Derivative Works: Subscribers may reproduce tables of contents or prepare list of articles including abstract for internal circulation within their institutions. Permission of the Publisher is required for resale or distribution outside the institution. Permission of the Publisher is required for all other derivative works, including compilations and translations. Authors' copies of Sensors & Transducers journal and articles published in it are for personal use only. Address permissions requests to: IFSA Publisher by e-mail: [email protected] Notice: No responsibility is assumed by the Publisher for any injury and/or damage to persons or property as a matter of products liability, negligence or otherwise, or from any use or operation of any methods, products, instructions or ideas contained in the material herein. Printed in the USA.

SSeennssoorrss && TTrraannssdduucceerrss
Volume 200, Issue 5, May 2016 www.sensorsportal.com
e-ISSN 1726-5479 ISSN 2306-8515
Editors-in-Chief: Professor, Dr. Sergey Y. Yurish, tel.: +34 93 4137941, e-mail: [email protected]
Editors for Western Europe Meijer, Gerard C.M., Delft Univ. of Technology, The Netherlands Ferrari, Vittorio, Universitá di Brescia, Italy Mescheder, Ulrich, Univ. of Applied Sciences, Furtwangen, Germany
Editor for Eastern Europe Sachenko, Anatoly, Ternopil National Economic University, Ukraine
Editors for North America Katz, Evgeny, Clarkson University, USA Datskos, Panos G., Oak Ridge National Laboratory, USA Fabien, J. Josse, Marquette University, USA
Editor for Africa Maki K., Habib, American University in Cairo, Egypt
Editors South America Costa-Felix, Rodrigo, Inmetro, Brazil Walsoe de Reca, Noemi Elisabeth, CINSO-CITEDEF UNIDEF (MINDEF-CONICET), Argentina Editors for Asia Ohyama, Shinji, Tokyo Institute of Technology, Japan Zhengbing, Hu, Huazhong Univ. of Science and Technol., China Li, Gongfa, Wuhan Univ. of Science and Technology, China Editor for Asia-Pacific Mukhopadhyay, Subhas, Massey University, New Zealand
Editorial Board
Abdul Rahim, Ruzairi, Universiti Teknologi, Malaysia Abramchuk, George, Measur. Tech. & Advanced Applications, Canada Aluri, Geetha S., Globalfoundries, USA Ascoli, Giorgio, George Mason University, USA Atalay, Selcuk, Inonu University, Turkey Atghiaee, Ahmad, University of Tehran, Iran Augutis, Vygantas, Kaunas University of Technology, Lithuania Ayesh, Aladdin, De Montfort University, UK Baliga, Shankar, B., General Monitors, USA Barlingay, Ravindra, Larsen & Toubro - Technology Services, India Basu, Sukumar, Jadavpur University, India Booranawong, Apidet, Prince of Songkla University, Thailand Bousbia-Salah, Mounir, University of Annaba, Algeria Bouvet, Marcel, University of Burgundy, France Campanella, Luigi, University La Sapienza, Italy Carvalho, Vitor, Minho University, Portugal Changhai, Ru, Harbin Engineering University, China Chen, Wei, Hefei University of Technology, China Cheng-Ta, Chiang, National Chia-Yi University, Taiwan Cherstvy, Andrey, University of Potsdam, Germany Chung, Wen-Yaw, Chung Yuan Christian University, Taiwan Cortes, Camilo A., Universidad Nacional de Colombia, Colombia D'Amico, Arnaldo, Università di Tor Vergata, Italy De Stefano, Luca, Institute for Microelectronics and Microsystem, Italy Ding, Jianning, Changzhou University, China Djordjevich, Alexandar, City University of Hong Kong, Hong Kong Donato, Nicola, University of Messina, Italy Dong, Feng, Tianjin University, China Erkmen, Aydan M., Middle East Technical University, Turkey Fezari, Mohamed, Badji Mokhtar Annaba University, Algeria Gaura, Elena, Coventry University, UK Gole, James, Georgia Institute of Technology, USA Gong, Hao, National University of Singapore, Singapore Gonzalez de la Rosa, Juan Jose, University of Cadiz, Spain Goswami, Amarjyoti, Kaziranga University, India Guillet, Bruno, University of Caen, France Hadjiloucas, Sillas, The University of Reading, UK Hao, Shiying, Michigan State University, USA Hui, David, University of New Orleans, USA Jaffrezic-Renault, Nicole, Claude Bernard University Lyon 1, France Jamil, Mohammad, Qatar University, Qatar Kaniusas, Eugenijus, Vienna University of Technology, Austria Kim, Min Young, Kyungpook National University, Korea Kumar, Arun, University of Delaware, USA Lay-Ekuakille, Aime, University of Lecce, Italy Li, Fengyuan, HARMAN International, USA Li, Jingsong, Anhui University, China Li, Si, GE Global Research Center, USA Lin, Paul, Cleveland State University, USA Liu, Aihua, Chinese Academy of Sciences, China Liu, Chenglian, Long Yan University, China Liu, Fei, City College of New York, USA Mahadi, Muhammad, University Tun Hussein Onn Malaysia, Malaysia
Mansor, Muhammad Naufal, University Malaysia Perlis, Malaysia Marquez, Alfredo, Centro de Investigacion en Materiales Avanzados, Mexico Mishra, Vivekanand, National Institute of Technology, India Moghavvemi, Mahmoud, University of Malaya, Malaysia Morello, Rosario, University "Mediterranea" of Reggio Calabria, Italy Mulla, Imtiaz Sirajuddin, National Chemical Laboratory, Pune, India Nabok, Aleksey, Sheffield Hallam University, UK Neshkova, Milka, Bulgarian Academy of Sciences, Bulgaria Passaro, Vittorio M. N., Politecnico di Bari, Italy Patil, Devidas Ramrao, R. L. College, Parola, India Penza, Michele, ENEA, Italy Pereira, Jose Miguel, Instituto Politecnico de Setebal, Portugal Pillarisetti, Anand, Sensata Technologies Inc, USA Pogacnik, Lea, University of Ljubljana, Slovenia Pullini, Daniele, Centro Ricerche FIAT, Italy Qiu, Liang, Avago Technologies, USA Reig, Candid, University of Valencia, Spain Restivo, Maria Teresa, University of Porto, Portugal Rodríguez Martínez, Angel, Universidad Politécnica de Cataluña, Spain Sadana, Ajit, University of Mississippi, USA Sadeghian Marnani, Hamed, TU Delft, The Netherlands Sapozhnikova, Ksenia, D. I. Mendeleyev Institute for Metrology, Russia Singhal, Subodh Kumar, National Physical Laboratory, India Shah, Kriyang, La Trobe University, Australia Shi, Wendian, California Institute of Technology, USA Shmaliy, Yuriy, Guanajuato University, Mexico Song, Xu, An Yang Normal University, China Srivastava, Arvind K., Systron Donner Inertial, USA Stefanescu, Dan Mihai, Romanian Measurement Society, Romania Sumriddetchkajorn, Sarun, Nat. Electr. & Comp. Tech. Center, Thailand Sun, Zhiqiang, Central South University, China Sysoev, Victor, Saratov State Technical University, Russia Thirunavukkarasu, I., Manipal University Karnataka, India Thomas, Sadiq, Heriot Watt University, Edinburgh, UK Tian, Lei, Xidian University, China Tianxing, Chu, Research Center for Surveying & Mapping, Beijing, China Vanga, Kumar L., ePack, Inc., USA Vazquez, Carmen, Universidad Carlos III Madrid, Spain Wang, Jiangping, Xian Shiyou University, China Wang, Peng, Qualcomm Technologies, USA Wang, Zongbo, University of Kansas, USA Xu, Han, Measurement Specialties, Inc., USA Xu, Weihe, Brookhaven National Lab, USA Xue, Ning, Agiltron, Inc., USA Yang, Dongfang, National Research Council, Canada Yang, Shuang-Hua, Loughborough University, UK Yaping Dan, Harvard University, USA Yue, Xiao-Guang, Shanxi University of Chinese Traditional Medicine, China Xiao-Guang, Yue, Wuhan University of Technology, China Zakaria, Zulkarnay, University Malaysia Perlis, Malaysia Zhang, Weiping, Shanghai Jiao Tong University, China Zhang, Wenming, Shanghai Jiao Tong University, China Zhang, Yudong, Nanjing Normal University China
Sensors & Transducers Journal is a peer review international journal published monthly by International Frequency Sensor Association (IFSA). Available in both: print and electronic (printable pdf) formats. Copyright © 2015 by IFSA Publishing, S. L. All rights reserved.

SSeennssoorrss && TTrraannssdduucceerrss JJoouurrnnaall
CCoonntteennttss
Volume 200 Issue 5 May 2016
www.sensorsportal.com ISSN 2306-8515e-ISSN 1726-5479
Research Articles
Raindrop Kinetic Energy Piezoelectric Harvestersand Relevant Interface Circuits: Review, Issuesand Outlooks Kok Gnee Chua, Yew Fong Hor and Hee C. Lim .............................................................. 1 Rebuilding of a Classical Robotic Systemwith a Modern Control Software and Sensor Signals Michail G. Papoutsidakis, Eleni Symeonaki, Constantinos S. Psomopoulos and Dimitrios I. Tseles ........................................................................................................ 16 ANN Modeling of Electronic Nose Based on Co-doped SnO2 Nanofiber Sensor S. Khaldi and Z. Dibi .......................................................................................................... 24 Research on Apple Odor Collection and Identification Yuchen Jia and Ju Zhhang ............................................................................................... 29 Adaptive Lag Synchronization of a Modified Rucklidge Chaotic System with Unknown Parametersand its LabVIEW Implementation Karthikeyan Rajagopal and Sundarapandian Vaidyanathan ............................................. 37 Synthesis and Characterization of ZnO Nanoparticles Using Sol-gel Process Jayasree Aluri, Sudha Lakshmi P.B and Basaveswara Rao Mandava ............................. 45 LEDWIRE: A Versatile Networking Platform for Smart LED Lighting Applications using LIN-Bus and WSNs Dimitrios D. Piromalis, Konstantinos G. Arvanitis, Panagiotis G. Papageorgas, Dimitrios I. Tseles and Constantinos S. Psomopoulos ...................................................... 50 The Slot Waveguide Theory and its Economic Applications in NanoSensors and NanoTransducers: A Review Zhang Longxiang ............................................................................................................... 60 Research on Mechanical Properties of Concrete Constructs Based on Terrestrial Laser Scanning Measurement Hao Yang and Xiangyang Xu ............................................................................................. 66
Front Cover Page: a new versions of the world’s smallest SDP3x differential pressure sensor from Sensirion: http://www.sensirion.com/sdp3x
Authors are encouraged to submit article in MS Word (doc) and Acrobat (pdf) formats by e-mail: [email protected]. Please visit journal’s webpage with preparation instructions:
http://www.sensorsportal.com/HTML/DIGEST/Submition.htm International Frequency Sensor Association (IFSA).

Sensors & Transducers, Vol. 200, Issue 5, May 2016, pp. 1-15
1
Sensors & Transducers© 2016 by IFSA Publishing, S. L.
http://www.sensorsportal.com
Raindrop Kinetic Energy Piezoelectric Harvesters and Relevant Interface Circuits: Review, Issues
and Outlooks
Kok Gnee CHUA, Yew Fong HOR and Hee C. LIM Center for Applied Physics and Embedded System Research, Tunku Abdul Rahman University
College, Jalan Genting Kelang, Setapak, 53300 Kuala Lumpur, Malaysia Tel.: +603 4145 0123 (x724), fax: +603 4142 3166
E-mail: [email protected]
Received: 10 March 2016 /Accepted: 29 April 2016 /Published: 31 May 2016 Abstract: As an ecological source of renewable energy, the available kinetic energy of rainfall is not trifling, especially in tropical countries at the equators. The research on the use of piezoelectric transducer to harvest raindrop kinetic energy is gaining more and more attention recently. This article reviews the state-of-the-art energy harvesting technology from the conversion of raindrop kinetic energy using piezoelectric transducers as well as its interface circuits for vibration-based energy harvesters. Performance of different types of piezoelectric harvesters in terms of power output, area power density and energy conversion efficiency are compared. Summaries of key problems and suggestions on the optimization of the performance of the piezoelectric harvesters are also provided for future works. Copyright © 2016 IFSA Publishing, S. L. Keywords: Piezoelectric, Transducer, Kinetic energy, Raindrop.
1. Introduction
This Global climate changes is already an alarming issue, the main contribution to this changes is due to the emission of CO2 as a result of burning of fossil fuel and other conventional resources. The search for a reliable renewable energy sources and harvesting of these renewable energies is thus becoming the most urgent challenges for the sustainable development of human civilization today.
In tropical countries such as Malaysia, Indonesia, Philipines, Mymmar, India, Panama, Brazil, Nicaragua, the yearly rain rate were measured to be more than 2000 mm per year [1-2], which were rather significant. Hence, raindrop energy is one of an important renewable energy source in these countries. The main form of energy carries by a raindrop is kinetic energy and when the water drop impacted on
the surface of a hard material, the impact caused mechanical vibration.
Piezoelectric materials are able to convert mechanical energy to electrical energy because of the unique property known as the direct piezoelectric effect. When a piezoelectric material is subjected to a tensile stress or compressive, due to the asymmetric nature of their unit cell, an electric field is generated across the mater, resulting in current flow. Since the piezoelectric material can directly convert mechanical vibration into electrical energy in a simple structure [3-4, 50], it is able to be used to harvest the rain kinetic energy.
Moreover, the mechanism is simple and straightforward, which is important for mass production. Therefore, it has becoming a key material for harvesting the kinetic energy of the falling raindrop. Harvesting raindrop kinetic energy by means
http://www.sensorsportal.com/HTML/DIGEST/P_2818.htm

Sensors & Transducers, Vol. 200, Issue 5, May 2016, pp. 1-15
2
of impacting the piezoelectric material has gained a greater interest in recent years.
Different from macro energy harvesting technology which generates kW or MW level power, piezoelectric energy harvester is a micro energy harvesting technology that generates only mW or μW level power. Therefore, piezoelectric harvester can be a good small scale energy device which is used for powering small scale remote and wireless electronics and self-powered sensors [5-8] that requires to function at low plant load factors.
The most common form of piezoelectric is crystals such as Rochelle salt, quartz, berlinite but they are also found as polymers (plastics) such as polyvinylfluoride (PVF), polyvinylidene fluoride (PVDF), porous Polypropylene (PP), fluoroethylenepropylene (FEP) and ceramics such as barium titanate (BaTiO3), lead titanate (PbTiO3), lead-zirconate (PbZrO3), lead zirconate titanate (PZT) and etc.
The two mainly used materials were PVDF and PZT and the two main structures used were cantilever beam structure and bridge structure. Wong, et al. [9] have done a survey on piezoelectric water drop energy harvesting in 2014, however, comparison of performances of such types of harvesters in terms of energy conversion efficiency and area power density are still lacking.
In this paper, the main focus is on the water drop kinetic energy harvesting using piezoelectric transducers and the performance of the piezoelectric transducers. More types of harvesters and latest publications were reviewed and discussed in this paper. Since the available energy of water drop is very small, the conversion efficiency of the interface circuit also becomes an important issue. In the literature, several solutions were suggested to enhance the circuit conversion efficiency of the interface circuits for vibration based piezoelectric harvesters [34-49]. Template provides authors with most of the formatting specifications needed for preparing their articles. 1.1. Rate, Raindrop Diameter, Terminal
Velocity and Kinetic Energy
According to the NASA website [10], there are four types of rains i.e. light stratiform rain (LSR), moderate stratiform rain (MSR), heavy thunderstorms (HT) and Violent. Table 1 shows the raindrop sizes, meteorological experimental terminal velocities [11].
Beard [12] showed that the velocity of raindrops with D ranging from 4 mm to 7 mm can have velocity at 9 m/s - 13 m/s prior to reaching the ground.
By assuming the rain droplet is a sphere, when the air drag force is equal to the gravitational force, terminal velocity is achieved, the terminal velocity equation [31] of a rain droplet is
= , (1)
where r is the radius of the rain droplet, g = 9.81 ms-2, density of water at 1 atm, ρwater=999.97kg/m3=0.99997g/cm3, ρair=1.227 kg/m3, drag coefficient for a sphere Cd = 1.225.
Table 1. Rain fall rate per hour of different types of storms.
Type of Storm
Rate [10]
Largest diameter of a raindrop (mm) [11]
Terminal velocity (ms-1) [11]
Light rain
2 – 4 mm/hr
2.0 6.49
Moderate rain
5 – 9 mm/hr
2.6 7.57
Heavy rain
10 – 40 mm/hr
5.0 9.09 or 10 [12]
Violent > 50
mm/hr N/A N/A
Note: 1 mm rainfall equals 1 litre of water over an area of one m2.
Saikia, et al. [13] observed at May 2006 that the raindrop diameter D had the range from 0.5 mm to 4.5 mm. The distribution shows that the mode of raindrop diameter is at 2 mm and the mean was around 2.5 mm. The raindrop size data collected by Mazuki, et al. [14] in Kotatabang in Indonesia during 2012 showed that the largest raindrop diameter is about 8.5 mm. The largest raindrop size could be larger in 2016 and in future.
Mass of rain droplet in a = = 43 2
(2)
Kinetic energy of one rain droplet of diameter D:
23
2
23
4
2
1
2
1twatert v
DmvK
== πρ (3)
Taking D = 5 mm (assume it is the mean diameter) for example, and assume the rain droplet is a sphere, then its volume,
33
cm 0654.02
5.0
3
4 =
= πV (4)
Mass of rain droplet in a
m = ρwater × V = 0.065 g (5)
Kinetic energy of one rain droplet of diameter 5 mm:
( ) mJ 27.310)105.6(2
1 25 =×= −K (6)
For instance, according to the World Bank, the average precipitation in depth (mm/yr) in Malaysia

Sensors & Transducers, Vol. 200, Issue 5, May 2016, pp. 1-15
3
was last measured at 2875 mm in 2011. This means there are
7.88 mm/m2/day = 7.88 litres/m2/day
≅ 7.88 kg/m2/day
7.88×10³/0.065 drops/m2/day
= 1.2×10⁵ drops/m2/day Hence, the area energy density available per day,
ED = 1.2 × 10⁵ drops/m2/day × 3.27 mJ ED = 0.395 kWh/m2/day or
ED = 144.7 kWh/m2/year The available rainfall kinetic energy is not low,
though the raindrop kinetic energy density per day is about one twelfth of the average solar power available i.e. approximately 5 kWh/m2/day [15].
For small scale electronics, the available rainfall energy density is more than enough for its energy requirement. 1.2. Working Principles
After impacted by a water drop, the kinetic energy of the water drop is converted into the vibration energy and the electromechanical coupling of the piezoelectric transducer converts this vibration energy to electrical energy (Fig. 1(a)). Fig. 1(b) is the interface circuits, it helps to extract more energy from the piezoelectric transducer. The energy, average power and peak power output of transducer due to the impact of water drop(s) are:
Harvested energy
dtR
tVE
TotalT
L=0
2)( (7)
Average harvested power,
totalave T
EP = (8)
Peak harvested power,
L
peakpeak R
VP
2
= , (9)
where Q is the total charge transferred from the piezo transducer to the detector, V(t) is the oscillating voltage response recorded by the detector, Ttotal is the total length of time of oscillations due to one or more water drop impacts, Vpeak is the peak voltage, Cpiezo is the capacitance of piezo transducer, m is the mass of the water drop, v is the final velocity of the water drop prior to impact, RL is the load resistor.
(a)
(b)
Fig. 1. (a) Diagrams of raindrop energy piezoelectric
harvester. (b) Output voltage of piezoelectric upon impact of water drop.
The overall power conversion efficiency consists of three parts i.e.
rectifypiezoimpact1 ηηηη ××= , (10)
where ηimpact is the impact efficiency, ηpiezo is the piezoelectric efficiency, ηrectify is the rectify circuit efficiency.
Generally, the impact mechanism of a water drop falling onto a solid surface can be divided into three main categories i.e. bouncing, spreading and splashing. The impact of a water drop on the surface of a harvesting device is expected to exhibit a mixture or all of these mechanisms. Various studies show that the dominant impact mechanism of a water drop is one that involved splashing [26]. The impact mechanism is an important factor which will significantly influence the efficiency of conversion of kinetic energy to piezoelectric mechanical energy i.e. ηimpact of the harvesting device and its power output. On the other hand, ηpiezo is greatly depending on the electromechanical coupling efficiency (mostly the 31-mode piezoelectric strain coefficient d31) of the piezoelectric material used. As interface circuit plays an important role in helping the harvester device to extract energy from the energy generated in the piezoelectric as a result of impact of water drop, the interface circuit efficiency i.e. ηrectify is solely affected by the choice of interface circuits.
2. Types of Energy Harvesters 2.1. Raindrop Energy Harvesters
Till recently, there are five types of structures of
raindrop kinetic energy piezoelectric harvesters reported, (Fig. 2).

Sensors & Transducers, Vol. 200, Issue 5, May 2016, pp. 1-15
4
1. Bridge [9, 16, 20] 2. Cantilever [9, 17-25, 28] 3. Membrane [26] – computer simulation only 4. Collecting diaphragm and piezoelectric
cantilevers [27] – computer simulation only 5. Edge-anchored PZT plate [31] – computer
simulation only
Fig. 2. Different types of raindrop kinetic energy piezoelectric harvesters: (a) Bridge-structure; (b) Cantilever structure with impact point near the free-end; (c) Cantilever structure with six impact points at varies surface locations; (d) Cantilever structure with impact point at the centre; (e) PVDF membrane or PZT edge-anchored plate; (f) Collecting diaphragm cantilevers.
The three piezoelectric materials used were
piezopolymer (PVDF), piezoceremic (PZT) and PMMO/GO. [29], the first two were the most widely used materials. The details of all types of harvesters are shown in Table 2.
The first raindrop kinetic energy piezoelectric harvester was proposed by Guigon, et al. [16, 30] using polypiezo material, it was a bridge-type structure made of a monostretched PVDF with 25 μm thickness (piezoelectric strain coefficient d31 = 15 pC N-1) and another one was a bistretched PVDF with 9 μm thickness (d31 = 5 pC N-1) (Fig. 2(a)). The area of these two energy harvesters was 10 cm×3 mm. With the assumption of that a raindrop, on impact, produces a perfectly inelastic shock. Their numerical simulation shown that a single downpour raindrop of 5 mm in diameter might be able to recover 25 μJ energy and 12 mW of power. Their experimental results showed that the impact of an artificial raindrop of diameter 3 mm and velocity 4.5 ms-1 were able to produce 147 nJ energy and 73 μW power. They found that the monostretech 25 μm PVDF was much more effective than the bistretched 9 μm PVDF.
Cantilever piezoelectric beam as shown in Fig. 2(b) is the most general used structure in vibrational based piezoelectric harvesters. In water drop impact energy harvesting application, Vatanserve, et al. [17] compared the performance of the cantilever harvesters made of PVDF and PZT strips respectively. There were four types harvesters with different piezoelectric materials and number of layers, namely short PVDF, long PVDF, PZT-unimorph, and PZT-bimorph with respective dimensions were 41×16×0.2 mm3, 171×22×0.2 mm3, 140×15×0.32 mm3 and 140×15×0.75 mm3. The piezoelectric voltage constants of the PVDF and PZT materials in 31-mode (d31) were 216×10-3 VmN-1 and 10×10-3 VmN-1, respectively. Their results revealed that PVDF harvester outperformed both unimorph and bimorph PZT harvesters, short PVDF was also better than the long PVDF. In their experiment, water drop of mass 7.5 mg and 50 mg were released from the heights ranging from 20 cm to 100 cm. When the tips or free-ends of the cantilevers of the harvesters were impacted by the 50 mg water drop released at the maximum height of 100 cm, the peak voltage generated by the short PVDF harvester was 12 V, whereas the PZT harvester generated less than 2.5 V. They attributed the low voltage output of the PZT energy harvester to the rigidity (and hence low d31) of the ceramic material which hindered the oscillations after impacted by the water drops.
F. Viola, et al. [18-19] and Rosario Miceli, et al. [20] also conducted experiments on two types of raindrop energy harvesters i.e. bridge-type structure and cantilever-type structure, the difference was that the formal was made of PZT and the latter was made of PVDF. The two types of piezoelectric used were the commercial piezoelectric transducers. The dimensions of the bridge-type structure was 25.4 mm × 93.81 mm × 90.7874 mm, while the dimensions of the cantilever-type structures were 3.3 mm × 25 mm - 30 mm and 30 mm × 12 mm, respectively. In addition, they also studied a cantilever-type harvester with two sets of PVDF transducers arranged in parallel. In their study,

Sensors & Transducers, Vol. 200, Issue 5, May 2016, pp. 1-15
5
they reported that the single PVDF transducer cantilever structure produced the highest power, the double PVDF transducer cantilever produced lower power; whilst, the power produced by the bridge PZT structure was the lowest. The single PVDF transducer
cantilever structure produced the maximum peak power of 4.5 μW when the load resistance was 47 kΩ, while the same load resistance only produce maximum peak power of 0.9 μW for PZT transducer.
Table 2. Information of various types of piezoelectric harvester for harvesting raindrop kinetic energy.
Single drop Peak Voltage/Power
(Load Resistance)
Dimensions (length × width × thickness)
Types of Piezoelectric
Type of harvester structures
Authors (Year)
D=3 mm - 17.62 V, D=1.6 mm - 4.68 V
10 cm × 3 mm × 25 μm (and 9 μm)
PVDF membrane
Bridge R. Guigon, et al.
[16] (2008)
12 V, 2.2 V
16 × 4 × 0.2 mm3-short 140 × 15 × (0.32 or 0.75) mm3
PVDF PZT Cantilever D. Vatansever, et al.
[17] (2011)
N/A 1 m × 1 m PVDF Piezoelectric membrane
C. Perera, et al. [26] (2011)
0.9 μW (47 kΩ) 4.5 μW (47 kΩ)
1.75 μW (68 kΩ) (for 2 parallel PVDF)
25.4 × 3.81 × 0.78 mm3 2.5 – 3.0 cm × 0.33 cm
PZT PVDF Bridge
Cantilever F. Viola, et al. [18]
(2013)
6 V (5 MΩ) 3 cm × 0.33 cm PVDF Cantilever F. Viola, et al. [19]
(2014)
0.12 μW (82 kΩ) 5 μW (47 kΩ)
30 mm × 12 mm N/A
PZT PVDF Bridge
Cantilever
Rosario Miceli, et al. [20] (2014)
1.55 V/0.16 mW (15 kΩ) [22]
46.355 mm × 38.1 mm × 0.33 mm PZT Bimorph Cantilever V. K. Wong, et al.
[21, 22] (2014)
Vpeak = 1.003 V Vpeak = 3.52 V
30 mm × 4 mm × 25 μm
(25 μm is the best) PVDF
Cantilever Bridge
C. H. Wong [9] (2014)
Vpk-to-pk = 0.8 V (10 kΩ), 23 μW
20 mm × 8 mm × 0.58 mm 5 layer of PZT thick
films Cantilever
M. Al Ahmad [23] (2014)
N/A 80 mm ×28 mm PVDF Leaf
cantilever S. Gart, et al. [28]
(2015) 2.3 μW (2.2 MΩ) 25 × 13 × 3 mm3 PVDF Cantilever Ilyas [25] (2015)
C. H. Wong [9] also compared two different types of energy harvester i.e. bridge-type and cantilever-type structures, the only difference was both harvesters were made of PVDF in their experiments. In his experiment, the highest output voltage of the two types of harvesters when impacted by a drop of diameter 5.77 mm from the height of 1 m were 3.502 V and 1.003 V, respectively. The results indicated that the bridge-type harvester were better than cantilever-type harvester when both were made from the same piezoelectric material as well as with the same dimensions.
Ahmad [23] examined the five-layer PZT clamped-free cantilever energy harvester, the dimensions of the cantilever was 25 mm×3 mm×0.58 mm. Two sets of different experiments were conducted for impacting the cantilever at two different drop intensity, namely one at 75 drops/s drop intensity and the other was at 200 drops/s. The mass of a water drop was 0.23 g with drop speed of 3.43 m/s. From their experiment, 0.3 μJ/drop energy was harvested at 75 drops/s drop
intensity while at moderate drop intensity of 200 drops/s, the energy output of the harvester yield a total energy of 400 μJ. At 200 drops/s drop intensity, the instantaneous power was measured to be of 192 μW with a load of 10 kΩ. Apart from that, they also investigated how the proof mass affects the output voltage when the cantilever was impacted with different water drop mass.
Gart, et al. [28] studied how falling raindrops affected cantilever beam which was made of polycarbonate and PVDF with different surface properties, length, width and impact velocity. From the numerical and experimental results of the beam made of the two types of materials, they found that wettable beams experienced higher bending energy. The wettable PVDF cantilever with dimensions of 8 mm×28 mm harvested greater electric energy, especially at higher impact velocities. For a water drop of radius 1.73 mm, at its maximum speed, the electrical energy generated by the piezoelectric cantilever was 23 nJ.

Sensors & Transducers, Vol. 200, Issue 5, May 2016, pp. 1-15
6
Most of the studies of the energy harvesters were done on impacting the dry surface harvesters by water drops, but in reality, this is not possible. V. K. Wong [21] studied the dynamics of a PZT bimorph cantilever beam, the dimensions of the cantilever was 46 mm×33 mm×127 μm. They impacted the free-end of the cantilever beam with and without the presence of water layer. The rms voltage produced without water layer was numerically and experimentally found to be larger than that of rms voltage produced with water layer. This indicated that the power output of the cantilever beam was lower at the presence of water layer. In another experiment [22], they utilized six syringes connected to six solenoid valves to produce 4.5 mm diameter water drops. The water drops were produced one by one at a controlled rain rate to impact different surface locations of the cantilever beam, as shown in Fig. 2(c). The three different rain rates were light stratiform rain (LSR), moderate staratiform rain (MSR) and heavy thundershower (HT). The voltage produced was largest when the water drop was impacted close to the free-end of the cantilever and was lowest when the impact location located near the fix-end of the cantilever. This is because, larger strain was produced when water drop impacted locations close to the free-end of the cantilever and hence more energy was converted. The average power for three different rain rates, LSR, MSR and HT were 0.52 μW, 1.01 μW and 1.84 μW. From the investigation of different resistive loads, 15 kΩ were found to generate maximum peak power of 0.16 mW.
Ilyas, et al. [25] developed a cantilever-structure energy harvester which composed of four different layers i.e. silicon, polyamide, Al and PVDF with the dimension of 25×13×3 mm3. They tried to find the optimum thickness of the electrode layer and the PVDF layer for obtaining a maximum displacement upon impacted by a water drop. They found that when PVDF thickness was 150 μm and Al thickness was 35 μm, a maximum displacement of 2800 μm was obtained. They connected different load resistances ranging from 1 MΩ - 4.7 MΩ to the piezoelectric transducer. They found the total mean power were generally below 2.5 μw and a maximum energy harvested was around 85 nJ when the energy harvester was subjected to the impact of a water droplet of radius of 2 mm and velocity 2.13 ms-1. With the optimal load resistance of 2.2 MΩ, the maximum efficiency was found to be around 0.11 % at v = 2.13 ms-1. By employing the information gather from their experimental results, they calculated the mean output power of a theoretical harvester array model under the rainfall of 32 mm (32 L per m3) with 80 % active harvesting area. Within the duration of 300 s, the highest mean output power at different drop velocity for a 1 m2, 10 m2 and 100 m2 harvester arrays were calculated to be 150 μw (2.13 ms-1), 160 mW (2.13 ms-1) and 3.5 W (9.62 ms-1), respectively.
Apart from cantilever-structure and bridge-structure, Perera [26] proposed a 1 m×1 m PVDF piezoelectric membrane as shown in Fig. 2(e). They performed simulations for impacts of varies drop sizes of the rain at different rain rates such as LSR, MSR and HT. The largest energy harvested was 2.72×10⁻³² J and highest power output was 2.23×10⁻²⁹ W for the impact of the largest drop size during the HT rain.
Fig. 2(f) shows a new piezoelectric harvester theoretical model presented by C. H. Wong [27] i.e. a collecting diaphragm and PVDF piezoelectric cantilevers energy harvester which consists of five layers i.e. silicon, polyimide, aluminium bottom, PVDF and Al top. They performed simulation for varies thickness layers with finite element method. In their work, thickness of PVDF ranging from 120 to 200 μm and thickness of Al ranging from 20 – 40 μm were investigated. The max-displacement was obtained when a pressure of 13.718 MPa was applied on the center of the harvester.
Miao and Jia [31] studied the strain distribution of a 50 mm×50 mm edge-anchored piezoelectric plate made of PZT-5H when impacted by 5 mm raindrop at various locations. Their simulation using COSMOS Multiphysics software indicated that multiple arrays of small edge-anchored plates would be significantly better than a single large plate anchored at far edges.
Valentini, et al. [29] deposited the poly(methyl methacrylate)/graphene oxide (PMMA/GO) film on top of a glass substrate to make the energy harvester. The PMMA/GO is a type of piezoelectric, output power of 6 nW was generated when impacted by a 5 μg water drop released from a height of 0.2 m. Different from all of the previous energy harvesters, this piezoelectric transducer worked in 33-mode.
2.2. Hybrid Energy Harvesters
As solar energy is more sustainable energy source, photovoltaic (PV) or solar cell becomes the most popular renewable energy systems in the last two decades. However, the main setback for solar energy is its seasonal availability i.e. during monsoon seasons, the power output is greatly degraded due to cloud covering. Moreover, the operational condition of the ideal silicon-based solar cell is best at a relatively cold and sunny environment rather than the humid and hot climate region. Hybrid systems that complement each other should be a good option, for instance, a hybrid rain energy and solar energy harvesters in which rain energy harvesters to cover for the heavy rainfall when solar cell energy output is low and wind turbines during the windy and cloudy days.
The team of E. Siores, et al. [32] in University of Bolton’s Institute of Materials Research and Innovation (IMRI) has developed a hybrid piezoelectric-photovoltaic device at the form of films and fibres, which was able to harvest raindrop, wind and solar energy. The hybrid films and hybrid fibres

Sensors & Transducers, Vol. 200, Issue 5, May 2016, pp. 1-15
7
were created by depositing the organic solar cell on a PVDF film and the fibres respectively. At one sun intensity, the open circuit voltage and short circuit current of 0.43 V and 4.48 mA/cm2, respectively, were obtained from the flexible hybrid film. The hybrid film also generated a peak power of 85 μW at wind speed of 10 m/s [33]. They did not conduct experiments to test the conversion efficiency of their hybrid energy harvesters for harvesting the water drop kinetic energy.
3. Performances of Raindrop Impact Piezoelectric Energy Harvesters
Most of the power harvested from the raindrop kinetic energy piezoelectric energy harvester are at the range of μW [18, 20, 23, 25]. C. H. Wong [9] shows that bridge-type harvester converted more power than
cantilever-type energy harvester, both are made of PVDF. The experiment conducted by V. K. Wong [22] found that their piezoelectric cantilever made of PZT was able to obtained 0.16 mW per drop. This is the highest harvested power per drop ever reported. However, it is still at least two order magnitude smaller if compare to the 12 mW peak power simulated by Guigon, et al. [30] using bridge-type harvester.
Output peak power is not a good parameter for comparison between different energy harvesters. Instead, the best parameter for the comparison is the energy conversion efficiency (ηE) of the energy harvester (Table 3). However, none of the published papers to date, except Miao and Jia [31] have quantified the conversion efficiencies of their devices. Due to lacking of certain information, it is only possible to compute the energy conversion efficiency of a few of the harvesters.
Table 3. Energy conversion efficiency of various types of piezoelectric raindrop kinetic energy harvester.
Authors Type of harvester
structures Water drop D or m
v or h
Harvested energy /Kinetic energy,
E/ Ek
Energy Conversion Efficiency
ηE = E/Ek × 100 %)
R. Guigon, et al. [16]
Bridge (PVDF)
D = 3 mm, v = 4.5 ms-1
D = 1.6 mm v = 3.2 ms-1
147 nJ / 0.143 mJ
16 nJ / 0.011 mJ
0.1 %
0.146 %
V. K. Wong, et al. [21, 22] (2014)
Cantilever (bimorph PZT)
LSR
MSR
HT m = 47.7 mg v = 3.7 ms-1
*6.5 μJ/1.96 mJ *12.625 μJ/3.92 mJ
*23 μJ/5.88 mJ
0.33 %
0.32 %
0.39 %
M. Al Ahmad [23]
Cantilever (5 layer PZT)
m = 0.23 g v = 3.43 ms-1
0.08 μJ / 1.353 mJ (75 drop /s)
1.739 μJ/1.353 mJ (at 200 drop/s intensity)
0.006 %
0.128 %
S. Gart, et al. [28] leaf cantilever
(PVDF) D = 2 × 1.73 mm 23 nJ / 62 μJ 0.037 %
Ilyas, et al. [25] Cantilever (PVDF)
D = 4 mm, v = 2.13 ms-1
E = 0.5 × (0.0335) × v2
= 27.4 μJ – 76 μJ
85 nJ / 76 μJ 0.11 %
Note: D is the diameter of a raindrop and h is the released height of the raindrop and “*” means the harvested energy was the total energy as a results of water drop impacts at various location of the harvester, the value should be at least two times lesser than the energy compare to when all of the water drops impacts were on the free-end of the harvester.
For a single drop impacted near the free-end of the cantilever-type or the centre of the bridge-type energy harvester, the efficiency ηE for cantilever-type harvester made of PZT was the highest i.e. approximately 0.39 % [22] (ηE should be more than double of this value if all of the water drops were impacted near the free-end of the cantilever), which is an order magnitude higher than the efficiency of the cantilever-type harvester made of PVDF [28] i.e. 0.037 %; whilst the highest efficiency for bridge-type harvester made of PVDF was approximately 0.146 %
[16]. It shows that PZT-made energy harvester had a higher energy conversion efficiency, despite the fact that, Vatansever, et al. [17], Viola, et al. [18] and Rosario Miceli, et al. [20] all showed that PVDF outperformed PZT in harvesting raindrop kinetic energy application. The reason could be due to the PZT used in [22] had a piezoelectric constant d31 of -190 pC N-1 (or 25.9×10⁻³ Vm N-1), while it was 10×10-3 Vm N-1 in the case of Vatansever, et al. [17]. Other reasons could be due to the differences in dimension and number of piezoelectric layers used.

Sensors & Transducers, Vol. 200, Issue 5, May 2016, pp. 1-15
8
Ilyas, et al. [25] obtained 0.11 % efficiency using a PVDF cantilever, the efficiency could be few times higher if the water drop was impacted near the free-end instead of the centre of the piezoelectric cantilever. This can be seen by the peak voltage generated by impacts of water drops at various location in the experiment of V. K. Wong, et al. [22].
At moderate rain rate i.e. 200 drops/s, Ahmad [23] demonstrated that when the oscillations due to two consecutive impacts superimposed, the energy output and the efficiency could be raised to 1.739 μJ/drop and 0.128 %, respectively. This is a lot higher than the single drop impact efficiency of 0.006 % [23]. The overall conversion efficiencyηE for an energy harvester could also be affected by the mass and terminal velocity (or kinetic energy) of the water drop, for example, in the experiment of Guigon, et al. [16], the efficiency of their bridge-type harvester when impacted by raindrop with K.E. of 0.011 mJ was 0.146 %, whilst when impacted by a raindrop with K. E. of 0.143 mJ was 0.1 %. The loss was due to splash, which was 46 %.
As shown in Fig. 3 are the plots of the two-types of area power density i.e. single drop maximum peak power density (PDpeak) [16, 18-23, 31].
Fig. 3. Graph of maximum peak power density PDpeak of various types of raindrop kinetic energy piezoelectric
harvesters [16, 18-23, 31].
Most of the papers calculated the single drop impact maximum peak power density PDpeak of their piezoelectric transducers. All of the raindrop energy harvester to date, has a very small PDpeak. The highest PDpeak was achieved by the PVDF bridge-type energy harvester 0.24 W/m2 or 240×10-3 W/m2 [16] followed by the PZT cantilever-type energy harvester studied by Ahmad [23], which was 144×10-3 Wm-2 (the author claimed that their power density was 4950×10-3 Wm-2). At 200 drops/s drop intensity, their peak power density was 2560×10-3 Wm-2. Practically, the average power density PDave is a better indicator of performance of an energy harvester per unit area due to the fact that the location where raindrops impinged is not always at the free-end. For example, at MSR rain
rate, PDave of 0.57×10⁻³ Wm-2 (Pave was 1.01 μW) was lower than PDpeak of 90×10-3 Wm-2 [22]. Power density is also affected by rain rate, for example, LSR rain rate PDave was lower i.e. 0.29×10⁻³ Wm-2 [22] (Pave was 0.52 μW).
Note: PDpeak = PSpeak /A, PDave = Pave /A, PSpeak is the maximum peak power generated when the piezoelectric transducer was impacted by a single water drop at the location near the free-end of a cantilever or the centre of the bridge-type piezoelectric transducer, Pave is the average power generated when the piezoelectric transducers was impacted by multiple water drops at a certain rain rate or drop intensity and at different surface location of the piezoelectric transducer; and A is the top surface area of the piezoelectric transducer. 4. Interfacing Circuit
Generally, there is a need for the harvested energy
to be stored in the storage devices such as battery or capacitors. In order to do that, an AC-to-DC converter such as a full-bridge rectifier circuit is needed to act as an interface circuit. In piezoelectric vibration-powered generators, the full-bridge rectifier circuit [34-35] as the so-called “standard circuit” (Fig. 4) was the most commonly used circuit.
Fig. 4. Standard interface circuit i.e. full-bridge rectifier AC-to-DC converter with capacitor and load resistor.
4.1. Buck-Boost Converter Circuits It is almost impossible to always match the circuit
impedance with the optimum load required when standard circuit was used. Hence, DC-to-DC converter (Fig. 5) which converts and regulates voltage level is essential to provide a fix output voltage to the energy storage device and a fix optimum impedance to the transducer regardless the actual circuit load connected. Among the DC-to-DC converters, buck-boost converter [36–38] which controls its output voltage level based on the duty circle of the switching transistor is a good candidate. Leteuver, et al. claimed that an 84 % high efficiency and maximum harvester power of 1.5 mW was achieved by the buck-boost converter that can track the dependence of power generator with acceleration and vibration frequency of piezoelectric device [36].

Sensors & Transducers, Vol. 200, Issue 5, May 2016, pp. 1-15
9
Made, et al. [38] investigated buck boost circuit in discontinuous conduction mode circuit (DCM). The converter operated in DCM was able to isolate its input and output impedance, hence provide a constraint input impedance that was matched with the optimal load of the energy harvester. The efficiency was higher because of the switch-based rectifier provided lower voltage drop than traditional diode-based rectifier. The input impedance was governed by the switching frequency and duty cycle and also the inductor size. This adjustable input impedance of the Buck Boost circuit allowed optimum piezoelectric energy harvesting based on impedance matching principle.
However, the optimal load will vary with change of frequency of transducer for raindrop application. Ottman, et al. [39] presented a more complex DC-to-DC converters based on current sensing. Experimentally they showed that the use of the adaptive dc–dc converter increased power transfer by over 400 % as compared to when the standard circuit was employed. The drawback is that this method is more energy consuming.
Fig. 5. Interface circuits consisting of AC-to-DC converter and DC-to-DC converter.
4.2. Synchronized Switch Harvesting on Inductor (SSHI) Circuits
The main constraint of the standard circuit
(Fig. 6) is that a rather large portion of charge generated by the transducer has been used to charge up its own internal capacitor, leaving only a small portion to be delivered to the external capacitor CL. This loss in charge reduces the amount of electrical energy that can be harnessed and hence the rectifying efficiency of the standard circuit.
To further improve the rectifying efficiency of the bridge-type rectifying circuit, a non-linear circuit which could extract charge synchronously was proposed. As depicted in Fig. 7, the charge generated is extracted whenever the piezoelectric voltage reached the maximum point or minimum point. This discharging process is controlled by a switch which was connected to a control circuit [40-41].
Fig. 6. Interface circuits consisting of AC-to-DC converter and DC-to-DC converter and a non-linear circuit, the non-linear circuit can be placed before or after
the AC-to-DC converter.
Fig. 7. (a) Input voltage waveform Vpiezo(t) of piezo transducer under periodic mechanical vibration; (b) Non-linear circuit; (c) Output voltage waveform Vnon(t) of the non-linear circuit and control signal.
Lallart and Guyomar [42] developed a Synchronized Switch Harvesting on Inductor (SSHI) with an efficiency of 160 % over standard rectifier.
Ramadass and Chandrakasan [43] presented a bias-flip rectifier using on chip and off-chip diodes and inductors of different values. The output power obtained was in the range of μW. Using off-chip diodes, they managed to extract 4 times higher power. When on-chip diodes were used, the improvement in power extraction increases to above 7 times.
Using displacement sensor, the synchronized charge extraction technique with inductor connected either in series or parallel to the piezo transducer was proposed by Lefeuvre, et al. [44], resulting in the increase of the harvested power by at least factor of 4, and reach maximum of 15 compare to standard interface circuit.
Other type of interface circuit is the rectifier free piezoelectric energy harvester (Fig. 8) proposed by Kwon, et al. [45], the efficiency achieved was 71 %.
Fig. 8. Rectifier-free piezoelectric energy harvesting circuit [45].

Sensors & Transducers, Vol. 200, Issue 5, May 2016, pp. 1-15
10
For low input piezoelectric amplitude voltage i.e. less than 1 V, Peters, et al. [46] suggested two stage concept including a negative voltage converter (passive stage) and only one active diode. The efficiency was over 90 % and the power consumption was measured to be 266 nW.
An improved version of two-stage rectifier was presented by Li, et al. [47], the second stage was replaced by a comparator controlled active diode rectifier works, resulting in a wider input range i.e. amplitude of 0.45 till 1.8 V. the peak power conversion efficiency and power conversion efficiency achieved were 96 % and 90 %, respectively. The power consumption was 197 nW.
4.3. Pre-bias Circuit
Electrical energy is generated when the external force is damped by the piezoelectric transducers. However, limited by the intrinsic shunt capacitance, the transducer operated with a resistive load is often hard to provide sufficient damping force [49].
Compared to an optimised purely resistive load, which were the circuit utilized by most of the energy harvesters reported [16-30], Dicken, et al. [48] showed that it is possible to increase the damping force of the piezoelectric transducers by a circuit they designed.
They designed a dedicated circuit that was able to synchronously discharge the generated charge to the load at the maximum or minimum point of each cycle and immediately followed by a pre-charge step. With assumption that the charge oscillation is in phase with the vibration of the piezo cantilever, the processes are illustrated in Fig. 9. The charging circuit they used comprised of a H-bridge with an inductor. Pre-charging caused the piezo cantilever to bend in a larger amplitude and, hence, larger output voltage. The net energy output, Epre = discharge energy – energy to charge piezo to VB
( )
−Δ+=
C
BBdpre
VVVCE
ηη
22
2
1 (11)
Epre is larger than the energy output without pre-
biased i.e. ( )[ ]2
2
1VCE d Δ= η .
They showed that by using the pre-biasing circuit, the efficiency of the piezoelectric transducer could be improved by at least 2 times and at most to be more than 10 times. Their circuit was designed for an un-dampable oscillating source only, it does not work for the raindrop energy harvest which provides a damped oscillating source.
5. Issues and Outlook From the authors literature review, the efficiency
of the raindrop kinetic energy piezoelectric harvester is still too low to be commercially implemented.
(a)
(b)
(c)
Fig. 9. (a) Pre-biasing circuit output voltage Vo(t), the piezo cantilever is synchronous discharged (Vdischarge) from point I till point II, followed by pre-biased of potential difference VB to point III; the cantilever bended upward producing highest negative voltage at point IV; it is synchronous discharged again till point V followed by another pre-bias process, the processes are repeated. (b) The movements of cantilever and charges corresponding to the processes I - VI. (c) The movements of cantilever and charges without pre-biasing circuit and the transducer output voltage Vpiezo(t). The amplitude of deflection in terms of angle for pre-bias process θprebias is larger than θ.
However, the simulation result of Guigon, et al. [30] showed that the peak power could reach 12 mW and the efficiency at 2.5 % ((25 μJ)/1 mJ). Besides, in the studies of piezoelectric energy harvesting from constant vibration sources, Shu, et al. [52] indicated that the 46 % conversion efficiency can potentially be achieved. This means there are still rooms for improvements. The areas of improvements and some important issues:
5.1. Optimization of Impact Efficiency Problem of splash becomes an important impact
mechanism when the raindrop size and kinetic energy becomes large [9, 16] and this could greatly reduce the impact efficiency, ηimpact. Studies by Sikalo, et al. [53-54] showed that water drop impact mechanism depends on angle of impact, surface material

Sensors & Transducers, Vol. 200, Issue 5, May 2016, pp. 1-15
11
properties, and etc. This implies that the impact efficiency can be significantly enhanced by engineering the harvester surface properties and profile.
The energy harvested of a piezoelectric cantilever beam is affected by type of surface. A hydrophilic surface which caused the water drop to stick better on the surface of the piezoelectric cantilever, could increase the power output [28]. Conversely, water accumulation on the cantilever surface caused power output to decrease [21], thus, a new design must consider having a stickier surface and yet preventing water accumulation on the surface of the harvester.
5.2. Optimization of Piezoelectric Efficiency
As depicted in Fig. 10, the strain of a rectangle shape piezoelectric beam structure is not uniform along the whole length, it is largest at the fix-end and linearly reduced to the free-end [55]. As the electric charge generated in piezoelectric beam is directly proportional to the strain the transducer undergone, the energy generated or piezoelectric efficiency (ηpiezo) would be small.
Fig. 10. Piezoelectric cantilever of different shapes and their corresponding strain versus length graph [55].
As suggested by Rosario Miceli [20] and S. Roundy, et al. [55], to maximize energy, the geometries must be designed so as to produce as uniform and as large a strain as possible. Trapezium shape piezoelectric beam suggested by [20, 55] can produce a more uniform strain on the piezoelectric beam and thus larger energy output. Rosario Miceli, et al. [20] also suggested that energy output can be increase by pressed the cantilever against a suitably shaped profile. Therefore, an optimum shape of a piezo transducer or shaped profile should be developed for raindrop energy harvester.
Properties of piezoelectric is a key factor that dictates the low ηpiezo for a piezoelectric energy harvester, thus, new ways have to be found to overcome this limitation. Apart from searching for new piezo material that could have a high piezoelectric coefficient, the pre-biasing technique developed by Dicken, et al. [48] to enhance the damping force of the piezoelectric transducers could also be a good choice
to increase the conversion efficiency. Although their circuit was only designed for an un-dampable oscillating source that it would not work for the raindrop energy harvester which provides a damped oscillating source, new circuit based on the same concept could still be developed.
A more important issue is the power generated per unit area (PD), PD of rain harvesters are very low. As illustrated by V. K. Wong, et al. [22], power output due to water drop impact decreased gradually from the free-end of the cantilever to the fix end. The piezoelectric cantilever beam [9, 17-25, 28] has one fix-end; the bridge-type harvester [9, 16, 20] has two fix-end and the fix-end of the device of C. H. Wong [27] are all around the circumference. The new type of harvester should be designed in such a way that there is no fix-end(s).
Instead electricity generation via the direct impact of raindrops on the piezoelectric transducer, another approach is to generate electricity indirectly using piezoelectric watermill or turbine. Since the falling speed of the raindrops had reached their terminal velocity far before hitting the ground, and the kinetic energy of the raindrops are proportional to the square of their terminal velocity, it makes no difference in the energy output between harvesting rainfall on ground level or at a higher elevation. Furthermore, raindrops can be collected at an elevated platform by using a water tank. In this indirect electricity generation, the rain water which possess of gravitational energy can be released and streamed onto the arm of the piezoelectric turbine [31, 56] to make it rotate. As shown in Fig. 11, the rotation causes the bending of attached piezoelectric cantilevers, resulting in electricity generation.
Fig. 11. Water tank acts as a water reservoir in collecting the rainwater and channel the rain water to fall onto a water collector of the watermill. The transfer of momentum causes the watermill to rotate and in turn bends the piezoelectric cantilevers via magnetic coupling (in non-contact mode), resulting in electricity generation.

Sensors & Transducers, Vol. 200, Issue 5, May 2016, pp. 1-15
12
The process allows a larger instantaneous driving force on the piezoelectric cantilever than that of direct impact of one single raindrop at one time, which allows electrical operation at a higher efficiency. It has been estimated that the piezoelectric watermill driven by rain water stream from a water tank can yield an average energy densities in the order of 10 W/m3 to 100 W/m3 [56]. 5.3. Optimization of Rectifying Efficiency
Although studies indicated that a right interface circuit could increase the energy output of a piezoelectric harvester based on non-damping vibration source e.g. car engine vibration, the suitability and the efficiencies of these circuits [34-48] with energy harvesting based on damping source i.e. water drop impact remain unknown. From the reviewed papers, the interface circuits of all of the water drop energy harvesters were simply resistive loads. Efforts on optimizing the circuit efficiency ηrectify were only done on finding the optimum load resistance, but studies on interface circuits suggested in [34-48] are still lacking. Therefore, extensive investigations should be made to test the suitability and efficiency for water drop energy harvesters. 5.4. Hybrid System
As the energies available in an environment varies with time, climate, and etc., integrating more than one type of structure or material into one hybrid system so that the more types of energy resources such as raindrops, wind, thermal changes and sun light can be utilized anytime and anywhere has already becoming a new trend in the field of energy harvesting research [57-63, 69]. Electrostatic energy [65-70] of rain or water drop, which is not harvested by the piezoelectric energy harvesters, should also be given consideration. The future direction of hybrid system should be in enhancing the efficiency of the hybrid energy harvester and developing innovative methods to harvest more types of energies within one hybrid system. 6. Conclusions
This paper has done a comprehensive review on
various types of raindrop kinetic energy piezoelectric energy harvesters as well as different types of interface circuits. The performance of the harvesters in terms of their conversion efficiency, power output and power density were also discussed.
From the published works, the power output of these piezoelectric harvesters were in the range of μW, which is only suitable to be used to power some low-power devices in applications where the power requirements are not so demanding, wireless sensor,
for instant. The area power density of the harvesters are very low, even the highest power density, achieved by PVDF bridge-structure [16] was found to be only 0.24 W/m2.
The highest energy conversion efficiency was from the PZT cantilever-structure energy harvester [22]. In contrast with the findings [9, 17-18, 20] that bridge-structure and PVDF outperformed cantilever-structure and PZT. However, due to lacking of information of some of the reviewed papers, the harvesters which could potentially have a higher conversion efficiency are still unknown. Therefore, it is still inconclusive on which combinations of piezoelectric material and type of structure that could be joined to become the best system to provide the highest conversion efficiency. More works have to be done to verify this.
Generally, the conversion efficiency is found to be quite low, registering less than 1 %. However, simulation done by Guigon, et al. [30] showed that a conversion efficiency of 2.5 % should be achievable. Moreover, the studies of piezoelectric energy harvesting from constant vibration sources [52] indicated that the efficiency as high as 46 % is also attainable.
Optimizing the conversion efficiency and power density can be done by searching of the best piezoelectric material, the transducer shapes and size, and interface circuit to increase energy output and to reduce loss e.g. splash of water drop. Apart from these, innovative methods should be developed to integrate more types of energy harvesters into one hybrid renewable energy system.
The study in piezoelectric energy harvesting from raindrop impact using piezoelectric has proved to be a promising approach, but it is still in its embryonic stage, the field is wide open with many opportunities for research. References [1]. Costa M. H., Foley J. A., A comparison of
precipitation datasets for the Amazon Basin, Geophys. Res. Lett., Vol. 25, No. 2, 1998, pp. 155-158.
[2]. The World Bank, Average precipitation in depth (mm per year), 25 July 2013. http://data.worldbank.org/indicator/AG. LND.PRCP.MM).
[3]. Huidong Li, Chuan Tian, Z. Daniel Deng, Energy Harvesting From Low Frequency Applications Using Piezoelectric Materials, Applied Physics Reviews, Vol. 1, No. 041301, 2014, pp. 1-20.
[4]. Heung Soo Kim, Joo-Hyong Kim, Jaehwan Kim, A Review of Piezoelectric Energy Harvesting Based on Vibration, International Journal of Precision Engineering and Manufacturing, Vol. 12, No. 6, 2011, pp. 1129-1141.
[5]. Y. Yang, S. Wang, Y. Zhang, Z. L. Wang, Pyroelectric nanogenerators for driving wireless sensors, Nano Letters, Vol. 12, Issue 12, 2012, pp. 6408-6413.
[6]. R. Yang, Y. Qin, L. Dai, Z. L. Wang, Power generation with laterally packaged piezoelectric fine wires,

Sensors & Transducers, Vol. 200, Issue 5, May 2016, pp. 1-15
13
Nature Nanotechnology, Vol. 4, No. 1, 2009, pp. 34-39.
[7]. D. Kraemer, B. Poudel, H.-P. Feng, J. C. Caylor, B. Yu, X. Yan, Y. Ma, X. Wang, D. Wang, A. Muto, K. McEnaney, M. Chiesa, Z. Ren, G. Chen, High-performance flat-panel solar thermoelectric generators with high thermal concentration, Nature Materials, Vol. 10, No. 7, 2011, pp. 532-538.
[8]. Z. L. Wang, Self-powered nanosensors and nanosystems, Advanced Materials, Vol. 24, No. 2, 2012, pp. 280-285.
[9]. Chin-Hong Wong, Zuraini Dahari, Asrulnizam Abd Manaf, Muhammad Azman Miskam, Harvesting Raindrop Energy with Piezoelectrics: a Review, Journal of Electronic Materials, Vol. 44, No. 1, 2014, pp. 1-9.
[10]. http://spacemath.gsfc.nasa.gov [11]. Steven L. Horstmeye, The Weather Almanac: A
Reference Guide to Weather, Climate, and Related Issues in the United States and Its Key Cities, 12th Ed., Wiley, 2011.
[12]. Beard K. V., Terminal Velocity and Shape of Cloud and Precipitation Drops, Journal of the Atmospheric Sciences, Vol. 33, Issue 5, 1976, pp. 851-864.
[13] M. Saikia, M. Devi, A. K. Barbara, H. K. Sarmah, Raindrop size distribution profiling by laser distrometer and rain attenuation of centimeter radio waves, India Journal of Radio and Space Physics, Vol. 38, April 2009, pp. 80-85.
[14]. M. Mazuki, H. Hashiguchi, M. K. Yamamoto, S. Mori, M. D. Yamanaka, Regional variability of raindrop size distribution over Indonesia, Ann. Geophys., Vol. 31, 2013, pp. 1941-1948.
[15]. http://solarelectricityhandbook.com/solar-irradiance.html
[16]. Romain Guigon, Jean-Jacques Chaillout, Thomas Jager, Ghislain Despesse, Harvesting raindrop energy: experimental study, Smart Materials and Structures, Vol. 17, No. 1, 2008.
[17]. Derman Vatansever, Ravi L. Hadimani, Tahir Shah, Elias Siores, Comparative Investigation of PVDF and PZT Based Piezoelectric Smart Structures for Rain and Wind Energy Generation and Polymer Based Piezoelectric Fibre Production, Smart Materials and Structures, Vol. 20, 2011.
[18]. Fabio Viola, Pietro Romano, Rosario Miceli, Gianluca Acciari, Harvesting rainfall energy by means of piezoelectric transducer, in Proceedings of the IEEE International Conference on Clean Electrical Power (ICCEP), 2013, pp. 634-639.
[19]. Fabio Viola, Pietro Romano, Rosario Miceli, Gianluca Acciari, Ciro Spataro, Piezoelectric model of rainfall energy harvester, in Proceedings of the IEEE Ninth International Conference on Ecological Vehicles and Renewable Energies (EVER), 2014, pp. 1-7.
[20]. Rosario Miceli, Pietro Romano, Ciro Spataro, Fabio Viola, Performances of rainfall energy harvester, in Proceedings of the 20th IMEKO TC4 International Workshop on ADC Modelling and Testing Research on Electric and Electronic Measurement for the Economic Upturn, Benevento, Italy, 15-17 September 2014, pp. 468-473.
[21]. Voon-Kean Wong, Jee-Hou Yap, Eng Hwa Yap, Dynamics of a piezoelectric beam subjected to water droplet impact with water layer formed on the surface, Journal of Intelligent Material Systems and Structures, Vol. 26, No. 16, 2015, pp. 2170-2180.
[22]. V. K. Wong, J. H. Ho, E. H. Yap, Experimental Study of a Piezoelectric Rain Energy Harvester, Advanced
Materials Research, Vol. 1043, Oct. 2014, pp. 263-267.
[23]. M. Al Ahmad, Piezoelectric Water Drop Energy Harvesting, Journal of Electronic Materials, Vol. 43, No. 2, 2014, pp. 452-458.
[24]. Tasneim Alkhaddeim, Boshra AlShujaa, Waad AlBeiey, Fatima Al Neyadi, Mahmoud Al Ahmad, Piezoelectric energy droplet harvesting and modelling, in Proceedings of the IEEE Conference: Sensors, 2012, pp. 1-4.
[25]. Mohammad Adnan Ilyas, Jonathan Swingler, Piezoelectric energy harvesting from raindrop impacts, J. Energy, Vol. 90, Part 1, 2015, pp. 796-806.
[26]. K. C. R. Perera, B. G. Sampath, V. P. C. Dassanayake, B. M. Hapuwatte, Harvesting of Kinetic Energy of the Raindrops, International Journal of Mathematical, Computational, Physical and Quantum Engineering, Vol. 8, No. 2, 2011, pp. 325-330.
[27]. C. H. Wong, D. Zuraini, M. Asrulnizam Abd, S. Othman, M. Muhamad Azman, M. Julie Juliewatty, Simulation of Piezoelectric Raindrop Energy Harvester, in Proceedings of the IEEE Conference TENCON, 2013, pp. 465-469.
[28]. Sean Gart, Joseph E. Mates, Constantine M. Megaridis, Sunghwan Jung, Droplet Impacting a Cantilever: A Leaf-Raindrop System, Physical Review Applied, Vol. 3, Issue 4, 2015.
[29]. L. Valentini, S. B. Bon, J. Kenny, Liquid Droplet Excitation of freestanding poly(methylmethacrylate) /graphene oxide films for mechanical energy harvesting, Journal of Polymer Science Part B: Polymer Physics, Vol. 51, Issue 13, 2013, pp. 1028-1032.
[30]. Guigon R., Chaillout J. J., Jager Th., Despesse G., Harvesting raindrop energy: theory, Smart Materials and Structures, Vol. 17, No. 1, 2008.
[31]. Ying Miao, Yu Jia, Hybrid Decentralised Energy for Remote Communities: Case Studies and the Analysis of the Potential Integration of Rain Energy, Journal of Sustainable Development of Energy, Water and Environment Systems, Vol. 2, Issue 3, 2014, pp. 243-258.
[32]. Siores E., Hadimani R. L., Vatansever D., Hybrid Energy Conversion Device, GB Patent No. 1016193.3, 2010.
[33]. D. Vatansever, R. L. Hadimani, T. Shah, E. Siores, Hybrid Photovoltaic-Piezoelectric Flexible Device for Energy Harvesting from Nature, Advances in Science and Technology, Vol. 77, 2012, pp. 297-301.
[34]. Wickenheiser A., Garcia E., Power optimization of vibration energy harvesters utilizing passive and active circuits, Journal of Intelligent Material Systems and Structures, Vol. 21, Issue 13, 2010, pp. 1343-1361.
[35]. Daniel Motter, Jairo Vinícius Lavarda, Felipe Aguiar Dias, Samuel da Silva, Vibration Energy Harvesting Using Piezoelectric Transducer and Non-Controlled Rectifiers Circuits, ABCM, Vol. XXXIV, 378, Special Issue, 2012, pp. 1-8
[36]. E. Lefeuver, D. Audigier, C. Richard, D. Guyomar, Buck-boost converter for sensor-less power optimization of piezoelectric energy harvester, IEEE Transaction on Power Electronics, Vol. 22, No. 5, 2007, pp. 2018-2025.
[37]. R. D’hulst, J. Driesen, K. U. Leuven, Power Processing Circuits for Vibration-Based Energy Harvesters, in Proceedings of the IEEE Power Electronics Specialists Conference, 2008, pp. 2556-2562.
Sensors & Transducers, Vol. 200, Issue 5, May 2016, pp. 1-15
14
[38]. Darmayuda I Made, Yuan Gao, San Jeow Cheng, Meng Tong Tan, Minkyu Je, Optimum Piezoelectric Energy Harvesting with Buck Boost Circuit in Discontinuous Conduction Mode, International Journal of Information and Electronics Engineering, Vol. 2, No. 6, November 2012, pp. 892-894.
[39] G. K. Ottman, H. F. Hofmann, A. C. Bhatt, G. A. Lesieutre, Adaptive Piezoelectric Energy Harvesting Circuit for Wireless Remote Power Supply, IEEE Transactions on Power Electronics, Vol. 17, No. 5, pp. 669-676.
[40]. Ammar Y., Basrour S., Non-linear techniques for increasing harvesting energy from piezoelectric and electromagnetic micro-power generators, in Proceedings of the Dans Symposium on Design, Test, Integration and Packaging of MEMS/MOEMS (DTIP’06), 2007.
[41]. D. Guyomar, G. Sebald, B. Pruvost, M. Lallart, A. Khodayari, C. Richard, Energy harvesting from ambient vibrations and heat, Journal of Intelligent Material Systems and Structures, Vol. 20, No. 5, 2009, pp. 609-624.
[42]. M. Lallart, D. Guyomar, An optimized self-powered switching circuit for non-linear energy harvesting with low voltage output, Smart Materials and Structures, Vol. 17, No. 3, 2008, pp. 035030-035038.
[43]. Y. K. Ramadass, A. P. Chandrakasan, An Efficient Piezoelectric Energy-Harvesting Interface Circuit Using a Bias-Flip Rectifier and Shared Inductor, in Proceedings of the IEEE International Solid-State Circuits Conference - Digest of Technical Papers (ISSCC), 2009, pp. 296-297.
[44]. E. Lefeuvre, A. Badel, C. Richard, L. Petit, D. Guyomar, A comparison between several vibration-powered piezoelectric generators for standalone systems, Sensors and Actuators A: Physical, Vol. 126, No. 2, 2006, pp. 405-416.
[45]. Dongwon Kwon, G. A. Rincon-Mora, A rectifier-free piezoelectric energy harvester circuit, in Proceedings of the IEEE International Symposium on Circuits and Systems (ISACS), 2009, pp. 1085-1088.
[46]. C. Peters, J. Handwerker, D. Maurath, Y. Manoli, A sub-500 mV highly efficient active rectifier for energy harvesting applications, IEEE Transactions on Circuits and Systems, Vol. 58, No. 7, 2011, pp. 1542-1550.
[47]. Qiang Li, Jing Wang, Dan Niu, Yasuaki Inoue, A Two-stage CMOS Integrated Highly Eficient Rectifier for Vibration Energy Harvesting Applications, Journal of International Council on Electrical Engineering, Vol. 4, No. 4, 2014, pp. 336-340.
[48]. J. Dicken, P. D. Mitcheson, I. Stoianov, E. M. Yeatman, Increased power output from piezoelectric energy harvesters by pre-biasing, Power MEMS, Washington DC, 2010, pp. 1-4.
[49]. P. D. Mitcheson, E. K. Reilly, T. Toh, P. K. Wright, E. M. Yeatman, Performance limits of the three mems inertial energy generator transduction types, Journal of Micromechanics and Microengineering, Vol. 17, No. 9, 2007, pp. S211-S216.
[50]. Steven R. Anton, Henry A. Sodano, A review of power harvesting using piezoelectric materials (2003–2006), Smart Mater. Struct., Vol. 16, No. 3, 2007, pp. R1-R21.
[51]. John G. Webster, et al., Measurement, Instrumentation, and Sensors Handbook, 2nd Edition, CRC Press, 2014.
[52]. Shu Y. C., Lien I. C., Efficiency of energy conversion for a piezoelectric power harvesting system, J.
Micromechanics Microengineering, Vol. 16, 2006, pp. 2429-2438.
[53]. Sikalo S., Marengo M., Tropea C., Ganic E., Analysis of impact of droplets on horizontal surfaces, Exp Therm Fluid Sci, Vol. 25, No. 7, 2002, pp. 503-510.
[54]. Sikalo S., Tropea C., Ganic E., Impact of droplets onto inclined surfaces, J. Colloid Interface Sci, Vol. 286, No. 2, 2005, pp. 661-669.
[55]. Shad Roundy, Eli S. Leland, Jessy Baker, Eric Carleton, Elizabeth Reilly, Elaine Lai, Brian Otis, Jan M. Rabaey, V. Sundararajan, Paul K. Wright, Improving Power Output for Vibration-Based Energy Scavengens, IEEE Pervasive Computing, Vol. 4, Issue 1, 2005, pp. 28-36.
[56]. Mickaël Lallart, Shashank Priya, Scott Bressers, Daniel J. Inman, Small-scale Piezoelectric Energy Harvesting Devices Using Low-energy-density Sources, Journal of the Korean Physical Society, Vol. 57, No. 4, 2010, pp. 947-951.
[57]. Ya Yang, Hulin Zhang, Guang Zhu, Sangmin Lee, Zong-Hong Lin, Zhong Lin Wang, Flexible Hybrid Energy Cell for Simultaneously Harvesting Thermal, Mechanical, and Solar Energies, ACS Nano, Vol. 7, No. 1, 2012, pp. 785-790.
[58]. I. Patel., E. Siores, T. Shah, Utilisation of smart polymers and ceramic based piezoelectric materials for scavenging wasted energy, Sensors and Actuators A: Physical, Vol. 159, No. 2, 2010, pp. 213-218.
[59]. Yong Qin, Xudong Wang, Zhong Lin Wang, Microfibre-nanowire hybrid structure for energy scavenging, Nature, Vol. 451, No. 7180, 2008, pp. 809-813.
[60]. Sang-Woo Kim, Massimo Barbagallo, Solar and mechanical energy harvesting integrated in a hybrid nanostructure, SPIE Newsroom, 2011.
[61]. Gyu Cheol Yoon, Kyung-Sik Shin, Manoj Kumar Gupta, Keun Young Lee, Ju-Hyuck Lee, Zhong Lin Wang, Sang-Woo Kim, High-performance hybrid cell based on an organic photovoltaic device and a direct current piezoelectric nanogenerator, Nano Energy, Vol. 12, 2015, pp. 547-555.
[62]. C. Xu, X. D. Wang, Z. L. Wang, Nanowire Structured Hybrid Cell for Concurrently Scavenging Solar and Mechanical Energies, Journal of the American Chemical Society, Vol. 131, No. 16, 2009, pp. 5866-5872.
[63]. Chen Xu, Caofeng Pan, Ying Liu, Z. L. Wang, Hybrid cells for simultaneously harvesting multi-type energies for self-powered micro/nanosystems, Nano Energy, Vol. 1, No. 2, 2012, pp. 259-272.
[64]. Mohammed Salim, Hakin S. Sultan Aljibori, Dhia Salim, M. Haris M. Khir, A. Sh. Kherbeet, A review of vibration-based MEMS hybrid energy harvesters, Journal of Mechanical Science and Technology, Vol. 29, Issue 11, 2005, pp. 5021-5034.
[65]. G. Zhu, Y. Su, P. Bai, J. Chen, Q. Jing, W. Yang, Z. L. Wang, Harvesting Water Wave Energy by Asymmetric Screening of Electrostatic Charges on a Nanostructured Hydrophobic Thin Film Surface, ACS Nano, Vol. 8, No. 6, 2014, pp. 6031-6037.
[66]. Z.-H. Lin, G. Cheng, S. Lee, K. C. Pradel, Z. L. Wang, Harvesting Water Drop Energy by a Sequential Contact-Electrification and Electrostatic-Induction Process, Adv. Mater., Vol. 26, Issue 27, 2014, pp. 4690-4696.
[67]. L. Zheng, Z.-H. Lin, G. Cheng, W. Wu, X. Wen, S. Lee, Z. L. Wang, Silicon-based hybrid cell for harvesting solar energy and raindrop electrostatic energy, NanoEnergy, Vol. 9, 2014, pp. 291-300.

Sensors & Transducers, Vol. 200, Issue 5, May 2016, pp. 1-15
15
[68]. Qijie Liang, Xiaoqin Yan, Yousong Gu, Kui Zhang, Mengyuan Liang, Shengnan Lu, Xin Zheng, Yue Zhang, Highly transparent triboelectric nanogenerator for harvesting water-related energy reinforced by antireflection coating, Scientific Reports, Vol. 5, 2015, 9080.
[69]. Seung-Bae Jeon, Daewon Kim, Gun-Wook Yoon, Jun-Bo Yoon, Yang-Kyu Choi, Self-cleaning hybrid energy harvester to generate power from raindrop and sunlight, Nano Energy, Vol. 12, 2015, pp. 636–645.
[70]. S.-H. Kwon, J. Park, W. K. Kim, Y. J. Yang, E. Lee, C. J. Han, S. Y. Park, J. Lee, Y. S. Kim, An effective
energy harvesting method from a natural water motion active transducer, Energy and Environmental Science, Vol. 7, 2014, pp. 3279-3283.
[71]. Measurement Specialties, Inc. (MEAS), MSI Piezo Film Sensors Technical Manual, 1999.
[72]. Chopra I., Review of State of Art of Smart Structures and Integrated Systems, Journal of AIAA, Vol. 40, No. 11, 2002, pp. 2145-2187.
[73]. Y. R. Lee, J. H. Shin, I. S. Park, K. Rhee, S. K. Chung, Energy Harvesting Based on Acoustically Oscillating Liquid Droplets, Sensors and Actuators A: Physical, Vol. 231, 2015, pp. 8-14.
___________________
2016 Copyright ©, International Frequency Sensor Association (IFSA) Publishing, S. L. All rights reserved. (http://www.sensorsportal.com)

Sensors & Transducers, Vol. 200, Issue 5, May 2016, pp. 16-23
16
Sensors & Transducers© 2016 by IFSA Publishing, S. L.
http://www.sensorsportal.com
Rebuilding of a Classical Robotic System with a Modern Control Software and Sensor Signals
Michail G. PAPOUTSIDAKIS, Eleni SYMEONAKI,
Constantinos S. PSOMOPOULOS and Dimitrios I. TSELES Piraues University of Applied Sciences, P. Ralli & Thivon 250, Egaleo, Athens, 12244 Greece
Tel.: +30 2105381483, fax: +30 210 5381219 E-mail: [email protected]
Received: 18 April 2016 /Accepted: 16 May 2016 /Published: 31 May 2016 Abstract: It is widely known that association between the latest modern technology and robotic manipulators of older ages, has always been of interest to engineers. These machines were equipped with classical sensor devices such as absolute encoders and typical transducers like stepper and servo motors. Considering that present programming tools are very effectual and offer more user friendly interaction, the need for this association is enhanced. The aim of this research project is to present a method via which the SCORBOT ER-III robotic arm will be programmed, efficiently controlled and operated entirely by using a contemporary interface tool. For this purpose the former installed software, although still actual, is substituted by the latest version of LabVIEW program, offering additional stability and proficiency, as well as the ability of controlling and monitoring all robot functions in a more easier and flexible way. On the grounds of this project, there will be records and presentation of the control algorithms performance as well as of the robot feedback signals. Moreover, in the rest of this research paper, there will be a thorough explanation of the main interface control panel by demonstrating characteristic examples of operations and additionally the details of the code generation in block diagram format. Copyright © 2016 IFSA Publishing, S. L. Keywords: Robot sensors, Robotic arm controlling, Feedback signals, Control algorithms, User interface, Versatile programming platform, Safety precautions.
1. Introduction
Robotic equipment and robots established during the '90s in particular, are still fully functional in several research laboratories and in industrial facilities as well. The control interfaces that were coming along with such equipment are still operational too, although their limitations of usage turn the robot programming rather complicated. Considering the reliable structure of robotic manipulators built during the past decades, their support with an up to date interface, intended for programming and controlling the robot's operation, seems to be essential. Robotic manipulators of this
kind are dispensed with a variety of options regarding peripherals, in order to manage and perform more applications such as pick-and-place, size comparison, masses transfer and many more.
On top of all robot equipment components, is the main controller box which is connected to a computer unit and can be programmed according to the demands of the user, although the interfacing abilities are quite limited due to its operation in an old environment such as DOS. Moreover, the manipulator comprises advanced electrical components such as DC and servo motors for achieving operation in high torque and ensuring that all requirements of the arm freedom
http://www.sensorsportal.com/HTML/DIGEST/P_2819.htm

Sensors & Transducers, Vol. 200, Issue 5, May 2016, pp. 16-23
17
degrees will be met. The electrical components along with the
mechanical parts (connectors, joints, etc.) are all linked via an extensive network of wires and electrical safety devices. As the SCORBOT ER-III is a fully controllable apparatus, electrical sensors are also involved in the closed loop system. In addition encoders/ absolute encoders are attached to each motor type granting real-time data about the operation of the robot, the movement and displacement speed as well as the status of the gripper.
In this research project, the former installed control software, although still actual, is now substituted by a more stable and proficient one. For this purpose, the hardware which was already described will be combined with the latest version of LabView software, offering to the user the ability of controlling and monitoring all robot functions in a more easier and flexible way. In order to prove the efficiency of this software, several experiments were conducted, the results of which are going to be presented and described in this paper through particular examples. Additionally there will be a thorough explanation of the main interface control panel as well as a demonstration of results concerning the communication between the user and the system. The particular robot, as an advanced electrical system, even while going through a second decade of usage, consists of several controllable electrical components which justify the concept for its appliance even up to the present time. This purpose is here in achieved by combining this dependable electrical equipment unit with the technology of modern software. LabView is a graphical programming software which was originally established in 1986 by National Instruments Corporation and is being constantly upgraded since then. It is designed for satisfying the needs of integrated engineering tasks such as interfacing computers with instrumental equipment, acquiring, saving and screening data as well as offering an effective user interface through algorithms or programs developing in a graphical environment. As several researchers have included this software in their projects over the years, it has already demonstrated its advantages in tasks corresponding to the one presented here in.
There is a significant number of indicative reports regarding LabView applications in autonomous robotic vehicles programming as well as monitoring its performance. There are respectively mentioned the researches of Anderson Pereira Correia, et al., (see [1]) and Ramirez-Cortes J. M., et al., (see [2]) who achieved complete mobile robot control, autonomous navigation and real-time image display by using the total of LabView features. Furthermore, great research has been performed on the subject of interconnecting various types of robotic arms and manipulators to this sophisticated software. For example Shobhita Ann Job, et al. (see [3]) introduced a LabView based control method for managing signals of a pick-and-place 4 axis arm, C. Chandra Mouli, et al. (see [4]), achieved the control of a servo operating heavy duty
robotic manipulator with 5 freedom degrees while other researchers as Roland Szabo and Aurel Gontean (see [5]) came out with a face recognition application in which a 4 axis arm was controlled by stereoscopic cameras. Each one of these projects marked excessive results and LabView was recommended by researchers as the best available software for such assignments. On the grounds of this research project, the above mentioned work presenting in bibliography, was taken into account, as well as the work of Saeid Moslehpour, et al. (see [6]), who managed successfully to develop a short of intercourse between LabView and SCORBOT ER-III. In the following sections of this project, this interplay is further extended regarding its efficiency, whereas additional potentials of controlling and automation concerning system to user safety, are presented for the first time.
2. System Description
On its most common form the robotic manipulator is constituted by the arm and a controller, as it is illustrated in the Fig. 1 below. The SCORBOT ER-III is constructed with standardized materials and can be electronically controlled. More than that, throughout its constant use during the past decades, it has earned the distinction of being a safe device when operated in a proper way.
Fig. 1. SCORBOT ER-III robot arm and controller box.
The ER-III is a 5 axes robot arm with 5 freedom degrees meaning there are 5 control joints for its manipulation that offer additional control and skillfulness. In Fig. 2 all possible rotary movements are illustrated. The first axis refers to the base which enables the robot to rotate horizontally around the stand where it is fastened to. The second axis refers to the shoulder while the third one refers to the elbow, which operates similarly to the shoulder. The fourth axis refers to the wrist and is frequently described as 2 axes in the same location. The robotic wrist is able to perform up and down movement in a waving motion just like a human wrist does. Finally the fifth axis

Sensors & Transducers, Vol. 200, Issue 5, May 2016, pp. 16-23
18
enables the wrist to move in a rotational, sideways motion. In some robots this twisting motion is assisted by beveled gears in the wrist and can be an entire 360 degrees rotation or more. The robotic arm ends into a pair of grippers which are able to opened and close. Although the grippers (effectors) are not referred to a movement axis, are controlled much alike the rest of the components.
Fig. 2. SCORBOT ER-III robot arm motion schematics.
The controller box contains the required electronic control parts for interfacing the software program with the robotic arm. It controls all of the motors and the effectors along with the limit switch. There are also switches for performing motors and lights tests, as found in [7]. The ability of installing and controlling additional parts such as buzzers, lights, etc. is given as well.
The SCORBOT ER-III is controlled by a computer software provided by the manufacturer, which still in most cases operates in a DOS format although it has been upgraded several times. As soon as the computer unit with which the robot is connected, turns on, the software, named “SCORBASE”, will automatically load and the main program window illustrated in Fig. 3 will appear.
Fig. 3. “SCORBASE” arm teach positions main menu. The limitations of using control and robotic
devices in DOS platform are more than nowadays
programming technology can afford. The lack of animation, signal feedback monitoring, human interacting, and moreover safety precautions measures cannot be hosted or handled in such old programming environments. At the top of that problem, the user in most of the cases in order to type the robot control code, he was obliged to prepare a flowchart of his algorithm, as in Fig. 4, and then transform routines and commands in SCORBASE environment. This process was extremely time consuming and in many cases shown increased fault possibilities in the commands transformation.
Fig. 4. “SCORBASE” typical program structure.
A significant attempt to improve that was implemented in the close past, by replacing the old DOS based version with a Windows platform for programming the SCORBOT arm. This new interface was more flexible than the old one and could run in most personal computers of the engineers. Although the need of the older type of programming and code entry was still there, the existence of buttons for the robotic arm motion, made the interface a lot more user friendly, as Fig. 5 illustrates.
Fig. 5. “SCORBASE” interface based on Windows environment.

Sensors & Transducers, Vol. 200, Issue 5, May 2016, pp. 16-23
19
At this point, the reason of undertaking this project
must once again be mentioned. The interface software presented by the manufacturer lacks in performance, feedback signals analysis and last but not least safety predictions design. Consequently, it was decided to maintain the arm as well as the controller and introduce additionally a user friendly interface, like LabView, offering a great amount of potentials and considerably improved efficiency.
3. Innovative Interface Design
As the use of industrial robots is constantly expanding into new kinds of inspection as well as pick-and-place applications, a more adjustable, accurate, and delicate part handling is required.
The necessity for higher performance and more intelligent control is increased by the usage of robotic arms in laboratory automation projects and automated testing applications or even as manipulators attached to autonomous vehicles. This will allow robots adaption to the continuously modifying conditions by interacting with the environment, easily adjusting the motion profiles, handling delicate items, randomly positioning (locating, handling, picking and placing) the components and finally operating in a safe way. This kind of applications require more intelligent robots, able to communicate with their environments through data acquisition and feedback signals.
The LabVIEW system design software by National Instruments is opening the way of new applications for industrial or laboratory robots by combining control, data acquisition, and human machine interfaces (HMIs) into an integrated, user friendly environment. Experimenting with this software and establishing interaction with the standardized SCORBOT ER-III controller box via the provided RS-232 port was a great challenge. The decision made was to initiate the process from elementary manipulator movements and gradually upgrade the LabView code in order to finally establish more complicated tasks of the robotic motion. In Fig. 6 there is an illustration of the primary interface format involving a simple serial port communication scheme and buttons for the right/left rotational motion of the robot base. A motor speed and step regulator for elemental open loop control is also included.
Fig. 6. Layout of the interface panel for elemental open loop control.
The code which is required for the support of this first application includes routines and loops consisting of several commands, toolboxes and libraries as well. In order to proceed further and establish more advanced applications such as speed and step control, not only of the base but also of all the arm axes, the code had to be substantially increased while a user interface window hosting all these operational regulators had to be concurrently built. At this point all of the 8 servomotors encoders (7 and 1 for the arm and a peripheral conveyor respectively) have to be employed, the control is based upon closed loop feedback signals and each serial port reading regarding the status of the robot is displayed in an independent window. The step signals which the user transmits to the robot controller via LabView code are determined by 2 parameters, one for the pulse generation and another one for the refresh rate in msec.
Applying this method, complete and highly accurate speed and step control of the robotic arm is succeeded whereas all freedom degrees are involved and real-time status signals are being returned as feedback to the user. Considering that this LabView code is enormous in blocks format and impossible to fit in a paper like this one, only the central and representational sections of it are illustrated in Fig. 7 focusing on the one where the control loop of the 8 servomotors speed is programmed.
Each robotic manipulator, similar to the size and torque of SCORBOT ER-III, is provided by the manufacturer with a pre-programmed default command which is called “home position” and it is used for setting the initial position of the arm as well as for storage purposes. In order to compose this command in LabView another part of code had to be added as illustrated in Fig. 8. According to user's requirements, once the button “home position” is activated in the interface panel, the robot ends any task being performed at the time and returns to its initial position in an uninterrupted procedure.
The layout of the main interface panel which is used for the operation by the user, is illustrated in Fig. 9. In there, one can observe the 8 regulators which are used for setting the speed and the step for each one of the 7 servomotors that are responsible for moving the arm as well as the 8th that operates the peripheral conveyor. On the upper side of the panel a window is placed for monitoring serial port's recordings while the “home position” button is placed on the top left side, as aforementioned. In addition there is a significant number of position limit switches which are adjusted on the robot providing information about the arm's location and constituting input signals to the controller.
Incorporating safety precautionary measures in this type of robotic devices is of high importance and in this case, it was taken into serious account. If for example a human or a random obstacle hit the arm while this operating it would be of great hazard so much for the user as for the items transferred by the robot as well.

Sensors & Transducers, Vol. 200, Issue 5, May 2016, pp. 16-23
20
Fig. 7. LabView code for speed control of the 8 motors.
Fig. 8. Robot's “home position” command in LabView code.
Fig. 9. Layout of the main interface panel for programming.

Sensors & Transducers, Vol. 200, Issue 5, May 2016, pp. 16-23
21
For this reason, an automated process was designed and included into the code in an effort to avoid such accidents. When an encoder stops transmitting data, in case of a forced standstill of the arm for example, a warning message appears in the interface monitor and the robot simultaneously freezes. The user is able to decide afterwards whether to end the process or return the robot to its initial position.
A case loop inside a while loop representing the status control of all robot limit switches has already been shown in Fig. 8. Furthermore, another part of syntax was composed and added to the rest of the code in order to read all encoders signals and stop immediately the arm operation in case the status transmission of an encoder is interrupted. This part of code is illustrated in Fig. 10 so as to show that safety precautions in operation were taken under serious consideration during the performance of experiments with the plant. In this part of LAbview code, there is a successful design of taking safety precautionary measures and prevent any possible cause of accident to users due to interruption, deterrence or crash of the robot operation, both rotation trends (clockwise/anticlockwise) of each encoder.
As authors are aware of, this kind of safety precautionary feature has never been included before in any of the existing LabView codes, increasing further in this way the software efficiency for applications concerning robotic control. Custom applications such as pick-and-place, random obstacles size comparison, transferring obstacles to the conveyor according to dimensioning and many more were not only designed but also conducted in this interface. To achieve this, more parts of code that are rather oversized to be fitted in this paper, were composed and tested. In each case the response of the robot arm was more than satisfactory enhancing the overall concept that this interface environment is the
most adequate one for performing this kind of tasks than any other.
In order to expand the research work and prove sufficient enough the system capabilities, an innovative experiment was tested and implemented.
A common procedure of such robotic arms in industry or in packaging pipelines, is the so-called "pick and place" process for items and goods. The scientific question here is obviously not the way this can be done but furthermore how can the user operate the system under 100 % safety in case an unexpected factor (human or random obstacle) interacts with the robot by accident. A new control algorithm was designed for the task as well as a new complementary interface window. This new programming scenario includes the acute stopping of the robotic arm operation and a red light flashing on the new designed interface window, as in Fig. 11.
At that stage, the algorithm provides the user with two different options on his demand, either to continue the pre-programmed operation which was downloaded to the robotic arm's memory previously, or to stop and cancel the operation and a total erase of the robot's memory. After that the user can operate the robot all the way from the beginning, set to home position, re-program it for next procedure etc. This multi-functional algorithm is based on a continuous real time comparison of the instant value of all motion axes encoders with the precise previous value of each encoder. This scenario is undertaken via the loops illustrated in Fig. 12, and to any prospect ensure not only the user's safety but also provide him the ability to decide what to do with the rest of the packaging or pick and place operation of the system. Once again like in previous figures, Fig. 12 provides only a part of the whole algorithm due to its huge size but, in any case, it contains all critical data referring to the main loops of the task.
Fig. 10. Safety precaution code including both rotation trends.

Sensors & Transducers, Vol. 200, Issue 5, May 2016, pp. 16-23
22
Fig. 11. Interface window for manipulations in case of operation distractions.
Fig. 12. Safety precaution code including both rotation trends.
4. Conclusions
The scientific question of this research work which arose naturally from earlier work of the authors, as in [8], was if an old though robust and well known robotic arm can be used in linkage with modern control software. In this paper, the challenge was expanded to make a user friendly interface to host also precautions and procedures for high safety standards and multi-optional operation of the robotic arm. After
several months of performing extended experiments with the plant, a number of conclusions has derived and should be reported.
Critical factors which determine the efficiency of the method herein suggested, such as accuracy and repeatability were maintained in high standards for every operation mode, even more than the original ones which are offered by the manufacturer. Consequently, this updated interface design has resulted to be more sufficient than the older DOS

Sensors & Transducers, Vol. 200, Issue 5, May 2016, pp. 16-23
23
operated SCORBOT ER-III software turning the programming process to be fairly effortless for the user. Additionally, there is a significant innovation in this robot's operation using LabView interface, regarding the feature of safety precautions that was presented earlier in a detailed way, giving a great advantage to this method compared to any other programming process.
The innovation of this user safety algorithm in order all robot axes movements to be memorized and benefit the user to keep on the process from the exact point the robot was stopped and finish its task rather than aborting it, will be further investigated in the close future. In fact the multiplication of feedback signals in the interface by employing displacement sensors (position sensors) around the arm will also be implemented. LabView is adequately able to manage all these inputs in a successful way, allowing the user to be provided with more real-time data as far it concerns the robot position. This feature gives a great advantage to the system and satisfies the original hypothesis of this project, whether or not a sufficient benefit may come of associating old yet reliable hardware and modernized programming software.
Acknowledgements
All authors would like to thank the Postgraduate Program of Studies "Automation for Production and Services", hosted by Department of Automation Engineering at Piraeus University of Applied Sciences, for the financial support to undertake this research work.
References [1]. Anderson Pereira Correia, Carlos Humberto Llanos,
Rodrigo Williams de Carvalho, Sadek Alfaro, A Control Design Approach for Controlling an Autonomous Vehicle with FPGAs, Journal of Computers, Vol. 5, No. 3, 2010, pp. 360-372.
[2]. Ramirez-Cortes J. M., Gomez-Gil P., Martinez-Carballido J., Lopez-Larios F., A LabVIEW-based Autonomous Vehicle Navigation System using Robot Vision and Fuzzy Control, Journal of Engineering Investigation in Technology, Vol. 12, No. 2, 2011, pp. 129-136.
[3]. Shobhita Ann Job, R. Jegan, Melwin Abraham C., OWI-535 EDGE Robotic Arm Control Using ElectroMyoGram (EMG) Signals, International Journal of Innovative Technology and Exploring Engineering, Vol. 2, No. 6, 2013, pp. 282-286.
[4]. C. Chandra Mouli, P. Jyothi, K. Nagabhushan Raju, C. Nagaraja, Design and Implementation of Robot Arm Control Using LabView and Arm Controller, IOSR Journal of Electrical and Electronics Engineering, Vol. 6, No. 5, 2013, pp. 80-84.
[5]. Roland Szabo, Aurel Gontean, Full 3D Robotic Arm Control with Stereo Cameras Made in LabView, in Proceedings of the Position Papers of the Federated Conference on Computer Science and Information Systems, 2013, pp. 37-42.
[6]. Saeid Moslehpour, Candace Odom, Tyrell Barrett, Matt Brawn, Scorbot ER-III Robot, The Technology Interface Journal, Vol. 10, No. 3, 2010, pp. 1-19.
[7]. SCORBOT-ER III, User's Manual 6th Edition, Eshed Robotec, 1999.
[8]. Michail Papoutsidakis, George Chamilothoris, D. Piromalis, Modern Control Interface for SCORBOT ER-III Robot, in Proceedings of the IEEE International Symposium on Fundamentals of Electrical Engineering, Bucharest, Romania, November 28-29, 2014, pp. 1-5.
___________________
2016 Copyright ©, International Frequency Sensor Association (IFSA) Publishing, S. L. All rights reserved. (http://www.sensorsportal.com)

Sensors & Transducers, Vol. 200, Issue 5, May 2016, pp. 24-28
24
Sensors & Transducers© 2016 by IFSA Publishing, S. L.
http://www.sensorsportal.com
ANN Modeling of Electronic Nose Based on Co-doped SnO2 Nanofiber Sensor
S. KHALDI and Z. DIBI
Advanced Electronic Laboratory, Electronic Department, Batna University 05 Avenue, Chahid Boukhlouf 05000 Batna, Algeria
Tel.: +213 33 80 54 94, fax: +213 33 80 54 94 E-mail: [email protected]
Received: 19 April 2016 /Accepted: 19 May 2016 /Published: 31 May 2016 Abstract: We present in this paper a novel neural network based technique to create a model incorporates intelligence for electronic nose. The idea is to create intelligent models; the first one, called selector, can select exactly the nature of gas detected. The second intelligent model is a corrector, which can automatically compensate the electronic nose’s response characteristics and discriminating exactly the detected gas (nature and concentration), and make the response increases all time when the temperature increases. The electronic nose is based on Co-doped SnO2 nanofiber sensor. The MATLAB environment is used during the design phase and optimization. The method discriminates qualitatively and quantitatively between six gases. The advantage of the method is that it uses a small representative database so we can easily implement the model in an electrical simulator. Copyright © 2016 IFSA Publishing, S. L. Keywords: Electronic nose, EN, Gas sensor, ANN, Implementation, Selector, Corrector.
1. Introduction The sensor technology of artificial olfaction had its
beginnings with the creation of the first gas multi sensor array. Advances in aroma-sensor technology, electronics, biochemistry and artificial intelligence make it possible to develop devices capable of detecting and characterizing volatile aromas released from a multitude of sources for numerous applications. These devices, known as electronic noses (ENs), were engineered to mimic the ‘human organ for smelling’ within an instrument designed to obtain repeatable measurements, allowing identifications and classifications of aroma mixtures while eliminating operator fatigue. An electronic nose system typically consists of a multisensor array, an information-processing unit such as an artificial neural network (ANN), software with digital pattern-recognition algorithms, and reference-library databases.
Metal-oxide semiconductors such as SnO2, ZnO, Fe2O3 and In2O3 are widely used as an element in electronic nose components for detecting small amount of target gas in air according to their electrical resistance changes. Accurate detection of toxic and dangerous gas is an important issue since both chemicals negatively affect human health and the environment [1]. It is well known that the high sensitivity, fast response and recovery, and selective detection are the three most important parameters in designing oxide semiconductor gas sensors [2]. Fast and high response characteristics, in particular, are required for real-time monitoring of harmful gases and avoiding possible disasters due to toxic gases [3-4]. Since the sensing mechanism is based on the surface reaction of these materials, their sensing performances are strongly dependent on the morphology and the structure of materials, grain size, crystal system, surface area, dimension, and also the type of grain network or porosity [5].
http://www.sensorsportal.com/HTML/DIGEST/P_2820.htm

Sensors & Transducers, Vol. 200, Issue 5, May 2016, pp. 24-28
25
SnO2 is widely used for diverse devices, such as gas sensors, photocatalysts, photosensors, transparent electrodes, and solar cells [6]. In particular, as a gas sensor is one of its well-known applications [7-8], the synthesis of SnO2 with particular structure or dopant can offer optimizing gas sensing performances [6]. A lot of pure and doped SnO2 has been presented with high sensing characteristics [9-11]. Recently, many materials, such as Zn, Pd, La and Pt, have been proved to be effective dopants for the progress of response or reaction speed or other characteristics of SnO2 [12-13]. The electronic nose is based on Co-doped SnO2 nanofibers sensor. SnO2 nanofibers synthesized via an electrospinning method which indicate quick, high response and recovery, and good selectivity [14].
Artificial Neural Networks (ANNs) are used in instrumentation to model complex systems because of multi-variability and strong nonlinearity. The extrapolation errors with ANNs are lower both inside and outside the calibration range [15]. ANNs are very efficient in solving problems in dynamic matter and offer the advantages of simple implementation and less computing time compared with other numerical models [16].
For this purpose, we used ANNs to design an electronic nose based on Co-doped SnO2 nanofibers sensor. MATLAB interface was used during the design phase and optimization. The model takes into account the nonlinearity response, dependence on temperature in a dynamic environment, as well as dependence on gas nature.
2. Sensor’s Characteristics Pure and Co-doped SnO2 nanofibers (Fig. 1) are
synthesized via an electrospinning method and characterized by X-ray diffraction (XRD), scanning electron microscopy (SEM), and transmission electron microscope (TEM). With comparison between pure SnO2 nanofibers and Co-doped SnO2 nanofibers, the second one provides enhanced high sensing properties. Among all the samples (pure, 0.5 wt%, 1 wt% and 3 wt% Co-doped SnO2 nanofibers), 1 wt% Co-doped SnO2 nanofibers prove the highest response with very short response/recovery times and good selectivity [14]. The response value Rs was defined as Rs=Ra/Rg, where Ra was the sensor resistance in air and Rg was a mixture of target gas and air.
Experimental response of Gas-sensing are performed at different operating temperatures to find the optimum operating condition. Fig. 2 presents the relationship between the different operating temperature and the response of the sensors to 100 ppm H2, and Fig.3 shows experimental responses of pure and Co-doped SnO2 nanofibers to different concentrations of H2 at 330 oC. The response increases and reaches its maximum at 330 °C, then the response decreased rapidly with increasing the temperature, and this behavior can be explained from the kinetics and mechanics of gas adsorption and desorption on the
surface of SnO2 or also semiconducting metal oxides [17].
Fig. 1. A photograph of the gas sensor [14].
Fig. 2. Experimental responses of pure and Co-doped SnO2 nanofibers to 100 ppm H2 at different operating
temperatures [14].
Fig. 3 Experimental responses of pure and Co-doped SnO2 nanofibers to different concentrations of H2
at 330 oC [14].
The 1 wt% Co-doped SnO2 sensor shows the maximum response of about 24 at the optimum operating temperature of 330 °C, which is 8 times

Sensors & Transducers, Vol. 200, Issue 5, May 2016, pp. 24-28
26
larger than that of pure SnO2 (about 3), representing the addition of Co is profit to the H2 sensing of SnO2 nanofibers.
3. Neural Networks Model
Using MATLAB interface and based on experimental results from [14], a database was created and arranged as (S, T, C,) input and (RS) as output, where:
S: Selecting the gas; T: Absolute temperature; C: Gas concentration; RS: resistance response. Most of this database was used mainly in the
training phase using algorithm MLP (back propagation of error). The remaining data were used to test and validate the model. The diagram in Fig. 4 illustrates the direct modeling of the sensor, where:
Yd: Desired output; Y: Network output; e: Modeling error.
Fig. 4. Modeling of sensor.
To optimize the model architecture an iteration algorithm consisting of the assessment of the total error as a function of number of hidden layers and number of neurons in each layer, and after several tests of different ANN models. The architecture optimized and that present the smallest error is summarized in Table 1.
Table 1. Summarizing of the model optimized parameters.
Property Characteristic Database Training base 2985 Test base 627 Architecture 9-15-1 Feed-forward MLP Activation functions
Logsig-Logsig- linear
Training rule Retropropagation error Training MSE < 0.0001 Iterations number
3000
3.1. Model Test
We designed a model based on neural networks by taking into account the dependence on temperature
and Gas concentration in the measure point, as well as the gas nature of the sensor. To illustrate this effect, we changed temperature and noted the variation of the resistance of the sensor. Fig. 5 shows the difference between the database and the ANN model for the sensitivity feature of the sensor.
The difference between the database and the ANN model for the dependence on gas concentration is also tested and shown in Fig. 6.
Fig. 5. Model and database response to 100 ppm different gases.
Fig. 6. Model and database response to different concentrations of H2 at 330 °C.
4. Selector The goal of electronic nose is select correctly the
nature of gas detected by sensor, so we implement the selector
The database is arranged as (T, Rs and VS), where: T: Absolute temperature; Rs: Sensor resistance; Vs: output voltage. The generation of training base and test base is
similar to that of the model's one. However, in the corrector, the temperature T, relative humidity RH and the sensor's output voltage VRL are taken as inputs,
220 240 260 280 300 320 340 360 380 400 4200
5
10
15
20
25
Operating temperature (°C)
Res
pons
e
Responses of 1wt% Co-doped SnO2 nanofibers to 100ppm different gases
CH3COCH3 DatasheetCH3COCH3 ANN modelC2H5OHC2H5OHCOCOH2H2CH3C6H5CH3C6H5C4H10C4H10
0 0.5 1 1.5 2 2.5 3 3.5 4
x 104
0
200
400
600
800
1000
1200
Concentration (ppm)
Res
pons
e
Responses of 1wt% Co-doped SnO2 nanofibers to different concentration of H2 at 330°C
DatasheetANN model

Sensors & Transducers, Vol. 200, Issue 5, May 2016, pp. 24-28
27
and the corrector's output voltage Vs is taken as output.
The selector was trained in a similar manner as in the case of direct model. After many tests of different ANN models. The architecture optimized and that produces the smallest error is summarized in Table 2.
Table 2. Summarizing of the Selector's optimized parameters.
Property Characteristic
Database Training base 2109
Test base 747
Architecture 12-10-15-1 Feed-forward MLP
Activation functions
Logsig-Logsig - Logsig-linear
Training rule Retropropagation error
Training MSE <10-5
Iterations number 1000
4.1. Selector Test We designed an ANN-based selector for electronic
nose. To illustrate the effect of this selector we change concentration, and then we note the variation of the selector’s output. Fig. 7 shows that the selector selects correctly the gases.
Fig. 7. Selector selectivity feature effect.
5. Corrector The database of corrector to be designed is
arranged as (T, Rs, S, Rc), where: T: Absolute temperature; Rs: Sensor's output voltage; S: Selector output voltage; Rc: Corrector's output response. The generation of training base and test base is
similar to that of the model's one. However, in the corrector, the temperature T and the sensor's output voltage Rs are taken as inputs, and the corrector's output voltage Vs is taken as output. The diagram of
Fig. 8 illustrates the methodology used in the corrector design.
Fig. 8. Modeling of the electronic nose corrector.
The corrector was trained in a similar mode as in the case of direct model. After many tests of different ANN models. The architecture optimized and that presents the minimum error is shown in Table 3.
Table 3. Summarizing of the corrector's optimized parameters.
Property Characteristic
Database Training base 2985
Test base 627 Architecture 9-15-1 Feed-forward MLP Activation functions Logsig-Logsig- linear Training rule Retropropagation error Training MSE <0.00001 Iterations number 3000
5.1. Corrector Test We designed an ANN-based corrector for the
electronic nose. To illustrate the effect of this corrector we change temperature, and then we note the variation of the corrector’s output. Fig. 9 shows that the correctors compensate correctly the sensor’s sensitivity feature (the response increases with the temperature increasing).
Fig. 9. Corrector sensitivity feature effect.
240 260 280 300 320 340 360 3800
1
2
3
4
5
6
7
Operating temperature (°C)
Vol
tage
H2
C2H5OH
CH3COCH3
CO
CH3C6H5
C4H10
220 240 260 280 300 320 340 360 380 400 4200
5
10
15
20
25
30
35
40
45
50
Operating temperature (°C)
Res
pons
e
adjusted Responses
CH3COCH3
C2H5OH
CO
H2
CH3C6H5
C4H10
corrector inputcorrector output

Sensors & Transducers, Vol. 200, Issue 5, May 2016, pp. 24-28
28
6. Conclusions
In this paper we modeled electronic noise based on three components: first one is Co-doped SnO2 nanofibers sensor which has the role of detector, the second is a corrector which compensates the output detector and the last one is selector to select the nature of gas detected.
The Co-doped SnO2 nanofibers sensor is modeled by using an artificial neural network sensor. It exactly reproduces the behavior of the gas sensor by taking into account the dependence on temperature at the measurement point, in addition to the dependence on the gas nature, to compensate the temperature influences and make the response increase all time with increasing temperature we used a corrector which is designed also by MLP model using the back propagation algorithm. Then we used the ANN capability to design the selector which selects exactly the gas detected by the sensor. The new technique discriminates and qualitatively and quantitatively measured six gases tested between 240 and 380 °C. This technique can be extended to other electronic nose. References [1]. G. K. Fan, Y. Wang, M. Hu, Z. Y. Lou, G. Li,
Synthesis of flower-like nano-SnO2 and a study of its gas sensing response, Measurement Science and Technology, Vol. 22, No. 4, 2011, pp. 045203-045204.
[2]. C. S. Moon, H. R. Kim, G. Auchterlonie, J. Drennan, J. H. Lee, Highly sensitive and fast responding CO sensor using SnO2 nanosheets, Sensors and Actuators B: Chemical, Vol. 131, No. 2, 2008, pp. 556-564.
[3]. H. R. Kim, K. I. Choi, K. M. Kim, I. D. Kim, G. Z. Cao, J. H. Lee, Ultra-fast responding and recovering C2H5OH sensors using SnO2 hollow spheres prepared and activated by Ni templates, Chemical Communications, Vol. 46, No. 28, 2010, pp. 5061-5063.
[4]. N. Yamazoe, New approaches for improving semiconductor gas sensors, Sensors and Actuators B: Chemical, Vol. 5, No. 1-4, 1991, pp. 7-19.
[5]. M. E. Franke, T. J. Koplin, U. Simon, Metal and metal oxide nanoparticles in chemiresistors: does the nanoscale matter, Small, Vol. 2, No. 1, 2006, pp. 36-50.
[6]. L. Berry, J. Brunet, Oxygen influence on the interaction mechanisms of ozone on SnO2 sensors,
Sensors and Actuators B: Chemical, Vol. 129, No. 1, 2008, pp. 450-458.
[7]. Joong-Ki Choi, In-Sung Hwang, Sun-Jung Kim, Joon-Shik Park, Soon-Sup Park, Unyong Jeong, Yun Chan Kang, Jong-Heun Lee, Design of selective gas sensors using electrospun Pd-doped SnO2 hollow nanofibers, Sensors, Vol. 11, 2011, pp. 10603-10614.
[8]. Vivek Kumar, Shashwati Sen, K. P. Muthe, N. K. Gaur, S. K. Gupta, J. V. Yakhmi, Copper doped SnO2 nanowires as highly sensitive H2S gas sensor, Sensors and Actuators B: Chemical, Vol. 138, Issue 2, 2009, pp. 587-590.
[9]. Sung-Hyun Jung, Sun-Woo Choi, Sang Sub Kim, Fabrication and properties of trench-structured networked SnO2 nanowire gas sensors, Sensors and Actuators B: Chemical, Vol. 171-172, Issue 1, 2012, pp. 672-678.
[10]. S. Mosadegh Sedghi, Y. Mortazavi, A. Khodadadi, Low temperature CO and CH4 dual selective gas sensor using SnO2 quantum dots prepared by sonochemical method, Sensors and Actuators B: Chemical, Vol. 145, Issue 1, 2010, pp. 7-12.
[11]. Yang Zhang, Jianping Li, Guimin An, Xiuli He, Highly porous SnO2 fibers by electrospinning and oxygen plasma etching and its ethanol-sensing properties, Sensors and Actuators B: Chemical, Vol. 144, No. 1, 2010, pp. 43-48.
[12]. Joong-Ki Choi, In-Sung Hwang, Sun-Jung Kim, Joon-Shik Park, Soon-Sup Park, Unyong Jeong, Yun Chan Kang, Jong-Heun Lee, Design of selective gas sensors using electrospun Pd-doped SnO2 hollow nanofibers, Sensors and Actuators B: Chemical, Vol. 150, No. 1, 2010, pp. 191-199.
[13]. In-Sung Hwang, Sun-Jung Kim, Joong-Ki Choi, Jaewan Choi, Hyunjin Ji, Gyu-Tae Kim, Guozhong Caoc, Jong-Heun Lee, Synthesis and gas sensing characteristics of highly crystalline ZnO–SnO2 core–shell nanowires, Sensors and Actuators B: Chemical, Vol. 148, Issue 2, 2010, pp. 595-600.
[14]. Li Liu, Chuangchang Guo, Shouchun Li, Lianyuan Wang, Qiongye Dong, Wei Li, Improved H2 sensing properties of Co-doped SnO2 nanofibers, Sensors and Actuators B: Chemical, Vol. 150, 2010, pp. 806-810.
[15]. Leonard Meijer, Neural Network Applications in device and Subcircuit Modeling for Circuit simula-tion, Thesis of Philips Research Laboratories in Eindhoven, Netherlands, 2003.
[16]. Patra J. C., A. van den Bos, Kot A. C., An ANN-based smart capacitive pressure sensor in dynamic environment, Sensors and Actuators A: Physical, Vol. 86, 2000, pp. 26-38.
[17]. N. Yamazoe, J. Fuchigami, M. Kishikawa, T. Seiyama, Interactions of tin oxide surface with O2, H2O and H2, Surface Science - SURFACE SCI, Vol. 86, 1979, pp. 335-344.
___________________
2016 Copyright ©, International Frequency Sensor Association (IFSA) Publishing, S. L. All rights reserved. (http://www.sensorsportal.com)

Sensors & Transducers, Vol. 200, Issue 5, May 2016, pp. 29-36
29
Sensors & Transducers© 2016 by IFSA Publishing, S. L.
http://www.sensorsportal.com
Research on Apple Odor Collection and Identification
Yuchen Jia and Ju Zhhang College of Information Science & Technology, Agricultural University of Hebei,
Baoding 071001, China Tel.: 13785285121
E-mail: [email protected]
Received: 8 April 2016 /Accepted: 9 May 2016 /Published: 31 May 2016 Abstract: Odor is an important quality factor in the selection of the apple. How to quickly and accurately detect the odor of apples is a subject in food, gardening and computer science. With the development of sensor technology, network communication technology and embedded computer technology, the electronic nose research becomes a hot topic. This paper carries on exploratory research for the apple odor detection based on the characteristics of apple odors. It designs a portable apple odor detection system with six SnO2 gas sensors as its odor collector and TMS320VC5402 as its processor. There are other hardware such as high precision A /D converter MAX1403, a 3×5 keyboard, and LCD in the system. It introduces interface circuit DSP to A/D converter and keyboard with the characteristics of different varieties of apples odors. In order to have a better human-computer interaction function, the system designs LCD interface circuit to display test results. A BP neural network is applied in the pattern recognition of apple odors. It studies on the extraction method of characteristic value, the improving for BP algorithm, the BP neural network transplanting to DSP platform. This system can automatically identify apple odor and its application will provide a new method for apple quality identification. Copyright © 2016 IFSA Publishing, S. L. Keywords: Apple odor, Gas sensor, TMS320VC5402, Electronic nose, Pattern recognition. 1. Introduction
Apple has always been an important fruit in the world, and it is identified as one of 11 kinds of superior agricultural products by Ministry of Agriculture in China. Because of concern about the quality of apple, fast and accurate detection of apple quality has always been a hot research subject of horticulture, agronomy, computer, and electronics. There are many indicators for apple division, and the basic quality requirements, in fresh apple grading standards in China, is the full fruit, fresh and clean, no abnormal smell or taste, fully developed, with good maturity for sale or storage. It is visible that smell plays an important role in the characterization of the apple [1]. However, due to the
complex composition and the sensory organs subjective effects, odor is more difficult to identify than other characters of apple, which has become focal and difficult points in research. At present, the electronic nose system, which uses odor sensor array to collect data and PC to process data, has been successfully tested and applied. However, such electronic nose requires a computer to process data, and is not convenient to detect the smell of apples at the scene. This article describes an apple odor detection system. It contains a core processor, which is a DSP chip TMS320VC5402, and a device for collecting odors, which is constituted by odor sensors. It is a system for sample collection, A/D conversion, nonlinear pattern recognition as a whole.
http://www.sensorsportal.com/HTML/DIGEST/P_2821.htm

Sensors & Transducers, Vol. 200, Issue 5, May 2016, pp. 29-36
30
2. System Design Scheme The system consists of the following components:
odor sensor array, data acquisition module, the control module for device, information display module and the processing system with DSP core. Data processing is: odor signals that acquisition device obtained is pretreated and then A/D conversion; after the signal feature extraction, signal is input to the processor DSP core in the form of a digital matrix; the digital matrix is computed and processed by the processor according to the relevant instructions, and finally display the results on the LCD screen. Apple quality level tentatively scheduled for three levels, the good, bad and disabled. Fig. 1 shows a block diagram of the system.
Fig. 1. Block diagram of the system for apple odor research.
TMS320VC5402 core device the system used is the TI Company’s mainstream products. C5000 DSP platform is the most popular consumer digital market, which is particularly suitable for personal and portable products, and VC5402 is the higher cost of fixed-point digital signal processors [2].
3. Hardware Design for Odor Acquisition
3.1. The Design of Odor Collection Chamber Apple odor generally composes of ethylene,
formic acid, acetic acid, propionic acid, butyric acid, octanoic acid and other volatile acids and esters thereof, methanol, ethanol, acetaldehyde, etc. based on food chemistry research, and therefore choose tin oxide odor sensors which is sensitive to these gases to make up sensor array. This design uses six thick metal tin oxide sensor (TGS800, TGS822, TGS824, TGS825, TGS2602, TGS2610) which are produced by
Figaro company in Japan. Each sensor in sensor array has a different sensitivity to the smell test, TGS2602 sensitive to toluene, ethanol and TGS822 more sensitive to alcohol [3].
Working principle of the SnO2 gas sensors is: when the surface-sensitive layer of SnO2 gas sensor contact with air, oxygen in the air is adsorbed onto the surface of the sensitive layer by the electron affinity of the molecule and get electrons from a surface of the semiconductor to form O2
-, O-, O2- and other acceptor-type surface level, in the result of surface resistance increasing; if a reducing gas such as H2, CO gas is detected as being in contact with the surface, the redox reactions is happened, and the surface resistance drops with oxidizes the trapped electrons returned to the semiconductor. It can detect the gas used of changes in surface resistance of gas sensors. The above-described process can be described in three chemical reaction formulas:
−→+ nOneO adsorption22
1, (1)
neOHHO n +→+−22adsorption , (2)
neCOCOO +→+ 2-n
adsorption , (3)
where e is the electron charge.
In addition, if there are structural dislocations in the portion those semiconductor die contacts with, it would form barrier at the point of dislocations that can hinder movement of carriers. This barrier changes its height due to the adsorption of gas, which also changes the gas sensor resistance. Due to the difference of the sensitive material, the thickness of the sensitive layer, doped with rare metals, the heating and operating temperatures, ambient temperature and humidity and other conditions, various sensors are sensitivity to different gas molecules.
The test apparatus for odor acquisition is shown in Fig. 2. Apple is placed in a semi-closed container, called resettlement room. The sensor array is placed in a reaction chamber, the volume of which is as small as possible, and temperature control equipment is installed in it. In order to save space, six sensors are arranged in line. In order not to distribute to other odor, the reaction chamber is made of stainless steel. Valve 1 and Valve 2 are the intake and exhaust ports.
Due to the limited space of the reaction chamber, the volume of temperature control equipment cannot be too large. By comparing the advantages and disadvantages of microcontroller-based temperature control circuit and analog circuit for temperature control equipment, it chooses the analog circuit. The reason is that its size is small and can set up flexible drive power, although the accuracy of analog circuits is lower than microcontroller-based temperature control circuit. Temperature control device emulation circuit is shown in Fig. 3.
DSP processing system
Odor collection device
Man-machine interface circuit
Signal preprocessment
A/D conversion circuit
Device control circuit

Sensors & Transducers, Vol. 200, Issue 5, May 2016, pp. 29-36
31
Fig. 2. The schematic of odor capture device.
Fig. 3. Temperature control device emulation circuit.
3.2. The Design of Core Processing Circuit
The resistance values of sensor are difference in the case of different gas concentrations sensor. According to this feature, the resistance value can be converted into a continuous signal by the voltage value conversion circuit, and these voltages can be approximated representation of the original odor signal. There are N sensors in the gas sensor array, so that if the sensor array is used to measure M-gas, the response of the sensor array is M random process collection according to the M gases. It can be described in the formulas:
11 12 1
21 22 2
1 2
( ) ( ) ... ( )
( ) ( ) ... ( )( ) ,
... ... ... ...
( ) ( ) ... ( )
M
M
N N NM
t t t
t t tE t t T
t t t
ξ ξ ξξ ξ ξ
ξ ξ ξ
= ∈
(4)
As can be seen from the data output the sensor array, the data processing cannot be accomplished by simple data calculations.
Before processing and analysis of the data, it must convert the analog signal into digital signal which collects by the sensors, that is A/D conversion. Because the signals are low-frequency small-signal and the high accuracy requirements for data processing system, the precision is must be considered in the choice of A/D converter. MAX1403 produced by MAXIM Company has the features of high precision, multi-function, low power consumption, and it can provide conversion results through the serial digital interface. When the master clock frequency is 2.4576 MHz or 1.024 MHz, the on-chip digital filter can process line frequency and associated harmonic frequencies, and set the magnitude of these frequencies to zero, so that it can get better filtering effect without external filter. At the same time, it also helps to improve the quality of the digital signal output from the A/D converter.
This design uses TMS320VC5402 DSP as the core device. TMS320C5000 DSP platform is the TI Company's mainstream products, and C5000 DSP platform, which is particularly suitable for personal and portable products, is most popular in the digital consumer markets. C54x DSP is currently the mainstream products in application, because of its high performance and low cost [3]. TI's VC5402 is the higher cost of fixed-point digital signal processors launched in October 1999, and its main features are as follows:
Advanced reformed Harvard architecture, operating speed is up to 100MIPS.
Advanced multi-bus architecture, there are three 16-bit data bus and a memory program memory bus.
There is a 40-bit arithmetic logic unit (ALU). There are 8 auxiliary registers and a software stack
that allows the use of the industry's most advanced fixed-point DSP C language compiler.
The data / programs addressing space is 1 M × 6 bit, and it built-in 4 K × 16 bit ROM and 16 K × 16 bit RAM.
It built-in programmable wait state generator, PLL clock generator, two multi-channel buffered serial port, one 8-bit parallel PHI port in communication with the outside, two 16-bit timers, and 6-channel DMA control device.
Low power consumption, the power supply has 3 V and 1.8 V.
The interface circuit between A/D converter and TMS320VC5402 is shown in Fig. 4.
For ease of viewing the test results, this design makes a man-machine interface circuit in hardware. It includes a parallel interface, keyboard circuit, the liquid crystal display circuit, RS232, FLASH memory and RAM memory. It designs a 3×5 matrix keyboard. Due to the limited resources of TMS320VC5402 chip I/O port, it expands into the latch 74HC573 I/O port to form non-coding keyboard. Specific definitions of key codes include data acquisition and transmission
Signal conversion circuit
Valve 1
Valve 2
Temperature control
Sensors
Output

Sensors & Transducers, Vol. 200, Issue 5, May 2016, pp. 29-36
32
control, scroll up and down and clear the screen, data storage and other functions.
Fig. 4. The interface circuit between A/D converter and TMS320VC5402.
3.3. Experimental Procedure and Phenomenon
Experimental procedure for the experimental device designed as follows:
1) Open the Valve 1 for holding ventilation, and open the temperature control switch in the reaction chamber, and then wait 2 minutes.
2) Close the Valve 1, open the Valve 2, and apple is moved into the sample gas generation chamber, sealed to wait 5 minutes to step 3.
3) Open the collection procedures to begin collecting data.
4) Shut off the Valve 2, and it is the time for response between gas sample and the sensors.
5) Stop the acquisition program, and open reaction chamber to remove the apples. The reaction chamber is sealed five minutes to restore.
6) The next test. Tests under the following three conditions: the
reaction chamber is empty, put into an apple that general maturity, and put into a rotten apple. The output voltage waveform of sensors measured is shown in Fig. 5, Fig. 6 and Fig. 7.
The
out
put v
olta
ge /
V
Time / s
Fig. 5. Sensor array response profiles of background air circuit.
The
out
put v
olta
ge /
V
Time / s
Fig. 6. Sensor array response profiles of an apple that
general maturity circuit.
The
out
put v
olta
ge /
V
Time / s
Fig. 7. Sensor array response profiles of a rotten apple.
The above test results show that SnO2 gas sensors have clear response to apple odors. With the improvement of maturity the odor concentration has a greater change, so that the response voltage from sensors for the smell concentration of rotten apples quickly reaches their peaks [4].
4. Odor Recognition Based Neural Network
4.1. Pattern Recognition Model According to the data to identify an apple either
good or bad is called apple odor pattern recognition. A pattern recognition system typically includes four main sections: obtaining and pre-processing of the raw data, feature extraction and selection, classification or clustering, after deal with. Pattern recognition are generally divided into supervised and unsupervised pattern recognition system [5]. For this design, the data experimental samples have been identified, and therefore it belongs to supervision pattern recognition. Identification process is divided into decision-making phase and design phase, as shown in Fig. 8.

Sensors & Transducers, Vol. 200, Issue 5, May 2016, pp. 29-36
33
Fig. 8. The block diagram of pattern recognition system for gas.
The workflow of decision-making stage is as
follow. First, the sensor devices collect apple odor signal and transform it in order to convey it into the DSP; as a result, it become digitized time-series signal. Then, this original signal is pretreated such as normalization, in order to divide it into a number of smaller pieces, called frames, according to a certain time window, but the split is also determined according to actual needs and algorithms. This step can turn a continuous signal into relatively isolated elements as the basic unit of recognition. The next step is feature extraction. Each frame signal is extracted into a feature vector as pattern recognition sample after a certain signal processing, and task of the system is to identify which one in gas element library related to the samples.
The workflow of design stage is as follow. First, various apple odor collected, after signal processing, is stored in digital form as a basic recognition unit, named gas element library. Then, extract the data elements in the library and make up the gas signal reflecting certain characteristics of the gas, which is the reference for unknown signal. Finally, this gas signal is extracted feature vector with the same characteristics of unknown signal extraction method. This process is called data training. Reasonable training algorithm is the key of pattern recognition and is the core issue of classifier design.
4.2. Feature Extraction The basic task of feature extracted in this design
is to describe the information contained in the original data with less characteristic value by mathematical methods. There are great differences at feature extraction in the method for different problems [6]. The principle of feature extraction is the extracted features expressed the most information based on the desires of the issue. General studies take only the steady-state response of the sensor, but in fact the gas sensor response is a dynamic process, if only to extract the value of the steady-state response will lose a lot of useful information. After analysis of experimental data, this study takes the maximum value as the
extraction method. Extract four values: the maximum value, the time between the starting point to maximum, the relative value between the maximum value and the initial value, and the integral value at time t, shown in Fig. 9.
Fig. 9. The schematic feature values.
4.3. BP Neural Network Implemented on DSP Platform
Neural network is a complex network system consists of a wealth of basic information processing unit interconnected neurons. Artificial neurons simulate biological neuron, which biological neuron structure determines the structure of artificial neuron, and artificial has neural synapses or connections, a group of signal accumulation unit and the activation function and other functions.
BP algorithm is one of the most common, the most influential algorithms by far. The basic idea of this algorithm is: make squared error of the sample between output as desired and actual output as a criterion function, use the gradient descent method, starting from the output layer, correct weights layer by layer so that the criterion function minimum [7]. The entire network consists of three layers, namely: an
Integral value
Relative value
Max
Feature values
Starting point
Time/s
Gas element library
Gas Signal Gas Property Model Training
Design Phase
Unknown Gas Signal Gas Property Classification Decision
Result
Decision-making Phase

Sensors & Transducers, Vol. 200, Issue 5, May 2016, pp. 29-36
34
input layer, a hidden layer and output layer, which may have more than one hidden layer. There is connection between adjacent layers of neurons with each other, but there is no connection between the inner layers of neurons, and the output of the previous layer is the input of the next layer. Characteristics of the entire network depend on the threshold between adjacent neuron connection weights and neurons.
BP neural network design steps are as follows. 1) Design input and output layer The number of neuron number on input layer is
equal to the number of sensors in gas sensor array, and the number of neuron number on output layer is equal to the number of recognition results. This design has six sensors, and the input of the neural network is the output of the 6 gas sensors; results to be recognized are three, which is raw, ripe and rotten.
2) Select the number of hidden units Selecting the number of hidden units is a very
complex issue. If there are too few hidden units, network training requirements may not be achieved, or the trained network is not strong enough, and it does not recognize previously seen sample, fault tolerance poor. But if there are too many hidden units, learning time will be too long; the deviation is not necessarily the best, so there is an optimum number of a hidden unit.
It can select the number of hidden layer units according to the following several formulas [8].
=
<n
i i
nCk
0
1)( )( 1 in ≥ , (5)
0)( 1 =i
nC )( 1 in < , (6)
where k is the number of samples, n1 is the number of hidden units, n is the number of input units.
amnn ++=1 , (7)
nn 21 log= , (8)
where n the number of input units, n1 is the number of hidden units, m is the number of output units, a is a constant between 0-10.
For function approximation of BP neural network, the number of hidden units is related to the functions and their precision to be approached.
3) Select the value of initial weights Due to the nonlinearity, there is a great relationship
between the initial value and the learning whether the local minimum or not and whether the convergence. An important requirement is to make the initial weights of each neuron close to zero when enter cumulative, and it will ensure that does not fall on those flat areas at start. Weight generally takes a relatively small random value, so it can ensure that each neuron advances in where their conversion
function greatest changing at the beginning [9]. So it needs to be normalized for input samples.
The network topology is 6-8-3, namely: the input is the signal of the six gas sensors, and the output is the three results. According to the characteristics of the experimental hardware platform and real-time and non-destructive testing requirements, target MSE take 0.01. BP program design process is shown in Fig. 10.
4) Recognition results and error The expected value of the three kinds of
recognition results is as follow. [1 0 0]-------Ripeness apple [0 1 0]-------Immature apple [0 0 1]-------Rotten apple DSP-based BP recognition results are shown
in Table 1.
Table 1. BP recognition results.
No.Actual state
Test Results Recognition
results
1. Ripeness 0.99101 0.00524
0.00337 Ripeness
2. Ripeness 0.99532 0.00106
0.00213 Ripeness
3. Ripeness 0.99487 0.00213
0.00145 Ripeness
4. Ripeness 0.99624 0.00009
0.00208 Ripeness
5. Ripeness 0.99356 0.00476
0.00135 Ripeness
6. Ripeness 0.99496 0.00457
0.00132 Ripeness
7. Ripeness 0.98335 0.00876
0.00357 Ripeness
8. Ripeness 0.99765 0.00008
0.00196 Ripeness
9. Ripeness 0.99546 0.00358
0.00215 Ripeness
10. Immature0.00324 0.99574
0.00125 Immature
11. Immature0.00108 0.99713
0.00214 Immature
12. Immature0.00457 0.99201
0.00102 Immature
13. Immature0.00723 0.99105
0.00121 Immature
14. Immature0.00653 0.99218
0.00054 Immature
15. Immature0.00576 0.99312
0.00143 Immature
16. Rotten 0.00576 0.00004
0.99301 Rotten
17. Rotten 0.00312 0.00045
0.99445 Rotten
18. Rotten 0.00463 0.00132
0.99423 Rotten
19. Rotten 0.00634 0.00057
0.99187 Rotten
20. Rotten 0.00723 0.00034
0.99112 Rotten

Sensors & Transducers, Vol. 200, Issue 5, May 2016, pp. 29-36
35
5. Conclusions
This article describes an apple odor detection system based on DSP and BP neural network. The system includes sample acquisition, A/D conversion, and nonlinear pattern recognition. It uses gas sensors to gather apples odors, via the signal processing and pattern recognition to identify the state of maturity of the apples. The main contents of the thesis include:
1) Choices gas sensors and its array. It takes six SnO2 gas sensors to make up array, and sets the temperature control system of reaction chamber, and sets air switching equipment between the reaction chamber and outside, and satisfy the gas sensors’ requirements of the environmental. Experimental device is designed to capture the odors, and it sets up experimental procedures combined with other hardware circuitry and pattern recognition algorithms.
Fig. 10. BP neural network design process.
2) Design the hardware processing circuit. It uses
cost-effective TMS320VC5402 chip as the processor, high precision MAX1403 as A/D converter, and introduces the interface circuit between DSP and A/D converter. Sets a 3×5 keyboard, and introduces DSP and keyboard interface with the different characteristics among varieties of apples. In order to achieve human-computer interaction better, the system design interface circuit between DSP and LCD, and the results can display on the LCD.
3) Sets pattern recognition system based on the neural network. Research on the software design of BP neural network on the DSP platform, and achieve the porting and testing work on the hardware.
Acknowledgment
This work is supported by Baoding Science Technology Research and Development Guidance Program (15ZG023).
Network training?
Weight initialization
(Take a random number -0.1 to 0.1)
Read training samples
MSE
Calculate feed forward output value
Seek gradient
The main function
Network training?
Modify weights
Read the stored weights
Read test sample
Storage and display the results
Seek MSE
Training times +1
Weight training and save the result
Yes (Training)
No (test network)
Yes (Training)
No (test network)

Sensors & Transducers, Vol. 200, Issue 5, May 2016, pp. 29-36
36
References [1]. Zhao Jie-Wen, Zou Xiao-Bo, Pan Yin-Fei, Research
on method of apples odorant recognition based on GA-neural network, Journal of Jiangsu University (National Science Edition), Vol. 25, No. 1, Jan. 2004, pp. 1-4.
[2]. Dai Ming-Zhen, Zhou Jian-Jiang, TMS320C54x DSP structure, principle and application, Beijing University of Aeronautics and Astronautics Press, 2007.
[3]. TGS2000 series Sensors Products, SUNSTAR sensing and control, http://www.sensor-ic.com/.
[4]. Chen Chen-Xing, Electronic Nose Combined with Computer Visions and the Researches in Food Freshness Detection, Zhejiang University, 2015.
[5]. Zhao Meng-Xing, Fish freshness evaluation based on the electronic nose technology, Food Science, Vol. 34, No. 6, 2013.
[6]. Yan Zheng-Hu, Color and Odor Multi-Sensor Fusion Ripening fruit Detection System, Kunming University, 2013.
[7]. Zhang Kun, Dai Sheng-Pei, Li Da-Hui, Based on the Electronic Nose Technology of Tropical Agricultural Product Quality Distinguish Detection Technology Research, SOFTWARE, Vol. 33, 2012, pp. 36-38.
[8]. Hao Xiu-Quan, Li Q, Alcohol identification of principal component analysis and artificial neural network, Xi'an University, 2006.
[9]. Jiang Xue-Song, Zhou Hong-Ping, Quality of agricultural products Genetic Advances on Nondestructive Testing, Agricultural Sciences of Jiang Su, 2013.
___________________
2016 Copyright ©, International Frequency Sensor Association (IFSA) Publishing, S. L. All rights reserved. (http://www.sensorsportal.com)
Sensors & Transducers, Vol. 200, Issue 5, May 2016, pp. 37-44
37
Sensors & Transducers
© 2016 by IFSA Publishing, S. L. http://www.sensorsportal.com
Adaptive Lag Synchronization of a Modified Rucklidge Chaotic System with Unknown Parameters
and its LabVIEW Implementation
1, * Karthikeyan Rajagopal and 2 Sundarapandian Vaidyanathan 1, * Department of Electronics Engineering, Defense Engineering College, DebreZeit, Ethiopia
2 Research and Development Centre, Vel Tech University, Avadi, Chennai-600 062, India * E-mail: [email protected]
Received: 7 April 2016 /Accepted: 9 May 2016 /Published: 31 May 2016 Abstract: Chaos theory has wide applications in several branches of science and engineering. The discovery of novel chaotic systems in various applications, their qualitative properties and the control of such systems are active research areas. This paper announces a novel chaotic system obtained by modifying the equations of the Rucklidge chaotic system (1992) for nonlinear double convection. The Lyapunov exponents of the modified Rucklidge chaotic system are obtained as 1 0.4283,L 2 0L and 3 3.4301.L Also, the Lyapunov
dimension of the modified Rucklidge chaotic system is derived as 2.1249.LD Next, an adaptive feedback
controller is defined for the lag synchronization of the identical modified Rucklidge chaotic systems with unknown parameters. Finally, a circuit design of the modified Rucklidge chaotic system and its adaptive lag synchronization are implemented in LabVIEW to validate the results for the theoretical chaotic model. Copyright © 2016 IFSA Publishing, S. L. Keywords: Chaos, Chaotic systems, Rucklidge system, Delay systems, Lag synchronization, Circuit design, LabVIEW.
1. Introduction
A chaotic system is usually characterized by having a dense collection of points with periodic orbits, being sensitive to initial conditions of the system (“butterfly effect”) and also being topologically transitive. A chaotic system is also characterized by the existence of a positive Lyapunov exponent.
The first chaotic system was derived by Lorenz [1], when he was studying convection patterns in the weather model. Numerous 3-D chaotic systems have been found in recent decades such as Rössler system [2], ACT system [3], Rucklidge system [4], Chen system [5], Lü system [6], Chen-Lee system [7],
Wang system [8], Zhang-Tang system [9], Pehlivan system [10], Thanh system [11-12], etc.
Chaos modelling have applications in many areas in science and engineering [13-15]. Some of the common applications of chaotic systems in science and engineering are chemical reactors, Brusselators, Dynamos, Tokamak systems, biology models, neurology, ecology models, memristive devices, etc.
Due to the presence of signal propagation delays, we cannot always assume that the states in the response system should synchronize with the driving signals at exactly the same time. Thus, in designing a controller for synchronizing chaotic systems, the propagation delays should be taken into consideration. In such a case, the response state ( )y t
http://www.sensorsportal.com/HTML/DIGEST/P_2822.htm

Sensors & Transducers, Vol. 200, Issue 5, May 2016, pp. 37-44
38
is expected to synchronize with the driving signal with certain transmission lag . In other words, the synchronization goal aims to drive the lag synchronization error ( ) ( ) ( )e t y t x t to zero
asymptotically as .t Lag synchronization is investigated with many
approaches such as intermittent control [16], adaptive control [17], sliding mode control [18], fuzzy logic control [19], etc.
In fluid mechanics modelling, cases of two-dimensional convection in a horizontal layer of Boussinesq fluid with lateral constraints were studied by Rucklidge [4]. When the convection takes place in a fluid layer rotating uniformly about a vertical axis and in the limit of tall thin rolls, convection in an imposed vertical magnetic field and convection in a rotating fluid layer are both modeled by the Rucklidge system of ordinary differential equations, which produces chaotic solutions like the Lorenz system [1].
In this research work, we derive a novel chaotic system by modifying the equations of the Rucklidge chaotic system [4]. We discuss the qualitative properties of the modified Rucklidge chaotic system such as dissipativity, stability of the equilibrium points, Lyapunov exponents and Lyapunov dimension. Next, we derive new results for the lag synchronization of the identical modified Rucklidge chaotic systems via adaptive control method. Finally, we present details of the circuit simulation and LabVIEW implementation of the modified Rucklidge chaotic system and adaptive lag synchronization of the modified Rucklidge chaotic systems.
2. A Modified Rucklidge Chaotic System The Rucklidge chaotic system [4] for nonlinear
double convection is described by
1 1 2 2 3
2 1
23 3 2
x ax bx x x
x x
x x x
(1)
where 1 2 3, ,x x x are the states and ,a b are the
constant, positive, parameters. The Rucklidge system (1) is chaotic when the
parameter values are taken as
2, 6.7a b (2) The Lyapunov exponents of the Rucklidge system
(1) are obtained numerically as
1 2 30.1877, 0, 3.1893L L L (3) Also, the Lyapunov dimension of the Rucklidge
chaotic system (1) is derived as
1 2
3
2 2.0589L
L LD
L
(4)
In this research work, we derive a novel chaotic
system by modifying the equations of the Rucklidge chaotic system (1) and we obtain the novel system
1 1 2 2 3
2 1
43 3 2
x ax bx x x
x x
x x x
(5)
In this work, we show that the modified
Rucklidge system (5) is chaotic when the parameter values are taken as
2, 10a b (6)
For numerical simulations, we take the initial
conditions of the modified Rucklidge system (5) as
1 2 3(0) 1.2, (0) 0.8, (0) 1.4x x x (7) The basic qualitative properties of the modified
Rucklidge chaotic system (5) are described in Section 3.
The Lyapunov exponents of the modified Rucklidge chaotic system (5) are obtained as
1 2 30.4283, 0, 3.4301L L L (8) Also, the Lyapunov dimension of the modified
Rucklidge chaotic system (5) is derived as
1 2
3
2 2.1249L
L LD
L
(9)
It is noted that the Maximal Lyapunov Exponent
(MLE) of the modified Rucklidge chaotic system (5) is greater than that of the Rucklidge chaotic system (1). It is also noted that the Lyapunov dimension of the modified Rucklidge chaotic system (5) is greater than that of the Rucklidge chaotic system (1). This shows that the modified Rucklidge chaotic system (5) has more chaotic behavior than the Rucklidge chaotic system (1).
Fig. 1 shows the strange chaotic attractor of the modified Rucklidge chaotic system (5).
The modified Rucklidge chaotic system with delay is given by the 3-D dynamics
1 1 2 2 3
2 1
43 3 2
( ) ( ) ( ) ( ) ( )
( ) ( )
( ) ( ) ( )
x t ax t bx t x t x t
x t x t
x t x t x t
, (10)
where 0 is the time-delay and ,a b are constant, positive parameters.

Sensors & Transducers, Vol. 200, Issue 5, May 2016, pp. 37-44
39
Fig. 1. Strange attractor of the modified Rucklidge chaotic system.
3. Analysis of the Modified Rucklidge Chaotic System Dissipativity In vector notation, the modified Rucklidge system
(5) can be expressed as
1
2
3
( )
( ) ( ) .
( )
f x
x f x f x
f x
(11)
The divergence on the vector field f on 3R is
given by
31 2
1 2 3
( )( ) ( ) f xf x f xf
x x x
(12)
Let be any region in 3R with a smooth
boundary. Let ( ) ( ),tt where t is the flow
of .f Let ( )V t denote the volume of ( ).t
By Liouville’s theorem, we have
1 2 3
( )
( ) ( )t
V t f dx dx dx
(13)
The divergence of the flow of the system (5) is
found as
31 2
1 2 3
( 1)ff f
f ax x x
, (14)
where 1 3 0.a
Substituting the value of f in (13), we get
1 2 3
( )
( ) ( ) ( )t
V t dx dx dx V t
(15)
Integrating the linear differential equation (15), we get
( ) exp( ) (0)V t t V (16)
Since 0, it follows from Eq. (16) that
( ) 0V t exponentially as .t Thus, the
modified Rucklidge system (5) is dissipative. Thus, the system limit sets are ultimately confined into a specific limit set of zero volume, and the asymptotic motion of the system (5) settles onto a strange attractor of the system.
Symmetry The system (5) is invariant under the
coordinates transformation
1 2 3 1 2 3( , , ) ( , , )x x x x x x (17) The transformation (17) persists for all values of
the system parameters. Thus, the system (5) has rotation symmetry about the 3x axis and any non-
trivial trajectory of the system (5) must have a twin trajectory.
Invariance It is easy to see that the 3x axis is invariant for
the flow of the system (5). Also, the invariant motion of the flow of the system on the 3x axis is governed
by the scalar differential equation
3 3x x , (18)
which is globally exponentially stable.
Lyapunov Exponents and Lyapunov Dimension We take the parameter values of the modified
Rucklidge system (5) as in the chaotic case, i.e.
2, 10a b (19) We take the initial state as
1 2 3(0) 1.2, (0) 0.8, (0) 1.4x x x (20) The Lyapunov exponents of the modified
Rucklidge system (5) are numerically obtained using MATLAB as
1 2 30.4283, 0, 3.4307L L L (21) Eq. (29) shows that the modified Rucklidge
system (5) is a chaotic system since it has a positive Lyapunov exponent, 1.L
Since 1 2 3 3.0018 0,L L L it is
immediate that the modified Rucklidge chaotic system (5) is dissipative.

Sensors & Transducers, Vol. 200, Issue 5, May 2016, pp. 37-44
40
The Lyapunov dimension of the modified Rucklidge chaotic system (5) is determined as
1 2
3
2 2.1249,L
L LD
L
(22)
which is fractional.
4. Adaptive Lag Synchronization of Modified Rucklidge Chaotic Systems For the master system defined by the modified
Rucklidge chaotic system (10) with unknown parameters a and ,b the slave system can be described as
1 1 2 2 3 1
2 1 2
43 3 2 3
y ay by y y u
y y u
y y y u
, (23)
where 1 2 3, ,u u u are the nonlinear controllers to be
designed using estimates ˆˆ( ), ( )a t b t of the unknown
system parameters so that the systems (10) and (23) can be synchronized.
The lag synchronization error is defined as
1 1 1
2 2 2
3 3 3
( ) ( ) ( )
( ) ( ) ( )
( ) ( ) ( )
e t y t x t
e t y t x t
e t y t x t
, (24)
where 0 is the constant representing time delay or lag.
Then the lag synchronization error dynamics can be easily obtained as
1 1 2 2 3
2 3 1
2 1 2
4 43 3 2 2 3
( ) ( )
( ) ( )
( ) ( )
e ae be y t y t
x t x t u
e e u
e e y t x t u
(25)
We consider an adaptive feedback controller
defined by
1 1 2 2 3
2 3 1 1
2 1 2 2
4 43 3 2 2 3 3
ˆˆ( ) ( ) ( ) ( )
( ) ( )
( ) ( )
u a t e b t e y t y t
x t x t k e
u e k e
u e y t x t k e
, (26)
where ˆˆ( ), ( )a t b t are the estimates of the unknown
parameters , ,a b respectively, and 1 2 3, ,k k k are
positive gain constants.
Substituting (26) into (25), we obtain the closed-loop error dynamics as
1 1 2 1 1
2 2 2
3 3 3
ˆˆ[ ( )] [ ( )] ( )
( )
( )
e a a t e b b t e k e t
e k e t
e k e t
(27)
We define the parameter estimation errors as
ˆ( ) ( )
ˆ( ) ( )
a
b
e t a a t
e t b b t
(28)
Substituting (28) into (27), we get the error
dynamics as
1 1 2 1 1
2 2 2
3 3 3
( )
( )
( )
a be e e e e k e t
e k e t
e k e t
(29)
Differentiating (28), we obtain
ˆ( )
ˆ( )
a
b
e a t
e b t
(30)
Next, we consider the Lyapunov function
defined by
2 2 2 2 21 2 3
1,
2 a bV e e e e e (31)
which is positive definite on 5.R Differentiating V along the trajectories of (29)
and (30), we obtain
2 2 2 21 1 2 2 3 3 1
1 2
ˆ
ˆ
a
b
V k e k e k e e e a
e e e b
(32)
In view of (32), we take the parameter update law as
21
1 2
ˆ
ˆ
a e
b e e
(33)
Next, we state the main result of this section.
Theorem 1. The time-delayed modified Rucklidge chaotic system (10) and the modified Rucklidge chaotic system (23) with unknown system parameters are globally and exponentially synchronized by the adaptive feedback control law (26) and the parameter update law (33), where
1 2 3, ,k k k are positive gain constants.

Sensors & Transducers, Vol. 200, Issue 5, May 2016, pp. 37-44
41
Proof. Substituting (33) into (32), we obtain the time-derivative of the quadratic Lyapunov function V as
2 2 2
1 1 2 2 3 3V k e k e k e , (34)
which is the negative semi-definite function on 5.R Thus, using Barbalat’s lemma [20], we conclude
that ( ) 0e t as t for all initial conditions 3(0) .e R
This completes the proof.
5. LabVIEW Implementation of the Modified Rucklidge Chaotic System
Fig. 2 shows the implementation of the modified Rucklidge chaotic system (10) in LabVIEW using the Control Design and Simulation Loop.
For numerical simulations, we take
0.1, 2,a 10b (35)
and initial state as
1(0) 1.2,x 2 (0) 0.8,x 3 (0) 1.4x (36) Fig. 3 – Fig. 5 show the 2-D phase portraits of the
modified Rucklidge chaotic system (10).
6. LabVIEW Implementation of the Adaptive Lag Synchronization of the Modified Rucklidge Systems In this section, the adaptive control method for
the lag synchronization of the modified Rucklidge chaotic systems discussed in Section 3 is implemented using LabVIEW. The time delay factor of the system is achieved through a single state delay introduced in states 1x and 3x of the Rucklidge System. To stabilize the delay equation we have maintained τ between 0 and 1. The system stability of the delayed Rucklidge System is ensured through proper transport delay configuration which is introduced in all the three states of the system.
Fig. 2. LabVIEW implementation of the time-delayed modified Rucklidge chaotic system.
Fig. 3. 1 2( , )x x – phase portrait of the time-delayed
modified Rucklidge chaotic system.
Fig. 4. 2 3( , )x x – phase portrait of the time-delayed
modified Rucklidge chaotic system.

Sensors & Transducers, Vol. 200, Issue 5, May 2016, pp. 37-44
42
Fig. 5. 3 1( , )x x - phase portrait of the time-delayed
modified Rucklidge chaotic system.
Fig. 6 shows the design of slave subsystem (23) using LabVIEW. Fig. 7 shows the design in LabVIEW for the adaptive controller u defined by Eq. (26).
For numerical simulations, the initial values of the master system (10) are taken as
1 2 3(0) 1.4, (0) 1.2, (0) 0.8x x x (37)
The initial values of the slave system (23) are
taken as
1 2 3(0) 0.4, (0) 1.7, (0) 0.5y y y (38)
The initial values of the parameter estimates are
taken as
ˆˆ(0) 0.8, (0) 6.3a b (39)
The time-delay is taken as 0.1. Fig. 8 shows the time history of the lag
synchronization errors.
Fig. 6. LabVIEW implementation of the slave system.
Fig. 7. LabVIEW implementation of the adaptive controller for lag synchronization.

Sensors & Transducers, Vol. 200, Issue 5, May 2016, pp. 37-44
43
Fig. 8. Time-history of the lag synchronization errors.
7. Conclusions
In this paper, we have discovered a novel chaotic system, which has been obtained by modifying the equations of the Rucklidge chaotic system (1992) for nonlinear double convection. Due to the presence of signal propagation delays, we cannot always assume that the states in the response system should synchronize with the driving signals at exactly the same time. Thus, in designing a controller for synchronizing chaotic systems, the propagation delays should be taken into consideration. Lag synchronization has important applications in engineering areas like signal propagation, secure communication, etc. This research work also derived new results for the adaptive lag synchronization of identical modified Rucklidge chaotic systems. To validate the results for the theoretical model, we presented LabVIEW implementation of the modified Rucklidge chaotic system with delay and adaptive controller design for the lag synchronization of the modified Rucklidge chaotic systems. The importance of these lag systems is that they are effective when applied to chaos based communication systems. These time delayed systems have a minimal phase shift and hence the digital implementation of these systems in Field Programmable Gate Arrays (FPGA) are easier and can be achieved with minimum area utilization. The biggest challenge in these lag systems is that the risk of instability is huge and hence the delay elements has to be kept in a limited range of operation.
References [1]. E. N. Lorenz, Deterministic nonperiodic flow,
Journal of the Atmospheric Sciences, Vol. 20, 1963, pp. 130-141.
[2]. O. E. Rössler, An equation for continuous chaos, Physics Letters A, Vol. 57, No. 5, 1976, pp. 397-398.
[3]. A. Arneodo, P. Coullet, C. Tresser, Possible new strange attractors with spiral structure, Communications in Mathematical Physics, Vol. 79, Issue 4, 1981, pp. 573-579.
[4]. A. M. Rucklidge, Chaos in models of double convection, Journal of Fluid Mechanics, Vol. 237, 1992, pp. 209-229.
[5]. G. Chen, T. Ueta, Yet another chaotic attractor, International Journal of Bifurcation and Chaos, Vol. 9, No. 7, 1999, pp. 1465-1466.
[6]. J. Lü, G. Chen, A new chaotic attractor coined, International Journal of Bifurcation and Chaos, Vol. 12, No. 3, 2002, pp. 659-661.
[7]. H. K. Chen, C. I. Lee, Anti-control of chaos in rigid body motion, Chaos, Solitons and Fractals, Vol. 21, No. 4, 2004, pp. 957-965.
[8]. J. Wang, Z. Chen, Z. Yuan, Existence of a new three-dimensional chaotic attractor, Chaos, Solitons and Fractals, Vol. 42, 2009, pp. 3053-3057.
[9]. J. Zhang, W. Tang, Analysis and control for a new chaotic system via piecewise linear feedback, Chaos, Solitons and Fractals, Vol. 42, No. 4, 2009, pp. 2181-2190.
[10]. I. Pehlivan, I. M. Moroz, S. Vaidyanathan, Analysis, synchronization and circuit design of a novel butterfly attractor, Journal of Sound and Vibration, Vol. 333, No. 20, 2014, pp. 5077-5096.
[11]. V. T. Pham, S. Vaidyanathan, C. K. Volos, S. Jafari, Hidden attractors in a chaotic system with an exponential nonlinear term, European Physical Journal: Special Topics, Vol. 224, Issue 8, 2015, pp. 1507-1517.
[12]. V.-T. Pham, C. K. Volos, S. Vaidyanathan, Multi-scroll chaotic oscillator based on a first-order delay differential equation, Studies in Computational Intelligence, Vol. 581, 2015, pp. 59-72.
[13]. A. T. Azar, S. Vaidyanathan, Chaos Modeling and Control Systems Design, in Studies in Computational Intelligence, Springer, Berlin, Vol. 581, 2015.
[14]. A. T. Azar, S. Vaidyanathan, Advances in Chaos Theory and Intelligent Control, in Studies in Fuzziness and Soft Computing, Springer, Berlin, Vol. 337, 2016.
[15]. S. Vaidyanathan, C. Volos, Advances and Applications in Chaotic Systems, Studies in Computational Intelligence, Springer, Berlin, Vol. 636, 2016.
[16]. Y. Li, C. Li, Complete synchronization of delayed chaotic neural networks by intermittent control with two switches in a control period, Neurocomputing, Vol. 173, 2016, pp. 1341-1347.
[17]. S. Pourdehi, P. Karimaghaee, D. Karimipour, Adaptive controller design for lag-synchronization of non-identical time-delayed chaotic systems with unknown parameters, Physics Letters A, Vol. 375, Issue 17, 2011, pp. 1769-1778.
[18]. Z. Wang, X. Shi, Lag synchronization of two identical Hindmarsh-Rose systems with mismatched parameters and external disturbance via a single sliding mode controller, Applied Mathematics and Computation, Vol. 218, No. 22, 2012, pp. 10914-10922.
[19]. L. Wang, W. Ding, Synchronization for delayed non-autonomous reaction-diffusion fuzzy cellular neural networks, Communications in Nonlinear Science and Numerical Simulation, Vol. 17, No. 1, 2012, pp. 170-182.
[20]. H. K. Khalil, Nonlinear Systems, Prentice Hall, New Jersey, 2001.

Sensors & Transducers, Vol. 200, Issue 5, May 2016, pp. 37-44
44
___________________
2016 Copyright ©, International Frequency Sensor Association (IFSA) Publishing, S. L. All rights reserved. (http://www.sensorsportal.com)

Sensors & Transducers, Vol. 200, Issue 5, May 2016, pp. 45-49
45
Sensors & Transducers
© 2016 by IFSA Publishing, S. L. http://www.sensorsportal.com
Synthesis and Characterization of ZnO Nanoparticles
Using Sol-gel Process
1* Jayasree ALURI, 2 Sudha Lakshmi P.B and 3 Basaveswara Rao MANDAVA
1 Department of Chemistry, Krishna University, Nuzvid, A.P, India 2 Department of Chemistry, DRR College, Krishna University, Nuzvid, A.P, India
3 P. G. Centre, Krishna University, Nuzvid, A. P, India 1 E-mail:[email protected]
Received: 15 April 2016 /Accepted: 16 May 2016 /Published: 31 May 2016 Abstract: In the Present work structural, morphological and compositional properties of ZnO nanopowders synthesized using Zinc nitrate and NaOH using sol-gel process were reported. The synthesized nanopowders were further analyzed using X-Ray Diffraction (XRD), Scanning electron microscopy (SEM) and Fourier Transform Infrared (FTIR) spectroscopic characterizations. Crystalline size and Lattice strain determined from XRD spectra. Morphology of Nanopowders viewed from SEM images observed at different magnifications. The presence of Functional groups analyzed from FTIR spectra. From the results it was very clear that particles synthesized using Zinc nitrate and NaOH plays a vital role on crystalline size, surface morphology of Nanopowders. Synthesized nanopowders can be utilized as building materials in fabrication of various optoelectronic devices including solar cells, LED’s etc. due to its significant structural, morphological and optical properties. Copyright © 2016 IFSA Publishing, S. L. Keywords: FTIR, Nanoparticles, SEM, XRD, Zinc oxide. ___________________________________________________________________________ 1. Introduction
Nanotechnology is an emerging field of science and technology and it has been applied to various fields right from medicine, textile and education to defense and manufacturing. The concept of miniaturizing devices to the ultimate atomic scale became dominant technological development for the last few years. Nanostructured materials are objects of intermediate size between microscopic and molecular structures. They include nanorods, nanowires, nanopores, nanosheets, nanoparticles etc. Nanoparticles considered as particular interest in applications of optoelectronic devices [1]. Among these nanomaterials, the metal oxide nanostructures
have become of particular interest to scientists for the development of different optical, biochemical and biomedical nanodevices [2]. Metal oxide nanoparticles show fast electron transfer properties as they have high surface area to volume ratio, low toxicity, are environment-friendly, have chemical stability and biocompatibility [3]. They rapidly help in improving the performance of Nanomaterials. Among metal oxide Nanoparticles ZnO nanoparticles due to their wide energy band gap of 3.37 eV, biocompatibility, high electron mobility, fast electron transfer rate, environmental friendly, high melting point, these are used to fabricate sensitive and precise nanodevices based on nanomaterials for the application of sensing, optical absorption and
http://www.sensorsportal.com/HTML/DIGEST/P_2823.htm

Sensors & Transducers, Vol. 200, Issue 5, May 2016, pp. 45-49
46
luminescence emission[4]. Researchers reported ZnO Nanoparticles could enhance light-trapping for solar energy technology and LED’s [6], ZnO Nanostructures are considered as excellent material for fabrication of highly sensitive and selective gas sensors [7]. ZnO Nanoparticle dispersed PANI is a promising material for emissive layer in polymer light-emitting diodes [8]. ZnO nanoparticles coating with PVA is a good material for small-signal, visible blind, and wavelength selective UV detection [9].
As seen from literature various growth methods such as co-precipitation, ball milling, laser ablation, hydrothermal, Sono chemical, solid state reaction method were reported for synthesis of ZnO nanoparticles [10]. From literature it has also been observed that sol -gel method has several advantages because of low temperature (<100 °C) processing, cheap, environment- friendly etc [11]. Scientists synthesized ZnO Nanoparticles by sol-gel process.
In the present work ZnO Nanopowders were synthesized using Zinc nitrate and NaOH by Sol-gel method. These Nanopowders further characterized to determine the influence of NaOH concentration on structural, morphological, compositional and optical properties of ZnO Nanopowders.
2. Experimental Procedure 2.1. Chemical Required
Zinc Nitrate Zn(NO3)2, Sodium Hydroxide (NaOH), Ethanol, all chemicals utilized were of Analytical grade. All chemicals are used without further purification. 2.2. Experimental Procedure
The nanopowders were synthesized by using the following process. First 0.2 M aqueous solution of Zinc nitrate was prepared by dissolving zinc nitrate in 60 ml ethanol with continuous stirring using a magnetic stirrer for 2 hrs .Aqueous solution of sodium hydroxide was prepared in the similar way with continuous stirring with magnetic stirrer for 2 hrs. When the chemicals dissolved, the prepared aqueous sodium hydroxide solution is added to Zinc nitrate solution and resultant mixture so formed is kept under vigorously stirring for 3 hours till white precipitate is obtained within the solution [12]. The resultant precipitate is centrifuged and allowed to stay to digest for 24 hrs at room temperature. During this time, OH- and NO3
- ions were diffused through the medium and white gel-like precipitate of Zn(OH)2 was formed. The remaining solution is centrifuged for 10 min and the precipitate was removed [13]. The obtained precipitate is kept in an oven around 70 ºC till the precipitate dries. During drying Zn(OH)2 is completely converted into ZnO. In the final step the particle obtained was grinded to obtain powder.
2.3. Chracterization Techniques
2.3.1. X Ray Diffraction (XRD)
XRD patterns of the samples were recorded using powder X-Ray Diffractometer (XRD-SMART lab) - Rigaku, JAPAN using secondary monochromatic CuKα radiation of wavelength λ = 0.1541 nm at 40 Kv/50mA in the scan range 2θ = 20 to 90o. Samples were supported on a glass slide. Structural properties including crystalline size, lattice strain were determined from XRD pattern.
2.3.2. Scanning Electron Microscopy (SEM)
SEM micrographs of Nanopowders were observed at different magnifications using Field Emission Scanning Electron Microscope (FESEM-SUPRA 55) - CARL ZEISS, GERMANY. A drop of nanoparticles dissolved in methanol was placed on copper grid .The micrographs gives information about morphology of nanopowders
2.3.3. Fourier Transform Infrared (FTIR) Spectra
FTIR spectra were obtained from FT-RAMAN Spectrophotometer 50-5000cm-1 (BRUKER RFS).Presence of functional groups resolved from spectra.
3. Results and Discussions
3.1. X-Ray Diffraction Structural properties of nanopowders were analyzed from XRD. Fig. 1 represents XRD spectra of ZnO nanopowders. Various diffraction peaks were observed in the spectra of ZnO. Line broadening clearly represent presence of nanoparticles. In spectra diffraction peaks appeared at scattering angles (2θ) = 31.774º, 34.400º, 36.248º, 47.499º, 56.724º, 62.771º, 66.290º, 67.866º, 69.019º, 72.56º, 76.85º, 81.259º, 89.470º, 92.63º, 95.147º and 93.487º respectively. The XRD patterns of the samples reveal that all peaks correspond to the characteristic peaks of the hexagonal wurtzite structure of ZnO with space group P63mc and lattice parameters of a = b = = 0.3250 nm and c = 0.5207 nm according to the JCPDS database 36-1451. The crystalline size is calculated using Scherer’s formula D = 0.89λ/b cosθ, where k is the X-ray wavelength (0.15406 nm), h is the Bragg diffraction angle, and b is the full width at half maximum (FWHM) of the peak diffraction is found to be 37.87 nm, No diffraction peaks from impurities and residues were detected, indicating that the synthesized products are pure ZnO nanoparticles [14]. From spectra it was also clear that synthesis procedure adopted in this work possess good control over the size of the nanoparticles.

Sensors & Transducers, Vol. 200, Issue 5, May 2016, pp. 45-49
47
2-theta (deg)
Inte
nsity
(cps
)
20 40 60 80 100 0
2000
4000
6000
Fig. 1. XRD spectra of ZnO nanoparticles.
3.2. Scanning Electron Microscopy
Morphological properties of nanoparticles were analyzed from SEM micrographs [15]. Fig. 2 represent SEM spectra of ZnO Nanopowders observed at different magnifications .The images clearly represent formation of Nanoparticles. From
images it was observed that, sample synthesized at NaOH represents the formation of monodispersed and spherical shaped nanoparticles [16]. Micrographs clearly show particles synthesized using NaOH represents zinc oxide is in pure form and particles are beautiful white colored spherical nanoparticles.
Fig. 2. SEM images of ZnO nanoparticles.

Sensors & Transducers, Vol. 200, Issue 5, May 2016, pp. 45-49
48
3.3. Fourier Transform Infrared Spectroscopy
Infrared spectroscopy is used to determine the
presence of certain functional groups.The formation of wutzite structure was further confirmed from FTIR speatra. Fig. 3 represent FTIR spsectra of ZnO nanopowders recorded in the range 4500 - 500 cm-1.
Fig. 3. FTIR spectra of ZnO nanoparticles. Various bands were observed in the FTIR
spectra. The position and number of absorption bands not only depend on crystal structure and chemical composition but also on crystal morphology.The broad band observed around 3500 cm-1 and 1600 cm-1 corresponds to O-H stretching vibration due to the absorbed water on the surface of the samples [17]. The absorption around 2500 cm-1 is because of the presence of CO2 molecules in the environment. The peak around 2900 cm-1 is due to C-H band Band around 1600 cm-1 may be due to deformation vibration of H2O molecule [18]. The carbonate stretches in samples are observed in samples at 1540 and 1480 cm-1. The intense absorption peak at ∼400 cm-1 is related to the stretching vibrations of Zn–O bond [19]. The results further confirm XRD results of the spectra.
4. Conclusions
In the present work ZnO nanopowders were synthesized using zinc nitrate and NaOH precursors using sol-gel method and powders were further characterized using XRD,SEM and UV-Vis optical absorption spectroscopic techniques. XRD confirms formation of wurtzite struture of ZnO with crystalline size of 37.87 nm. SEM confirms formation of nearly spherical images. The structural properties of nanopowders were further confirmed from the FTIR spectra.Various functional groups were predicted from FTIR spectra. Optical absorption reveals
absence of absorption band in the visible region in all the samples. The results clearly specify fabrication method utilized in this work is simple, low cost. As synthesized nanopowders can be used in fabrication of optoelectronic devices etc due to its structural and optical properties.
References [1]. Mohammad Ali Moghri Moazzen, Seyed Majid
Borghei, Farshad Taleshi, Change in the morphology of ZnO nanoparticles upon changing the reactant concentration, Appl Nanosci, 3, 2013, pp. 295–302.
[2]. P. Bindu, Sabu Thomas, Estimation of lattice strain ZnO nanoparticles: X-ray peak profile analysis, J Theor Appl Phys, 8, 2014, pp. 123–134.
[3]. T. Thilagavathi, D. Geetha, Nano ZnO structures synthesized in presence of anionic and cationic surfactant under hydrothermal process, Appl Nanosci, 4, 2014, pp. 127–132.
[4]. Swati, Kulkarni and Mahendra D., Shirsat, optical and structural properties of Nanopowders, International Journal of Advanced Research in Physical Science (IJARPS), Vol. 2, Issue 1, January 2015, pp. 14-18.
[5]. Soosen Samuel M., Lekshmi Bose and George K. C , Optical properties of ZnO Nanoparticles, Academic Review, Vol. XVI, No. 1 - 2, 2009, pp. 57-65.
[6]. H. L. Cao, X. F. Qian, Q. Gong, W. M. Du, X. D. Ma and Z. K. Zhu, Shape- and size-controlled synthesis of nanometre ZnO from a simple solution route at room temperature, Institute of Physics Publishing Nanotechnology, 17, 2006, pp. 3632–3636.
[7]. M. A. Shah and M. Al-Shahry, Zinc Oxide Nanoparticles Prepared by the Reaction of Zinc Metal with Ethanol, Modern Physics Letters B, 23, 06, 2009.
[8]. Muthuvinayagama, Boben Thomasb, P. Dennis Christyc, R. Jerald Vijaya, T. Manovah Davidd, and P. Sagayaraja, Investigation on the Sol-Gel Synthesis, Structural, Optical and Gas sensing Properties of Zinc Oxide Nanoparticles, Archives of Applied Science Research, 3, 4, 2011, pp. 256-264.
[9]. T. V. Kolekar, H. M. Yadav, S. S. Bandgar and P. Y. Deshmukh, Synthesis By Sol-Gel Method And Characterization Of Zno Nanoparticles, Indian Streams Research Journal, Vol. 1, Issue 1, 2011.
[10]. Prakash Chand, Anurag Gaur, Ashavani Kumar, Study of optical and ferroelectric behavior of ZnO nanostructures, Adv. Mat. Lett., 4, 3, 2013, pp. 220-224.
[11]. Alessio Becheri, Maximilian, Piero Baglioni, Synthesis and characterization of zinc oxide nanoparticles: application to textiles as UV-absorbers, J Nanopart Res., 10, 2008, pp. 679–689.
[12]. Surabhi Siva Kumar, Putcha Venkateswarlu, Vanka Ranga Rao and Gollapalli Nageswara Rao, Synthesis, characterization and optical properties of zinc oxide nanoparticles, International Nano Letters, December 2013.
[13]. Ameerazam, Faheem Ahmad Nishat Arshi, Formation and characterization of ZnO nanopowder synthesized by sol–gel method, Journal of Alloys and Compounds, Vol. 496, Issues 1-2, 30 April 2010.
[14]. Sreetama Dutta and Bichitra N Ganguly, Characterization of ZnO nanoparticles grown in

Sensors & Transducers, Vol. 200, Issue 5, May 2016, pp. 45-49
49
presence of Folic acid template, Dutta and Ganguly Journal of Nano Biotechnology, 10, 2012.
[15]. S. Muthukan, R. Gopalakrishan, Structural, FTIR and photoluminescence studies of Cu doped ZnO nanopowders by co-precipitation method, Optical Materials, Vol. 34 Issue 11, September 2012, pp. 1946-1953.
[16]. Mr. B. Sudheer Kumar, Investigation on the Sol-Gel Synthesis, Morphology and Characterization of Zinc Oxide Nanoparticles, International Journal of Engineering Research & Technology (IJERT), Vol. 1 Issue 6.
[17]. Hsin-Ying Huang, Martin O. Eriksson, Tsen-Fang Dai and Per-Olof Holtz, Surface related and intrinsic
exciton recombination dynamics in ZnO nanoparticles synthesized by a sol-gel method, Applied Physics Letters, 102, 2013, 013109.
[18]. Awodugba Ayodeji Oladiran, Ilyas Abdul-Mojeed Olabisi, Synthesis and characterization of ZnO Nanoparticles with Zinc Chloride as Zinc source, Asian Journal of Natural and Applied Sciences, Vol. 2 No. 2, June 2013, pp. 41-44.
[19]. Ruhul A. Bepari and Birinchi K Das, Synthesis of Nanostructured ZnO using Zinc isonicotinate tetrahydrate as precursor and studies of its photoluminiscence properties, International Journal of Engineering Research and Technology, Vol. 2, No-4, November 2013, pp. 120-126.
___________________
2016 Copyright ©, International Frequency Sensor Association (IFSA) Publishing, S. L. All rights reserved. (http://www.sensorsportal.com).

Sensors & Transducers, Vol. 200, Issue 5, May 2016, pp. 50-59
50
Sensors & Transducers© 2015 by IFSA Publishing, S. L.
http://www.sensorsportal.com
LEDWIRE: A Versatile Networking Platform for Smart LED Lighting Applications using LIN-Bus and WSNs
1, 2 Dimitrios D. Piromalis, 1 Konstantinos G. Arvanitis,
3 Panagiotis G. Papageorgas, 2 Dimitrios I. Tseles and 4 Constantinos S. Psomopoulos
1 Department of Natural Resources and Agricultural Engineering, Agricultural University of Athens, Iera Odos 75, 11855, Athens, Greece
2 Department of Automation Engineering, Piraeus University of Applied Sciences (TEI of Piraeus), P. Ralli and Thivon 250, 12244, Egaleo, Greece
3 Department of Electronic Engineering, Piraeus University of Applied Sciences (TEU of Piraeus), P. Ralli and Thivon 250, 12244, Egaleo, Greece
4 Department of Electrical Engineering, Piraeus University of Applied Sciences (TEI of Piraeus), P. Ralli and Thivon 250, 12244, Egaleo, Greece
1 Tel.: +30 2105381481, fax: +30 2105381531 E-mail: [email protected]
Received: 24 March 2016 /Accepted: 29 April 2016 /Published: 31 May 2016 Abstract: In this paper, the architecture of a versatile networking and control platform for Light-Emitting Diode (LED) lighting applications is presented, based on embedded wireless and wired networking technologies. All the possible power and control signals distribution topologies of the lighting fixtures are examined with particular focus on dynamic lighting applications with design metrics as the cost, the required wiring installation expenses and maintenance complexity. The proposed platform is optimized for applications where the grouping of LED-based lighting fictures clusters is essential, as well as their synchronization. With such an approach, the distributed control and synchronization of LED lighting fixtures' clusters is performed through a versatile network that uses the single wire Local Interconnect Network (LIN) bus. The proposed networking platform is presented in terms of its physical layer architecture, its data protocol configuration, and its functionality for smart control. As a proof of concept, the design of a LED lighting fixture together with a LIN-to-IEEE802.15.4/ZigBee data gateway is presented. Copyright © 2016 IFSA Publishing, S. L. Keywords: LED lighting, Solid-state lighting, Local interconnect network (LIN), DMX512, Wireless sensor networks (WSN), Architectural lighting, Greenhouse lighting. 1. Introduction
Light-Emitting Diode-based Solid-State Lighting (SSL) has been considered as the dominant technology for lighting world-wide. Compared to other existing lighting technologies, LED lighting has several
advantages, regarding their luminous efficacy, their life-time of operation, and their dynamic response [1, 2]. Until recently, lighting control was traditionally based on permanent wires between predetermined switches and the lighting fixtures. However, during the last decade, Building Management System (BMS)
http://www.sensorsportal.com/HTML/DIGEST/P_2824.htm

Sensors & Transducers, Vol. 200, Issue 5, May 2016, pp. 50-59
51
technologies have been introduced for enhanced building operation, based on buses like EIB (European Installation Bus), or LON (Local Operation Network) for the physical layer [3, 4]. Furthermore, the KNX is a standard that relies on the communication stack of EIB and is an open (EN 50090, ISO/IEC 14543), OSI-based, networking and communication protocol, that covers all of the aspects of Building Automation (BA). The main disadvantage of the aforementioned BMS solutions is the high wiring cost. For this reason wireless protocols, such as the KNX-RF, have been proposed, and they are used as BMS extensions. Alternatively, power line networking solutions, such as the X10, or the KNX power line extensions, which utilize the existing electric power wiring infrastructure for control, have been also introduced. All these BMS extensions have been extensively used for lighting applications where the synchronization between the lighting fixtures (LFs) is not important (simple on/off applications), as for example, in the industry sector, in professional buildings like hotels, in trade centers and sport stadiums. These extensions have been designed without mechanisms for lighting fixtures synchronization and therefore they are not suitable for this specific category of lighting applications.
Modern networking approaches, that support timing synchronization mechanisms, have been applied for lighting control and are based on embedded networking technologies using the Ethernet or Internet Protocol, embedded WiFi implementations [5] and Wireless Sensor Networking techniques [6]. However, all these approaches require the networking of every single LED Lighting Fixture (LLF), resulting to increased cost and management complexity concerning the continuous and secure connectivity.
Finally, the DMX512 wired protocol is used for lighting control, which is based on the EIA-485 standard for the physical layer, enabling the control of 512 lighting fixtures (channels) [7]. The EIA-485 bus standard enables the direct addressing of 32 up to 256 Lighting Fixtures (LFs) in a bus topology, while splitters are used for controlling a large number of LFs. Extensions of the DMX protocol based on Ethernet and IP networks have been recently proposed for lighting control with implementations of DMX over IP, such as Art-Net [8]. However, these DMX extensions have disadvantages due to the increased maintenance, installation cost, and the increased complexity, especially for Ethernet connectivity where the number of wires must be at least six (four signal plus two power cables).
For many lighting applications, the grouping of LEDs in clusters, as well as their timing synchronization, becomes a very important issue raising special control requirements. Applications of this type are those found in studios, theaters, decorative flood lighting, entertainment, landscape architecture, smart horticulture, etc., where strict requirements are imposed from the dynamic response of human vision. However the direct application of BMS technologies (or of extensions that can be integrated, e.g. Digital Addressable Lighting
Interface-DALI), is not suitable, mainly due to the required dynamic response, the installation cost and the management complexity. For LED clusters control, the necessity of a solution that can integrate the simplicity of a low-cost wired bus, like DMX-512 for full-duplex communication, is more than obvious.
In this paper, a versatile single-wire networking platform is proposed for the distributed control of LFs that are based on clusters of LLFs. This platform has been designed in an optimal way for improved dynamic response, which is mandatory for the implementation of lighting scenarios with high synchronization needs. Moreover, an efficient topology for the distribution of power and control signals is proposed, utilizing the minimum number of cables. The modular architecture followed enables the future extension of this platform in a scalable way using Wireless Sensor Network (WSN) technology [9] or embedded WiFi technology. In what follows, a complete description of the LED lighting fixtures clustering topology is given and different alternatives for the distribution of power supply and control signals for the LLFs are presented, utilizing the proposed networking platform, namely the LEDWIRE platform.
2. LED Lighting Clusters, Topologies and Control Networks In general, an LLF is comprised of the parts shown
in Fig. 1. In particular, a printed-circuit board (PCB) is usually designed where the LEDs are soldered and referenced as the LED Engine (LE). At the top of the fixture normally lenses are integrated and which have been selected according to the lighting application's needs (e.g. lighting angles and light distribution shape). These additional lenses, called as the secondary optics, may be either positioned onto the LED engine or in the frame of the fixture.
Fig. 1. The main parts of a LLF. The heat sink is always placed at the bottom of the
fixture. The heat sink must be in close contact with the PCB of the LED engine in order to release the temperature generated by the operation of the LEDs.

Sensors & Transducers, Vol. 200, Issue 5, May 2016, pp. 50-59
52
The power supply unit can be implemented either externally or onto the LED engine's PCB. The choice of the power supply implementation approach imposes particular implications regarding the power distribution topologies, as it is presented in the following paragraphs. 2.1. LED Lighting Clusters (LLCs)
The grouping of LED lighting fixtures in clusters
is of substantial importance, especially for cost reduction and maintenance of the lighting fixtures' network [10]. For example, in office lighting applications where we encounter a unified space with many top (ceiling located) lighting fixtures that must provide a uniform light, it is normal to have the fixtures connected in clusters and controlled through one or two wall switches. Another application example, where clustering can be advantageous, is in architectural lighting of buildings and landscapes. In particular, for indoor or outdoor lighting of large wall surfaces, bars of LEDs are normally placed near the floor, in RGB or monochrome combinations. This type of lighting is also referred to as wall washing.
All these lighting applications impose strict synchronization of the lighting fixtures dimming level and mixture of colors for the successful implementation of the selected lighting scenario. In other applications that require linear illumination, the use of a single lighting fixture with a very lengthy linear LED array is not practical and, therefore, a cluster of interconnected lighting fixtures is normally selected. Furthermore, for LED lighting applications like in fountains and pools, the use of LED clusters which are placed under water and are controlled with various topologies, remains the best solution.
Additionally, the use of the clustering approach is very important to the agricultural domain. In greenhouses, the plants (e.g. flowers and vegetables) are organized in raws (clusters). As it has been reported in several studies, the control of the lighting inside the greenhouse can positively influence the growth of the plants [11-13]. Particularly, the aim is to provide supplemental lighting, at top or inter-lighting 1topologies, controlling its period and spectrum.
2.2. LED Lighting Cluster Membership Attributes
The topologies which are applied for the
distribution of power and control signaling to the LED lighting fixtures (LLFs) affect the way that grouping of LLFs in clusters is performed, as well as the network architectures that are utilized for remote control. The main advantages and disadvantages of the most commonly used topologies will be discussed in more detail in the next sub-section.
The procedure of the lighting fixtures' clustering relies on the similarities in the characteristics' profile
of the class members of the particular cluster. According to particular applications specifications and requirements, all the cluster members must have similar characteristics. Among such characteristics are the luminance, the color, the color temperature, and, the time response. Obviously, all of the cluster members must have the same “On” or “Off” state. Other LLFs characteristics, such as the secondary optics (additional optical lenses), the physical dimensions, the power consumption level, and the power supply unit topology, are considered as non-critical for the cluster’s performance. Thus, regarding to the non-critical characteristics, each of the cluster members can have the same or different options compared to other members. The critical and non-critical attributes of the cluster members are presented in Table 1.
Table 1. Critical and non-critical attributes of the LLFs cluster members.
Attribute Name Critical Attibute
Luminance Yes Color Yes Color Temperature Yes Time Response Yes On/Off State Yes Secondary Optics No Physical Dimensions No Energy Consumption No Common Power Supply Unit No
2.3. Power and Control Distribution
Topologies for LLFs
LED-based lighting designs impose strict requirements for a high-performance DC power supply, small form factor and low cost. In particular, when the LED engines are grouped in clusters, the distribution of the power supply and control signals must be implemented in an efficient way in terms of controllability and cabling.
Two schemes of DC power supply are commonly used for LLFs, based either on constant voltage (CV), or on constant current (CC). On the other hand, from the LLF PCB perspective, two topologies for power supply distribution are usually applied. In the first topology, the LLFs are designed without any power circuits onboard (just the LEDs are soldered onto the printed-circuit board) as it is depicted in Fig. 2, where the LLF must be powered by external constant current supply units. According to this approach, a string of LLFs can be supported with a constant current single power supply unit. However, all the LLFs must have identical power supply requirements. In the most of the cases, this design constraint entails limitations in the LLFs selection, i.e.g. the lighting fixtures must be of the same type, or even of the same manufacturer.

Sensors & Transducers, Vol. 200, Issue 5, May 2016, pp. 50-59
53
Fig. 2. LED lighting fixture (LLF) powered from an external constant current power supply unit.
In the second topology, the LLFs have embedded current LED drivers onboard (LDoB- LED Driver onboard), as it is depicted in Fig. 3. In this case, the embedded current drivers follow buck, boost, or buck-boost converting topologies, so as to ensure that the appropriate amount of current is provided using a relatively wide range of external DC input voltage. The aforementioned topology imposes increased cost for the LLF unit as well as decreased energy efficiency. However, it is confirmed in practice that it is the best solution for medium to large-scale lighting applications and especially for LLF networking. Furthermore, the retrofit concept for the home ligting, according to which, a LED engine with the AC-to-DC power unit integrated into the same lighting bulb, is directly placed in the existing AC-powered bulb holdings. So, the lighting industry seems to be attracted by the approach of the LDoB.
Fig. 3. LED lighting fixture (LLF) with LED power driver onboard (LDoB architecture) and external constant voltage
power supply unit.
Another distinct advantage of the LDoB architecture is its inherent ability for LLF self-protection against over-heating and power problems such as broken, as well as, short circuits. Recent advances on solid-state lighting standardization [14] put a priority on the selection of the LDoB topology from the world-wide lighting industry in order to provide the necessary flexibility in power supply.
Based on our experience, gained from extensive LED lighting fixtures design for the last ten years, for
small-scale lighting applications (e.g. installations with less than 10 LLFs), it is better to use external constant current supply units and LED engines without LDoB. For medium to large-scale lighting applications, it is more cost effective to use constant voltage supply units with LDoB. The cost reduction in this case is up to 20 %. The application-level cost also decreases by following a string power supply connection scheme, that is, the replacement of several separated standalone LLF power supply units by just one with higher power capability. In Fig. 4, the utilization of constant voltage power supply units connected to LLFs with LDoB is illustrated, following both dedicated and string power distribution topologies [15].
Fig. 4. Constant voltage power supply in dedicated and string power distribution topologies.
For color Red-Green-Blue (RGB) lighting applications, three additional control channels are used, for mixing the primary colors in every LLF. Therefore, for these applications the installation complexity and cost increase, while the flexibility is reduced. Fig. 5 depicts the power supply topology for the case of an RGB LLF. As it is shown in Fig. 5, a discrete power supply unit is used for every one of the three colors.
Fig. 5. The power supply topology for a RGB LLF.
In the cases where the RGB channels are directly controlled from the external power supply units, through the incorporation of various power electronics switching circuits, long cables with significant current tolerance have to be used. Apart the increased cost of such cables, this topology suffers also from high

Sensors & Transducers, Vol. 200, Issue 5, May 2016, pp. 50-59
54
electromagnetic interference (EMI). Additionally, any future modification is limited due to the cabling inflexibility [16]. Regarding the clustering of RGB LLFs, Fig. 6 shows the power distribution topology. The power cables per color are routed to every LLF. The color mixing commands are given through discrete command signals at each one of the three power supply units. For medium to large-scale applications such a clustering topology impose certain limitations regarding the flexibility, the cost, and the maintenance of the lighting system.
Fig. 6. RGB LED lighting fixtures (LLFs) clustered according to the drive of each particular color.
As an alternative to the above traditional approach, a bus architecture for color control is proposed by many engineers. According to this, the LLFs should facilitate the networking function guided by a local microcontroller unit (MCU), through which they can get the color mixing commands (see Fig. 7).
Fig. 7. RGB color control topology for a cluster of LLFs based on the bus topology.
Regarding the power supply topology, any of the
CV and CC topologies presented above can be incorporated. According to the bus approach, the large
number of RGB high power signal cables is replaced by two bus signal lines (low power cables). For realizing this topology, a microcontroller must be embedded in every LLF that integrates the necessary networking technology and processes the lighting commands for the generation of the appropriate RGB control signals for the LED engines. As it has already mentioned, BMS extensions, like DALI and DMX512, can be utilized for such applications, enabling the digital control of the RGB channels for each LLF. However, these extensions rely on communication standards like EIA-485 for the physical layer, which use differential signaling for long ranges resulting to a large number of bus cables. 3. LEDWIRE Networking Platform for
Lighting Applications In this section we present the proposed LEDWIRE
networking plaform. The most significant novelties of this proposition lies firstly on the adoption of the Local Interconnect Network (LIN) as the bus through which a cluster of LLFs can be controlled, and secondly, on the ability of bridging the LIN-based LLFs with other wireless or wired networking protocols. Based on these contributions, we provide a flexible, reliable and long-life maintainable solution for lighting applications where there is the need either for demanding time synchronization, or for convenient and low cost in clustering. In the following subsections, we describe the details of foundation of the LEDWIRE, i.e. the physical layer of the bus, the facilitation of LLFs clustering, and the proposed data protocol structure, etc.
3.1. The Physical Layer of the Bus In lighting applications where the need for
bidirectional communication and control is of substantial importance, the LLFs must have an embedded microcontroller supporting a variety of serial bus communication protocols. As it has already mentioned, several wired communication protocols have been used for lighting control like DMX512, DALI, and EIB-KNX at the application level [17]. In particular, the DMX512 protocol has extensively been used for entertainment applications, with most realizations presenting difficulties in programming, limitations in communication and networking capabilities. Moreover, such realizations are normally based on proprietary solutions and are utilizing a large number of cables. The LEDWIRE platform has been designed as a low-cost lighting control network that allows for the simplicity of the concept of the DMX512 protocol but, on the other hand, ensures two-way communication and, at the same time, with less power and communication cables. An optimal bus topology for distributing power and RGB control signals in a LLF cluster can be realized using the

Sensors & Transducers, Vol. 200, Issue 5, May 2016, pp. 50-59
55
LDoB approach and a wired communication bus. For the implementation of the associated wired bus, the CAN and LIN wired bus standards, which are used in automotive applications, have been considered respectively. The CAN bus is more complex and more expensive than the LIN bus, and it is more appropriate for higher bandwidth applications [18, 19]. For these reasons the LIN bus is ultimately selected. Its simplicity and its low cost of implementation, are mandatory issues for medium to large-scale LLF deployments. The LIN standard specification covers the definition of the protocol and the physical layer, as well as the interfaces for the development tools and the application software [20]. Its widespread adoption from the automotive industry has resulted to the manufacturing of extremely low cost LIN drivers for LIN master and slave devices in form of integrated circuits. The communication protocol is based upon the Universal Asynchronous Receiver/Transmitter (UART) data format that implements a single-master/multiple-slaves communication interface topology. The main characteristics of the LIN bus can be summarized as follows:
- Low-cost single wire implementation; - Single master; - Self-synchronization without a quartz or ceramic
resonator in the slave nodes; - Deterministic signal transmission with signal
propagation time computable in advance. An additional advantage of the LIN bus is the
extended range of power supply input with single polarity, instead of the more complex power supply distribution of the EIA-485 standard. In Table 2, the key parameters are presented for the EIA-485 and the LIN buses [21].
Table 2. Comparison between EIA-485 and LIN protocols.
Parameter EIA-485 LIN Bus Length (m) 1200 40
Number of Bus Wires
2 for half duplex
4 4 for full duplex
1
Voltage Levels (V) -7 to +12 -27 to 40 Max. Number of Nodes 32 16 Cost Low Very Low
Driver Supply Voltage +3.3 V
up to +5 V Up to +27 V
DC/DC converter No Yes
Baud Rate > 10
Mbit/sec 20
kbits/sec ESD/EMI immunity Normal High Under-Voltage Protection No Yes Over-Temperature Control
No Yes
Short-Circuit Protection Yes Yes Installation/Wiring Difficult Easy
Special Wires Twisted
Pairs No
We have compared the LIN bus with the EIA-485 standard, since the latter is the physical layer of the DMX512 and other traditional protocols for lighting. Accordingly, a number of advantages for the LIN bus over EIA-485 are evident from Table 2, such as the simplicity, the integration of a DC/DC converter in the LIN driver, the wide range for the supply voltage and the extremely low cost. It is clear that LIN bus is fully compatible with all the 12 VDC or 24 VDC power operated commercially available lighting fixtures. This means, that the voltage level of the bus data signal can be easily tied at the existing power supply signal, e.g. at 12 VDC. Hence, there is no need to have a secondary power supply units for driving the bus as it is happening in the case of using any pf the EIA-485-based protocols. For these reason the LIN bus was chosen to be used as the physical layer of the LEDWIRE networking platform.
3.2. LED Lighting Fixtures' Clustering Based on LEDWIRE
In the proposed platform, the wired control of
remote LED lighting fixtures is based on the LIN bus. More specifically, the platform comprises a LIN master module with gateway capability, namely the LEDWIRE Master, and a maximum of 15 individual addressable LLFs acting as LIN slaves, namely the LEDWIRE Slaves. Each LLF can be implemented with a LED engine of various topologies (string, parallel or combined). The master module communicates with the LLF slaves using appropriate messages through the local LIN bus (see Fig. 8).
Fig. 8. LIN master communication with LLFs LIN slave.
The LEDWIRE Master module specifies certain
LED engine parameters in the slave modules, as the state (on/off), the desired lighting level (dimming), as well as the required color mixing. For each LEDWIRE Slave, the lighting parameters are transmitted as commands over the control bus and are translated to specific timer values for the generation of appropriate pulsed-width modulated (PWM) waveforms. Four

Sensors & Transducers, Vol. 200, Issue 5, May 2016, pp. 50-59
56
PWM waveforms (for the Red, Green, Blue and White channels) control the individual LED engines for the required lighting level and color mixing scenario. It is also worth noticed that the termination time is not affected from the transmission of control messages in the LIN bus, since it has deterministic behavior and the delays added can be estimated in advance. This is very significant for cases of lighting fixture extension using strings of LLFs, which are commonly controlled by sharing the same LIN address and which must be perfectly synchronized for the particular lighting scenario realized (i.e. negligible jitter for the execution of the lighting scenario).
3.3. Data Protocol Structure Performance Considerations
In a typical lighting application, the master of the
LEDWIRE network always initiates the communication by transmitting the associated commands to the members of the lighting cluster. For the message based API (Application Programming Interface) that we have implemented, it has been decided that the minimum information content for lighting applications must include data fields for the Red, Green, Blue and White channels, as well as data for lighting intensity operations as Fade (FADE In/FADE Out for intensity control) and Scen (Scenario). Therefore, we have allocated one byte for each of the aforementioned command data fields, thus enabling true-color (24-bit color depth) lighting applications and white light saturation (if White LEDs exist on LED engine). The LEDWIRE Master transmits the command data to all the LEDWIRE Slaves. The transmission to all the LEDWIRE slaves is called Global Command according to the LIN standard ver. 2.1 (Fig. 9a). In the LEDWIRE platform, it is used for the realization of a LIN broadcast scheme, that is, for sending a frame from the LIN master to all LIN slaves. The Global Command is very important for lighting applications, since, through it, the synchronization of all members of a lighting cluster can easily be assured.
With respect to the Global Command, the LEDWIRE Master realizes a specific frame structure, which starts with a Break field followed by a stop bit, a Synch field, a Protected Identifier field (PID), the data field (six bytes payload for the LEDWIRE network plus two null fields reserved for future use), and, finally, one byte for the Checksum field (CS). Except for the Break field, all the other fields have 10 bits each (one start bit plus eight data bits plus one stop bit). The structure of the Global command is given in Fig. 9a, where the Break and Synch fields, with which each frame starts and ends, are not depicted. The Break field is a low-level state signal with duration of thirteen (13) bit periods and is terminated with a Stop bit, while the Synch field has duration of ten (10) bit periods. The structure of the Protected Identification field (PID) is given in Fig. 9b.
The PID field carries addressing information for the LIN bus. The ID0-ID3 bits define the identity of the slave addressed by the master. Address 0000b is reserved for the Global Command, while the remaining combinations are used for independently addressing up to fifteen (15) LIN slaves of LLF cluster. The bits ID4 and ID5 determine the number of the data bytes in the transmitted frame, while bits P0 and P1 are parity bits
In the developed message-based API, a LLF Status Command was realized, on the basis of which the LEDWIRE Master can acquire the status of a LLF in a lighting cluster. When the LIN master executes this command, it transmits through the LIN bus the appropriate data, which comprise a Break field, a Synch field and a PID field with the identity of the slave that must be addressed. Subsequently, the addressed slave node responds by sending the LLF Status data, that comprise, as it is illustrated in Fig. 9c, the TEMP field for the temperature, the LIGHT field for the brightness level measured, the MOTION field that contains motion data from an embedded occupancy sensor and the STATUS field that contains information about the LED engine’s embedded microcontroller operation parameters (e.g. firmware version number, total hours of operation, errors report codes, etc.). In cases where there is no occupancy, light and/or temperature sensors onto the LED engine, then the relevant status fields are filled with zero values. The CS field is the checksum with which the slave’s response is terminated.
Fig. 9. The Global Command (a), the Protected Identifier (PID) field (b), and the Status Command followed by a
Slave’s response (c).
The status information acquired from the LLFs can be exploited to reach energy reduction in lighting applications in a building environment [22, 23]. Thus, the LEDWIRE network can enable the development of intelligent ambient applications in buildings [24].
Concerning the LIN bus activity in the LEDWIRE platform, the LIN master initiates a command session by sending a lighting application command in the LIN bus. With the LEDWIRE platform can be achieved can be achieved the maximum time synchronization following the Global Command. The LIN

Sensors & Transducers, Vol. 200, Issue 5, May 2016, pp. 50-59
57
specification standard determines a maximum baud rate of 20 kbps. Accordingly, we have selected a baud-rate of 19.2 kbps, which is supported from the UART serial peripheral of the microcontroller used. This data rate, combined with the light-weight data format structure, ensures that the dynamic response of the LLFs will be always faster than the 100 Hz that is the limit of the human visual perception.
4. Implementation of a LEDWIRE Network Platform LEDWIRE Master and Slave nodes can be
implemented using either microcontrollers with an integrated LIN driver, or separated microcontroller and LIN driver integrated chips. The final choice depends on the requirements imposed by particular applications for the physical dimensions of the control and communication boards. We selected the second choice because it allows for greater flexibility in terms of power supply distribution. In order to limit the form factor of the nodes we used low pin-count microcontrollers, and electronic components of surface-mounted technology (SMT). For the microcontrollers we adopted the Programmable-System-on-Chip technology (PSoC). In particular, we used the 8-bit PSoC microcontroller CY8C21123 from Cypress Inc. This is an eight pin reconfigurable device (two pins for power supply and six input/output pins). Its six I/O pins can be configured to function as digital or analog inputs and outputs, timers, comparators, pulse width modulation channels, as well as serial communication buses as I2C, SPI and UART, respectively. This microcontroller implements up to two different UART peripherals and due to this fact is suitable to support the design of both the master and slave nodes. Fig. 10 demonstrates the simplicity of the proposed implementation. In the LEDWIRE Slave node case, the microcontroller is configured to have one UART peripheral for interfacing with the LIN driver, and four distinct 8-bit PWM channels for controlling the color mixing of RGBW LED engines (Fig. 10a). Similarly, in the LEDWIRE Master mode implementation, the microcontroller has been configured to have one UART peripheral for the LIN driver interface, and another serial interface for the communication with various communication protocols’ embedded modules.
As a proof of concept of the implementation of a gateway in the LEDWIRE Master device, we choose to implement the communication with a IEEE802.15.4/ZigBee module for wireless sensor networking applications (Fig. 10 b).
The AT6625 LIN driver from Atmel Inc. has been adopted for use in both the master and slave nodes. Fig. 11 illustrates the LED engine we designed and implemented for our experiments. It is based on the XLamp MC-E Color LED from CREE Inc. This is a four-core, common lens, Red-Green-Blue-White (RGBW) power LED device.
Fig. 10. (a)The LEDWIRE Slave node, (b) the LEDWIRE Master node.
Fig. 11. The LEDWIRE Slave implementation onto a LED engine.
In Fig. 12 the LEDWIRE Master node is depicted.
It is a small form factor printed circuit board with LIN bus driver, a 8-pin PSoC microcontroller, and a ZigBit IEEE802.15.4/ZigBee module from Atmel, Inc. operating at the frequency band of 2.4 GHz. Each LEDWIRE Master can control a cluster of up to 15 different LLFs. Each LLF may consist of several LED engines. Instead of ZigBee wireless communication protocol, other wireless protocols, such as the WiFi and Bluetooth, or wired protocols such as Ethernet, could also be used by the LEDWIRE Master gateway device. With this versatile architecture, wide LLF clusters network can be easily implemented and managed.
Fig. 12. The front side of the LEDWIRE Master node with ZigBee gateway capability.

Sensors & Transducers, Vol. 200, Issue 5, May 2016, pp. 50-59
58
Additionally, a suitable software GUI (Graphical User Interface) based on LabVIEW, depicted in Fig. 13, has been developed for testing the LEDWIRE network. By this software GUI, up to six different LLF clusters can be controlled. For the interface with the personal computer at which the GUI is running, a LEDWIRE Master node has been used. Specifically, the UART port of the LEDWIRE Master node is routed to a UART-to-USB converter dongle.
Fig. 13. The LabVIEW-based software GUI for LEDWIRE network platform testing.
5. Conclusions
A modular platform has been reported for the networked control in LED lighting applications, where the clustering of lighting fixtures is important and the synchronization between the LED engines imposes strict requirements for data communication delays. The proposed platform is a complete solution for the control of LED lighting clusters and constitutes a unified approach for the distribution of power supply and control signals of the LED engines using the minimum number of cables. Moreover, the requested lighting scenarios are executed in a simple manner in the LED engines, by using the embedded microcontroller and its networking capabilities. The high level commands at the application layer are transmitted through the LEDWIRE network to the LFs; embedded microcontrollers, wherein they are translated and the requested scenario is executed at each particular LED engine. Following this approach, the data traffic is kept to the minimum. Regarding the LIN-based embedded wired network, the minimum latencies for the reception and execution of lighting scenarios from the LED engines are achieved. These latencies are always below the minimum threshold imposed by the human vision persistence time for a successful lighting application. Concluding, the proposed approach of the LEDWIRE network allows for bidirectional communication, control and synchronization in a cluster of LLFs. Also, the LEDWIRE supports lower complexity than Ethernet networking or DMX solutions, and it ensures lower
cost of implementation, compared to WiFi or WSN “full topology” implementations where each LLF must integrate its own wireless networking platform capability.
Acknowledgements
All authors would like to thank the Postgraduate (MSc) Program of Studies, "Automation of Production and Services", of the Automation Engineering Department of the Piraeus University of Applied Sciences for providing the required funding in order to undertake this research project.
Additionally, the authors wish to thank Arrow Electronics Hellas S.A. and Atmel Inc. for providing the development tools and technical support.
References [1]. Yasuda, T., Hayakashi, T., Naoki, S., Saito, A.,
Maehara, A., Okada, A., Otani, H., Hasegawa, J., Light sources and lighting circuits, Journal of Light and Visual Environment, 35, 2011, pp. 142-159.
[2]. Doshi, M., Zane, R., Digital architecture for driving large led arrays with dynamic bus voltage regulation and phase shifted pwm, in Proceedings of the Twenty-Second Annual IEEE Applied Power Electronics Conference and Exposition (APEC’07), Anaheim, CA, 2007, pp. 287-293.
[3]. LonMark ® application layer interoperability guidelines, Echelon Corporation, 2002.
[4]. Cho, S., Dhingra, V., Street lighting control based on lonworks power line communication, in Proceedings of the IEEE International Symposium on Power Line Communications and Its Applications, (ISPLC’08), Jeju Island, 2008, pp. 396-398.
[5]. Connected lighting solution. http://www.greenwavereality.com/solutions/connected-lighting-solution/.
[6]. Maxfield, C., IPv4, IPv6, The Internet of Things, 6LoWPAN, and lots of other “Stuff”, http://www.eetimes.com/author.asp?section_id=36&doc_id=1285236&piddl_msgpage=2#msgs.
[7]. López, C., Doval, J., Pereira, M., Pérez, S., Dios, J., López, O., Dmx512 controller for high brightness rgb led matrix, in Proceedings of the IEEE International Symposium on Industrial Electronics (ISIE’07), Caixanova - Vigo, 2007, pp. 3025-3029.
[8]. Newton, S., In Art-net and wireless routers, Perth, Western Australia, in Proceedings of the Asia-Pacific Conference on Communications, Perth, Western Australia, 2005, pp. 857-861.
[9]. Yurish, S. Y., Cañete, J., High performance sensor nodes for wireless sensor networks applications, Sensors and Transducers, 18, 2013, pp. 92-99.
[10]. Smet, K. A. G., Ryckae rt, W. R., Pointer, M. R., Deconinck, G., Hanselaer, P., Optimization of colour quality of led lighting with reference to memory colours, Lighting Research and Technology, 44, 2012, pp. 7-15.
[11]. Böhme, M., Grbic, N., Paschko, K., Pinker, I., Growth and internal quality of vietnamese coriander (polygonum odoratum lour) affected by additional lighting with blue, red and green leds, In Acta

Sensors & Transducers, Vol. 200, Issue 5, May 2016, pp. 50-59
59
Horticulturae, De Pascale, S., Jiang, W. J., Connellan, G. (Eds.), International Society for Horticultural Science, Vol. 1107, 2015, pp. 113-119.
[12]. Han, J., Huang, G. J., Wu, T., Sun, X. M., Liu, Y., Gao, R. F., Photoperiod affects morphology, flower productivity and photosynthesis of forced potted paeonia lactiflora in greenhouses, in Acta Horticulturae, Criley, R. A. (Ed.), International Society for Horticultural Science, Vol. 1104, 2015, pp. 211-217.
[13]. Gömez, C., Mitchell, C. A. Physiological and productivity responses of high-wire tomato as affected by supplemental light source and distribution within the canopy, J. Am. Soc. Hortic. Sci., 141, 2016, pp. 196-208.
[14]. Zhaga, What is an led light engine?. http://www.zhagastandard.org/specifications/lightengine.html.
[15]. Thomas, B. A., Azevedo, I. L., Morgan, G., Edison revisited: Should we use dc circuits for lighting in commercial buildings? Energy Policy, 45, 2012, pp. 399-411.
[16]. Ren, H., Zhou, K., Li, Z., Wang, H. Q., Research and realization of new stage lighting control system, in Proceedings of the Fourth International Joint Conference on Computational Sciences and Optimization (CSO), Kunming, Lijiang, Yunnan, 2011, pp. 777-779.
[17]. Lighting control protocols, Report IES-TM-23-11, Illuminating Engineering Society of North America - IES, 2011.
[18]. Tian, F., Wu, X., Liu, J., Research and realization of led display system based on combining can bus with dmx512 standard, in Proceedings of the International Conference on Audio, Language and Image Processing (ICALIP’08), Shanghai, 2008, Shanghai, pp. 813-818.
[19]. Interior ambient lighting module with lin interface, user’s guide - ds51714a, Microchip Tchnology Inc., 2008.
[20]. LIN, C. Lin specification package, revision 2. 1. 2006. [21]. Rs-422 and rs-485 standards overview and systems
configurations, application report - slla070d, Texas Instruments, 2002 (2010 revisited).
[22]. Pandharipande, A., Caicedo, D., Daylight integrated illumination control of led systems based on enhanced presence sensing, Energy and Buildings, 43, 2011, pp. 944-950.
[23]. Delaney, D. T., O'Hare, G. M. P., Ruzzelli, A. G., Evaluation of energy-efficiency in lighting systems using sensor networks, in Proceedings of the First ACM Workshop on Embedded Sensing Systems for Energy-Efficiency in Buildings, Berkeley, CA, 2009, pp. 61-66.
[24]. Huynh, T. P., Tan, Y. K., Tseng, K. J., Energy-aware wireless sensor network with ambient intelligence for smart led lighting system control, in Proceedings of the 37th Annual Conference on IEEE Industrial Electronics Society (IECON’11), Melbourne, VIC, 2011, pp. 2923-2928.
___________________
2015 Copyright ©, International Frequency Sensor Association (IFSA) Publishing, S. L. All rights reserved. (http://www.sensorsportal.com).

Sensors & Transducers, Vol. 200, Issue 5, May 2016, pp. 60-65
60
Sensors & Transducers
© 2016 by IFSA Publishing, S. L. http://www.sensorsportal.com
The Slot Waveguide Theory and its Economic Applications in NanoSensors and NanoTransducers:
A Review
Zhang Longxiang Economics and Management School, Wuhan University, Wuhan, Hubei, 430072, China
E-mail: [email protected]
Received: 29 March 2016 /Accepted: 29 April 2016 /Published: 31 May 2016 Abstract: It has been proved that a slot waveguide made of low refractive materials can also cause total refraction of lights and enstrengthen the light field. This article makes a review of researches in nano-transducers and nanosensors based on double slot waveguide structure. Results from their numerical simulation verified that the transducer responses to movement in nanometer level and has a wide measurement range. One possible usage is given to show the possible economic value of the transducer. This article was first published in 2013, this version works as a complement of the old version. Copyright © 2016 IFSA Publishing, S. L. Keywords: Slot waveguide, Nano-sensing, Economic applications. 1. Introduction
The development of modern science gives extra demand to materials which are supposed to be intelligent, small in size and highly integrated, which gives space to nanometer science and nanometer materials, and nanosensors and nanotransducers, with their advantage in size and precision to traditional sensors and transducers, become popular in theoretical and practice fields.
The theory and applied research on nanosensors and nanotransducers started in the 1990s, researchers from the States and China made great progress in chemistry and biotech nanosensors, which could be used in testing of body cells, other researches were made in air-sensitive sensors, resistance nanosensors, and has been known by the high sensitivity and security. The idea of Slot Waveguide was raised by Michal Lipson in 2004 [1], in their research, they found that there exists a special waveguide made of low refractive materials can also cause total
refraction of lights and enstrengthen the light field. Since then, many researches were made to deepen the structure. Galli confirms the fact by experiments [2], and Lipson's further research focused on the shrink in size of slot waveguide, Gorbach takes single photon sources in recycle slot waveguide [3-4]. And the structure is further explored in many materials in experiments.
The slot waveguide structure is featured by its special geologic structure and tinniest size, and atom gas or rare earth metal could be mixed in the low refraction area of the slot waveguide, with the electric field stricted in nanometer level low restructure area, the sensitivity is raised, and the highly sensitive index of refractive test could be done by testing the slot structure and the relative index of refractive among the materials in the slot.
This article makes conclusion on slot waveguide theory, and gives a review of the design of nanotransducer based on slot waveguide. With the benefits of the transducers and sensors using slot
http://www.sensorsportal.com/HTML/DIGEST/P_2825.htm

Sensors & Transducers, Vol. 200, Issue 5, May 2016, pp. 60-65
61
waveguide, this article further introduces a switch designed using this theory. Economic analysis is given for each of the application to show how the application may be used and the economic values for the researches. A conclusion is given at the end of the article. This article was first published in Vol 157, 2013, entitled 'The design of a nanotransducer based on slot waveguide and its economic applications', however, that published version was only a draft because the editor didn't notice the final version, which was mailed to him in September 2013. This article is the very final version of that that article. The author and the journal agree on publishing it not as a new article, but as a complement and replacement of the 2013 article.
2. The Theoretical Principle of Slot Waveguide Before the exploration of slot waveguide, the
optical waveguide follows a cylinder structure, which has a core in the middle, and the materials with low index of refractive surrounds it [5]. The light field is mainly converged within the waveguide core made of high index of refractive materials, which is micron level.
The raise of slot waveguide gives another option. In the slot waveguide structure, the waveguide core is nanometer width made of a mixture of high index of refractive materials and low index of refractive materials, the total refraction makes the light field conveying in the middle, and the energy is magnified. This changes the situation that the efficient convey of light containing information uses the total reflection, which requires the materials be surrounded with high refractive materials. Also with slot waveguide, the convey of light in low refractive materials is energy saving, which even gives a device more flexibility with its tiny size. And since the research started, researchers made progress in making the size even smaller, and many materials were employed in making a slot waveguide.
The slot wavedguide structure has two high refractive sides and a low refractive core. The width of low refractive should be far samller then the light wavelength.And Xiao made clear theThe principle of slot waveguide [6], which is based on Maxwell electromagnetic field theory.When there is transverse magnetic model slot waveguide, the electric movement is still continous at the vertical direction. As to boundary condition of electromagnet field, the electricity field intensity satisfies:
2
2S H
H s
E n
E n= (1)
Variables with subtitle S is the slot, and H is
the waveguide material on the two sides. In a double slot waveguide model, The Maxwell function for electric field is (2):
2
2
2
2
2
1cosh( );
1cosh( ) cos[ ( )]
sinh[ ( )]
( ) ;
1cosh( ) cos[ ( )]
sinh[ ( )]
exp[ ( )];
s
s HH
sH
s H
x
s HC
sH
s H
C
x x an
a x an
x an
E x A a x b
a b an
b an
x b x b
γ
γ κ
γ κκ
γ κ
γ κκγ
< −+ −= < < −+ −
− − >
(2)
This factors are the same as in a typical Maxwell
electronic field, Hκ is the wave ratio in the high index
of refractive layer, which is the feature value for TE model electromagnet, sγ is the decrease index in low
index of refractive layer of the slot, Cγ is the decrease
constant in the covering layer. The constant A is defined as:
2 2 2
00
0
,H Hk n kA A
k
−= (3)
where 0A is the constant, 0k is the vacuum wave cost. In Lipson's (2004) initial design of slot waveguide, a typical 3D model of slot waveguide is structured as Fig. 1.
Fig. 1. The configuration of sinular slot waveguide. Fig 1 shows the structure of slot waveguide.
According to the field distribution from the researchers, the increase in the slot causes the increase in light field. For the materials in Fig. 1, the
light power is related to both the width sw and the
area of the section. The slots are low index refractive materials compared with the side materials, which raises total refraction and the augment of light. The

Sensors & Transducers, Vol. 200, Issue 5, May 2016, pp. 60-65
62
low refractive materials is normally the air, and the flat area thus has many choices. When
sw increases,
the volume of the electronic raises and the average field intensity decreases.
When the width of the slot is mircometer level, there will be light energy interchange and the convey specific changes. Sometimes even causing a redistribution in the slot waveguide system. And the seeable lights are restricted in the low refractive area. For the Maxwell function, the feature value is:
( , , ) ( ) exp[ ( )]E y x t E y i x tβ ω= − (4)
The theory for slot waveguide is based on
Maxwell function and Lipson take the special structure to make total refraction in low refractive material. In a slot waveguide, the change in size in nanometer level makes significant change in the distribution of light field energy, and the structural change of the slot could thus be measured by watching the change of slot size. Besides, the measurement of the energy change in double slots eliminates the effect of light source bias to the measurement results. Based on such theory, we may analyze the reflection of double slot waveguide to nanometer level movements and improve the structure of double slot waveguide. 3. The Use of Slot Waveguide: a
Nanosensor with High Precision The classic singular mode structure was raised by
Soref in 1991 [8], which is important for micro semiconductor research. However, when the width of slot raises, the energy cost more than doubles, which requires a much thicker utter material to hold the field. [9].
In Chapter 2, the article has concluded the function of light field in TE model. In order to further shrink the device size and lower the voltage, later research turn their attention to multiple branch structure. The research of Peng proves multiple slot structure assembles more energy in the slots, the inner width of silicon waveguide has larger influence than the utter side. Since then, multiple slots structure has been popular with studiers. Li and Jiao explores a nanosensor based on double slot waveguide [10]. This chapter introduces how their sensor is deigned and the simulate results. The sectional view of their structure is shown in Fig. 2.
For a singular slot waveguide, the quick shrink requires the base layer thicker than 2000 nm if the silicon photon line is larger than 230 nm. However in a double slot waveguide, the base layer can be thinner, Jiao designed the slot waveguide and made the low refractive material is the air and the refractive index is 1.0slotn = , which means the slot waveguide is empty in the middle, and can be filled with dry atom or gas. The input light field is set at 1550 nm continue wave, TE model, and conveys along Z.,
which is frequently used value in research of slot waveguide. The size of devices can be further shrunk by using the folded interfere structure, which is not shown in this article. It's important to point out that the slot width sw remains unchanged thus the electric field in the slot under an identical voltage keep the same, which in turn lowers the working voltage.
Fig. 2. The configuration of transducer based on double
slot waveguide (sectional view).
In Jiao's article, they further examined the reaction when the press, temperature or acceleration changes in high refractive waveguide, and the slot waveguide shows good behavior in the tests. To better describe the electricity field, the inner energy distribution within the slots can be detected by measuring the change on slot energy limitation factor. We can see from the simulation results that the sensitivity of the transducer reduces slightly, but the input light that is needed for stable mode reduces significantly, which means a significant raise in measurement precision.
This chapter is quite a good example for the advantage of the slot waveguide, which is meant to be high sensitive, and could be used in many measurements. Also with its benefits in designing and manufacturing, it's easy to spread and thus may bring even larger economic value.
Furthermore, other economic use for this structure to be explored should be changing the materials so as to promote the measure range and the precision.
4. The Economic Analysis on Slot Waveguide and Nanosensing
Nanosensing has attracted many researchers' attentions, Zhang [11] makes a conclusion on the use
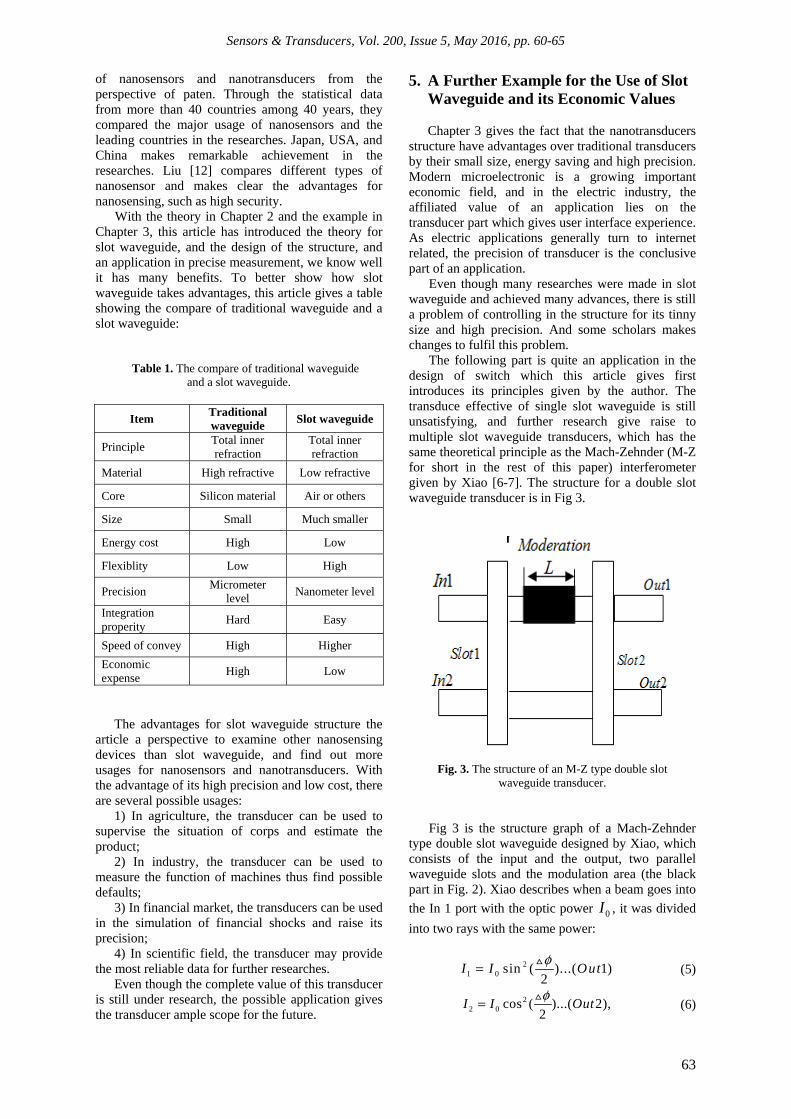
Sensors & Transducers, Vol. 200, Issue 5, May 2016, pp. 60-65
63
of nanosensors and nanotransducers from the perspective of paten. Through the statistical data from more than 40 countries among 40 years, they compared the major usage of nanosensors and the leading countries in the researches. Japan, USA, and China makes remarkable achievement in the researches. Liu [12] compares different types of nanosensor and makes clear the advantages for nanosensing, such as high security.
With the theory in Chapter 2 and the example in Chapter 3, this article has introduced the theory for slot waveguide, and the design of the structure, and an application in precise measurement, we know well it has many benefits. To better show how slot waveguide takes advantages, this article gives a table showing the compare of traditional waveguide and a slot waveguide:
Table 1. The compare of traditional waveguide and a slot waveguide.
Item Traditional waveguide
Slot waveguide
Principle Total inner refraction
Total inner refraction
Material High refractive Low refractive
Core Silicon material Air or others
Size Small Much smaller
Energy cost High Low
Flexiblity Low High
Precision Micrometer
level Nanometer level
Integration properity
Hard Easy
Speed of convey High Higher
Economic expense
High Low
The advantages for slot waveguide structure the article a perspective to examine other nanosensing devices than slot waveguide, and find out more usages for nanosensors and nanotransducers. With the advantage of its high precision and low cost, there are several possible usages:
1) In agriculture, the transducer can be used to supervise the situation of corps and estimate the product;
2) In industry, the transducer can be used to measure the function of machines thus find possible defaults;
3) In financial market, the transducers can be used in the simulation of financial shocks and raise its precision;
4) In scientific field, the transducer may provide the most reliable data for further researches.
Even though the complete value of this transducer is still under research, the possible application gives the transducer ample scope for the future.
5. A Further Example for the Use of Slot Waveguide and its Economic Values
Chapter 3 gives the fact that the nanotransducers
structure have advantages over traditional transducers by their small size, energy saving and high precision. Modern microelectronic is a growing important economic field, and in the electric industry, the affiliated value of an application lies on the transducer part which gives user interface experience. As electric applications generally turn to internet related, the precision of transducer is the conclusive part of an application.
Even though many researches were made in slot waveguide and achieved many advances, there is still a problem of controlling in the structure for its tinny size and high precision. And some scholars makes changes to fulfil this problem.
The following part is quite an application in the design of switch which this article gives first introduces its principles given by the author. The transduce effective of single slot waveguide is still unsatisfying, and further research give raise to multiple slot waveguide transducers, which has the same theoretical principle as the Mach-Zehnder (M-Z for short in the rest of this paper) interferometer given by Xiao [6-7]. The structure for a double slot waveguide transducer is in Fig 3.
Fig. 3. The structure of an M-Z type double slot waveguide transducer.
Fig 3 is the structure graph of a Mach-Zehnder type double slot waveguide designed by Xiao, which consists of the input and the output, two parallel waveguide slots and the modulation area (the black part in Fig. 2). Xiao describes when a beam goes into
the In 1 port with the optic power 0I , it was divided
into two rays with the same power:
21 0 sin ( )...( 1)
2I I Out
φ= (5)
22 0 cos ( )...( 2),
2I I Out
φ= (6)

Sensors & Transducers, Vol. 200, Issue 5, May 2016, pp. 60-65
64
where φ is the phase separation:
oL k n Lφ β= = (7)
where β is the constant separation of convey,
other parameters were all defined. With such switch, it has the advantage of space saving and energy saving.
In Xiao's research, which came as a graduation paper, he further developed the switch in many ways, one impressing work lies in a asymmetry M-Z micro stream sensor, which he uses the micro cycling concept, and makes highly sensitive sensors with the energy cost far smaller than slot waveguide theory, and much easier to manufacture. While if a symmetry M-Z structure is applied, as Xiao further discussed, would need a safe layer. And many tests were made in his article to examine, compare, and explore.
The economic use for such M-Z switch should be really ample. With the easy manufacturing demand, the switch is liable for large scale usages. And the high tolerance for artifice makes it easy to make and really useful. Also if this switch is planted with integrated circuits, the intelligence level would raise, thus could be used in artificial intelligence.
6. Conclusion
Nowadays, with the rapid progress for automatic, and intelligence devices, nanosensors and nanotransducers, with is small in size, flexible, and quick reaction, has been used in biotech, military and other fields, not only because of its tiny size, but also for its high precision and low energy expense. This article makes conclusion for researches in slot waveguide and nanosensing not only from engineering perspective. But also the economies applications and values. The structure is not only a group of micro materials, but can be explored in many ways.
The theory principle was first given, which almost all researches may do, and really common in microelectronics. Nanotransducers are popular in theoretical and practice fields with their advantage in size and precision to traditional transducers, and its widely used to raise the precision and cut measurement costs and brings bulk of economic gains. To confirm the economic value of the structure, an example of a precision position is given which the transducer measures the untouchable through projection of slot and reflection of the measured object, and the result shows the structure is feasible to obtain high precision. Then the design of a nanosensor was given, which was confirmed by the original author through software. The nanosensor is remarkable for its high precision and wide measurement range. To further introduce the economic value for slot waveguide, this article then makes compare of traditional waveguide and a slot waveguide. In order to better prove the economic
value and the further study in slot waveguide, Chapter 5 is employed to show the other use in slot waeguide, which is much improved in principles, which is called M-Z slot waveguide switch by researcher, and other uses of nanosensing were given after this example.
Other unrevealed parts for nanosensor and nanotransduser should be the high security, which can be used in medicine, biotech, microelecticity and even country security. And slot waveguide, with its all advantages, should also take its place, which is a research direction for the future. References [1]. V. Almeida, C. Barrios, Guiding and confining light
in void nanostructure, Optics letters, 2004, 11, pp. 11209-1211.
[2]. M. Galli, at al., Strong enhancement of Er 3+ emission at room temperature in silicon-in-insulator photonic crystal waveguide, Appl, Phys. Lett., 88, 25, 2006, pp. 251114-251114-3.
[3]. A. V. Gorbach, Femtosecond manometer-sized optical solitons, Phys, Rev., A 84, 2011, 023827.
[4]. T. Jones, M. Hoehberg, Optical modulation and detection in slotted silicon waveguides, Optics Express,13, 14, 2005, pp. 5216-5226.
[5]. X. Liu, Y. Gu, Design of the integrated sensor system for two-dimension position based on slot waveguide [C], Si Chuan University Papers, 38, 1999, pp. 214-222 .
[6]. Xiao Si Miao, Study of slot optical devices, Zhejiang University, 2010.
[7]. J. Wang, W. Zhao, A sensor used for measuring displacements in lager angel with a nanometer accuracy, China Laser, 33, 4, 2001, pp. 219-223.
[8]. R. Soref, J. Schmidtchen, Large single-mode rib waveguides in GeSi-Si and Si-on-SiO, Quantum Electronics, Vol. 27, 8, 1991, pp. 1971-1974.
[9]. Peter G. LoPresti and Warren E. Finn, Fiber-optic sensor system for rapid positioning of a microelectrode array, Applied Optics, 1998, 37, 16, pp. 3426-3431.
[10]. Jiao Wentan, Li Xiaoguang, A novel nanosensor based on slot waveguide, Optical Electronic Technology, 6, 2011, pp. 117-120.
[11]. Zhang Xu, Zheng Jia, Global Innovation Status and Trends of Nano-sensor Technology from perspective of Patent Analysis, Science and Technology Management Research, 2011, 17, pp. 30-33.
[12]. Liu Kai, et al., Research and Application of Nanosensor, Instrument Technique and Sensor, 2008, 1, pp. 10-12.
Note The author also has a degree in optics & electronic engineering, this article mainly introduces the engineering design of nanosensing as well as some economic comments and applications. The author thanks IFSA Publishing, S.L., the copyright owner, to allow for replacement of the 2013 article.

Sensors & Transducers, Vol. 200, Issue 5, May 2016, pp. 60-65
65
___________________
2016 Copyright ©, International Frequency Sensor Association (IFSA) Publishing, S. L. All rights reserved. (http://www.sensorsportal.com)

Sensors & Transducers, Vol. 200, Issue 5, May 2016, pp. 66-70
66
Sensors & Transducers© 2016 by IFSA Publishing, S. L.
http://www.sensorsportal.com
Research on Mechanical Properties of Concrete Constructs Based on Terrestrial Laser Scanning Measurement
1, 2 Hao Yang and 2 * Xiangyang Xu
1 Jiangsu University of Science and Technology, Zhenjiang City, Jiangsu Province, P. R. China 2 Geodetic Institute, Faculty of Civil Engineering and Geodetic Science, Leibniz University Hanover,
Nienburger Street 1. D-30167, B260, Hanover, Germany * E-mail: [email protected]
Received: 29 April 2016 /Accepted: 27 May 2016 /Published: 31 May 2016 Abstract: Terrestrial laser scanning (TLS) technology is broadly accepted as a structural health monitoring device for reinforced concrete (RC) composite structures. Both experiments and numerical analysis are considered. In this submit, measurements were conducted for the composite concrete beams. The emphasis in numerical simulation is given on finite element methods (FEM) which is corrected by the response surface methodology (RSM). Aspects considered are effects of material parameters and variation in geometry. This paper describes our recent progress on FEM modeling of damages in concrete composite structures based on the TLS measurement. We also focus on the research about mechanical properties of concrete constructs here. Copyright © 2016 IFSA Publishing, S. L. Keywords: Reinforced concrete, TLS, FEM, Composite structures. 1. Introduction
Terrestrial laser scanning (TLS) technology is
broadly accepted as a structural health monitoring device for reinforced concrete (RC) composite structures. Both experiments and numerical analysis are considered. In this submit, measurements were conducted for the composite concrete beams. The emphasis in numerical simulation is given on the finite element methods (FEM) which is corrected by the response surface methodology (RSM). Aspects considered are effects of material parameters and variation in geometry. This paper describes our recent progress on FEM modeling of damages in concrete composite structures, based on the TLS measurement and RSM optimization.
1.1. Motivation Terrestrial laser scanning technology (TLS) has
become one of the most important technologies for acquisition of three-dimensional (3D) information of objects. TLS, which is a promising method in health monitoring of structures, can provide highly accurate, non-contact measurements of the whole structure. Its benefit lies mainly on a permanent availability of measurement data, and a possible combination with the finite element method (FEM) model. Because the TLS measurement is area-oriented rather than point-oriented, it has significant advantage when compared with traditional measurements in structural analyses.
Finite element method (FEM) is an efficient, commonly used numerical method. For most complex engineering structures, it is quite difficult to obtain
http://www.sensorsportal.com/HTML/DIGEST/P_RP_0209.htm

Sensors & Transducers, Vol. 200, Issue 5, May 2016, pp. 66-70
67
analytical solutions for structure problems, due to the complexity of geometry, load, constrains and so on. Instead, with the development of computer science, the approximate numerical solutions which satisfy engineering requirements are more achievable. Currently, FEM is an important method and tool in structure analysis.
In this thesis, health monitoring of structures based on TLS is investigated and a FEM model is constructed. The goal focuses on the benefits of 3D TLS in the generation and calibration of FEM model, in order to build an efficient and intelligent model which can be widely used for assessment of objects. As an example, we constructed an acceptable model which is able to be applied in the assessment of concrete structures.
1.2. Proposal
The general motivation is to study the benefit of TLS in the field of FEM calibration, mostly from two aspects: the first is deformation measurement and the second is crack detection. The benefit of TLS lies mainly in the possibility of a surface-based validation of results predicted by the FEM model. Within this
study TLS should be used in order to determine the surface based geometric behavior of the structures within load experiments. Dominant innovation is to find different reliable criteria based on TLS measurement in order to correct and update FEM model. The criteria are, for example, the maximum of displacement, the volume of the deformation and cracks on the surface. Here, both of displacement and volume involve surface approximation which makes full use of the 3D coordinates of the point clouds from TLS. Crack computation is mainly based on the intensity information of the TLS measurement results.
With the beneficial use of TLS, the FEM model of the structure is required to be calibrated for higher reliability, so as to obtain accurate predictions of structures. In this case, response surface methodology (RSM) is adopted to correct and update the FEM model. The displacement- and volume-based RSM updating are applied and the significance of RSM models are confirmed by the determination coefficient R2. MATLAB programs for polynomial approximation and concrete cracks detection from the TLS point clouds data are developed. The general processes of FEM calibration based on TLS measurement is shown in Fig. 1.
Fig. 1. The processes of FEM calibration based on TLS measurement.
In Fig. 1, the left side is FEM model analysis which includes parameters setting, modeling, meshing, load and solution. The right side is the TLS measurement and data processing. After TLS measurement of epoch data, the TLS data are processed in two ways: deformation and cracks. The deformation is calculated by surface-based approximation and surface difference analysis. The cracks are calculated by crack detection calculation and comparison of cracks which will result in crack changes. The following step is a comparison of TLS results and FEM model
simulation. If the two are not agreeable, FEM model will be updated, till the error between TLS results and FEM model is acceptable. At last, an accurate and reliable FEM model based on TLS measurement is obtained.
There are four sections in this thesis. Section 1 is the introduction of this thesis which contains my motivation and proposal. Section 2 is about FEM, where there are the following parts: a summary of FEM development, general description of dynamic and static-based FEM calibration, different methods of
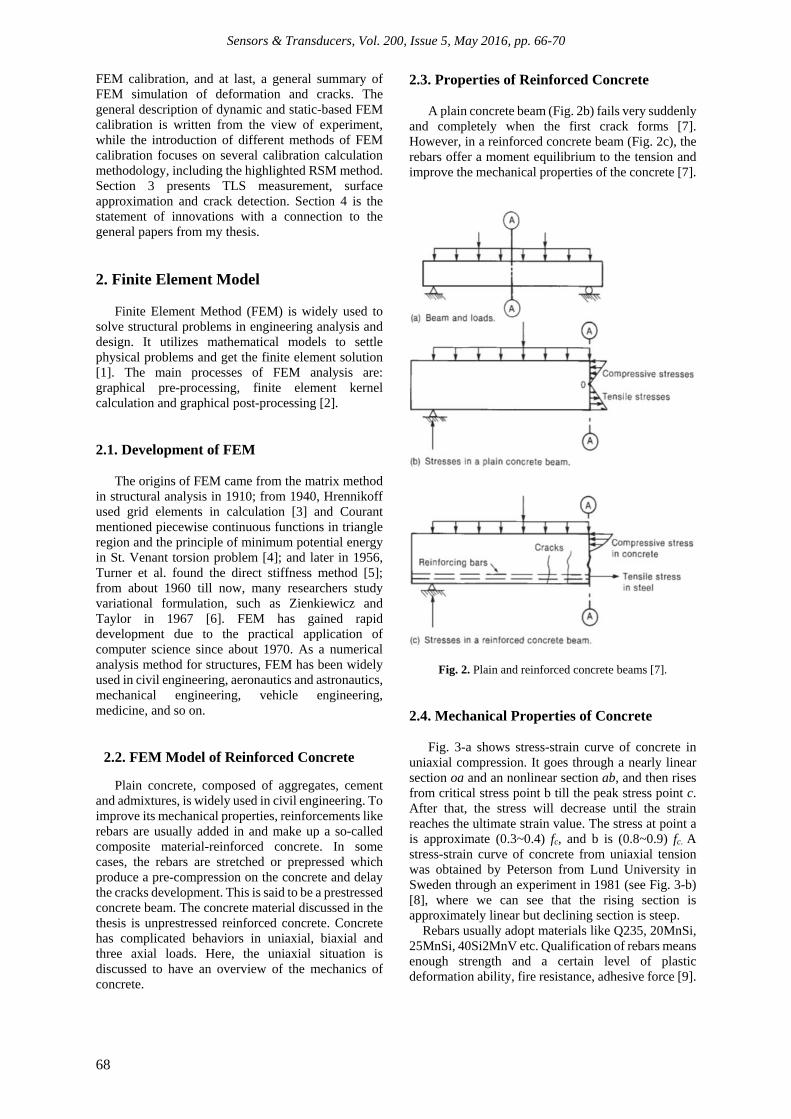
Sensors & Transducers, Vol. 200, Issue 5, May 2016, pp. 66-70
68
FEM calibration, and at last, a general summary of FEM simulation of deformation and cracks. The general description of dynamic and static-based FEM calibration is written from the view of experiment, while the introduction of different methods of FEM calibration focuses on several calibration calculation methodology, including the highlighted RSM method. Section 3 presents TLS measurement, surface approximation and crack detection. Section 4 is the statement of innovations with a connection to the general papers from my thesis.
2. Finite Element Model Finite Element Method (FEM) is widely used to
solve structural problems in engineering analysis and design. It utilizes mathematical models to settle physical problems and get the finite element solution [1]. The main processes of FEM analysis are: graphical pre-processing, finite element kernel calculation and graphical post-processing [2].
2.1. Development of FEM The origins of FEM came from the matrix method
in structural analysis in 1910; from 1940, Hrennikoff used grid elements in calculation [3] and Courant mentioned piecewise continuous functions in triangle region and the principle of minimum potential energy in St. Venant torsion problem [4]; and later in 1956, Turner et al. found the direct stiffness method [5]; from about 1960 till now, many researchers study variational formulation, such as Zienkiewicz and Taylor in 1967 [6]. FEM has gained rapid development due to the practical application of computer science since about 1970. As a numerical analysis method for structures, FEM has been widely used in civil engineering, aeronautics and astronautics, mechanical engineering, vehicle engineering, medicine, and so on.
2.2. FEM Model of Reinforced Concrete
Plain concrete, composed of aggregates, cement and admixtures, is widely used in civil engineering. To improve its mechanical properties, reinforcements like rebars are usually added in and make up a so-called composite material-reinforced concrete. In some cases, the rebars are stretched or prepressed which produce a pre-compression on the concrete and delay the cracks development. This is said to be a prestressed concrete beam. The concrete material discussed in the thesis is unprestressed reinforced concrete. Concrete has complicated behaviors in uniaxial, biaxial and three axial loads. Here, the uniaxial situation is discussed to have an overview of the mechanics of concrete.
2.3. Properties of Reinforced Concrete A plain concrete beam (Fig. 2b) fails very suddenly
and completely when the first crack forms [7]. However, in a reinforced concrete beam (Fig. 2c), the rebars offer a moment equilibrium to the tension and improve the mechanical properties of the concrete [7].
Fig. 2. Plain and reinforced concrete beams [7]. 2.4. Mechanical Properties of Concrete
Fig. 3-a shows stress-strain curve of concrete in
uniaxial compression. It goes through a nearly linear section oa and an nonlinear section ab, and then rises from critical stress point b till the peak stress point c. After that, the stress will decrease until the strain reaches the ultimate strain value. The stress at point a is approximate (0.3~0.4) fc, and b is (0.8~0.9) fc. A stress-strain curve of concrete from uniaxial tension was obtained by Peterson from Lund University in Sweden through an experiment in 1981 (see Fig. 3-b) [8], where we can see that the rising section is approximately linear but declining section is steep.
Rebars usually adopt materials like Q235, 20MnSi, 25MnSi, 40Si2MnV etc. Qualification of rebars means enough strength and a certain level of plastic deformation ability, fire resistance, adhesive force [9].

Sensors & Transducers, Vol. 200, Issue 5, May 2016, pp. 66-70
69
(a)
(b)
Fig. 3. The stress-strain curve of concrete in uniaxial compression and tension [8].
The mechanical behavior of rebar is characterized by uniaxial tension stress. There are four stages in the failure process of typical rebars. The first is the elastic stage (section OA) with a linear relation between strain and stress; the second is the yield stage (section AC), where stress is relatively stable but the strain increases greatly and plastic deformation occurs; the third is the strengthening stage (section CD) where the stress increases and the resistance ability to stretching raises; the fourth is the necking stage (section DE), where local cross section suddenly narrows, and the stress decreases till fracture at point E. The parameters in Fig. 4 are the lower yield strength, fy and the peak strength, fu.
3. Experiment In Fig. 5, the y axis is the force with units of kN
and the x axis is the displacement with units of mm. We can see an obvious inflection point at the fifth epoch with force 43.6 kN which should be related to the yield strength [10]. After the data has been analyzed and the FEM model is simulated, we compare this FEM model with experimental data epoch 1 which not only presents the relationship between displacement and force of single point, but also compares the point distribution on the surface.
Fig. 4. The strain-stress curve of rebars.
Fig 5. The load-displacement curve [10].
4. Result
Comparing the strain-stress curve of rebars (Fig. 4) with the load-displacement curve (Fig. 5), we can observe that linear section AB and CD are agreed with the each other. But the section BC is different with the experiment data. It means that the reinforced concrete composite constructs have more stable and dependably properties.
Acknowledgments
The authors of this paper are supported by Deutsche Forschungsgemeinschaft and Open Access Publishing Fund of Leibniz Universität Hannover. The authors would like to acknowledge the support of all the colleagues in Geodetic Institute of Leibniz University Hanover for their valid information.
Reference [1]. K. J. Bathe, Finite element procedures, Prentice Hall,
Englewood Cliffs, N. J., USA, 1996. [2]. U. Nackenhorst, Handbook: Numerische Mechanik
WS 14/15, Gottfried Wilhelm Leibniz Universität, Hannover, 2014.

Sensors & Transducers, Vol. 200, Issue 5, May 2016, pp. 66-70
70
[3]. A. Hrennikoff, Solution of problems of elasticity by the framework method, Journal of Applied Mechanics, 8, 4, 1941, pp. 169–175.
[4]. R. Courant, Variational methods for the solution of problems of equilibrium and vibrations, Bulletin of the American Mathematical Society, 49, 1943, pp. 1–23.
[5]. M. J. Turner, R. W. Clough, H. C. Martin and L. J. Topp, Stiffness and deflection analysis of complex structures, Journal of Aeronautics Sciences, 23, 9, 1956, pp. 805–823.
[6]. O. C. Zienkiewicz and R. L. Taylor, The finite element method, Elsevier Butterworth-Heinemann, Oxford, UK, 54–97, 2005.
[7]. J. K. Wight and J. G. Macgregor, Reinforced concrete: mechanics and design, Pearson Education, Inc., New Jersey, America, 2011.
[8]. V. Cervenka, J. Cervenka and R. Pukl, ATENA-A tool for engineering analysis of fracture in concrete, Sadhana, Vol. 27, Issue 4, 2002, pp. 485-492.
[9]. Standard for steel material in reinforced concrete, GB1499, 2-2007, China, 2007.
[10]. H. Yang, X. Xu, I. Neumann, The Benefit of 3D Laser Scanning Technology in the Generation and Calibration of FEM Models for Health Assessment of Concrete Structures, Sensors, 14, 2014, pp. 21889–21904.
___________________
2016 Copyright ©, International Frequency Sensor Association (IFSA) Publishing, S. L. All rights reserved. (http://www.sensorsportal.com)

Aims and Scope
Sensors & Transducers is established, international, peer-reviewed, open access journal (print and electronic). It provides the best platform for the researchers and scientist worldwide to exchange their latest findings and results in science and technology of physical, chemical sensors and biosensors. The journal publishes original results of scientific and research works related to strategic and applied studies in all aspects of sensors: reviews, regular research and application specific papers, and short notes. In comparison with other sensors related journals, which are mainly focused on technological aspects and sensing principles, the Sensors & Transducers significantly contributes in areas, which are not adequately addressed in other journals, namely: frequency (period), duty-cycle, time-interval, PWM, phase-shift, pulse number output sensors and transducers; sensor systems; digital, smart, intelligent sensors and systems designs; signal processing and ADC in sensor systems; advanced sensor fusion; sensor networks; applications, etc. By this way the journal significantly enriches the appropriate databases of knowledge.
Sensors & Transducers journal has a very high publicity. It is indexed and abstracted very quickly by Chemical Abstracts, EBSCO Publishing, IndexCopernicus Journals Master List (ICV=6.13 in 2011), Open J-Gate, ProQuest Science Journals, CAS Source Index (CASSI), Ulrich's Periodicals Directory, Scirus, Google Scholar, etc. Since 2011 to 2014 Sensors & Transducers journal was covered and indexed by EI Compendex (CPX) index (including a Scopus, Embase, Engineering Village and Reaxys) in Elsevier products. The journal is included in the IFSA List of Recommended Journals (up-dated 9.12.2014), which contains only the best, established sensors related journals. The global Impact Factor of the journal is 0.705 (2013).
Physical, chemical and biosensors Digital, frequency, period, duty-cycle, time interval, PWM, pulse number output sensors and transducers Theory, principles, effects, design, standardization and modelling Smart sensors and systems Intelligent sensors and systems Sensor instrumentation Virtual instruments Sensors interfaces, buses and networks Signal processing, sensor fusion Remote sensing Frequency (period, duty-cycle)-to-code converters, ADC Technologies and materials Nanosensors and NEMS Microsystems Applications
Further information on this journal is available from the Publisher's web site: http://www.sensorsportal.com/HTML/DIGEST/Submission.htm
Subscriptions
An annual subscription includes 12 regular issues and some special issues. Annual subscription rates for 2015 are the following: Electronic version (in printable pdf format): 590.00 EUR; Printed with b/w illustrations: 950.00 EUR; 25 % discount is available for IFSA Members.
Prices include shipping costs by mail. Further information about subscription is available through IFSA Publishing's web site: http://www.sensorsportal.com/HTML/DIGEST/Journal_Subscription.htm
Advertising Information
If you are interested in advertising or other commercial opportunities please e-mail [email protected] and your enquiry will be passed to the correct person who will respond to you within 24 hours. Please download also our Media Planner 2015: http://www.sensorsportal.com/DOWNLOADS/Media_Planner_2015.pdf
Instructions for Authors
Please visit the journal web page http://www.sensorsportal.com/HTML/DIGEST/Submission.htm Authors must follow the instructions very carefully when submitting their manuscripts. Manuscript must be send electronically in both: MS Word for Windows and Acrobat (pdf) formats by e-mail: [email protected]