Embed Size (px)
Citation preview

Sensor Network for Structural Health Monitoring of aHighway Bridge
Michael Fraser1; Ahmed Elgamal2; Xianfei He3; and Joel P. Conte4
Abstract: A bridge monitoring TestBed is developed as a research environment for sensor networks and related decision-supporttechnologies. A continuous monitoring system, capable of handling a large number of sensor data channels and three video signals, isdeployed on a four-span, 90-m long, reinforced concrete highway bridge. Of interest is the integration of the image and sensor dataacquisition into a single computer, thereby providing accurate time synchronization between the response and corresponding traffic loads.Currently, video and acceleration records corresponding to traffic induced vibration are being recorded. All systems operate online via ahigh-speed wireless Internet network, allowing real-time data transmission. Elements of the above health monitoring framework arepresented herein. Integration of these elements into an automated functional system is emphasized. The recorded data are currently beingemployed for structural system identification via a model-free technique. Effort is also underway to correlate the moving traffic loads withthe recorded accelerations. Finally, the TestBed is available as a resource for verification of new sensor technologies, data acquisition/transmission algorithms, data mining strategies, and for decision-support applications.
DOI: 10.1061/�ASCE�CP.1943-5487.0000005
CE Database subject headings: Structural reliability; Monitoring; Bridges; Highway; Internet; Probe instruments; Data collection.
Author keywords: Structural health monitoring; Highway bridge; Sensor network; Video; Internet; System identification.
Introduction
The interest in structural health monitoring �SHM� for bridgesand civil infrastructure remains strong in view of the worldwidedemand and the advances in enabling information technologies�Mufti 2002; Pines and Aktan 2002; Casciati 2003; Chang et al.2003; Sohn 2003; Chong et al. 2003; Carden and Fanning 2004;Tomizuka et al. 2006�. Numerous structures and bridges world-wide are currently instrumented with sensor arrays to monitorambient vibration, strain, and displacement �e.g., Bolton et al.2002; Masri et al. 2004; Wahbeh et al. 2005; Ko and Ni 2005;Guan et al. 2006�. Machine learning and system identificationtechniques are used for analysis of the recorded system response�Proc., 5th and 6th Int. Workshop on Structural Health Monitoring2005, 2007, Nayeri et al. 2008�.
Recently, efforts have been underway to include traffic load asthe source of dynamic excitation with the aid of video imaging�Elgamal et al. 2003, 2004; Chen et al. 2004, 2006; Catbas et al.
1Project Manager, Naval Facilities Engineering Command Southwest,1220 Pacific Hwy, San Diego, CA 92132. E-mail: [email protected]/[email protected]
2Professor, Dept. of Structural Engineering, Univ. of California at SanDiego, 9500 Gilman Dr., La Jolla, CA 92093-0085 �corresponding au-thor�. E-mail: [email protected]
3Assistant Bridge Engineer, AECOM Transportation, 999 Town andCountry Rd., Orange, CA 92868.
4Professor, Dept. of Structural Engineering, Univ. of California at SanDiego, 9500 Gilman Dr., La Jolla, CA 92093-0085. E-mail: [email protected]
Note. This manuscript was submitted on June 30, 2008; approved onDecember 22, 2008; published online on December 15, 2009. Discussionperiod open until June 1, 2010; separate discussions must be submittedfor individual papers. This paper is part of the Journal of Computing inCivil Engineering, Vol. 24, No. 1, January 1, 2010. ©ASCE, ISSN
0887-3801/2010/1-11–24/$25.00.JOURNAL OF COMPUTING
2004; Chen and Feng 2006; Fraser 2006�. Generally, image track-ing for traffic applications is an area of increasing interest with alarge scope of potential applications �e.g., Beymer et al. 1997;Collins et al. 2001; Kogut and Trivedi 2001; Morris and Trivedi2006�. A summary of video traffic monitoring systems and asso-ciated functionalities may be found in Kastrinaki et al. �2003�.
Aligned with the efforts above, this paper presents develop-ments to deploy operational sensor/video monitoring TestBeds. Inthe following sections, a pilot system-integration bridge-deckmonitoring effort is briefly described. On this basis, a highwaybridge TestBed sensor network is configured and deployed. Usingthe recorded data, a system identification procedure is presentedand employed to extract and monitor the bridge’s dynamic char-acteristics. Techniques for use of the recorded video are high-lighted for extracting locations, velocities, and categories ofvehicles. Finally, conclusions are drawn along with recommenda-tions for further research.
Pilot Technology Integration TestBed
Initially, a demonstration TestBed serving as a development andverification environment for the integrated structural monitoringframework �Fig. 1� was established on a series of bridge-deckpanels �Fraser 2006� located on campus at the University of Cali-fornia, San Diego �UCSD�. This TestBed served a crucial role indeveloping, troubleshooting, and evaluating the reliability of allaspects related to structural monitoring. A PC-based data acquisi-tion system with live Internet connectivity was deployed alongwith a network camera for continuous monitoring of the bridgedecks.
Over a 3-year period, video and strain data, synchronizedseparately by a network time protocol �NTP� Internet time server,
were recorded and archived in a series of databases, and madeIN CIVIL ENGINEERING © ASCE / JANUARY/FEBRUARY 2010 / 11

Fig. 1. Integrated research framework based on project TestBeds �adapted from http://healthmonitoring.ucsd.edu�
12 / JOURNAL OF COMPUTING IN CIVIL ENGINEERING © ASCE / JANUARY/FEBRUARY 2010

available for online querying. The continuously recorded data waspost processed and separated into over 400,000 discrete events,each composed of a 10-s strain time history and a 40 image videoof the vehicle crossing the bridge decks. Local processing poten-tial for data reduction and event detection was demonstratedwithin an hourly peak-strain database established using two of thestrain gages �Fraser 2006�. Captured by the records in these da-tabases are a diverse variety of vehicle types ranging from golfcarts to five-axle semitrucks. The entire video and sensor data setis publicly available for query searching and downloadingthrough the Web portal �http://healthmonitoring.ucsd.edu�.
Recently, the recorded data set was used to develop a strain-based vehicle classification approach, as a machine learning ap-plication �Yan 2006�. To achieve this goal, the principalcomponents analysis technique was applied to extract essentialfeatures from the strain time histories. Using these features as
Fig. 2. �a� Voigt Drive/I-5 Bridge TestBed; �b� elevation view of Twireless transmission antennas deployed on monitoring system �origi
input, a two-layered back-propagation neural network was built
JOURNAL OF COMPUTING
and trained to sort vehicles into five classes. In this regard, avail-ability of the video images provided essential information fordeveloping the needed labeled data sets. The trained network wastested, and satisfactory results were achieved, showing viabilityof the classification approach for this bridge deck system �Yan etal. 2008�.
Highway Bridge TestBed
Following the above pilot effort, a monitoring system was re-cently deployed on the Voigt Drive/Interstate-5 bridge �Fig. 2�,located on the Eastern edge of the UCSD main campus�32°52�53�N,117°13�43�W�. The system incorporates an accel-erometer sensor array and an integrated camera monitoring
with locations of accelerometers; and �c� locations of camera andp courtesy of http://maps.google.com�
(a)
(b)
estBednal ma
framework �Fraser 2006�. Built in 1964, this two-lane, two-way
IN CIVIL ENGINEERING © ASCE / JANUARY/FEBRUARY 2010 / 13
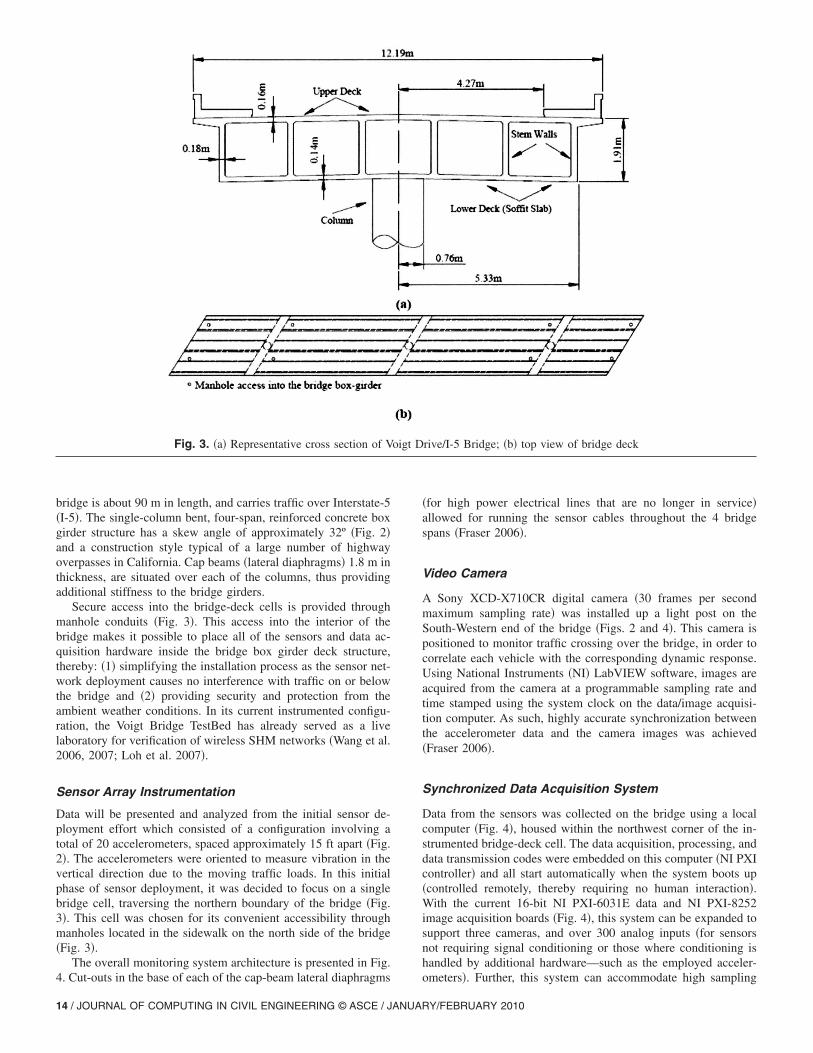
bridge is about 90 m in length, and carries traffic over Interstate-5�I-5�. The single-column bent, four-span, reinforced concrete boxgirder structure has a skew angle of approximately 32º �Fig. 2�and a construction style typical of a large number of highwayoverpasses in California. Cap beams �lateral diaphragms� 1.8 m inthickness, are situated over each of the columns, thus providingadditional stiffness to the bridge girders.
Secure access into the bridge-deck cells is provided throughmanhole conduits �Fig. 3�. This access into the interior of thebridge makes it possible to place all of the sensors and data ac-quisition hardware inside the bridge box girder deck structure,thereby: �1� simplifying the installation process as the sensor net-work deployment causes no interference with traffic on or belowthe bridge and �2� providing security and protection from theambient weather conditions. In its current instrumented configu-ration, the Voigt Bridge TestBed has already served as a livelaboratory for verification of wireless SHM networks �Wang et al.2006, 2007; Loh et al. 2007�.
Sensor Array Instrumentation
Data will be presented and analyzed from the initial sensor de-ployment effort which consisted of a configuration involving atotal of 20 accelerometers, spaced approximately 15 ft apart �Fig.2�. The accelerometers were oriented to measure vibration in thevertical direction due to the moving traffic loads. In this initialphase of sensor deployment, it was decided to focus on a singlebridge cell, traversing the northern boundary of the bridge �Fig.3�. This cell was chosen for its convenient accessibility throughmanholes located in the sidewalk on the north side of the bridge�Fig. 3�.
The overall monitoring system architecture is presented in Fig.
Fig. 3. �a� Representative cross section of V
4. Cut-outs in the base of each of the cap-beam lateral diaphragms
14 / JOURNAL OF COMPUTING IN CIVIL ENGINEERING © ASCE / JANUA
�for high power electrical lines that are no longer in service�allowed for running the sensor cables throughout the 4 bridgespans �Fraser 2006�.
Video Camera
A Sony XCD-X710CR digital camera �30 frames per secondmaximum sampling rate� was installed up a light post on theSouth-Western end of the bridge �Figs. 2 and 4�. This camera ispositioned to monitor traffic crossing over the bridge, in order tocorrelate each vehicle with the corresponding dynamic response.Using National Instruments �NI� LabVIEW software, images areacquired from the camera at a programmable sampling rate andtime stamped using the system clock on the data/image acquisi-tion computer. As such, highly accurate synchronization betweenthe accelerometer data and the camera images was achieved�Fraser 2006�.
Synchronized Data Acquisition System
Data from the sensors was collected on the bridge using a localcomputer �Fig. 4�, housed within the northwest corner of the in-strumented bridge-deck cell. The data acquisition, processing, anddata transmission codes were embedded on this computer �NI PXIcontroller� and all start automatically when the system boots up�controlled remotely, thereby requiring no human interaction�.With the current 16-bit NI PXI-6031E data and NI PXI-8252image acquisition boards �Fig. 4�, this system can be expanded tosupport three cameras, and over 300 analog inputs �for sensorsnot requiring signal conditioning or those where conditioning ishandled by additional hardware—such as the employed acceler-
rive/I-5 Bridge; �b� top view of bridge deck
oigt Dometers�. Further, this system can accommodate high sampling
RY/FEBRUARY 2010

rates and other sensor types with special requirements �e.g., inte-grated electronics piezoelectric �IEPE� sensor signal condition-ing�.
The firewire output from the Sony camera was connected tothe data acquisition computer through an IEEE 1394 firewire in-terface board. A “while loop” was embedded within the Lab-VIEW data acquisition code which configures the camera �imageresolution and size�, controls the acquisition sampling rate, de-codes the acquired Bayer image, and saves the picture in a com-pressed color jpeg format. In its current state, the camera andimage acquisition code are configured to sample and archive640�480 pixel color images at 3 frames per second �FPS�.Within LabVIEW, a compression ratio of 70% was used. Whilehigher sampling rates and image sizes with no compression arefeasible, these were deemed unnecessary in accurately identifyingand tracking traffic on the bridge.
Internet Connectivity
For controlling the data acquisition system, and for streamingdata from the bridge, a wireless cloud was created to access thewired UCSD Internet network located in a nearby building �Fig.2�. A high bandwidth Internet connection was established on thebridge by installing a wireless router on the Southeast corner of
Fig. 4. Schematic
this building �approximately 60 m from the bridge�. Using a wire-
JOURNAL OF COMPUTING
less Ethernet bridge with an external antenna mounted on thebridge guard rail �Fig. 2�, the wireless stream is converted to astandard wired Internet signal, connected to the data acquisitionsystem by an Ethernet cable.
Remote access to the data acquisition computer is allowedusing the Windows remote desktop connection and the NI Lab-VIEW webserver. Through the webserver, changes can be madeto the data acquisition parameters �e.g., sampling rates, sensorcalibration constants, buffer size, etc.�. To make changes to thedata acquisition program, including overwriting the current ver-sion, the Windows remote desktop connection can be also used.Should the acquisition computer freeze and access becomes un-available, a network-attached remote power controller was in-stalled along with the PXI controller �Fig. 4�. This device allowsauthorized users to cycle power to the controller thereby reboot-ing and restoring the system. To ensure proper authorization, ac-cess is restricted to users with registered IP addresses.
Data Archiving
A data acquisition program was developed to digitize the analogresponse from each accelerometers at a rate of 1,000 samples persecond. Once digitized, the data are placed into a ring buffer.After a predetermined number of samples are collected in the
dware architecture
of harbuffer, the data are written to disk as a text file in ASCII format
IN CIVIL ENGINEERING © ASCE / JANUARY/FEBRUARY 2010 / 15
and the buffer is cleared. A java-based data transmission program�Fraser 2006� opens these files, compresses the data, and streamsthe zipped data using File Transfer Protocols �FTP� to the ar-chiving server on the campus network. For this purpose, a prac-tical extraction and report language �PERL�-based loader programwas developed to read the streamed data, perform basic signalprocessing, and archive the data within an IBM DB2 database.
Upon confirmation of successful transmission, the data are de-leted from the acquisition computer. Should the Internet connec-tion temporarily go down, no information is lost as the systemcontinues to acquire data and write to disk on the local hard drive.Once the connection is restored, the streaming program automati-cally resumes operation. On this basis, adequate network band-width is available for continuous 24/7 data transmission from thedeployed sensor/video array.
Web Portal for Data Retrieval and Dissemination
Work was undertaken concurrently in different areas in order tobuild the necessary integrated software and hardware system in-frastructure �Elgamal et al. 2003; Elgamal et al. 2004�. A Webportal was established �http://healthmonitoring.ucsd.edu� to pro-vide secure access to the data being collected on the bridge andautomatically archived in the IBM DB2 database. Over 1,00010-min records are currently archived in this database �one recordat the beginning of each hour�.
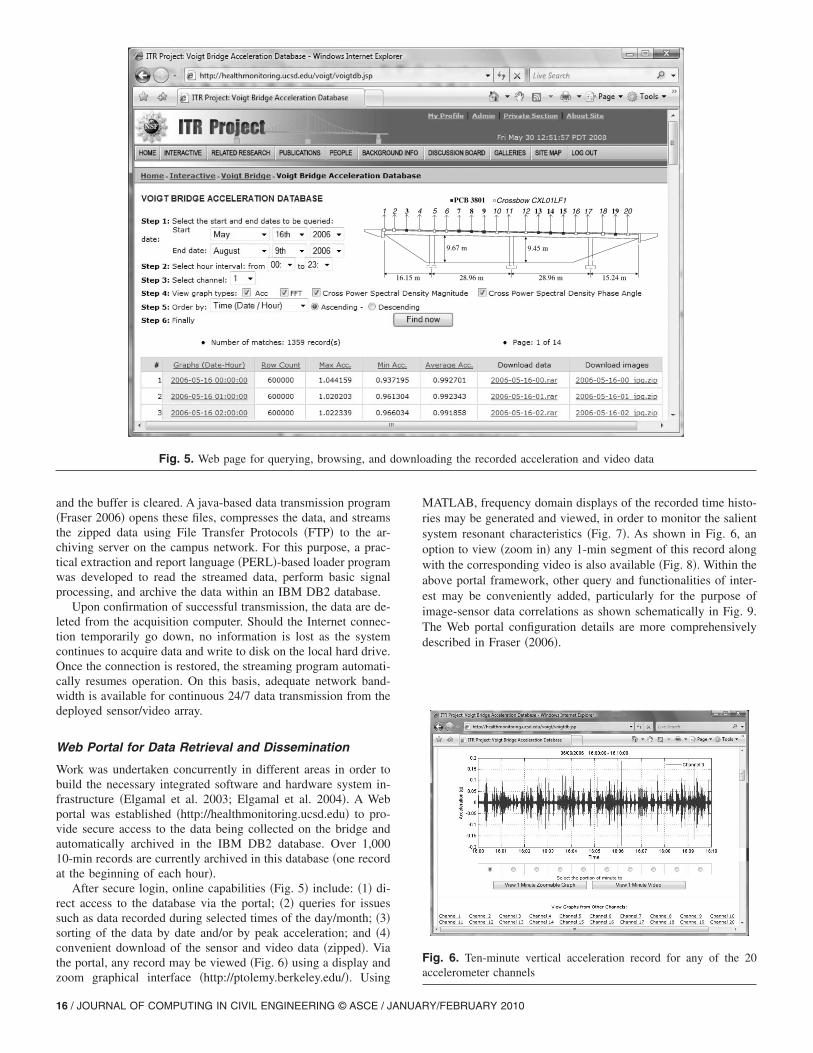
After secure login, online capabilities �Fig. 5� include: �1� di-rect access to the database via the portal; �2� queries for issuessuch as data recorded during selected times of the day/month; �3�sorting of the data by date and/or by peak acceleration; and �4�convenient download of the sensor and video data �zipped�. Viathe portal, any record may be viewed �Fig. 6� using a display and
1
Fig. 5. Web page for querying, browsing, and d
zoom graphical interface �http://ptolemy.berkeley.edu/�. Using
16 / JOURNAL OF COMPUTING IN CIVIL ENGINEERING © ASCE / JANUA
MATLAB, frequency domain displays of the recorded time histo-ries may be generated and viewed, in order to monitor the salientsystem resonant characteristics �Fig. 7�. As shown in Fig. 6, anoption to view �zoom in� any 1-min segment of this record alongwith the corresponding video is also available �Fig. 8�. Within theabove portal framework, other query and functionalities of inter-est may be conveniently added, particularly for the purpose ofimage-sensor data correlations as shown schematically in Fig. 9.The Web portal configuration details are more comprehensivelydescribed in Fraser �2006�.
7 8 9 13 14 15 195 6 10 11 12 16 17 18 20Crossbow CXL01LF1PCB 3801
9.67 m 9.45 m
28.96 m 28.96 m 15.24 m
ading the recorded acceleration and video data
Fig. 6. Ten-minute vertical acceleration record for any of the 20accelerometer channels
32 4
16.15 m
ownlo
RY/FEBRUARY 2010

Data and Analysis
Dynamic Response of the Voigt Bridge
Systematically combining the input traffic excitation with the out-put sensor data remains an area of further research. In this regard,the bridge vibration is not only due to crossing traffic on thebridge deck, but also due to the major traffic crossing I-5 below.For such challenging input definition situations, an output-onlysystem identification approach is warranted. Herein, the data-driven stochastic subspace identification �SSI-DATA� method
Fig. 7. Frequency domain displays of the recorded time histories
Fig. 8. Web page for displaying the recorded acceleration time his-tory along with time-synchronized video
JOURNAL OF COMPUTING
�Van Overschee and De Moor 1996� is used to identify the bridgemodal parameters from the recorded accelerometer data.
Data collected and archived over a duration of 45 days �first 10min. of every hour, for a total of 1,080 records� was used in theidentification process. The SSI-DATA algorithm extracts a systemmodel in state-space using output-only measurement data as de-scribed briefly below.
Identification ApproachA discrete time state-space representation of order n for a lineartime-invariant system is given by
z�k + 1� = Az�k� + Bu�k� �1a�
x�k + 1� = Cz�k� + Du�k� �1b�
where n /2=number of the system degrees of freedom A�Rn�n ,B�Rn�l ,C�Rm�n ,D�Rm�l=state space matrices indiscrete-time; z�k��Rn=state vector; u�k��Rl=load vectorfunction �input excitation of size l�; and x�k��Rm
= �x1�k� ,x2�k� , . . . ,xm�k��T, a column vector of size m �=numberof measured output channels� which represents the system re-sponse at discrete time t=k��t� along the m measured degrees offreedom ��t is time step�. In practice, the input excitation u isoften unknown/unmeasured and only the response of the structureis recorded. Thus, the discrete time state-space model in Eq. �1� isextended to the following stochastic version �Van Overschee andDe Moor 1996, Peeters and De Roeck 2001a�:
z�k + 1� = Az�k� + w�k� �2a�
x�k + 1� = Cz�k� + v�k� �2b�
where state matrices A and C=same as in Eq. �1�: A=state tran-sition matrix, which completely characterizes the dynamics of thesystem, and C=output matrix that specifies how the system statez�k� is transformed into the measured system response/output;w�k��Rn=process noise due to external disturbances and mod-eling inaccuracies; and v�k��Rm=measurement noise due tosensor inaccuracies. Since the input excitation u�k� of Eq. �1� isunknown and impossible to distinguish from the noise terms w�k�and v�k�, it is now implicitly included in these noise terms. Bothnoise terms w�k� and v�k� are assumed to be zero mean, whitevector sequences.
The system state-space matrices A and C are estimated fromthe recorded accelerometer data using the SSI-DATA procedure.In this procedure, the output Hankel matrix is used to estimate theKalman filter state. The matrices A and C are then identified fromthis Kalman state via a least-squares approach �Van Overscheeand De Moor 1996, He 2008�. Once A and C are determined, themodal parameters �natural frequencies �i, damping ratios �i, andmode shapes �i� of the N=n /2 vibration modes can be obtainedfrom �Juang and Pappa 1985, Lus et al. 2002�
�i = �ln��2i�/�t�, i = 1,2, . . . ,N �3a�
�i = − cos�angle�ln��2i���, i = 1,2, . . . ,N �3b�
where �i= ith eigenvalue of matrix A. In view of the state-spacerepresentation �Eq. �2��, it should be noted that �2i−1 and �2i arecomplex conjugate pairs of eigenvalues, which correspond to thesame vibration mode. The vibration mode shapes are obtained
fromIN CIVIL ENGINEERING © ASCE / JANUARY/FEBRUARY 2010 / 17

�i = C • T2i �4�
where Ti= ith eigenvector of matrix A �similarly, T2i−1 and T2i arecomplex conjugate pairs of eigenvectors, which correspond to thesame vibration mode�.
An automated modal analysis procedure has been developed�He 2008� to apply SSI-DATA for continuous health monitoringof the Voigt Bridge. In this implementation of SSI-DATA, first astabilization diagram �Peeters and De Roeck 2001a� is con-structed for system order n=2,4 , . . . ,50 �Fig. 10�. According tothe stabilization diagram logic, for a realized state-space model ofa given order n, an identified mode is considered as a physicalvibration mode of the bridge if its modal parameters satisfy eachof the following four conditions: �1� The deviation of its naturalfrequency from the average value obtained from models of orderless than n is less than 1%; �2� the modal assurance criterion�MAC� value �Allemang and Brown 1982� between the modeshape and the average thereof identified from models of order lessthan n is higher than 95%; �3� the corresponding identified damp-ing ratio is nonnegative and less than 20% �the relative change of
Fig. 9. Schematic display of time-synchronized acceleration and videFig. 2�
o �vertical response at the middle of each span; Sensors 3, 8, 14, and 19 of
damping ratio with respect to the average value from models of
18 / JOURNAL OF COMPUTING IN CIVIL ENGINEERING © ASCE / JANUA
Fig. 10. Sample stabilization diagram obtained using SSI-DATA�one diagram is derived for each10 min data set�
RY/FEBRUARY 2010

order less than n is not considered herein due to the relativelyhigh estimation uncertainty characterizing this parameter�; and �4�by increasing progressively the model order n �starting from n=2�, the identified modal parameters satisfy the first three condi-tions defined above at least 10 times. The system order is thendetermined by the minimum order which contains all the physicalmodes identified using the above Criteria 1 through 4. Finally, thebridge modal parameters are extracted from the realized statespace model with the determined minimum order.
Characteristics of Dynamic Response
As mentioned earlier, the bridge acceleration responses were digi-tized at the rate of 1,000 samples/sec resulting in a Nyquist fre-quency of 500 Hz, which is much higher than the bridge’s naturalfrequencies of interest ��20 Hz in this study�. In the aforemen-tioned implementation of SSI-DATA, the data were first low-passfiltered below 25 Hz using a high order �1,024� finite impulseresponse �FIR� filter and then down-sampled to 100 samples/s inorder to improve the computational efficiency of the system iden-tification procedure. After this resampling, the Nyquist frequency�50 Hz� remains significantly higher than the natural frequenciesof interest.
In each of the investigated 1,080 records, the correspondingtraffic pattern will more clearly excite certain resonant frequen-cies. Light-traffic data sets �e.g., some midnight—3 a.m. records�would be less likely to meet the above described identificationcriteria. Over the 45-day data set, the variation in identified natu-ral frequency for four selected vertical modes is shown in Fig. 11.Using a fixed “reference” and three roving accelerometers, thecorresponding mode shapes were sampled at 34 spatial locationsalong the bridge deck as shown in Fig. 12�a�. The correspondingmodes, obtained from a wireless accelerometer network �Loh etal. 2007� display much similarity �Fig. 12�b��.
Overall, Table 1 summarizes the natural frequencies, as ob-tained from the above automated system identification procedureduring the monitoring period of 45 days. For each identified
Fig. 11. Variation in four identified natural frequencies during the45-day monitoring period in 2006 �May 16–June 30�
mode, the frequency change is defined as �f = �fmax− fmin� / fmin. It
JOURNAL OF COMPUTING
is seen that the relative changes in the bridge identified naturalfrequencies are of the order of 7–13% for the four modes of Fig.11. These changes are primarily caused by the varying environ-mental conditions such as temperature, since the bridge did notundergo any structural change �damage/deterioration� during themonitoring period.
From Fig. 11, it is observed that the temporal variation patternof the identified natural frequencies for the first and fourth modesis less consistent than that of Modes 2 and 3. In order to moreclearly visualize these daily variation patterns, the identified fre-quencies of Modes 2 and 3 are shown �Fig. 13� over a shortermonitoring period for clarity �from May 27 through June 2�. Dur-ing this time frame, it is seen that the daily variation pattern ofthese two identified natural frequencies also exhibits a changeover time. In this regard, additional data are currently being re-corded, and research is directed to further clarify the variation ofdynamic response characteristics with the ambient environmentalconditions �Farrar et al. 1997; Farrar and James 1997; Sohn et al.1999; Alampalli 1998, 2000; Peeters and De Roeck 2001b;Teughels and De Roeck 2004; Balmès et al. 2008�. Depending onthe type of structure, the monitoring period, and the extent ofambient temperature variation, natural frequencies were observedto vary in the ranges of 4–7% �Farrar et al. 1997� and 14–18%�Peeters and De Roeck 2001b�.
Image Processing and Vehicle Classification
The image sequences captured using the video camera, provide alarge amount of data �each picture frame is defined by an array orgrid of 640�480 pixels�. Using this video data, information suchas location, velocity, and size of vehicle, can be extracted �e.g.,Gonzalez et al. �2004�, Chen et al. �2006�, and Fraser �2006�� bycomputational image processing techniques in the following fash-ion:1. Definition of background scene: To determine change within
a series of images due to a passing vehicle, a backgroundmodel must first be developed. Options include the Gaussianmixture model for high variance scenes �Stauffer and Grim-son 1999�, the simpler frame averaging technique for staticscenes �Cucchiara et al. 2000�, and the robust median�Gaussian� background estimation method employed herein�Baldini et al. 2002�. This method applies a temporal medianfilter to each pixel over N previous frames �Gonzalez et al.2004�, with N=20 herein to keep stagnant objects fromdominating the median.
2. Vehicle detection: In order to determine the characteristics oftraffic on the bridge, the moving vehicles must be separatedfrom the background image. For that purpose, the “back-ground subtraction method” may be used �Ridder et al. 2000;Friedman and Russell 1997�. This method compares eachnew frame to the updated background scene, and separatesthe pixels that have different properties.
On this basis, the absolute difference D�x ,y , t� betweenthe background and target images �Fig. 14� can be computed.Before subtraction, the standard MATLAB functions imad-just and stretchlim were employed so as to increase imagecontrast �Gonzalez et al. 2004�. Using the MATLAB functionIM2BW, D�x ,y , t� is converted to a binary image M�x ,y , t�,where pixel values of one denote motion �white zones in Fig.14�.
A filter is then tailored and applied to eliminate superflu-
ous pixel zones that are below a specified size thresholdIN CIVIL ENGINEERING © ASCE / JANUARY/FEBRUARY 2010 / 19

Table 1. Summary of Natural Frequency Identification Results during the Monitoring Period of 45 Days
Mode numberMinimum fmin
�Hz� Average �Hz�Maximum fmax
�Hz�Frequency change �fmax− fmin� / fmin
�%�
1 4.63 4.91 5.18 12
2 6.09 6.33 6.53 7
3 11.38 12.15 12.84 13
4 12.75 13.30 14.10 11
Fig. 12. �a� 3D representation of identified mode shapes �34 stations of measurement along the bridge�; �b� mode shapes from wireless network�after Loh et al. 2007�
20 / JOURNAL OF COMPUTING IN CIVIL ENGINEERING © ASCE / JANUARY/FEBRUARY 2010

�Gonzalez et al. 2004�. In addition, certain regions ofM�x ,y , t� outside of the bridge �spatial domain in the picture�contain objects of no interest �e.g., vehicles passing under thebridge�. Objects detected in these external regions �Fig. 14�were simply eliminated �pixels are blacked out by settingtheir values to 0�.
3. Vehicle tracking for location and speed estimation: Analysisin this section is conducted on M�x ,y , t�, the binary map ofmoving pixels in which values of 1 correspond to motion�denoted in white in Fig. 14�. A region finding algorithm�regionprops function in MATLAB� is applied to find groupsof white pixels and their areas and centroids �Gonzalez et al.2004�. Tracking an object from frame-to-frame is accom-plished by defining a characteristic vector p�n , t� composedof the nth region centroid coordinates and bounding box di-
05/27 05/28 05/29 05/30 05/31 06/01 06/02 06/036.1
6.2
6.3
6.4
Freq
uenc
y[H
z]
05/27 05/28 05/29 05/30 05/31 06/01 06/02 06/0311.5
12
12.5
13
Monitoring Date
Freq
uenc
y[H
z]
Fig. 13. Hourly identified natural frequencies of the second and thirdmodes of Fig. 11 during the period of May 27–June 2, 2006
Background Image, B
Absolute Difference, D Thresh
Fig. 14. Image
JOURNAL OF COMPUTING
mensions at time t.To determine which detected object in the previous frame
is most closely correlated with detected object n in the cur-rent frame, it is necessary to find k such that the vector norm
F�n,k� = �p�n,t� − p�k,t − 1�� �5�
is minimized for each n. If F�n ,k� exceeds a limiting thresh-old, no correlation is assumed.
To identify the actual vehicle location on the bridge, it is nec-essary to determine the “world” coordinates of the vehicle, i.e.,transform the “screen plane” coordinates to the “world plane”spatial geometry �Fu and Moosa 2002; Hutchinson et al. 2006�.For this purpose, markers on both sidewalks along the bridgewere placed at a known distance from the camera and pixel valuesat these points were identified �a one-time effort�.
Target Image, I
ge, M M with Areas Outside of BridgeBlacked Out
ssing sequence
Fig. 15. Mapping of spatial configuration used for determining ve-hicle position on the bridge
old Ima
proce
IN CIVIL ENGINEERING © ASCE / JANUARY/FEBRUARY 2010 / 21

Using this information, the bridge deck was then discretizedinto a mesh of known locations �Fig. 15�. Next, a least-squaresmodel was used to locate and track the temporal location of avehicle as it crosses the bridge.
The recorded images with extracted features along with plotsof the position versus time are shown for typical westbound andeastbound cars �Fig. 16�. Representing these locations by a
Fig. 16. Original recorded picture, processed image, and image withfor westbound car; �b� for eastbound car
straight line approximation average �Fig. 16� allows the slope
22 / JOURNAL OF COMPUTING IN CIVIL ENGINEERING © ASCE / JANUA
thereof to represent the vehicle velocity. Building on the above,further research is progressing in the following two main direc-tions:1. Vehicle-identification enhancements which include handling
of merging objects and implementation of shadow suppres-sion algorithms for increased accuracy �Prati et al. 2003�.More robust tracking methods, capable of dealing with ob-
ted features �top, left to right� and vehicle location on bridge time �a�
(a)
(b)
extrac
RY/FEBRUARY 2010

jects hidden during certain frames, may be also implementedas discussed in �Baldini et al. 2002�.
2. Vehicle size and speed output from the video processing al-gorithm can be used to generate load time histories for finiteelement modeling applications. Machine learning techniquescan be employed to correlate the input traffic excitation tothe output bridge response �output from the FE model com-pared to that measured on the bridge�. Anomalies in thiscorrelation may be used as a basis for SHM and relateddecision-support applications.
Summary and Conclusions
Building on a recently developed integrated structural monitoringframework, a highway bridge TestBed has been established on theVoigt Drive/Interstate-5 overcrossing, located on the UCSD cam-pus. A continuous monitoring framework was built around a ro-bust expandable system that is capable of supporting over 300sensor channels and three cameras. Time-synchronized video andacceleration data are continuously recorded, archived, and madeavailable online for browsing and downloading through a secureWeb portal.
Over a 45-day period, over 1,000 acceleration records werestudied to identify changes in the bridge dynamic response. Varia-tion in natural frequencies in the range of 7–13% was observed.Video signal processing was used to identify vehicle location andspeed. Finally, future research is being directed toward: �1� long-term assessment of the resonant bridge characteristics andchanges due to the ambient environmental conditions and �2� cor-relation of the vehicle loads with the recorded dynamic bridgeresponse.
Acknowledgments
Support of this research was provided by the National ScienceFoundation under Grant No. 0205720. This support is gratefullyacknowledged. The authors wish to thank the California Institutefor Telecommunications and Information Technology �UCSDCalit2, http://www.calit2.net� for providing fellowship support tothis project. Finally, the writers wish to acknowledge Mr. MinhPhan for his major contributions in development of the healthmonitoring Web portal �http://healthmonitoring.ucsd.edu�.
References
Alampalli, S. �1998�. “Influence of in-service environment on modal pa-rameters.” Proc., IMAC 16, Academic Press, Santa Barbara, Calif.,111–116.
Alampalli, S. �2000�. “Effects of testing, analysis, damage, and environ-ment on modal parameters.” Mech. Syst. Signal Process., 14�1�, 63–74.
Allemang, R. J., and Brown, D. L. �1982�. “A correlation coefficient formodal vector analysis.” Proc., 1st Int. Modal Analysis Conf., Societyfor Experimental Mechanics, Orlando, Fla., Society of ExperimentalMechanics, Bethel, Conn., 110–116.
Baldini, G., Campadelli, P., Cozzi, D., and Lanzarotti, R. �2002�. “Asimple and robust method for moving target tracking.” Proc., IASTEDInt. Conf. Signal Processing, Pattern Recognition and Applications(SPPRA2002), ACTA Press, Crete, Greece, 108–112.
Balmès, É., Basseville, M., Bourquin, F., Mevel, L., Nasser, H., and
JOURNAL OF COMPUTING
Treyssède, F. �2008�. “Merging sensor data from multiple temperaturescenarios for vibration monitoring of civil structures.” Structuralhealth monitoring, Vol. 7, SAGE, 129–142.
Beymer, D., McLauchlan, P., Coifman, B., and Malik, J. �1997�. “A real-time computer vision system for measuring traffic parameters.” Proc.,IEEE Conf. on Computer Vision and Pattern Recognition, San Juan,Puerto Rico, IEEE Computer Society, Washington, D.C.
Bolton, R., Stubbs, N., and Sikorsky, C. �2002�. “Automation of modalproperty extraction for a permanently instrumented highway bridge.”Proc., 20th Int. Modal Analysis Conf. (IMAC 20), Los Angeles, Calif.,Society of Experimental Mechanics, Bethel, Conn., 1217–1223.
Carden, E. P., and Fanning, P. �2004�. “Vibration based condition moni-toring: A review.” Struct. Health Monit., 3�4�, 355–377.
Casciati, F. �2003�. “An overview of structural health monitoring exper-tise within the European union.” Structural health monitoring andintelligent infrastructure, Z. S. Wu and M. Abe, eds., Swets andZeitlinger, Lisse, 31–37.
Catbas, F. N., Brown, D. L., and Aktan, A. E. �2004�. “Parameter esti-mation for multiple-input multiple-output modal analysis of largestructures.” J. Eng. Mech., 130�8�, 921–930.
Chang, P. C., Flatau, A., and Liu, S. C. �2003�. “Review paper: Healthmonitoring of civil infrastructure.” Struct. Health Monit., 2�3�, 257–267.
Chen, Y., and Feng, M. Q. �2006�. “Modeling of traffic excitation forsystem identification of bridge structures.” Comput. Aided Civ. Infra-struct. Eng., 21�1�, 57–66.
Chen, Y., Tan, C.-A., and Feng, M. Q. �2004�. “Physics-based trafficexcitation for highway bridges.” Proc., SPIE Conf. Smart Structuresand Materials 2004: Sensors and Smart Structures Technologies forCivil, Mechanical, and Aerospace Systems, San Diego, Calif., SPIE,Bellingham, Wash.
Chen, Y., Tan, C.-A., Feng, M. Q., and Fukuda, Y. �2006�. “A video-assisted approach for structural health monitoring of highway bridgesunder normal traffic.” Proc., SPIE Conf. Smart Structures and Mate-rials 2006: Sensors and Smart Structures Technologies for Civil, Me-chanical, and Aerospace Systems, San Diego, Calif.
Chong, K. P., Carino, N. J., and Washer, G. �2003�. “Health monitoring ofcivil infrastructures.” Smart Mater. Struct., 12, 483–493.
Collins, R. T., Lipton, A. J., Fujiyoshi, H., and Kanade, T. �2001�. “Asystem for video surveillance and monitoring.” Proc. IEEE, 89�10�,1456–1477.
Cucchiara, R., Grana, C., Piccardi, M., and Prati, A. �2000�. “Statisticaland knowledge-based moving object detection in traffic scene.” Proc.,IEEE Int. Conf. on Intelligent Transportation Systems, IEEE Com-puter Society, Washington, D.C.
Elgamal, A., et al. �2003�. “Health monitoring framework for bridges andcivil infrastructure.” Proc., 4th Int. Workshop on Structural HealthMonitoring, Stanford, Calif., DEStech Publications, Inc., Lancaster,Penn.
Elgamal, A., et al. �2004�. “A framework for monitoring bridges and civilinfrastructure.” Proc. of the 3rd China-Japan-US Symposium onStructural Health Monitoring and Control, Dalian, China, Oct. 14–16�Invited Paper�.
Farrar, C. R., Doebling, S. W., Cornwell, P. J., and Straser, E. G. �1997�.“Variability of modal parameters measured on the Alamosa CanyonBridge.” Proc., IMAC 15, Orlando, Fla., Society of Experimental Me-chanics, Bethel, Conn., 257–203.
Farrar, C. R., and James, G. H., III. �1997�. “System identification fromambient vibration measurements on a bridge.” J. Sound Vib., 205�1�,1–18.
Fraser, M. �2006�. “Development and implementation of an integratedframework for structural health monitoring.” Ph.D. dissertation, Dept.of Structural Engineering, Univ. of California at San Diego, La Jolla,Calif.
Friedman, N., and Russell, S. �1997�. “Image segmentation in image
IN CIVIL ENGINEERING © ASCE / JANUARY/FEBRUARY 2010 / 23

Sequences: A probabilistic approach.” Proc., 13th Conf. on Uncer-tainty of Artificial Intelligence, Aug. 1–3, Morgan Kaufmann, SanFrancisco, Calif.
Fu, G., and Moosa, A. G. �2002�. “An optical approach to structuraldisplacement measurement and its application.” J. Eng. Mech.,128�5�, 511–520.
Gonzalez, R. C., Woods, R. E., and Eddins, S. L. �2004�. Digital imageprocessing using MATLAB, Prentice-Hall, Upper Saddle River, N.J.
Guan, H., Karbhari, V. M., and Sikorsky, C. S. �2006�. “Web-based struc-tural health monitoring of an FRP composite bridge.” Comput. AidedCiv. Infrastruct. Eng., 21�1�, 39–56.
He, X. �2008�. “Vibration-based damage identification and health moni-toring of civil structures.” Ph.D. thesis, Dept. of Structural Engineer-ing, Univ. of California at San Diego, La Jolla, Calif.
Hutchinson, T. C., Kuester, F., Doerr, K.-U., and Lim, D. H. �2006�.“Optimal hardware and software design of an image-based system forcapturing dynamic movements.” IEEE Trans. Instrum. Meas., 55�1�,164–175.
Juang, J. N., and Pappa, R. S. �1985�. “An eigensystem realization algo-rithm for modal parameter identification and model reduction.” J.Guid. Control Dyn., 8�5�, 620–627.
Kastrinaki, V., Zervakis, M., and Kalaitzakis, K. �2003�. “A survey ofvideo processing techniques for traffic applications.” Image Vis. Com-put., 21�4�, 359–381.
Ko, J. M., and Ni, Y. Q. �2005�. “Technology developments in structuralhealth monitoring of large-scale bridges.” Eng. Struct., 27, 1715–1725.
Kogut, G. T., and Trivedi, M. M. �2001�. “Maintaining the identity ofmultiple vehicles as they travel through a video network.” Proc.,IEEE Conference on Intelligent, Transportation Systems, Oakland,Calif., 756–761.
Loh, K. J., Lynch, J. P., Wang, Y., Law, K. H., Fraser, M., and Elgamal,A. �2007�. “Validation of a wireless traffic vibration monitoring sys-tem for the Voigt Bridge.” Proc., World Forum on Smart Materialsand Smart Structures Technology, Chongqing and Nanjing, China,CRC Press, Boca Raton, Fla.
Lus, H., Betti, R., and Longman, R. W. �2002�. “Obtaining refined firstorder predictive models of linear structural systems.” EarthquakeEng. Struct. Dyn., 31, 1413–1440.
Masri, S. F., Sheng, L.-H., Caffrey, J. P., Nigbor, R. L., Wahbeh, M., andAbdel-Ghaffar, A. M. �2004�. “Application of a web-enabled real-time structural health monitoring system for civil infrastructure sys-tems.” Smart Mater. Struct., 13, 1269–1283.
Morris, B., and Trivedi, M. M. �2006�. “Robust classification and track-ing of vehicles in traffic video streams.” Proc., IEEE Int. IntelligentTransportation Systems Conf., Toronto, Canada, IEEE Computer So-ciety, Washington, D.C.
Mufti, A. A. �2002�. “Structural health monitoring of innovative Cana-dian civil engineering structures.” Struct. Health Monit., 1�1�, 89–103.
Nayeri, R. D., Masri, S. F., Ghanem, R. G., and Nigbor, R. L. �2008�. “Anovel approach for the structural identification and monitoring of afull-scale 17-story building based on ambient vibration measure-ments.” Smart Mater. Struct., 17, 2.
Peeters, B., and De Roeck, G. �2001a�. “Stochastic system identificationfor operational modal analysis: A review.” J. Dyn. Syst., Meas., Con-trol, 123�4�, 659–667.
Peeters, B., and De Roeck, G. �2001b�. “One-year monitoring of theZ24-Bridge: Environmental effects versus damage events.” Earth-
quake Eng. Struct. Dyn., 30�2�, 149–171.24 / JOURNAL OF COMPUTING IN CIVIL ENGINEERING © ASCE / JANUA
Pines, D. J., and Aktan, A. E. �2002�. “Status of structural health moni-toring of longspan bridges in the United States.” Prog. Struct. Eng.Mater., 4�4�, 372–380.
Prati, A., Mikic, I., Trivedi, M. M., and Cucchiara, R. �2003�. “Detectingmoving shadows: Algorithms and evaluation.” IEEE Trans. PatternAnal. Mach. Intell., 25�7�, 918–923.
Proc., 5th Int. Workshop on Structural Health Monitoring. �2005�. “Struc-tural health monitoring 2005: Advancements and challenges forimplementation.” F.-K. Chang, ed., Stanford, Calif., DEStech Publi-cations, Inc., Lancaster, Penn.
Proc., 6th Int. Workshop on Structural Health Monitoring, Stanford 2007:Quantification, Validation, and Implementation. �2007�. F.-K. Chang,ed., Stanford, Calif., DEStech Publications, Inc., Lancaster, Penn.
Ridder, C., Munkelt, O., and Kirchner, H. �2000�. “Adaptive backgroundestimation and foreground detection using Kalman filtering.” Proc.,Int. Conf. on Recent Advances in Mechatronics, UNESCO Chair onMechatronics, Istanbul, Turkey, 193–199.
Sohn, H. �2003�. “A review of structural health monitoring literature1996-2001.” Proc., Third World Conf. on Structural Control, Vol. 2,John Wiley, Como, Italy, 9–15.
Sohn, S., Dzonczyk, M., Straser, E. G., Kiremidjian, A. S., Law, K. H.,and Meng, T. �1999�. “An experimental study of temperature effect onmodal parameters of the Alamosa Canyon Bridge.” Earthquake Eng.Struct. Dyn., 28, 879–897.
Stauffer, C., and Grimson, W. E. L. �1999� “Adaptive background mix-ture models for real-time tracking.” Proc., IEEE Conf. on ComputerVision and Pattern Recognition, Ft. Collins, Colo., IEEE ComputerSociety, Washington, D.C., 246–252.
Teughels, A., and De Roeck, G. �2004�. “Structural damage identificationof the Highway Bridge Z24 by FE model updating.” J. Sound Vib.,278�3�, 589–610.
Tomizuka, M., Yun, C.-B., and Giurgiutiu, V., Eds. �2006�. “Smart Struc-tures and materials 2006: Sensors and smart structures technologiesfor civil, mechanical, and aerospace systems.” Proc., SPIE Conf.Smart Structures and Materials 2006: Sensors and Smart StructuresTechnologies for Civil, Mechanical, and Aerospace Systems, SanDiego, Calif., SPIE, Bellingham, Wash.
Van Overschee, P., and De Moor, B. �1996�. Subspace identification forlinear systems, Kluwer Academic, AA Dordrecht, The Netherlands.
Wahbeh, M., Tasbihgoo, F., Yun, H., Masri, S. F., Caffery, J. P., andChassiakos, A. G. �2005�. “Real-time earthquake monitoring of large-scale bridge structures.” Proc., 5th Int. Workshop on Structural HealthMonitoring, Stanford University, Stanford Calif., 190–197.
Wang, Y., Loh, K. J., Lynch, J. P., Fraser, M., Law, K. H., and Elgamal,A. �2006�. “Vibration monitoring of the voigt bridge using wired andwireless monitoring systems.” Proc., 4th China-Japan-US Symp. onStructural Control and Monitoring, Hangzhou, China.
Wang, Y., Lynch, J. P., Law, K. H., Loh, C.-H., and Elgamal, A. �2007�.“Reliable information management in a low-cost wireless structuralmonitoring and control network.” Proc., SPIE 14th Int. Symp. onSmart Structures and Materials & Nondestructive Evaluation andHealth Monitoring, San Diego, Calif., SPIE, Bellingham, Wash.
Yan, L. �2006�. “Statistical inference approaches for structural damagedetection.” Ph.D. dissertation, Dept. of Structural Engineering, Univ.of California, San Diego, La Jolla, Calif.
Yan, L., Fraser, M., Elgamal, A., Fountain, T., and Oliver, K. �2008�.“Neural networks and principal components analysis for strain-based
vehicle classification.” J. Comput. Civ. Eng., 22�2�, 123–132.RY/FEBRUARY 2010