Embed Size (px)
Citation preview

ww.sciencedirect.com
b i o s y s t em s e ng i n e e r i n g 1 4 7 ( 2 0 1 6 ) 5 1e6 6
Available online at w
ScienceDirect
journal homepage: www.elsevier .com/ locate/ issn/15375110
Research Paper
Sensor for monitoring rice grain sieve losses incombine harvesters
Zhenwei Liang, Yaoming Li*, Lizhang Xu, Zhan Zhao
Key Laboratory of Modern Agricultural Equipment and Technology, Ministry of Education, Jiangsu University,
Zhenjiang, Jiangsu, 212013, China
a r t i c l e i n f o
Article history:
Received 1 December 2015
Received in revised form
13 March 2016
Accepted 18 March 2016
Published online 26 April 2016
Keywords:
Rice
Grain sieve loss
Impact behaviour
Discrete element method
Field test
* Corresponding author.E-mail addresses: Liangzhenwei518@126.
http://dx.doi.org/10.1016/j.biosystemseng.201537-5110/© 2016 IAgrE. Published by Elsevie
Grain sieve losses are important parameters to judge the performance of cleaning shoes in
combine harvesters. To keep grain sieve loss within acceptable limits, an impact-type
piezoelectric sensor was developed for real-time monitoring. Rice grain and short straw
particle models were established according to their physical properties, and discrete
elementmethod (DEM) simulations were carried out to understand their collision behaviour
with the sensor. The influence of grain shape, straw length and impact angle on variations of
the maximum normal contact force and force rise-time were analysed in detail. Differences
in normal collision force, and force rise-time occurred which lead to corresponding differ-
ences in signal frequency and voltage amplitude. A signal processing circuit, which mainly
consisted of a band-pass filter circuit and a voltage comparator circuit, was designed to
discriminate for full grains. Field tests results indicated that measurement errors recorded
by the sensor and checked against manually measurements were <4.48%.
© 2016 IAgrE. Published by Elsevier Ltd. All rights reserved.
1. Introduction
Combine harvesters operate all over the world, harvesting
different crops under different environmental conditions.
They have functions which cover the entire harvesting pro-
cess that can be divided into cutting, threshing, separating,
cleaning and storing. Cleaning process, refer to the final sep-
aration of grain from material other than grain (MOG), which
is influenced by a wide range of parameters including crop
yield, climate, threshing and cleaning settings (Craessaerts,
De Baerdemaeker, Missotten, & Saeys, 2010; Craessaerts,
Saeys, Missotten, & Baerdemaeker, 2010). Grain sieve loss,
which is influenced by a wide range of parameters such as
com (Z. Liang), [email protected] Ltd. All rights reserved
design, operating conditions as well as crop properties, is an
important parameter to judge the performance of the cleaning
shoe. In China, evaluation of grain sieve losses mainly relies
onmanual labour, using a canvas to collect all mixedmaterial
at the exhaust port, then filtering out the grains from MOG by
a re-cleaner, weighing them and then calculating the absolute
sieve loss. This value can be used for benchmarking, but it
cannot be used for system control because it cannot be ob-
tained real-time. With the advances in sensors and automa-
tion in recent years, researchers have proposed many sensors
for use with combine harvesters to extract real-time infor-
mation from the working process (Craessaerts, Saeys,
Missotten & De Baerdemaeker, 2008; Omid, Lashgari, &
Mobli, 2010; Reyns, Missotten, Ramon, & Baerdemaeker,
126.com, [email protected] (Y. Li).
.

Nomenclature
a,b semi-axis lengths of ellipsoid, m
C equivalent capacitance, F
Ca capacitance in piezoelectric ceramics, F
Cc cable capacitor, F
Ci input capacitance, F
d31, d33 piezoelectric constant, PC/N
e coefficient of restitution
E* effective Young's modulus, MPa
E1 Young's modulus of grain, MPa
E2 Young's modulus of sensor, MPa
Fn normal contact force, N
Fn max maximum normal impact force, N
Fn1 max grain maximum normal impact force, N
Fn2 max straw maximum normal impact force, N
Ft tangential contact force, N
Ft1 max grain tangential contact force, N
Ft2 max straw tangential contact force, N
Fdn normal damping force, N
Fdt tangential damping force, N
g gravitational acceleration, m s�2
G* effective shear modulus, MPa
G1 shear modulus of seed, MPa
G2 shear modulus of sensor, MPa
K33 electromechanical coupling coefficient
I moment of inertia, kg m2
m mass of grain, g
m* equivalent mass, g
n contact normal vector
p contact pressure, MPa
py yield pressure, MPa
Qm mechanical quality factor
r loss grains ratio
R rotating radius of particle, m
R1, R2 radii of principal curvature, m
R* mean effective radius, m
Ri input resistance, U
ti collision time, s
ti1 grain collision time, s
ti2 straw collision time, s
tr force rise-time, s
tr1 grain impact force rise-time, ms
tr2 straw impact force rise-time, ms
Tc curie temperature, �CTr3 relative permittivity
Umax voltage amplitude, V
U unit vector of rotating shaft
v vector of particle velocity, m s�1
vn normal velocity, m s�1
vn1 grain normal velocity, m s�1
vn2 straw normal velocity, m s�1
vt tangential velocity, m s�1
vt1 grain tangential velocity, m s�1
vt2 straw tangential velocity, m s�1
vreln normal relative velocity, m s�1
vrelt tangential relative velocity, m s�1
dn normal overlaps, m
dn1 grain normal overlaps, m
dn2 straw normal overlaps, m
dt tangential overlaps, m
dt1 grain tangential overlaps, m
dt2 straw tangential overlaps, m
a normal overlap, m
amax maximum normal overlap, m
ay yield overlap, m
g aspect ratio
Vout collision output voltage, V
Vout1 grain collision output voltage, V
Vout2 straw collision output voltage, V
n1 Poisson's ratio of output material
n2 Poisson's ratio of plate
q1 grain impact angle, (�)q2 straw impact angle, (�)h1 grain peak force ratio
h2 straw peak force ratio
u rotational velocity, rad s�1
rm density, g cm�3
DEM discrete element method
MCU microcontroller unit
MOG material other than grain
PVDF polyvinylidene fluoride
b i o s y s t em s e n g i n e e r i n g 1 4 7 ( 2 0 1 6 ) 5 1e6 652
2002), either by monitoring machine settings (e.g. driving
speed, fan speed, upper and lower sieve opening) (Mcgechan,
1982), machine load (e.g. feed-rate, torque drum, engine load
and grain mass flow) (Loghavi, Ehsani, & Reeder, 2008) or by
measuring field-related parameters (e.g. moisture content of
grain, machine lateral and longitudinal inclination)
(Craessaerts, De Baerdemaeker et al., 2010; Craessaerts, Saeys
et al., 2010; Lenaerts, Missotten, De Baerdemaeker, & Saeys,
2012; Mouazen, Anthonis, & Saeys, 2004). Some researchers
also have engaged in grain sieve loss auto-detection technol-
ogy (Hiregoudar, Udhaykumar, Ramappa, Shreshta, &
Medaet, 2011) and many advanced combine harvesters have
grain sieve loss monitoring sensors installed (Eldredge, 1985;
Liu and Leonard, 1993; Zhou, Zhang, Liu, & Yuan, 2010; Gao,
Zhang, Yu, & Li, 2011; Li, 2006; Ni, Mao, & Tian, 2011;
Osselaere, 1985). To date, a measure was found for moni-
toring grain loss by quantifying grain impacts during a fixed
interval based on piezoelectric effect. However, the combine
harvesters produced in Europe and North America are mainly
used for harvesting crops, such as wheat, bean and oil-seed
rape. Rice, one of the most important crops in China, is very
different in its physical properties to these crops and there is
therefore a need to develop a signal processing circuit to
accurately discriminate rice grain loss from MOG.
The surface of grain sieve loss monitoring sensors usually
consists of a rigid plate. Different materials collide with the
plate causing differences in the frequency and force of the
collision. The impact behaviour of grains and MOGs with the
plate is therefore a critical step for designing a signal pro-
cessing circuit for real-time monitoring. In recent years,

Fig. 1 e The structure of grain loss monitoring sensor, 1.
support plate, 2. rubber shock absorber 1, 3. sensitive plate,
4. circular piezoelectric ceramics (440 £ 411.8 £ 2 mm), 5.
rubber shock absorber 2, 6. rack connection part.
b i o s y s t em s e ng i n e e r i n g 1 4 7 ( 2 0 1 6 ) 5 1e6 6 53
collisions between deformable objects has been the subject of
intensive investigation by many researchers using theoret-
ical, numerical, and experimental methods (Sommerfeld,
2002; Wynn, 2009; Vu-Quoc & Zhang, 1999; Zhang & Vu-
Quoc, 2002). Proper discussion and understanding of the
phenomena involved cannot be obtained without the help of
numerical simulations. Numerical simulations based on the
discrete element method (DEM) (Cundall & Strack, 1979) have
shown to be very useful in understanding the involved phe-
nomena for numerous applications (Bertrand, Leclaire, &
Levecque, 2005; Li, Li, Gao, Zhao, & Xu, 2012; Sakaguchi,
Suzuki, & Favier, 2001). However, previous research has
mainly focussed on creating a deep insight into certain as-
pects of grain particle impacts with the plate. Studies have
mainly used sphere models as discrete units, which some-
times vary greatly with the real materials, and result in
certain calculation errors occurring (Wojtkowski, Pecen,
Horabik, & Molenda, 2010; Wynn, 2009). Also, materials
impacting on the sensor are complex because, in addition to
grain particles, there are also MOG have a strong influence on
monitoring accuracy. Although a number of research
papers are available describing the interaction of wheat
grains with machine components by means of DEM, no
literature is available that discusses the collision behaviour of
rice and its MOG using a rigid plate (Gao et al., 2011;
Wojtkowski et al., 2010).
In this paper, the design of a grain sieve loss monitoring
sensor using YT-5L piezoelectric ceramics as sensing
element, and utilising DEM to simulate the collision behav-
iour of rice grain and its MOG. The influence of grain shape,
straw length and collision angle on variations of the normal
contact force and force rise-time are analysed in detail laying
the foundation for designing a circuit to accurately discrim-
inate rice grain in real-time. A grain sieve loss monitor
mathematical model was developed and field tests carried
out.
Table 1 e Properties of YT-5 piezoelectric ceramicmaterial.
Description Parameters Value
Electromechanical coupling coefficient K33 0.71
Piezoelectric constant PC/N d31 270
d33 550
Relative permittivity ε Tr3 7.0
Curie temperature/C Tc 280
Mechanical quality factor Qm 70
Density g ml�1 rm 7.6
2. Materials and methods
2.1. Structure of the sensor
Due to the small mass of rice grains, the grain collision signal
is relatively weak so a grain loss monitoring sensor was
developed by selecting a YT-5L piezoelectric ceramic as a
sensitive element and pasting it into the centre of the sensi-
tive plate of a sensor. YT-5L piezoelectric ceramics (produced
by Baoding Sky Ultrasonic Technology Co., Ltd., Baoding,
China, and with a piezoelectric constant was 450 pc N�1) have
high sensitivity to dimensional changes and are able to
respond to micro-vibrations. They are especially suited for
measuring dynamic changes (Song, Gu, Mo, Hsu, & Dhonde,
2007; Wang, Wang, & Wang, 2009). The sensitive plate was
constructed from stainless steel 304 and was 550 mm
(length) � 125 mm (width) � 1.5 mm (thickness). Four rubber
shock absorbers installed within the sensitive plate supported
the support plate and the rack connection parts to eliminate
vibrational interference (Pan, Shangguan, Chai, & Huang,
2009; Sciulli & Inman, 1998). The installation angle of the
sensor was adjustable in the range of 0e60� to prevent output
materials accumulating on the sensor surface. The designed
grain sieve loss monitoring sensor is shown in Fig. 1 and the
properties of the YT-5 piezoelectric ceramic are shown in
Table 1.
The feeding quantity of the combine harvester used in
work was about 4.5 kg s�1, the output grains which fell onto
the sieve at about 1.5 kg s�1, which gave the ratio of grain to
MOG of about 2 for rice. According to national standards for
combine harvesters in China, the grain sieve loss ratio should
be no large than 1%, so grain sieve losses are about 15 g s�1 or
about 500 grains s�1 assuming the thousand-grain weight is
30 g. The averaged values of proportional relationships be-
tween grain total sieve losses and grains in the sensor moni-
toring area were about 0.12, thus the detecting frequency of
the sensor should >60 grains s�1.
Transient collision signals have a rapid decay in the plane
of symmetry of the sensitive plate and the systemhas a strong
vibration resonance because of its low damping ratio. This
transform the input signal into a harmonic oscillation signal
which is an energy signal, and this attenuates with time
affecting the detecting frequency. The shorter the attenuation
time, themore rapidly the vibration system achieves a steady-
state status, and sensitivity of the system increases. There-
fore, selecting an appropriate damping ratio was the basis of
detecting a signal with a short attenuation time. Viscoelastic
damping layers integrated into structures have been widely
used in engineering to suppress the transmission of vibration
and noise to structures (Liu, Hua, & Zhang, 2004; Nakra, 1998).
To accelerate the detection speed of the monitor, a partially
constrained viscoelastic damping layer treatmentwas applied
to the surface of the sensor. Optimal position of the damping
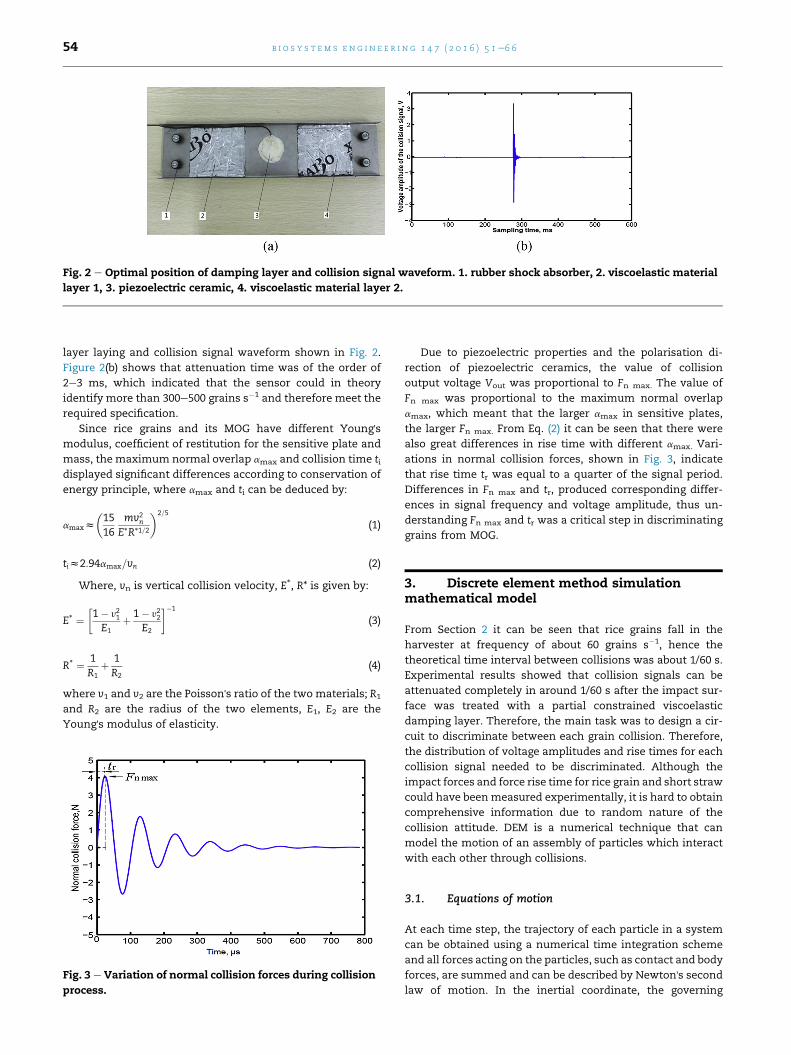
Fig. 2 e Optimal position of damping layer and collision signal waveform. 1. rubber shock absorber, 2. viscoelastic material
layer 1, 3. piezoelectric ceramic, 4. viscoelastic material layer 2.
b i o s y s t em s e n g i n e e r i n g 1 4 7 ( 2 0 1 6 ) 5 1e6 654
layer laying and collision signal waveform shown in Fig. 2.
Figure 2(b) shows that attenuation time was of the order of
2e3 ms, which indicated that the sensor could in theory
identify more than 300e500 grains s�1 and therefore meet the
required specification.
Since rice grains and its MOG have different Young'smodulus, coefficient of restitution for the sensitive plate and
mass, the maximum normal overlap amax and collision time tidisplayed significant differences according to conservation of
energy principle, where amax and ti can be deduced by:
amaxz
�1516
mv2n
E*R*1=2
�2=5
(1)
tiz2:94amax=vn (2)
Where, vn is vertical collision velocity, E*, R* is given by:
E* ¼�1� y21E1
þ 1� y22E2
��1
(3)
R* ¼ 1
R1þ 1
R2(4)
where v1 and v2 are the Poisson's ratio of the two materials; R1
and R2 are the radius of the two elements, E1, E2 are the
Young's modulus of elasticity.
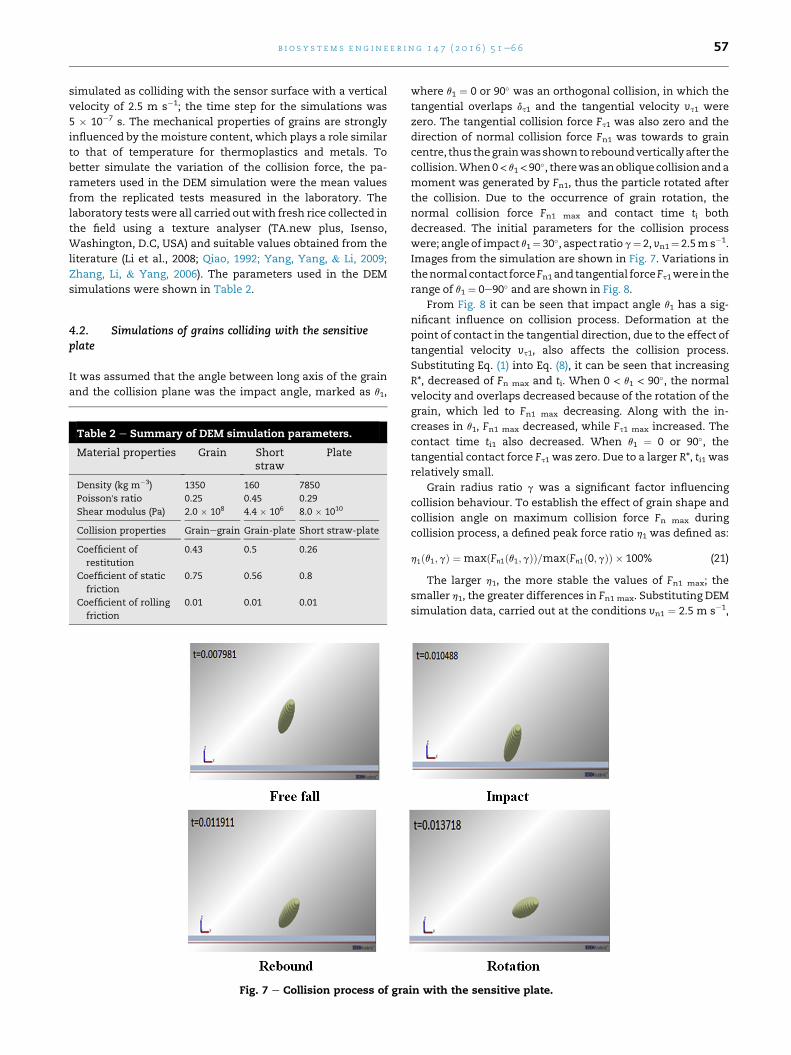
Fig. 3 e Variation of normal collision forces during collision
process.
Due to piezoelectric properties and the polarisation di-
rection of piezoelectric ceramics, the value of collision
output voltage Vout was proportional to Fn max. The value of
Fn max was proportional to the maximum normal overlap
amax, which meant that the larger amax in sensitive plates,
the larger Fn max. From Eq. (2) it can be seen that there were
also great differences in rise time with different amax. Vari-
ations in normal collision forces, shown in Fig. 3, indicate
that rise time tr was equal to a quarter of the signal period.
Differences in Fn max and tr, produced corresponding differ-
ences in signal frequency and voltage amplitude, thus un-
derstanding Fn max and tr was a critical step in discriminating
grains from MOG.
3. Discrete element method simulationmathematical model
From Section 2 it can be seen that rice grains fall in the
harvester at frequency of about 60 grains s�1, hence the
theoretical time interval between collisions was about 1/60 s.
Experimental results showed that collision signals can be
attenuated completely in around 1/60 s after the impact sur-
face was treated with a partial constrained viscoelastic
damping layer. Therefore, the main task was to design a cir-
cuit to discriminate between each grain collision. Therefore,
the distribution of voltage amplitudes and rise times for each
collision signal needed to be discriminated. Although the
impact forces and force rise time for rice grain and short straw
could have beenmeasured experimentally, it is hard to obtain
comprehensive information due to random nature of the
collision attitude. DEM is a numerical technique that can
model the motion of an assembly of particles which interact
with each other through collisions.
3.1. Equations of motion
At each time step, the trajectory of each particle in a system
can be obtained using a numerical time integration scheme
and all forces acting on the particles, such as contact and body
forces, are summed and can be described by Newton's second
law of motion. In the inertial coordinate, the governing

b i o s y s t em s e ng i n e e r i n g 1 4 7 ( 2 0 1 6 ) 5 1e6 6 55
equations for the acceleration of the particle's centre and the
particle's angular momentum can be written as:
mdvdt
¼ Fn þ Ft þmg (5)
Idudt
¼ R$U� ðFn þ FtÞ (6)
where m is the particle mass, v and u are translational and
rotational velocities of the particle, Fn and Ft are normal and
the tangential impact forces, R and U are rotating radius and
the unit vector of rotating shaft, g is the gravitational accel-
eration, I is themoment of inertia. Therefore, the translational
velocity vt of contact point in the plate can be deduced:
vt ¼ vþ R$U�u (7)
3.2. Normal contact model
In the DEM, particle positions and velocities for every time
step are obtained from a step-by-step integration of the
equations of motion. In this procedure, the evaluation of
particleeparticle interaction (i.e., contact) forces plays a crit-
ical role. Since particleeparticle contact forces are calculated
using force-displacement models, the accuracy and correct-
ness of simulation results are highly dependent on the normal
force-displacement and the tangential force-displacement
models employed. The contact pressure during loading is
less than the limiting contact pressure, the grain contact is
treated as elastic. The Hertz-Mindlin (no slip) model provides
relative velocity-dependent rolling friction and ensures
the same torque being applied to each of the particles in
contact. In this paper we choose this contact model, which
can be considered as a ‘spring-dashpot’ configuration, to
calculate the force changing process of grains and straws.
During the elastic mode of loading for two contact spheres,
the contact is treated as elastic and was governed by the
Hertz formula, the normal contact force Fn which can be
expressed by:
Fn ¼ 43E*R*1=2d3=2n (8)
where, dn is the normal overlaps.
The radius of the contact area between two spheres is
given by:
a ¼�3PR4E
�1=3
¼ffiffiffiffiffiffiffiffiffiffiR*dn
p(9)
The pressure distribution over the contact area is then:
pðrÞ ¼ 3Fn
2pa2
�1�
�ra
�2�1=2
(10)
where r is the radius of the collision material.
If the contact pressure during the loading is less than the
yield pressure py, for a given value of py, the radius of the
contact area ay corresponding to yield initiation at the centre
of the contact area p(r¼0) ¼ py can be determined by:
ay ¼ pR*py
2E*(11)
The corresponding yield overlap is:
dy ¼p2p2
y
4E*2R* (12)
3.3. Tangential contact model
The theory of Mindlin was used for the elastic frictional con-
tact between two spheres in the tangential direction. Let FðnÞt
and Fðnþ1Þt be the tangential contact forces before and after an
increment of tangential displacement Dd. The relationship
between FðnÞt and Fðnþ1Þt is given by the following incremental
formula:
Fðnþ1Þt ¼ 8aG*KTDdþ FðnÞ
t (13)
where KT is computed according to Mindlin and Deresiewicz
(1953), and the effective shear modulus G* can be calculated
by:
G* ¼ 2� y1
G1þ 2� y2
G2(14)
where, G1 and G2 are the shear modulus of the two materials.
Additionally, there are normal damping force Fdn and tangen-
tial damping force Fdt which can be written as:
Fdn ¼ �2
ffiffiffi56
rb
ffiffiffiffiffiffiffiffiffiffiffiSnm*
pvreln (15)
Fdt ¼ �2
ffiffiffi56
rb
ffiffiffiffiffiffiffiffiffiffiffiStm*
pvrelt (16)
where, Vreln is the normal relative velocity, Vrel
t is the tangential
relative velocity,m* is the equivalent mass, m*, Sn, St, b can be
deduced by:
m* ¼ 1m1
þ 1m2
(17)
Sn ¼ 2E*ffiffiffiffiffiffiffiffiR*a
p(18)
St ¼ 8G*ffiffiffiffiffiffiffiffiR*a
p(19)
b ¼ ln effiffiffiffiffiffiffiffiffiffiffiffiffiffiffiffiffiffiffiffiffiln2 eþ p2
p (20)
where m1 and m2 are the mass of the two elements, a is the
contact radii, e is the coefficient of restitution.
4. Discrete element method simulations
4.1. Particle models
The main ingredients of the cleaning shoe were rice grain
(radius ratio generally 1e3 (Xu & Li, 2009)), long grass
(100e300 mm in length), short straw (30e90 mm in length),
and some light debris. An image of the main ingredients and
their proportions is shown in Fig. 4. The physical figures of the
grain and MOG are shown in Fig. 5.
Collision experiments indicated that blighted grains and
light miscellaneous material have only a slight influence on
themonitoring accuracy of the sensor since theirmasseswere

Fig. 4 e The main ingredients and their proportions in the cleaning shoe.
Fig. 5 e Physical figures of grain and MOG in the mixture.
b i o s y s t em s e n g i n e e r i n g 1 4 7 ( 2 0 1 6 ) 5 1e6 656
relatively small. Therefore, modelling mainly focused on the
collision process of rice grains and short straws impacting the
plate. A commercial DEM code (EDEM® 2.5, DEM Solutions Ltd.,
Edinburgh, UK) was used in this work. The focus was on how
results from the simulations could be used to optimise sensor
design. Ellipsoid grain particles and short straw particles were
simulated using composite particles made up of several
overlapping spheres. This made it feasible to simulate the
impact plate experiments within a reasonable period. Devel-
oped examples of grain particle model and short straw
Fig. 6 e Established grain particle mod
particle models are shown in Fig. 6. The diameter of the short
strawwas 5mm. A cross section of the established short straw
model shown in Fig. 6(b). Since straw has a hollow structure,
12 sphere particles of diameter 1 mm were used to make a
circle ring, in each layer one sphere particle was tangential
with the other. The distance between sphere centres in the
two layers along the long axis was 0.8 mm. The sensitive plate
was developed directly in the softwarewith its thickness, size,
physical properties (including deformation) defined according
to the EDEM user guide. Rice grains and short straws were
el and short straw particle model.
b i o s y s t em s e ng i n e e r i n g 1 4 7 ( 2 0 1 6 ) 5 1e6 6 57
simulated as colliding with the sensor surface with a vertical
velocity of 2.5 m s�1; the time step for the simulations was
5 � 10�7 s. The mechanical properties of grains are strongly
influenced by the moisture content, which plays a role similar
to that of temperature for thermoplastics and metals. To
better simulate the variation of the collision force, the pa-
rameters used in the DEM simulation were the mean values
from the replicated tests measured in the laboratory. The
laboratory tests were all carried out with fresh rice collected in
the field using a texture analyser (TA.new plus, Isenso,
Washington, D.C, USA) and suitable values obtained from the
literature (Li et al., 2008; Qiao, 1992; Yang, Yang, & Li, 2009;
Zhang, Li, & Yang, 2006). The parameters used in the DEM
simulations were shown in Table 2.
4.2. Simulations of grains colliding with the sensitiveplate
It was assumed that the angle between long axis of the grain
and the collision plane was the impact angle, marked as q1,
Table 2 e Summary of DEM simulation parameters.
Material properties Grain Shortstraw
Plate
Density (kg m�3) 1350 160 7850
Poisson's ratio 0.25 0.45 0.29
Shear modulus (Pa) 2.0 � 108 4.4 � 106 8.0 � 1010
Collision properties Grainegrain Grain-plate Short straw-plate
Coefficient of
restitution
0.43 0.5 0.26
Coefficient of static
friction
0.75 0.56 0.8
Coefficient of rolling
friction
0.01 0.01 0.01
Fig. 7 e Collision process of gra
where q1 ¼ 0 or 90� was an orthogonal collision, in which the
tangential overlaps dt1 and the tangential velocity vt1 were
zero. The tangential collision force Ft1 was also zero and the
direction of normal collision force Fn1 was towards to grain
centre, thus thegrainwasshownto reboundverticallyafter the
collision.When0< q1<90�, therewasanobliquecollisionanda
moment was generated by Fn1, thus the particle rotated after
the collision. Due to the occurrence of grain rotation, the
normal collision force Fn1 max and contact time ti both
decreased. The initial parameters for the collision process
were; angle of impact q1¼ 30�, aspect ratio g¼ 2, vn1¼ 2.5ms�1.
Images from the simulation are shown in Fig. 7. Variations in
thenormalcontact forceFn1and tangential forceFt1were in the
range of q1 ¼ 0e90� and are shown in Fig. 8.
From Fig. 8 it can be seen that impact angle q1 has a sig-
nificant influence on collision process. Deformation at the
point of contact in the tangential direction, due to the effect of
tangential velocity vt1, also affects the collision process.
Substituting Eq. (1) into Eq. (8), it can be seen that increasing
R*, decreased of Fn max and ti. When 0 < q1 < 90�, the normal
velocity and overlaps decreased because of the rotation of the
grain, which led to Fn1 max decreasing. Along with the in-
creases in q1, Fn1 max decreased, while Ft1 max increased. The
contact time ti1 also decreased. When q1 ¼ 0 or 90�, the
tangential contact force Ft1 was zero. Due to a larger R*, ti1 was
relatively small.
Grain radius ratio g was a significant factor influencing
collision behaviour. To establish the effect of grain shape and
collision angle on maximum collision force Fn max during
collision process, a defined peak force ratio h1 was defined as:
h1ðq1;gÞ ¼ maxðFn1ðq1;gÞÞ=maxðFn1ð0;gÞÞ � 100% (21)
The larger h1, the more stable the values of Fn1 max; the
smaller h1, the greater differences in Fn1 max. Substituting DEM
simulation data, carried out at the conditions vn1 ¼ 2.5 m s�1,
in with the sensitive plate.

Fig. 8 e Variation of Fn, Ft during grain collision process.
b i o s y s t em s e n g i n e e r i n g 1 4 7 ( 2 0 1 6 ) 5 1e6 658
g ¼ 1e4, q1 ¼ 0e90� into (Eq. (21)), obtained the variations of h1shown in Fig. 9.
From Fig. 9 it can be see that h1 monotonically decreased
with increasing g, which indicated that the differences in Fn1
maxweremore significant. At the collision point, theminimum
h1 (h1< 40%) appeared when q1 ¼ 20�e40� and g ¼ 3. Figure 10
shows variations of tr1 with increasing q1. Overall, tr1 was
distributed within 15e34 ms; the minimum tr1 appeared in the
range of q 1¼ 20�e40�. Simulation results indicated that Fn1 max
was distributed in the range 1.4 Ne8.5 N.
4.3. Simulation of short straw collision with thesensitive plate
Short straws significantly influence the monitoring accuracy
of the sensor. It was assumed that the angle between length
direction of the straw and the collision plane was the impact
angle, marked as q2. Variations of Fn2 max and tr2 for short
straw collisions with the sensitive plate at conditions of
vn2 ¼ 2.5 m s�1, straw length l ¼ 10e90 mm, q2 ¼ 0e90� are
shown in Fig. 11. From Fig. 11(a) it can be seen that rise-time
tr2 was relatively low when the impact angle q2 ¼ 0 or 90�,and force rise time tr2 increased with the increasing of straw
length l when q2 was fixed. It was also found that force rise
time tr2 increased rapidly in the range of 0 < q2 < 45�. It
reached a relatively high value when q2 ¼ 45�, and then
decreased with increasing q2. From Fig. 11(b) it can be seen
Fig. 9 e Influence of grain radius ratio g and collision angle
q on peak force ratio h.
that along with the increasing of q2, Fn2 max increased
accordingly. At a certain collision angle, Fn2 max decreased
rapidly as straw length l increased from 0 to 75 mm, and Fn2
max increased dramatically as straw length increased from 75
to 90 mm. Generally speaking, tr2 was distributed in the
range 63e182 ms and Fn2 max was distributed in the range
0.1e1.2 N.
Similarly, to make demonstrate the influence of straw
length l and collision angle q2 on peak contact force Fn2 max
during collision process, a peak force ratio h2 was defined as:
h2ðq2; lÞ ¼ maxðFn2ðq2; lÞÞ=maxðFn2ð0; lÞÞ � 100% (22)
From Fig. 12 it can be seen that along with the increasing of
l, h2 decreased rapidly to about 30%. Because of the opposite
directions of two moment generated by Ft2 and Fn2 when
0 < q2 < 90�, the peak force ratio h2 reached its minimum value
in the range of 60� < q2 < 75�.
4.4. Free-fall experiments
To verify the DEM simulation results, collision experiments
were carried out in laboratory. Material was allowed to fall
from a height of 250 mm onto the sensitive plate. The output
voltage signal was recorded by a storage digital oscilloscope
(DS01022A, Agilent, Santa Clara, CA, USA) with a bandwidth
500 kHz. Due to high internal resistance of the piezoelectric
ceramics and the weak collision signal, the collision signal
should be converted into a low impedance signal and
enlarged, otherwise the collision signal may be submerged by
Fig. 10 e Influence of contact angle q1 on force rise time tr1under different grain radius ratio.

Fig. 11 e Variation of Fn2 max and tr2 during short straw collisions with sensitive plate.
Fig. 12 e Influence of short straw length l and collision
angle q2 on peak force ratio h2 with vn2 ¼ 2.5 m s¡1,
l ¼ 10e90 mm, q2 ¼ 0e90�.
b i o s y s t em s e ng i n e e r i n g 1 4 7 ( 2 0 1 6 ) 5 1e6 6 59
other interference signals. A voltage amplifier was selected as
preamplifier, simplified voltage amplifier circuit shown in
Fig. 13.
In the above, the equivalent resistance of the piezoelectric
ceramics R ¼ Ra/Ri, where Ra is the leakage resistance, Ri is the
input resistance and the equivalent capacitance
C¼ Ci þ Ca þ Cc, where Ca is the capacitance of the piezo-
electric ceramics, Ci is the input capacitance and Cc is cable
capacitance.
Assuming that grain collision force Fn¼ Fn max sinut acts on
a piezoelectric ceramic, then the generated charge and voltage
Fig. 13 e Simplified circuit diagram of the voltage amplifier
circuit.
on the piezoelectric ceramic surface is varied according to
sinusoidal law, that is:
q ¼ d33F (23)
Since i¼ dq/dt, the voltage amplitude Umax is obtained as;
Umax ¼ d33$Fn max$uRffiffiffiffiffiffiffiffiffiffiffiffiffiffiffiffiffiffiffiffiffiffiffiffi1þ ðuRCÞ2
q (24)
where u is the angular frequency of the signal vibration.
When R / ∞, the input voltage of operational amplifier A1
can be expressed as:
Umax ¼ d33Fn max
C(25)
From Eq. (25) it can be seen that the output voltage is
proportional to the maximum normal collision force Fn max.
The operational amplifier AD620an (Analog Devices, Inc.,
Norwood, MA, USA) is a low cost, high accuracy instru-
mentation amplifier that requires only one external resistor
to set gains of 1e10,000. Furthermore, the packaging of
AD620an is smaller than discrete designs and offers lower
power (only 1.3 mA max supply current), making it a good
choice for battery-powered, portable (or remote)
applications.
The parameters of rice grains and short straws are shown
in Table 2 and typical experimental results are shown in
Fig. 14. It can be seen that the highest value of Vout1 was 4.0 V
with a tr1 of 14 ms, and the lowest value of Vout1 was about 2.5 V
with tr1 of 30 ms when a single collision occurred (grain1 and
grain 2 in Fig. 14, with semi-axes dimension of
3.75 � 1.6 � 1.1 mm, mass 29 � 10�3 g). Some experiments
were carried out by using another rice grain (grain 3) with
semi-axes 2.95 � 1.8 � 1.4 mm and mass 27.5 � 10�3 g. The
typical variations of collision force were also found with this
grain. Because of the smaller dimensions, the ranges of Vout1
and tr1 were reduced to1.8e3.5 V and 15e25 ms, respectively.
Typical experimental results for short straws with different
lengths showed that the highest value of Vout2 was below 1.5 V
with tr2 of 130 ms, and the lowest value of Vout2 was about 1.0 V
with tr2 of 80 ms. Comparedwith simulation results inwhich tr1was in the range 15e34 ms and tr2 in the range 63e182 ms, the

Fig. 15 e Circuit diagram of fourth-order Chebysheff band-
pass filter.
Fig. 16 e Circuit diagram of absolute value amplifier.
b i o s y s t em s e n g i n e e r i n g 1 4 7 ( 2 0 1 6 ) 5 1e6 660
experimental results were shown to be basically consistent
with the DEM simulation results.
4.5. Design of a signal processing circuit
4.5.1. Filter circuitFrom simulation results it can be seen that the rise time tr1 of
the grain collision signals was in the range 15e34 ms making
the signal frequency of grain collisions in the range 7e16 kHz
and the, signal rise time tr2 within the range 63e182 ms. The
straw collision signal frequency was in the range 1e4 kHz.
Considering simulation errors, a fourth-order band-pass filter
circuit with a corner frequency of 5e20 kHz was designed to
discriminate out the grains. The filter circuit was designed
using a reference handbook for filter design (Carter&Mancini,
2010) shown in Fig. 15.
4.5.2. Absolute value amplifier circuitPeak voltage is another crucial index for characterising grain
impact signals. Due to the stochastic nature of grain collisions
and initial velocity, the generated signal peak voltages may be
positive or negative. In order to accurately acquire the peak
voltage, an absolute value amplifier consisting of a precision
detector and an adder was developed, the circuit shown in
Fig. 16. The principle of the absolute value amplifier circuit
was as follows:
v3 ¼ �R5
R3$v2 ðv2 < 0Þ (26)
v3 ¼�R1$R5
R2$R4� R5
R3
�$v2 ðv2 >0Þ (27)
4.5.3. Signal pulse shaping and square wave generator circuitTo avoid influence of impact resonance, an envelope detector
was added to extract the signal envelope curve to reduce the
counting error. The enveloped signal was then carried into a
voltage comparator circuit to obtain a standard square wave
signal. Standard square voltage pulse signals were sent to a
microcontroller unit (MCU), based on AT89C52 (Atmel Co., San
Fig. 14 e Typical experimental results of rice
Jose, CA, USA) single chipmicrocomputer to count the number
of grains, and the result was shown by using an instrument
display. The sensitivity of the sensor could be adjusted by
changing the threshold value of the comparator circuit, and
local interference could be inhibited. The signal pulse shaping
and square wave generating circuit is shown in Fig. 17. A di-
agram of the signal processing circuit is shown in Fig. 18.
4.6. Performance calibration experiments
To check performance of the signal processing circuit, ex-
periments were carried out on a calibration bench. The
grain and MOG collision with the sensor.
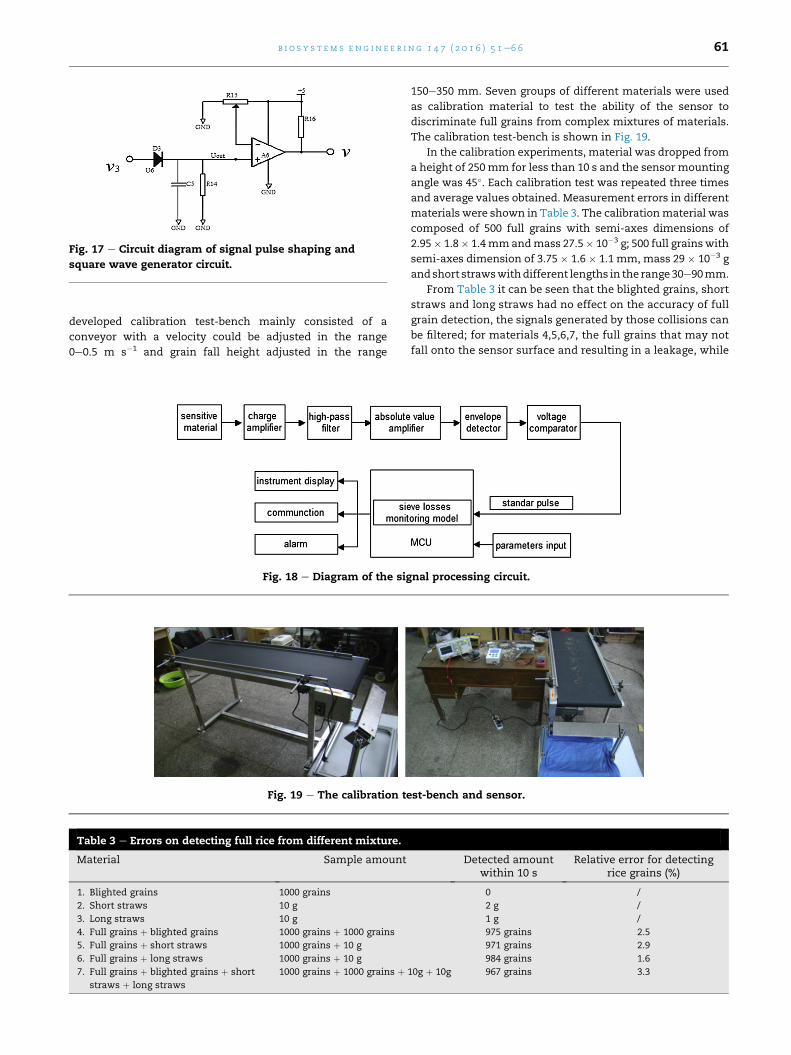
Fig. 17 e Circuit diagram of signal pulse shaping and
square wave generator circuit.
b i o s y s t em s e ng i n e e r i n g 1 4 7 ( 2 0 1 6 ) 5 1e6 6 61
developed calibration test-bench mainly consisted of a
conveyor with a velocity could be adjusted in the range
0e0.5 m s�1 and grain fall height adjusted in the range
Fig. 18 e Diagram of the sig
Fig. 19 e The calibration te
Table 3 e Errors on detecting full rice from different mixture.
Material Sample amount
1. Blighted grains 1000 grains
2. Short straws 10 g
3. Long straws 10 g
4. Full grains þ blighted grains 1000 grains þ 1000 grains
5. Full grains þ short straws 1000 grains þ 10 g
6. Full grains þ long straws 1000 grains þ 10 g
7. Full grains þ blighted grains þ short
straws þ long straws
1000 grains þ 1000 grains þ
150e350 mm. Seven groups of different materials were used
as calibration material to test the ability of the sensor to
discriminate full grains from complex mixtures of materials.
The calibration test-bench is shown in Fig. 19.
In the calibration experiments, material was dropped from
a height of 250mm for less than 10 s and the sensor mounting
angle was 45�. Each calibration test was repeated three times
and average values obtained. Measurement errors in different
materials were shown in Table 3. The calibrationmaterial was
composed of 500 full grains with semi-axes dimensions of
2.95� 1.8� 1.4mmandmass 27.5� 10�3 g; 500 full grainswith
semi-axes dimension of 3.75 � 1.6 � 1.1 mm, mass 29 � 10�3 g
andshort strawswithdifferent lengths in the range30e90mm.
From Table 3 it can be seen that the blighted grains, short
straws and long straws had no effect on the accuracy of full
grain detection, the signals generated by those collisions can
be filtered; for materials 4,5,6,7, the full grains that may not
fall onto the sensor surface and resulting in a leakage, while
nal processing circuit.
st-bench and sensor.
Detected amountwithin 10 s
Relative error for detectingrice grains (%)
0 /
2 g /
1 g /
975 grains 2.5
971 grains 2.9
984 grains 1.6
10g þ 10g 967 grains 3.3

Table 4 e Properties of experimental rice.
Rice variety Zhen 10
Grain moisture content (%) 29.3
MOG moisture content (%) 60.4
Average length of the stems (mm) 15.3
MOG/grain mass ratio 2.3
Thousand seed mass (g) 25.71
Grain yield (kg ha�1) 10,755
b i o s y s t em s e n g i n e e r i n g 1 4 7 ( 2 0 1 6 ) 5 1e6 662
some grains falling with a relative high velocity may collide
with the sensor be ejected and then, collide with the sensitive
plate again because of interactions among grains and MOG.
However, the collision velocity was relatively small because
of interactions, the voltage amplitude of the secondary colli-
sion generated signal was generally less than the threshold
voltage of the voltage comparator circuit. Therefore, some
grains would not cause an effective collision, and leading to
measurement errors. Overall, the sensor has a good ability in
discriminating full grains from complex mixtures of
materials.
5. Development of monitoring mathematicalmodel
5.1. Test-bench experiments
Understanding the relationship between counted grain
numbers and the total grain sieve loss is essential for moni-
toring the grain losses in real-time. To apply a grain sieve loss
monitoring mathematical model, laboratory experiments
were carried out on a longitudinal-axial threshinge
separating-cleaning test-bench with a tangential feed. The
test-bench was made up of conveyor, a feeding stir rope, a
conveying channel, a tangential rotor, a cleaning system,
boxes to acquire cleaning outputs, and a load test system to
measure the power consumption of each rotor. The diameter
of the tangential rotor was 544 mm, and its length was
960mm, the concave arc corner of the gravure screen grid was
800. The diameter of the axial rotor was 626mm, and its length
was 1790 mm; the concave arc corner of the gravure screen
grid was 2000. The threshing component had trapezoidal
teeth. The threshing gap of the tangential rotor could be set to
15, 21 and 27mm and the threshing gap of axial rotor could be
set to 8, 14, and 20 mm. The speeds of revolution of the
tangential and axial rotors had 3 combinationswhich could be
adjusted to 893/849 rpm, 808/768 rpm and 723/687 rpm,
respectively. The schematic diagram of test-benchwas shown
in Fig. 20.
Analysis was performed to study influence of threshing
gap of tangential rotor, revolution speed of tangential rotor
and axial rotor, and threshing gap of axial rotor on power
consumption and separation loss. Experimental results
Fig. 20 e Overall design of tangential-longitudinal axial test-be
header, 3. operating system, 4. header auger, 5. motor, 6. tangen
vibrating sieve, 10. grain auger, 11. axial separating threshing
showed that the rotational speed of the rotors was the
main factor influencing power consumption and separation
loss. The combine had an optimal threshing and separation
performance when the rotational speed of the tangential
rotor was 893 rpm, the threshing gap of tangential rotor
was 21 mm, threshing gap of the longitudinal rotor was
20 mm, and rotational speed of the longitudinal rotor was
849 rpm. Properties of experimental rice used are shown in
Table 4.
Previous researches has shown that fan speed has a
paramount influence on grain sieve losses. Thus, due to
experimental limitations, the influence of fan speed on sieve
losses was mainly considered. In experiments, rice collected
from the same field as above was used. The properties of rice
are shown in Table 3. Fresh material was uniformly spread
over a conveyor surface (10 m long and 1.2 m wide) with a
feeding quantity of 7 kg s�1. It was fed into the threshing unit
using an intake chain conveyor with a constant velocity
1 m s�1, the tangential rotational speed was 893 rpm, the
tangential threshing gap was 21 mm, the longitudinal
threshing gap was 20 mm, and the longitudinal rotational
speed was 849 rpm. Fan speeds of 1200 rpm, 1300 rpm and
1400 rpmwere used by changing drivingwheels with different
diameters. In the experiment, a canvas was used to separate
outputs from the cleaning shoe and the separation shoe and
84 boxes (in a 12 � 7 matrix) were added to collect the output
from the cleaning shoes. The grains were removed from each
box used using re-cleaner (Agriculex ASC-3 Seed Cleaner,
Guelph, Ontario, Canada). Each experiment was repeated 3
times and the averaged values from each box obtained.
Cleaned grains from each box were placed on a tablecloth in
accordance with the original order as shown in Fig. 21(a). The
distribution of grain losses with a fan speed of 1200 rpm is
shown in Fig. 21(b).
nch and location of the material receiving boxes, 1. reel, 2.
tial separating threshing unit, 7. chassis, 8. cleaning fan, 9.
unit, 12. tailings auger, 13. material receiving boxes.

1.0
Fig. 21 e The distribution of grain and MOG from the outlet
of the cleaning sieve.
b i o s y s t em s e ng i n e e r i n g 1 4 7 ( 2 0 1 6 ) 5 1e6 6 63
5.2. Installed position of the sensor in X direction
The grain loss monitoring sensor was placed on the rear rack
of cleaning shoe, under the sieve. The sensor was fixed and
did not moving with the sieve. Since detecting speed of the
sensor was constant, proper grain flow in the sensor mounted
position was critical for monitoring whole grain sieve loss.
Using experimental data obtained from experiments with fan
speed of 1200, 1300, 1400 rpm, obtained grain loss distribu-
tions varying along the X axial direction shown in Fig. 22.
From Fig. 22 can be seen that in the leading segment
(x < 0.26 m), grain loss increased more rapidly and the
Fig. 22 e Distribution of loss grain along the X axis.
variation of cumulative distribution was larger and it was
more difficult to detect the grains precisely. In the trailing
segment (x > 0.52 m), the amount of grain loss was reduced,
but MOG was high, also the difficulty for a sensor to detect
grains from the massive amounts of MOG increased. In the
middle segment (0.26 < x < 0.52 m), grain flux was more
modest and stable. To monitor current grain loss accurately,
the sensor should be fixed in the middle segment with
0.26 < x < 0.52 m.
5.3. Probability distribution of the grains along the X-axis
The grain mass ratio in boxes of each column along the Y-axis
direction accumulated together got the grain mass ratio dis-
tribution along the X-axis direction. Calculated results
showed that fan speed had a slight influence on the distri-
bution of grain loss along X-axis, which means that the grain
mass ratio was nearly the same along X axis for the different
fan speeds. The probability distribution model for the grain
loss mass ratio under different fan speeds along the X-axis
can be expressed by:
sf ðxÞ ¼ A1� e�kðx�xcÞ (28)
In Eq. (28), A, xc, k are constants, nonlinear fitting carried
out using Origin 8.0 software (OriginLab Corporation, North-
ampton, MA, USA) and got A ¼ 0.99411, xc ¼ 0.06365,
k ¼ 4.92728, R2 ¼ 0.99971, nonlinear fitting result shown in
Fig. 23.
5.4. Probability distribution of grains along the Y-axis
When 0.26m < x < 0.52m, the accumulated grainmass ratio in
the boxes from each column were obtained along the X-axis
direction and the grain mass ratio distribution obtained along
the Y-axis for fan speeds of 1200, 1300 and 1400 rpm. The
probability distribution model for grain loss mass ratio under
different fan speeds along the Y-axis can be expressed by:srðyÞ ¼ Be�y=t1 þ y0 (29)
where B, y0, t1 are constants, and come from experimental
data using nonlinear fitting carried out using Origin 8.0 soft-
ware. The values obtained from the tests were y0 ¼ �7.95427,
0.0 0.2 0.4 0.6 0.8 1.0 1.2
0.1
0.2
0.3
0.4
0.5
0.6
0.7
0.8
0.9
Cum
ulat
ive
ofgr
ain
loss
mas
sra
tioin
Yax
is
Distance in X axis direction /m
Fig. 23 e Cumulative of grain mass ratio along X axis.

0.0 0.2 0.4 0.6 0.8 1.0
0.2
0.3
0.4
0.5
0.6
0.7
0.8
0.9
1.0
Cum
ulat
ive
of g
rain
loss
mas
s ra
tio in
X a
xis
Distance in Y axis direction /m
Fig. 24 e Cumulative of grain mass ratio in Y axis.
b i o s y s t em s e n g i n e e r i n g 1 4 7 ( 2 0 1 6 ) 5 1e6 664
B ¼ 8.06237, t1 ¼ �8.8689 with R2 ¼ 0.99299. The nonlinear
fitting result is shown in Fig. 24.
5.5. Monitoring the grain cleaning loss
Associated Eqs. (28) and (29), loss grains ratio in the moni-
toring area can be expressed as:
r ¼ sf ðxÞ����x0 þ a=2x0 � a=2
� srðyÞ����b
0
ð0:26< x0 <0:52Þ (30)
where, x0 was the central position ofmonitoring area; a, bwere
the length and width of the sensor. As long as x0, a and b are
Fig. 25 e Schematic diagram of monitoring method. 1.
sieve, 2. grain loss monitoring sensor.
Fig. 26 e Installation position of the se
known, the ratio between grain loss in themonitoring area and
total grain loss can be calculated according to Eq. (30), then
converted into the total cleaning grain loss in real-time. A
schematicdiagramofthemonitoringmethodisshowninFig.25.
5.6. Field experiments
To benchmark the monitoring accuracy of the developed
sensor, experimental results were obtained comparing abso-
lute sieve loss values obtained by collecting all the discharged
material and observed values measured by the developed
sensor.Thegrainsieve lossmonitoringsensorwasmountedon
a combine harvester (Model: 4LZ-3.5,Wuxi CombineHarvester
Co., Ltd,Wuxi, China), as showninFig. 26. Themachinehad the
same structural parameters as the test-bench mentioned
above. The horizontal and vertical distances between sensor
centres and sieve endwere 250mm in the installation, and the
mounting angle was 45�. According to grain sieve loss moni-
toring model shown by Eq. (30), r ¼ 0.121. The harvesting dis-
tance was 10 mwith a constant fan speed of 1300 rpm.
Before field experiments, preparatory work was carried
out. A canvas was used to separate outputs from separation
and cleaning shoes, as shown in Fig. 21, and the average grain
separation loss in 10 m was obtained following adjustment of
some parameters to ensure an optimal combination according
to test bench results and experience. The threshold voltage of
signal processing circuit was adjusted until the value dis-
played on the display instrumentwas about 1e2 grains, which
indicated that the system could overcome vibrational inter-
ference. In experiment, a piece of canvas was used to collect
all themixedmaterials at the outlets, then the full grains were
filtered out from MOG using the stationary re-cleaner (Agri-
culex ASC-3 Seed Cleaner), weight and subtracted the sepa-
ration losses. Finally, the current grain sieve losses were
calculated. Based on the sensor counting grain numbers and
the mathematical model, total sieve losses were displayed on
the instrument's display. Properties of experimental rice used
were given in Table 5. Table 6 shows an error analysis of the
nsor and image of the field tests.
Table 5 e Properties of experimental rice.
Rice varieties Nan jing46 Long jing 29
Grain moisture content (%) 31 29.8
MOG moisture content (%) 60.4 71.1
MOG/grain mass ratio 2.7 2.3
Thousand seed mass (g) 25.71 31
Grain yield (kg/hm2) 7800 8922

Table 6 e Error analysis of sieve loss obtained by the sensor compared to manual measurement.
Tests No. Forward speed m s�1 Sieve losses Relative error/%
Sensor Manual
Total amount Ratio % Total mass g Ratio %
1# 0.60 611 1.0020 149.7 0.959 4.48
0.75 671 1.1008 168.1 1.0765 2.26
1.00 778 1.2764 205.3 1.3147 2.91
2# 0.60 320 0.4412 80.6 0.4512 2.22
0.80 589 0.8121 140.2 0.7849 3.47
1.00 658 0.9081 168.7 0.9453 3.93
b i o s y s t em s e ng i n e e r i n g 1 4 7 ( 2 0 1 6 ) 5 1e6 6 65
averaged results acquired by the sensor and manually using
the same operating parameters of replicated three times. Test
1 was carried out using “Nan Jing” rice and test 2 with “Long
Jing” rice.
From Table 6 can be seen that measurement error
increased with increasing combine forward speed, but the
relative measurement error was <4.48%, which indicated that
the developed rice grain monitoring system well worked. Due
to the complexity of the cleaning process, the grain numbers
counted by the sensor was not a constant value. This was
because dropped grains may collide again with the sensitive
plate due to interaction among grains andMOG. Also, because
of the rugged ground, the combine harvester could produce
severemovements in the sensor device during field operation,
which could cause a failure of the isolation device, resulting in
large measurement errors.
Zhao, Li, Liang, and Chen (2012) who developed a grain
impact sensor utilising a polyvinylidene fluoride (PVDF)
piezoelectric-film as sensing element to monitor grain sieve
losses on a tangential-longitudinal axial combine harvester
(Model: 4LQZ-6 Foton Lovol International Heavy Industry Co.,
Ltd, China) found a large area of moist powder accumulating
on the PVDF film surface and a measurement error up to
10.6%. Li, Chen, Zhao, and Xu (2013) installed a grain sieve loss
monitoring sensor at the end of the sieve on a tangential-
longitudinal axial combine harvester (Model: 4LZ-3.5 (TH988)
Wuxi Combine Harvester Co., Ltd, China) and found a relative
measurement error up to 19.35%. Hence the values found here
indicate that the developed rice grain sieve loss monitoring
system appeared to function well.
6. Conclusion
A grain sieve loss monitoring sensor based on YT-5L
piezoelectric ceramics as the sensing element was
designed. DEM simulation results indicated that the oblique
collision process consists of four period basically: free fall-
ing, collision, rebound, and rotating; and there are distinct
differences between rice grain particles and short straws in
tr and Fn max: for rice grain, the Fn1 max was in the range
1.4 Ne8.5 N and tr1 in the range 15e34 ms; for short straw,
the Fn2 max was in the range 0.1 Ne1.2 N, tr2 was in the range
63e182 ms. Using differences in normal collision force Fn max
and force rise-time tr, a signal processing circuit which
mainly consisted of a band-pass filter circuit with corner
frequencies of 5e20 kHz and threshold value adjustable
voltage comparator circuit designed to discriminate the full
grain out was designed. The grain loss monitoring system
was mounted on a combine harvester and utilising the
mathematical model developed based on the laboratory
test-bench experiments results, field tests carried out. The
field test results indicated that the measurement errors
were <4.48%.
Acknowledgements
This research was supported by the National Natural Science
Foundation of China (51375214, 51475217), the Graduate
Innovative Projects of Jiangsu Province 2014 (KYLX_1021), Fok
Ying-Tong Education Foundation, China (Grant No. 141051)
and A Project Funded by the Priority Academic Program
Development of Jiangsu Higher Education Institutions (PADP).
Thanks for all your support.
r e f e r e n c e s
Bertrand, F., Leclaire, L. A., & Levecque, G. (2005). DEM-basedmodels for the mixing of granular materials. ChemicalEngineering Science, 60(8e9), 2517e2531.
Carter, B., & Mancini, R. (2010). Op amps for everyone. Newnes.Craessaerts, G., De Baerdemaeker, J., Missotten, B., & Saeys, W.
(2010). Fuzzy control of the cleaning process on a combineharvester. Biosystems Engineering, 106(2), 103e111.
Craessaerts, G., Saeys, W., Missotten, B., & Baerdemaeker, J. D.(2008). Identification of the cleaning process on combineharvesters. Part I: a fuzzy model for prediction of the materialother than grain (MOG) content in the grain bin. BiosystemsEngineering, 101(1), 42e49.
Craessaerts, G., Saeys, W., Missotten, B., & Baerdemaeker, J. D.(2010). Identification of the cleaning process on combineharvesters, part II: a fuzzy model for prediction of the sievelosses. Biosystems Engineering, 106(2), 97e102.
Eldredge, W. K. (1985). Grain loss indicator. United States patent,number 4490964.
Gao, J. M., Zhang, G., Yu, L., & Li, Y. B. (2011). Chaos detection ofgrain impact at combine cleaning loss sensor. Transactions ofthe CSAE, 27(9), 22e27.
Hiregoudar, S., Udhaykumar, R., Ramappa, K. T., Shreshta, B., &Medaet, V. (2011). Artificial neural network for assessment ofgrain loss for paddy combine harvester a novel approach.Control, Computation and Information Systems, 140, 221e231.
Li, J. F. (2006). Improvement design of the structure of combineharvester grain loss sensor and laboratory calibration.Agricultural Equipment & Vehicle Engineering, 11, 10e13.
b i o s y s t em s e n g i n e e r i n g 1 4 7 ( 2 0 1 6 ) 5 1e6 666
Li, Y. M., Chen, Y., Zhao, Z., & Xu, L. Z. (2013). Monitoring methodand device for cleaning loss of combine harvester. Transactionsof the CSAM, 44(s2), 7e11.
Li, H. C., Li, Y. M., Gao, F., Zhao, Z., & Xu, L. Z. (2012). CFDeDEMsimulation of material motion in air-and-screen cleaningdevice. Computers and Electronics in Agriculture, 88, 111e119.
Liu, T. X., Hua, H. X., & Zhang, Z. Y. (2004). Robust control of platevibration via active constrained layer damping. Thin-WalledStructures, 42(3), 427e448.
Liu, C., & Leonard, J. (1993). Monitoring actual grain loss from anaxial flow combine in real time. Computers and Electronics inAgriculture, 9(3), 231e242.
Loghavi, M., Ehsani, R., & Reeder, R. (2008). Development of aportable grain mass flow sensor test rig. Computers andElectronics in Agriculture, 61(2), 160e168.
Mcgechan, M. B. (1982). The benefit of different speed controlsystem for combine harvester. Agricultural EngineeringResearch, 27, 163e174.
Lenaerts, B., Missotten, B., Baerdemaeker, J. D., & Saeys, W. (2012).LiDaR sensing to monitor straw output quality of a combineharvester. Computers and Electronics in Agriculture, 85(6), 40e44.
Mouazen, A. M., Anthonis, J., & Saeys, W. (2004). An automaticdepth control system for online measurement of spatialvariation in soil compaction, part 1: sensor design formeasurement of frame height variation from soil surface.Biosystems Engineering, 89(2), 139e150.
Nakra, B. C. (1998). Vibration control in machines and structuresusing viscoelastic damping. Journal of Sound & Vibration, 211(3),449e466.
Ni, J., Mao, H. P., & Tian, Y. C. (2011). Design and experimentationof sensitive element of piezoelectric crystal sensor array forgrain cleaning loss. African Journal of Biotechnology, 10(36),6913e6919.
Omid, M., Lashgari, M., & Mobli, H. (2010). Design of fuzzy logiccontrol system incorporating human expert knowledge forcombine harvester. Expert Systems with Applications, 37(10),7080e7085.
Osselaere, G. H. (1985). Offset grain loss sensor for combineharvesters. United States patent, number 4540003.
Pan, X. Y., Shangguan, W. B., Chai, G. Z., & Huang, Z. (2009). Aninvestigation of calculation methods for the dynamiccharacteristics of rubber isolator. Journal of VibrationEngineering, 22(4), 345e351.
Qiao, Z. X. (1992). Studies on characteristics of material mechanicsof rice grains. Acta Agriculturae Universitis Jiangxiensis, 14, 1e9.
Reyns, P., Missotten, B., Ramon, H., & Baerdemaeker, J. D. (2002). Areview of combine sensors for precision farming. PrecisionAgriculture, 3(2), 169e182.
Sakaguchi, E., Suzuki, M., & Favier, J. F. (2001). Numericalsimulation of the shaking separation of paddy and brown riceusing the discrete element method. Journal of AgriculturalEngineering Research, 79(3), 307e315.
Sciulli, D., & Inman, D. J. (1998). Isolation design for a flexiblesystem. Journal of Sound and Vibration, 216(3), 251e267.
Sommerfeld, M. (2002). Kinetic simulations for analysing the wallcollision process of non-spherical particles. Proceedings ofASME, Fluids Engineering Division, 539e547.
Song,G., Gu,H.,Mo, Y. L., Hsu, T. T. C.,&Dhonde,H. (2007). Concretestructural healthmonitoring using embedded piezoceramictransducers. Smart Materials and Structures, 16(4), 959e968.
Vu-Quoc, L., & Zhang, X. (1999). An accurate and ancienttangential force displacement model for elastic frictionalcontact in particle-flow simulations. Mechanics of Materials,31(4), 235e269.
Wang, T., Wang, X. D., & Wang, L. D. (2009). Study on fastresponse characteristic and application of piezoceramics.Chinese Journal of Sensors and Actuators, 22(6), 785e789.
Wojtkowski, M., Pecen, J., Horabik, J., & Molenda, M. (2010).Rapeseed impact against a flat surface: physical testing andDEM simulation with two contact models. Powder Technology,198(1), 61e68.
Wynn, E. J. W. (2009). Simulations of rebound of an elasticellipsoid colliding with a plane. Powder Technology, 196(1),62e73.
Xu, L. Z., & Li, Y. M. (2009). Critical speed of impact damage on arice kernel. Transactions of the Chinese Society for AgriculturalEngineering, 40(8), 54e57.
Yang, M. J., Yang, L., & Li, Q. D. (2009). Simple measurement ofrestitution coefficient of granular material and its application.Journal of Agricultural Mechanization Research, 31, 25e27.
Zhang, H. X., Li, D. Y., & Yang, X. S. (2006). Research on shearproperties of brown rice grain. Journal of Heilongjiang AugustFirst Land Reclamation University, 18, 46e49.
Zhao, Z., Li, Y. M., Liang, Z. W., & Chen, Y. (2012). Optimum designof grain impact sensor utilizing polyvinylidene fluoride filmsand a floating raft damping structure. Biosystems Engineering,112(3), 227e235.
Zhou, L. M., Zhang, X., Liu, C. Y., & Yuan, Y. W. (2010). Design ofPVDF sensor array for grain loss measuring. Transactions of theChinese Society for Agricultural Machinery, 41(6), 167e171.