Embed Size (px)
Citation preview
Seediscussions,stats,andauthorprofilesforthispublicationat:https://www.researchgate.net/publication/321150853
Sensitivityofdopingbiomarkersafteradministrationofasingledosetestosteronegel
ArticleinDrugTestingandAnalysis·November2017
DOI:10.1002/dta.2341
CITATIONS
0
READS
38
8authors,including:
JennyJSchulze
KarolinskaInstitutet
34PUBLICATIONS761CITATIONS
SEEPROFILE
AndersRane
KarolinskaUniversityHospital
449PUBLICATIONS14,888CITATIONS
SEEPROFILE
MikaelLehtihet
KarolinskaInstitutet
50PUBLICATIONS574CITATIONS
SEEPROFILE
LenaEkström
KarolinskaInstitutet
74PUBLICATIONS1,326CITATIONS
SEEPROFILE
AllcontentfollowingthispagewasuploadedbyAndersRaneon21December2017.
Theuserhasrequestedenhancementofthedownloadedfile.

This article has been accepted for publication and undergone full peer review but has not been through the copyediting, typesetting, pagination and proofreading process which may lead to differences between this version and the Version of Record. Please cite this article as doi: 10.1002/dta.2341
This article is protected by copyright. All rights reserved.
Sensitivity of doping biomarkers after administration of a single dose testosterone gel
Jenny Mullen1, Annica Börjesson
1,2, Oscar Hopcraft
2, Jenny J Schulze
1, Magnus Ericsson
1,2,
Anders Rane1, Mikael Lehtihet
3, Lena Ekström
1
1. Department of Laboratory Medicine, Division of Clinical Pharmacology, Karolinska
Institutet at Huddinge
2. Department of Clinical Pharmacology, Karolinska University Hospital
3. Department of Endocrinology, Metabolism and Diabetes, Departments of Medicine
and Molecular Medicine and Surgery, Karolinska Institutet at Karolinska University
Hospital, S-141 86 Stockholm, Sweden
Keywords: doping in sports, testosterone, testosterone gel, athlete biological passport, IRMS,
miR-122, steroid profile

This article is protected by copyright. All rights reserved.
Abstract Micro-doping with testosterone (T) is challenging to detect with the current doping tests.
Today, the methods available to detect T are longitudinally monitoring of urine biomarkers in
the Athlete Biological Passport (ABP) and measuring the isotopic composition of excreted
biomarkers to distinguish the origin of the molecule. In this study, we investigated the
detectability of a single dose of 100 mg T gel in 8 healthy male subjects. We also studied
which biomarkers were most sensitive to T gel administration, including blood biomarkers.
The ABP successfully detected T gel administration in all 8 subjects. The most sensitive ratio
was 5αAdiol/E, however, also T/E and 5αAdiol/5βAdiol showed atypical findings. IRMS was
performed on 5 subjects and only two met all the criteria for a positive test according to the
rules set by WADA. The other three showed inconclusive results. Other markers that were
affected by T gel administration, not used for this detection today, were serum
dihydrotestosterone (DHT) and T as well as reticulocyte count and percentage in whole
blood. miRNA-122 was not significantly affected by the single T dose. A single dose of 100
mg T gel is possible to detect with today‟s doping tests. Since a single dose of T gel has an
impact on some hematological biomarkers, access to both modules of the ABP when
evaluating the athletes‟ profiles will increase the possibility to detect micro-doses of T. In
addition, serum DHT and T may be a useful addition to the future endocrine module of the
biological passport.
Introduction Detecting doping with low doses of testosterone (T) has been and remains a challenge. T
doping presents a bigger challenge as compared to doping with its analogous synthetics
(anabolic androgenic steroids) since T is naturally present in the body. There are a variety of
administration routes for T and T gel has become increasingly popular when treating T
deficiency in hypogonadal men1. As a doping agent T gel is hard to detect since the doses
absorbed are low and the even diffusion through the skin results in low peak concentrations.
To further complicate the detection T gel is often administered with short and even intervals
resulting in relatively stable steroid concentrations.
To detect T doping, urine samples are used for analyses of certain androgen metabolites with
gas chromatography mass spectrometry (GC/MS or GC-MS/MS)2. The biomarkers are T,
epitestosterone (E), 5α-androstane-3α,17β-diol (5αAdiol), 5β-androstane-3α,17β-diol
(5βAdiol), androsterone (A) and etiocholanolone (Etio). E is an isomer of T that has no
known biologic activity whereas 5αAdiol, 5βAdiol, A and Etio are products of the phase I
metabolism of T. It is the glucuronidated conjugates of these steroids, in addition to the free,
that are detected after hydrolysis with β-glucuronidase. These metabolites are then combined
into ratios that are shown to be more stable and more sensitive to doping than the individual
concentrations3,4
. The ratios measured are T/E, A/Etio, 5αAdiol/E, 5αAdiol/5βAdiol and A/T.
These ratios are added to the Athlete Biological Passport (ABP) software to be longitudinally
evaluated. If the test results are outside the individual‟s reference limits, this results in an
atypical passport finding (ATPF) and the sample will be subject to confirmation. The
confirmation is a quantification with GC-MS/MS and 13
C/12
C measurement by isotope ratio
mass spectrometry (IRMS)5. The IRMS measures the isotopic composition of steroids and

This article is protected by copyright. All rights reserved.
can distinguish between exogenous and endogenous steroids as long as their isotopic
composition differs6.
There are large inter-individual variations in the disposition of androgenic steroids.
Presumably, the most important etiology of these variations are genetic polymorphisms. The
vast majority of the androgens are excreted in the kidneys after conjugation with glucuronic
acid by the Uridine Glucuronosyl Transferase (UGT) enzymes. In vitro and in vivo studies
have shown that UGT2B17 is the main UGT catalyst of testosterone conjugation7,8
. We have
previously described the concordance between the UGT2B17 deletion polymorphism and the
urinary excretion of testosterone9. Individuals devoid of the UGT2B17 gene display lower
T/E ratios than those with one or two insertion polymorphism 8,10
, and after administration of
testosterone these individuals rarely reach a T/E ratio above 4 11,12,13
.
It is known that transdermal administration of T gel causes an increase in serum T and
dihydrotestosterone (DHT), markers that have been suggested for longitudinal monitoring in
a blood steroid profile14
. Other serum hormones found to be good markers for exogenous T
are 17α-hydroxyprogesterone (17OHP), luteinizing hormone (LH), and particularly the ratios
T/17OHP and T/LH3,15
. However, 17OHP has not been studied after topical administration of
T.
In addition to the steroidal module, the ABP also includes a hematological module. Today,
these modules are independently used. We have previously shown that markers used in the
hematological module can be affected by T doping16
. Other useful indirect markers may
include genetic biomarkers such as circulatory microRNA (miRNA)17
. A recent study
investigated different miRNAs as possible biomarkers for detecting T doping and showed
that miR-122 increased after transdermal T administration from commercially available
patches18
.
The aim of this study was to investigate if a single dose of T gel can be detected by ABP and
IRMS analyses. In addition to the conventional biomarkers, we also studied different
hormonal, hematological and miRNA biomarkers, to determine which ones are sensitive to
detect doping with T gel.
Materials and methods
Study population and design Eight healthy men were recruited for the study, they did not have any chronic diseases and
were not taking any other hormonal drugs during the study. The men were between the ages
of 29-46 (median 36) years and had serum T levels within the normal range (13-25 nmol/L).
Control urine samples were collected in the morning on three consecutive days before the
application of T gel. The subjects also volunteered to provide fasting blood samples in the
morning before the administration. The T gel used was Testogel® (Bayer) containing 1 % T
(10 mg/g) and the subjects were given two sachets of 5 g each giving them a T dose of 100
mg. With a bioavailability of about 10 %19
, the dose absorbed is approximately 10 mg. This
one-time dose was applied in a standardized way on the subjects‟ shoulders and abdomen by
a study nurse. Urine was then collected after 12, 24, 36 and 48 hours, and blood samples were
collected after 24 and 48 hours. All participants gave informed consent and the study was
approved by the Ethics Review Board in Stockholm.

This article is protected by copyright. All rights reserved.
Genotyping DNA was extracted from whole blood using QIAamp® DNA Blood Mini kit (Qiagen). To
determine the copy number of UGT2B17 real-time PCR was used as previously described20
.
Triplicates of the purified DNA were used and albumin was used as internal control21
.
Steroid measurements The urinary steroid profile was obtained by GC-MS/MS as previously described by Mullen et
al22
. This method involved hydrolysis with β-glucuronidase and consequently, it was only the
glucuronidated and free steroids that were measured. The method is a validated screening
method of the World Anti-Doping Agency (WADA) accredited Doping Control Laboratory
in Stockholm, Sweden. Specific gravity was measured using a Digital Urine SG
Refractometer (ATAGO UG1, Tokyo Japan) to adjust for different urine dilutions.
The serum samples were sent for analysis to the Department of Clinical Chemistry,
Karolinska University Hospital where they used routine methods to determine concentrations
of follicle stimulating hormone (FSH), T, LH, 17-OH progesterone (17OHP) and DHT. FSH
and T were measured by an immunochemical method on a Roche Cobas e602 after
preparation with Elecsys FSH reagent kit (Roche) or Elecsys® Testosterone II (Roche). LH
was measured with AutoDELFIA using a AutoDELFIA hLH Spec kit from Perkin Elmer.
17OHP and DHT were measured with HPLC-MS/MS (Quattro Premier Alt Xevo TQ from
Water) with a Ocquity UPLC HSS T3, 1.8 μm 2.1x150 mm column using positive
electrospray. The whole blood samples (EDTA tubes) collected simultaneously with the
serum samples were analyzed for hematological parameters (reticulocytes and red blood cells
presented) with a hematology-Sysmex XN-1000 system at the Doping Control Laboratory.
All steroids measured were within the validated linear range of the corresponding method.
miR-122 measurement Total RNA was extracted from each serum sample using the QIAGEN miRNeasy®
Serum/Plasma kit (Hilden, Germany) following the protocol in the kit handbook (QIAGEN®,
2012). The RNA concentrations were measured using a NanoDrop™ spectrophotometer
(ND-1000, ThermoFisher Scientific, MA, USA) and the samples were stored at -80°C until
further analysis. Using a volume corresponding to 10-20 ng total RNA, cDNA synthesis was
performed using the TaqMan® Advanced miRNA cDNA Synthesis Kit (AB Applied
Biosystems®, CA, USA) according to the guidelines provided by the user guide (Thermo
Fisher Scientific Inc., 2016).
Samples were analyzed in duplicates with real-time PCR according to the TaqMan®
Advanced miRNA Assays user guide (AB Applied Biosystems®, 2016) with miR-26b as
endogenous control. The miRNA assays used were hsa-miR-122-5p and hsa-miR-26b-5p
(Life technologies, ID#477855_mir and ID#478418_mir, respectively). The real-time PCR
instrument (7500 Real-Time PCR Systems, AB Applied Biosystems®) was set to hold 50°C
for 20 s then 95°C for 10 min following cycling steps (x40) of 95°C for 15 s and 60°C for 1
min. The CT-value from the rtPCR was used to calculate the relative changes in miR-122
expression using the 2-ΔΔCT
method23
.

This article is protected by copyright. All rights reserved.
Athlete Biological Passport A research version of the ABP was used to evaluate the longitudinal profiles of the urinary
steroids (Swiss Laboratory for Doping Analyses, Epalinges, Switzerland). Each urine
sample‟s concentrations of T, E, A, Etio, 5αAdiol and 5βAdiol as well as the specific gravity
were entered for each study subject. The three samples taken prior to the T gel administration
were used as baseline values (samples 1-3) The threshold values calculated by the software
on sample number 4 (i.e. after three baseline samples) are considered the study subject's true
individual threshold. The thresholds calculated for samples 5-7 may be influenced by the T
gel administration. The 5αAdiol/E ratio is not included in the research version of the ABP.
Here, the standard deviation (SD) for 5αAdiol/E ratio was calculated for the three baseline
samples. The ratio after the T-gel administration was then considered to generate an ATPF if
the ratio differed >3 SD from the baseline ratio24,25
.
Isotope ratio mass spectrometry (IRMS) The carbon isotopic composition of androgens in urine was determined according to the GC-
C-IRMS standard operating procedures of the Doping Control Laboratory in Stockholm,
Sweden. In short, this screening procedure includes a solid phase extraction on C18 columns
and two liquid-liquid extractions – one prior to hydrolysis with β-glucuronidase and another
one after. The samples were then further purified and separated into fractions with high-
performance liquid chromatography (HPLC). The purified samples were injected to the GC-
C-IRMS where the 13
C/12
C ratio of T, 5αAdiol, 5βAdiol, A, Etio and pregnanediol (PD) were
measured (expressed as δ13
C-values) by comparing to a reference standard material. The
method was described in full by Strahm et al11
but has since been modified as follows:
fractions 2 (T), 3 (5βAdiol) and 4 (5αAdiol) were subject to a second HPLC purification step.
These fractions were pooled in the first HPLC, dried and reconstituted in acetonitrile (ACN)
and water (50:50, v/v) before injected to the HPLC again. The HPLC system used was the
same as described by Strahm et al. (Agilent 1100 with a Lichrospher RP-18 column) but the
gradient was different. Water and ACN were once more used as mobile phases but with
initial conditions water:ACN 95:5. Over 1 min ACN was increased linearly to 35 % then held
for 30 min followed by a wash with 100 % ACN for 4 min. Last was a reconditioning step of
95:5 for 7 min. The flow rate, injection volume and detector settings were the same as
previously described (1.0 mL/min, 50µL and 195mn respectively). The three fractions
collected were then dried and reconstituted in ethyl acetate from Merck (Darmstadt,
Germany) to make a concentration of approximately 20 µg/mL. The GC column of the GC-
C-IRMS was changed to a DB5ms (60 m x 0.25 mm i.d., 0.25 µm film thickness) from
Agilent (Santa Clara, CA, USA). The GC method used in this study started at 40˚C with a
hold for 2 min followed by an increase to 255˚C at 200˚C/min and held for 1 min. Next, the
temperature was increased 0.8˚C/min to 269˚C. Lastly, the temperature was increased to
325˚C at a rate of 100˚C/min and then held for 4 min. All fractions prepared were, in addition
to being injected to the GC-C-IRMS, checked for their purity by GC/MS with the same GC-
method described above. The steroid isotopic standard used with traceable isotope ratios was
changed to USADA 34-1 containing PD, Etio and A; from NMI (Sydney, Australia)26
.

This article is protected by copyright. All rights reserved.
In addition to performing IRMS on the collected urine samples, the δ13
C-value of the
Testogel® was also measured. 20 mg of the testosterone gel was mixed with 3 mL of water
followed by an extraction with 5 mL of methyl tert-butyl ether. The ether phase was
evaporated to dryness at 60˚C under a stream of nitrogen gas and reconstituted in 100 µL of
ACN and water 50:50. The solution was injected to the HPLC, using the same program as
described above. The collected HPLC fraction was evaporated to dryness and dissolved in
ethylacetate before injection to GC/C/IRMS. GC-MS was used to check the purity and the
analysis showed no apparent interferences and a pure testosterone peak.
Statistical analyses Statistical analyses were performed using GraphPrism Software version 6 from GraphPad
(San Diego, CA, USA). Non-parametric tests were consistently used throughout the study
because of relatively few data points and the fact that urinary steroid metabolites do not
typically show normal distribution. If nothing else is stated, Friedman test has been used to
compare multiple columns followed by Dunn‟s Multiple comparison test to determine what
columns that differ significantly. Differences were considered significant at the level p < 0.05
(2-sided test).
Results
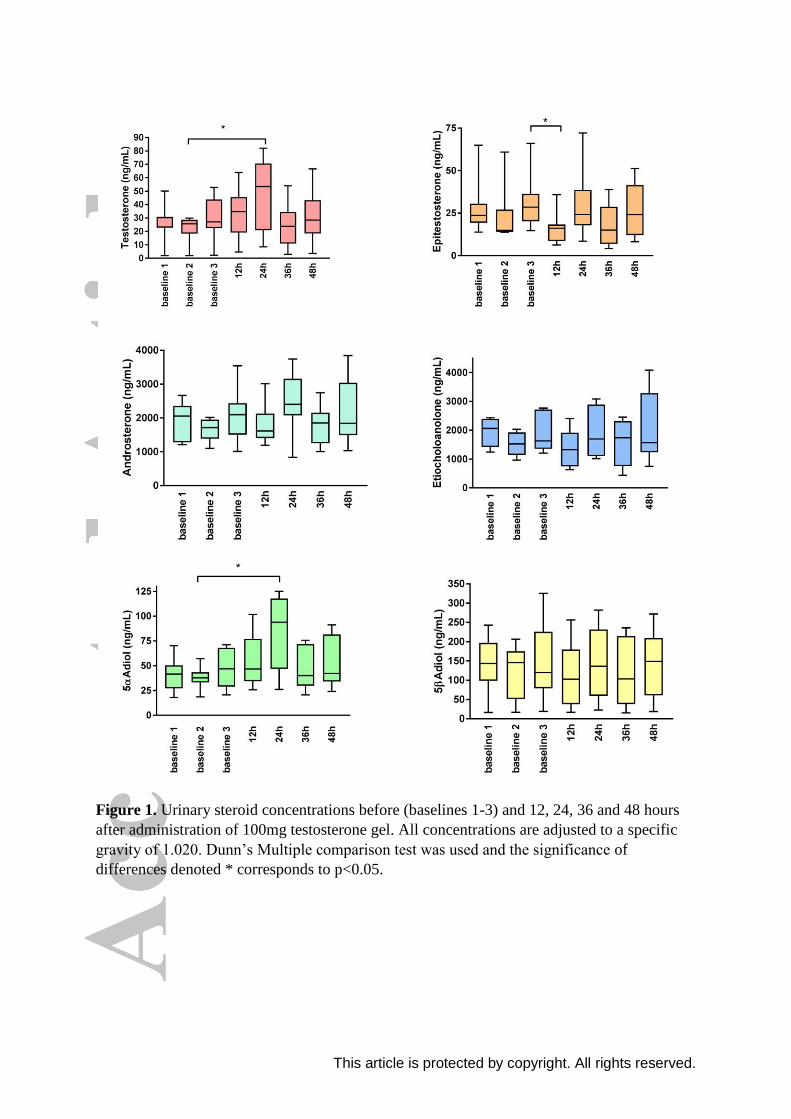
Urinary steroid profile After adjusting for a specific gravity of 1.020, urinary levels of T and 5αAdiol showed
significant increases 12 and 24 hours after 100 mg T gel application, whereas E was
decreased after 12 hours (Figure 1, p-values 0.039, 0.023, and 0.0078, respectively).
However, these significances could not be seen for each of the baseline values and when an
average of the baseline values was used only E remained significant (at 12h, p = 0.0078). On
the other hand, when looking at the ratios, all five (T/E, 5αAdiol/5βAdiol, A/Etio, A/T and
5αAdiol/E) were significantly changed with the administration of T gel on a level of p ≤
0.001, even when compared to average baseline ratios (Figure 2).
Athlete Biological Passport Even though only one subject reached the population based cut-off limit of T/E > 4
2, all
individuals showed an atypical steroid passport after a single T gel dose. Table 1 shows what
ratios were atypical, for each individual, at which time. The most sensitive ratios to T gel
administration were 5αAdiol/E followed by T/E and 5αAdiol/5βAdiol. The A/Etio and A/T
ratios also showed abnormalities in some individuals. One subject (Subject 8 in Table 2)
provided only two baseline values and only one atypical profile (5αAdiol/E). However, he
would most likely have had more abnormal profiles if one more baseline value had been
added. Another subject (Subject 5) was identified as a double deletion carrier of the
UGT2B17 gene. The T/E profile for this individual was atypical even though his T/E ratio
only reached 0.36 at the most (Figure 3B). In fact, this individual showed abnormal steroid
profiles for four of the five measured ratios (Table 2, subject 5). Figures 3A and C show the
T/E profiles for two insertion carriers of UGT2B17 (Subject 1 and 6 in Table 2, respectively).
Isotopic composition of steroids Of the five subjects analyzed with IRMS only two tested positive according to the sets of
criteria described in the WADA technical document (TD2016IRMS)5. However, all subjects
did show inconclusive results meaning they met part of at least one criteria. The endogenous

This article is protected by copyright. All rights reserved.
reference compound (ERC) used, PD, remained stable after administration of T gel with an
average SD of 0.29 ‰. The δ13C-value of PD for our subjects ranged between -25.3 to -23.4
‰. The T in the Testogel® sachets had a δ13C-value of -29.6 ‰ and the purity of the peak
was measured to 99%. Presented in Figure 4 are all target compounds compared to the ERC
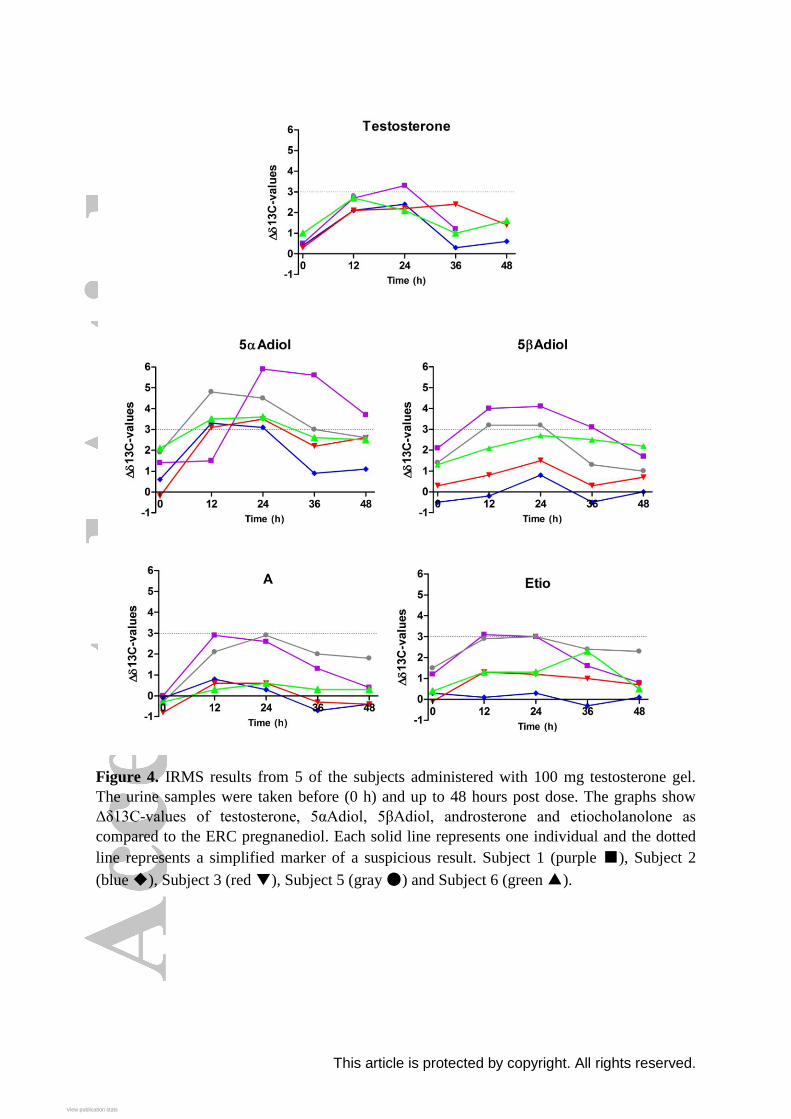
expressed as Δδ13C-values. Best target compound for detecting administration with T gel by
IRMS analysis was 5αAdiol. All subjects showed Δδ13C-values of the ERC-5αAdiol pair
greater than 3 ‰ and one subject got up to as high as 5.9 ‰ (Subject 1). Next to 5αAdiol,
5βAdiol was the best marker, although the Δδ13C-values only reached 3 ‰ for two of the
subjects.
Blood biomarkers Of those studied, the best serum biomarker for T gel detection was DHT (Table 1). Serum
DHT increased more than 2-fold 24 hours after administration, whereas T increased 0.5-fold
on average. One individual did not show any increase in T but had a 33 % increase in his
DHT levels 24 hours post administration. Additionally, both reticulocyte percentage (RET
%) and reticulocyte count (RET#) increased significantly. In contrast to DHT and T, they
showed highest values 48 hours after administration. The other serum biomarkers measured
(LH, FSH, 17-OHP and RBC) were not affected by the administration of 100 mg T gel (Table
1).
miR-122 To study the utility of miR-122 as a biomarker for T administration we calculated the relative
expression levels using miR-26b as endogenous control. The CT-values of the control miRNA
were not affected by T application (data not shown). There were no differences in relative
miR-122 levels between day 0 (median 0.30, IQR 0.09-1.01), day 1 (median 0.27, IQR 0.07-
0.57) or day 3 (median 0.50, IQR 0.09-0.78), p=0.93 with Friedman test.
Discussion However challenging, our results show that it is possible to detect micro-doping with T gel
after already one single dose. The ABP showed an ATPF in all our subjects after 100 mg T
gel. Of five subjects analyzed with IRMS, two tested positive, whereas the others showed
inconclusive results. The likelihood of detecting doping with T gel depends on the time
between the application and the urine collection as well as on how many samples are already
included in the athlete‟s passport. It is most likely also due to the individual‟s metabolism of
T as well as the carbon isotopic ratio of the T preparation6,27
and the food that the athlete has
consumed28
. To further increase the challenge, low dose T gel can be administered daily and
diffuses into the blood evenly, avoiding large concentration peaks. Athletes recurrently taken
T gel could easily be mistaken as individuals with naturally high levels of biomarkers.
For the ABP, the most sensitive ratio was 5αAdiol/E but also T/E and 5αAdiol/5βAdiol are
good biomarkers for this detection (Table 1, Figure 2). The increase of these ratios following
T gel administration is due to increased concentrations of 5αAdiol and T as well as decreased
concentratons of E. It has previously been shown that the 5α-metabolites (i.e. 5αAdiol and A)
are affected more than the 5β-metabolites (e.i. 5βAdiol and Etio) after topical T application29
.
This is likely due to the high levels of 5α-reductase in the skin30
, converting T at the 5α-

This article is protected by copyright. All rights reserved.
position, favoring that route of metabolism. Indeed, we show that 5αAdiol and A are affected
more than 5βAdiol and Etio by a single dose of T gel, as proven by significant increases in
the 5αAdiol/5βAdiol and A/Etio ratios.
The results show that it was also one of the 5α-metabolites, namely 5αAdiol, that was the best
target compound for T gel detection by IRMS. This is in agreement with other studies
investigating detectability of T gel by IRMS in healthy individuals, where primarily 5αAdiol
and then T were shown to be the most sensitive target compounds (TC)29,31,32
. In contrast, we
have shown that when administrating T through injection 5βAdiol as well as T were the best
TCs for IRMS analysis11
.
One of the individuals who tested positive in the IRMS according to the WADA rules did
fulfill 4 of 6 sets of criteria for exogenous T use5. Three sets all included the criteria of ERC-
5αAdiols > 3 ‰, one of them coupled with ERC-T > 3 ‰, another one with ERC-5βAdiol >
3 ‰ and the last one ERC-Etio > 3 ‰ (Positive criteria i, ii and v in TD2016IRMS,
respectively). The last criteria that was fulfilled includes ERC-5αAdiols > 4 ‰ in
combination with 5αAdiols ≤ -27 ‰ (criteria vi). The other subject with a positive IRMS
result fulfilled criteria ii, v and vi but not i (TC-T > 3 ‰), since his T levels were in most
cases too low to measure (UGT2B17 del/del subject). All the above mentioned sets of criteria
were inconclusive for all other tested individuals due to ERC-5αAdiols > 3 ‰ or 5αAdiol ≤ -
27 ‰. This study shows that the ABP is sensitive at detecting use of T gel while IRMS may
not always confirm doping, at least not for a one-time dose. While ABP is an excellent tool to
find suspicious test results, IRMS is in most cases needed to confirm the results.
The endogenous reference compound, PD was stable after T administration with an average
SD of 0.29 ‰. The PD-values were relatively low (δ13C-value of -25.3 to -23.7 ‰) but
consistent with normal PD-values of Swedes. The diet in northern Europe is rich in C3 plants
which in turn have low 13C-composition. One subject had a PD δ13C-value closer to -25 ‰
whereas the others were closer to -24 ‰ possibly due to a diet rich in soy28
. The low PD-
values makes the gel even harder to detect with IRMS since the isotopic composition of the
gel (δ13C-value of -29.6 ‰) is closer to these low PD-values. It is possible that this study
would have yielded more positive IRMS results in a different group from another geographic
area33,34
. We suggest an addition of another set of criteria for positive IRMS results that can
aid detection of T in countries with naturally low PD values. We propose that δ13C-values of
T below -27 ‰ in combination with a δ13C-values of PD above -25 ‰ should yield a
positive IRMS result.
The measured δ13C-value for the Testogel® of -29.6 ‰ is close to previous analysis by
Brooker et al who measured the same gel to -29.2 ± 0.5 ‰6. This is lower than carbon
isotope ratios reported for endogenous steroids (i.e. δ13C ≥ -25.8 ‰)6. However, the
existence of black market T preparations with δ13C-value within the normal range have been
reported6,27,35
. Even though there is a spread in the Δδ13C values of the ERC-TC pairs among
the subjects before administration of the gel, it is within the normal variation reported in a
German population32
. All values are within mean ± 2SD as reported by Piper et al, except for
two values that are within 3SD.
In addition to the urine biomarkers used today, this study shows that serum DHT is a
promising biomarker to detect doping with T gel. Serum DHT more than doubled after just
one dose of T gel and urine DHT also increased about 2-fold (data not shown). Serum T also
This article is protected by copyright. All rights reserved.
increased but only by about 50 %. Serum DHT, as well as T, has previously been proposed as
good markers for T patch detection by Ponzetto et al. who showed serum T and DHT to be
better markers than urinary T/E ratio, even when monitored longitudinally14
. In addition,
ratios between serum T and 17OHP have been shown to be sensitive to oral administration of
T as serum T increased while 17OHP decreased3. In this study, 17OHP did not change, likely
due to the low dose of T, but could still serve as a good denominator in a ratio with T or DHT
as numerators. LH is another candidate for a denominator.
In fact, one individual (Subject 6, Fig 3C) only returned an ATPF for 5αAdiol/E while the
T/E ratio was completely stable. This individual, however, doubled his serum T and DHT
concentrations as well as the DHT/17OHP ratio. Another individual (Subject 2) showed the
opposite results, his ABP showed an atypical finding for three of four ratios but the serum
levels were not changed. This was also seen in another study where some subjects‟ serum T
were not elevated even after 6 weeks of continuous T gel treatment29
. These results suggest
that a mix of urinary and serum biomarkers may increase the sensitivity for T detection. It
should be further investigated whether serum T and DHT, possibly as ratios over 17OHP
and/or LH, would be relevant biomarkers for inclusion in the endocrine module of the ABP.
There are several advantages to adding serum biomarkers to the steroid profile. Firstly, the
urine matrix has more confounding factors influencing the results, such as bacterial
contamination, as well as enzymatic induction/inhibition and genetic variability in Phase II
enzymes36
. Secondly, the total concentration of androgens can be measured in serum as
compared to just the glucuronidated and free fractions measured in urine today, making a
huge impact for those individuals devoid of the enzyme responsible for the glucuronidation
of T12
. Lastly, serum samples are more difficult to manipulate.
Notably, the reticulocytes, measured both as percentage and total count, were significantly
increased 22 and 28 % after just one single dose T gel. This increase is small enough to
“disappear” within the normal intra-individual variation of RET, however, it is notable that
any increase at all can be seen with such a low single dose. It is possible that this increase
may enhance the oxygen-carrying capacity which ultimately leads to enhanced endurance
performance and recovery. Today the biomarkers used in the different modules of the ABP
are separated. Many steroid Athlete Passport Management Units (APMUs) do not have
access to the hematological profiles for the athletes. In this study and in our previous work,
we show that biomarkers from the hematological module very well can be used to improve
the detection of T doping and stress the importance for the APMUs and experts to also have
access to the hematological profile (if any) when evaluating steroid passports.
Based on our results, it appears that miR-122 may not be a good biomarker for T gel abuse.
We were not able to duplicate the findings of Salamin et al. that circulatory miR-122 levels
increase 48 hours after use of topical T18
. The reason for this discrepancy may be
pharmacokinetic differences between the two administration routes, i.e. patches and gel, or
methodological issues such as the use of different control miRNAs. A major concern using
circulating miRNAs as biomarkers is to identify an appropriate reference miRNA that does
not fluctuate too much inter- and intra-individually and is not affected by exercise, diseases,
drug use etc. To overcome this problem Salamin et al. used spiked miRNAs as a control for
extraction efficiency. However, the endogenous control used in this study, miR-26b, was
recommended by the supplier37
and it was not affected by the T application. It has been

This article is protected by copyright. All rights reserved.
proposed that the combination of endogenous and exogenous controls will reassure the
sample quality and recovery rates, respectively38
. More miRNA studies in relation to T
administration are needed to evaluate miRNAs as possible biomarkers, but also other doping
agents are of interest since studies have found alterations in different miRNAs after the
administration of erythropoiesis-stimulating agents, autologous blood transfusion, and
rhGH39-41
.
In conclusion, ABP could detect a single dose of T gel in all of the subjects when three
baseline values were present. On the other hand, IRMS only showed positive in 40 % of the
samples investigated. In addition, serum hormones, such as DHT, should be further
investigated as possible complementary biomarkers in longitudinal testing.
Acknowledgements We gratefully acknowledge The Swedish Research Council for Sport Science (CIF) for
financing this study.
References [1] A. Aydogdu,R. S. Swerdloff. Emerging medication for the treatment of male hypogonadism. Expert Opin Emerg Drugs, 2016, 21, 255-266. [2] Wada. WADA Technical Document-TD2016EAAS. Available at: https://wada-main-prod.s3.amazonaws.com/resources/files/wada-td2016eaas-eaas-measurement-and-reporting-en.pdf, 2016. [3] E. Palonek, C. Gottlieb, M. Garle, I. Bjorkhem,K. Carlstrom. Serum and urinary markers of exogenous testosterone administration. J Steroid Biochem Mol Biol, 1995, 55, 121-127. [4] P. Van Renterghem, P. Van Eenoo, H. Geyer, W. Schanzer,F. T. Delbeke. Reference ranges for urinary concentrations and ratios of endogenous steroids, which can be used as markers for steroid misuse, in a Caucasian population of athletes. Steroids, 2010, 75, 154-163. [5] Wada. WADA Technical Document-TD2016IRMS. Available at: https://www.wada-ama.org/sites/default/files/resources/files/wada-td2016irms-detection_synthetic_forms_eaas_by_irms-en.pdf, 2016. [6] L. Brooker, A. Cawley, J. Drury, C. Edey, N. Hasick,C. Goebel. Stable carbon isotope ratio profiling of illicit testosterone preparations--domestic and international seizures. Drug Test Anal, 2014, 6, 996-1001. [7] T. Sten, M. Kurkela, T. Kuuranne, A. Leinonen,M. Finel. UDP-glucuronosyltransferases in conjugation of 5alpha- and 5beta-androstane steroids. Drug Metab Dispos, 2009, 37, 2221-2227. [8] J. Jakobsson, L. Ekstrom, N. Inotsume, M. Garle, M. Lorentzon, C. Ohlsson, H. K. Roh, K. Carlstrom,A. Rane. Large differences in testosterone excretion in Korean and Swedish men are strongly associated with a UDP-glucuronosyl transferase 2B17 polymorphism. J Clin Endocrinol Metab, 2006, 91, 687-693. [9] W. Wilson, 3rd, F. Pardo-Manuel De Villena, B. D. Lyn-Cook, P. K. Chatterjee, T. A. Bell, D. A. Detwiler, R. C. Gilmore, I. C. Valladeras, C. C. Wright, D. W. Threadgill,D. J. Grant. Characterization of a common deletion polymorphism of the UGT2B17 gene linked to UGT2B15. Genomics, 2004, 84, 707-714. [10] P. Martin-Escudero, J. Munoz-Guerra, N. Del Prado, M. Galindo Canales, M. Fuentes Ferrer, S. Vargas, A. B. Soldevilla, E. Serrano-Garde, F. Miguel-Tobal, M. Maestro De Las Casas,C. Fernandez-Perez. Impact of UGT2B17 gene deletion on the steroid profile of an athlete. Physiol Rep, 2015, 3.

This article is protected by copyright. All rights reserved.
[11] E. Strahm, J. E. Mullen, N. Garevik, M. Ericsson, J. J. Schulze, A. Rane,L. Ekstrom. Dose-dependent testosterone sensitivity of the steroidal passport and GC-C-IRMS analysis in relation to the UGT2B17 deletion polymorphism. Drug Test Anal, 2015, 7, 1063-1070. [12] J. J. Schulze, J. Lundmark, M. Garle, I. Skilving, L. Ekstrom,A. Rane. Doping test results dependent on genotype of uridine diphospho-glucuronosyl transferase 2B17, the major enzyme for testosterone glucuronidation. J Clin Endocrinol Metab, 2008, 93, 2500-2506. [13] M. Okano, T. Ueda, Y. Nishitani, H. Kano, A. Ikekita,S. Kageyama. UDP-glucuronosyltransferase 2B17 genotyping in Japanese athletes and evaluation of the current sports drug testing for detecting testosterone misuse. Drug Test Anal, 2012, 5, 166-181. [14] F. Ponzetto, F. Mehl, J. Boccard, N. Baume, S. Rudaz, M. Saugy,R. Nicoli. Longitudinal monitoring of endogenous steroids in human serum by UHPLC-MS/MS as a tool to detect testosterone abuse in sports. Anal Bioanal Chem, 2016, 408, 705-719. [15] K. Carlstrom, E. Palonek, M. Garle, H. Oftebro, J. Stanghelle,I. Bjorkhem. Detection of testosterone administration by increased ratio between serum concentrations of testosterone and 17 alpha-hydroxyprogesterone. Clin Chem, 1992, 38, 1779-1784. [16] J. E. Mullen, N. Garevik, J. Schulze, A. Rane,L. B. Bergman. Perturbation of the Hematopoietic Profile by Anabolic Androgenic Steroids. Journal of Hormones, 2014, 2014. [17] N. Leuenberger,M. Saugy. Circulating microRNAs: The Future of Biomarkers in Anti-doping Field. Adv Exp Med Biol, 2015, 888, 401-408. [18] O. Salamin, L. Jaggi, N. Baume, N. Robinson, M. Saugy,N. Leuenberger. Circulating microRNA-122 as Potential Biomarker for Detection of Testosterone Abuse. PLoS One, 2016, 11, e0155248. [19] C. Wang, N. Berman, J. A. Longstreth, B. Chuapoco, L. Hull, B. Steiner, S. Faulkner, R. E. Dudley,R. S. Swerdloff. Pharmacokinetics of transdermal testosterone gel in hypogonadal men: application of gel at one site versus four sites: a General Clinical Research Center Study. J Clin Endocrinol Metab, 2000, 85, 964-969. [20] J. J. Schulze, M. Lorentzon, C. Ohlsson, J. Lundmark, H. K. Roh, A. Rane,L. Ekstrom. Genetic aspects of epitestosterone formation and androgen disposition: influence of polymorphisms in CYP17 and UGT2B enzymes. Pharmacogenet Genomics, 2008, 18, 477-485. [21] E. Schaeffeler, M. Schwab, M. Eichelbaum,U. M. Zanger. CYP2D6 genotyping strategy based on gene copy number determination by TaqMan real-time PCR. Hum Mutat, 2003, 22, 476-485. [22] J. E. Mullen, J. O. Thorngren, J. J. Schulze, M. Ericsson, N. Garevik, M. Lehtihet,L. Ekstrom. Urinary steroid profile in females - the impact of menstrual cycle and emergency contraceptives. Drug Test Anal, 2017, 9, 1034-1042. [23] K. J. Livak,T. D. Schmittgen. Analysis of relative gene expression data using real-time quantitative PCR and the 2(-Delta Delta C(T)) Method. Methods, 2001, 25, 402-408. [24] A. Fabregat, O. J. Pozo, P. Van Renterghem, P. Van Eenoo, J. Marcos, J. Segura,R. Ventura. Detection of dihydrotestosterone gel, oral dehydroepiandrosterone, and testosterone gel misuse through the quantification of testosterone metabolites released after alkaline treatment. Drug Test Anal, 2011, 3, 828-835. [25] F. Badoud, J. Boccard, C. Schweizer, F. Pralong, M. Saugy,N. Baume. Profiling of steroid metabolites after transdermal and oral administration of testosterone by ultra-high pressure liquid chromatography coupled to quadrupole time-of-flight mass spectrometry. J Steroid Biochem Mol Biol, 2013, 138C, 222-235. [26] Y. Zhang, H. J. Tobias,J. T. Brenna. Steroid isotopic standards for gas chromatography-combustion isotope ratio mass spectrometry (GCC-IRMS). Steroids, 2009, 74, 369-378. [27] G. Forsdahl, C. Ostreicher, M. Koller,G. Gmeiner. Carbon isotope ratio determination and investigation of seized testosterone preparations. Drug Test Anal, 2011, 3, 814-819. [28] G. Green, R. Aguilera, B. Ahrens, B. Starcevic, F. Kurtzman, J. Su,D. Catlin. The influence of diet on isotope ratio mass spectrometry values. Clin J Sport Med, 2009, 19, 287-292.

This article is protected by copyright. All rights reserved.
[29] H. Geyer, U. Flenker, U. Mareck, P. Platen, T. Piper, A. Schmechel, Y. Schrader, M. Thevis,W. Schanzer. The detection of the misuse of testosterone gel. Recent Advances in Doping Analysis, 2007, 15, 133-142. [30] A. E. Thigpen, R. I. Silver, J. M. Guileyardo, M. L. Casey, J. D. Mcconnell,D. W. Russell. Tissue distribution and ontogeny of steroid 5 alpha-reductase isozyme expression. J Clin Invest, 1993, 92, 903-910. [31] P. Van Renterghem, M. Polet, L. Brooker, W. Van Gansbeke,P. Van Eenoo. Development of a GC/C/IRMS method--confirmation of a novel steroid profiling approach in doping control. Steroids, 2012, 77, 1050-1060. [32] T. Piper, U. Mareck, H. Geyer, U. Flenker, M. Thevis, P. Platen,W. Schanzer. Determination of 13C/12C ratios of endogenous urinary steroids: method validation, reference population and application to doping control purposes. Rapid Commun Mass Spectrom, 2008, 22, 2161-2175. [33] R. Aguilera, M. Becchi, H. Casabianca, C. K. Hatton, D. H. Catlin, B. Starcevic,H. G. Pope, Jr. Improved method of detection of testosterone abuse by gas chromatography/combustion/isotope ratio mass spectrometry analysis of urinary steroids. J Mass Spectrom, 1996, 31, 169-176. [34] A. T. Cawley, G. J. Trout, R. Kazlauskas, C. J. Howe,A. V. George. Carbon isotope ratio (delta13C) values of urinary steroids for doping control in sport. Steroids, 2009, 74, 379-392. [35] A. Cawley, M. Collins, R. Kazlauskas, D. J. Handelsman, R. Heywood, M. Longworth,A. Arenas-Queralt. Stable isotope ratio profiling of testosterone preparations. Drug Test Anal, 2010, 2, 557-567. [36] T. Kuuranne, M. Saugy,N. Baume. Confounding factors and genetic polymorphism in the evaluation of individual steroid profiling. Br J Sports Med, 2014, 48, 848-855. [37] A. Biosystems. Endogenous Controls for Real-Time Quantitation of miRNA Using TaqMan(R) MicroRNA Assays., (2010). [38] I. S. Sourvinou, A. Markou,E. S. Lianidou. Quantification of circulating miRNAs in plasma: effect of preanalytical and analytical parameters on their isolation and stability. J Mol Diagn, 2013, 15, 827-834. [39] N. Leuenberger, N. Jan, S. Pradervand, N. Robinson,M. Saugy. Circulating microRNAs as long-term biomarkers for the detection of erythropoiesis-stimulating agent abuse. Drug Test Anal, 2011, 3, 771-776. [40] B. N. Kelly, D. M. Haverstick, J. K. Lee, M. O. Thorner, M. L. Vance, W. Xin,D. E. Bruns. Circulating microRNA as a biomarker of human growth hormone administration to patients. Drug Test Anal, 2014, 6, 234-238. [41] N. Leuenberger, Y. O. Schumacher, S. Pradervand, T. Sander, M. Saugy,T. Pottgiesser. Circulating microRNAs as biomarkers for detection of autologous blood transfusion. PLoS One, 2013, 8, e66309.

This article is protected by copyright. All rights reserved.
Table 1. Results from the steroidal profile of the Athlete Biological Passport for all eight
subjects. The denotation „abnormal‟ indicates that at least one of the samples given after
administration of 100 mg testosterone gel resulted in values outside of the reference range
created by three baseline values. Only one ratio has to be abnormal for the test results to give
an „atypical passport finding (ATPF)‟. The superscript numbers show which samples gave
rise to the ATPF. For T/E, A/Etio, 5αAdiol/5βAdiol and 5αAdiol/E the abnormal values were
all higher than the upper reference limit whereas for A/T they were abnormally low. *Subject
8 only had two baseline values. †The 5αAdiol/E ratio was not included in the research version
of ABP used, instead the reference range for this ratio was ±3SD from average baseline.
Subject T/E A/Etio 5αAdiol/5βAdiol A/T 5αAdiol/E† Test result
1 Abnormal12, 24h Abnormal12 ,24 ,36h Abnormal12, 24, 36, 48h ATPF
2 Abnormal12h Abnormal12h Abnormal12, 24h Abnormal12h ATPF
3 Abnormal12h Abnormal12h, 36h Abnormal12, 24, 36, 48h Abnormal12, 24, 36, 48h ATPF
4 Abnormal12, 24 ,36h Abnormal24h Abnormal12, 24h Abnormal12, 24, 36, 48h ATPF
5 Abnormal12, 24h Abnormal24h Abnormal12, 24h Abnormal12, 24, 36, 48h ATPF
6 Abnormal24h ATPF
7 Abnormal12, 24, 36h Abnormal24h Abnormal12, 24h Abnormal12, 24, 36h ATPF
8* Abnormal12, 24, 36h ATPF

This article is protected by copyright. All rights reserved.
Table 2. Serum hormones and hematological biomarkers measured before (baseline) as well
as 24 and 48 hours after administration of a 100 mg testosterone gel. Results are presented as
median with the interquartile range within parenthesis. Statistical discrimination has been
performed using Friedman tests. Significance of difference are presented with p-values and
levels (* p<0.05, *** p<0.001, **** p<0.0001). T = testosterone, DHT =
dihydrotestosterone, 17-OHP = 17-Hydroxyprogesterone, SHBG = Sex hormone-binding
globulin, LH = Luteinizing hormone, FSH = Follicle stimulating hormone, RET % =
reticulocyte percentage, RET # = reticulocyte count and RBC = red blood cell count.
Baseline 24 h 48 h p-value
T (nmol/L) 16 (15-19) 24 (19-30) 18 (14-22) 0.0179 *
DHT (nmol/L) 1.3 (1.1-1.5) 2.8 (2.0-4.4) 1.9 (1.7-2.3) <0.001 ***
17-OHP (nmol/L) 1.9 (1.7-2.3) 2.15 (1.55-2.3) 1.95 (1.65-2.1) 0.6281 ns
SHBG (nmol/L) 41 (31-50) 42 (31-49) 43 (32-50) 0.7943 ns
LH (IU/L) 4.9 (3.7-5.5) 3.9 (3.1-5.0) 3.6 (3.1-4.4) 0.2359 ns
FSH (IU/L) 3.6 (2.6-4.8) 3.4 (2.3-4.6) 3.2 (2.4-4.5) 0.0789 ns
RET % 0.96 (0.86-1.13) 1.07 (0.96-1.17) 1.17 (1.01-1.25) <0.0001 ****
RET # (x106/L) 0.046 (0.043-0.051) 0.052 (0.045-0.056) 0.058 (0.048-0.061) <0.0001 ****
RBC (x1012
/L) 4.8 (4.6-4.9) 4.9 (4.8-4.9) 4.9 (4.9-5.0) 0.3553 ns
This article is protected by copyright. All rights reserved.
Figure 1. Urinary steroid concentrations before (baselines 1-3) and 12, 24, 36 and 48 hours
after administration of 100mg testosterone gel. All concentrations are adjusted to a specific
gravity of 1.020. Dunn‟s Multiple comparison test was used and the significance of
differences denoted * corresponds to p<0.05.

This article is protected by copyright. All rights reserved.
Figure 2. Urinary steroid ratios before (average of three baseline values) and 12, 24, 36 and
48 hours after administration of 100mg testosterone gel. Each line represents one individual
followed over time. Friedman statistical test was performed on each of the ratios and all ratios
were significant on a level of p<0.001 (***).

This article is protected by copyright. All rights reserved.
Figure 3. T/E profiles from the steroidal module of the Athlete Biological Passport for three
of the subjects after administration of 100 mg testosterone gel. The blue dots represent the
subjects test result and the red line corresponds to the ABP algorithm‟s calculated reference
range. Samples 1-3 are baseline values and 4-7 are 12, 24, 36 and 48 hours after
administration. The limits for the individuals‟ reference range for sample Nr 4 is used (after
three baseline values), since the range after that might be influenced by the testosterone
administration. Profiles A and C present individuals with at least one copy of UGT2B17
whereas profile B is from a subject devoid of the UGT2B17 gene. Profiles A and B are
atypical but profile C showed a normal profile.
This article is protected by copyright. All rights reserved.
Figure 4. IRMS results from 5 of the subjects administered with 100 mg testosterone gel.
The urine samples were taken before (0 h) and up to 48 hours post dose. The graphs show
Δδ13C-values of testosterone, 5αAdiol, 5βAdiol, androsterone and etiocholanolone as
compared to the ERC pregnanediol. Each solid line represents one individual and the dotted
line represents a simplified marker of a suspicious result. Subject 1 (purple ■), Subject 2
(blue ◆), Subject 3 (red ▼), Subject 5 (gray ●) and Subject 6 (green ▲).
View publication statsView publication stats

![Original Article Potential biomarkers for paclitaxel ... · Potential biomarkers for paclitaxel sensitivity in ... larynx and oropharynx cancer [5, 15]. ... Biomarkers for paclitaxel](https://img.dokumen.tips/doc/110x75/5af0f1e17f8b9a572b901a03/original-article-potential-biomarkers-for-paclitaxel-biomarkers-for-paclitaxel.jpg)


![Biomarkers of Exposure and Sensitivity to Organophosphorus [OP] Compounds and Consequences of Exposure Clement E. Furlong Genome Sciences and Medicine,](https://img.dokumen.tips/doc/110x75/551b7302550346a6148b503d/biomarkers-of-exposure-and-sensitivity-to-organophosphorus-op-compounds-and-consequences-of-exposure-clement-e-furlong-genome-sciences-and-medicine.jpg)