Embed Size (px)
Citation preview

POLITECNICO DI MILANO
ELECTRICAL ENGINEERING DEPARTMENT DOCTORAL PROGRAM IN ELECTRICAL ENGINEERING
SENSITIVITY ANALYSIS OF
POWER SYSTEM STATE ESTIMATION REGARDING TO NETWORK PARAMETER UNCERTAINTIES
Doctoral Dissertation of:
Mehdi Davoudi (ID: 738962)
Supervisor: Prof. Gabriele D’Antona The Chair of the Doctoral Program: Prof. Alberto Berizzi
2009-2012 (XXIV Cycle)

I
Abstract
In this thesis the effects of both network parameters uncertainty and measurement
uncertainty on Weighted Least Squares (WLS) State Estimates has been analyzed. An
algorithm for simulation of the uncertainty effects on the state estimator is proposed and
simulated on IEEE 14-Bus, 30-Bus, 57-Bus and 118-Bus power network test cases.
The implementation of this algorithm on the test cases enables us to analyze how
much the state estimator’s output is affected according to the network parameters
uncertainty by means of state errors distribution (in terms of error bars representing the
distribution mean and 1𝜎 standard deviation) versus the network parameters uncertainty.
Generally a serious defect in an estimator is the lack of unbiasedness. In literature the
analysis of network parameters effects on WLS State Estimator’s bias performance is
missing, hence it motivated us to perform a new prominent analysis to find how network
parameters uncertainty can affect the state estimator bias (for a given measurement
uncertainly). It is done using distribution of the ratio of the absolute value of the state
errors mean by the related standard deviations versus the network parameters uncertainty
and comparing it with a predefined threshold.
In order to decrease the sensitivity of state estimates on network parameters
uncertainty, a clue can be using Phasor Measurement Unit (PMU) because according to the
simulations, it is proven that when PMU measurement data are included in the traditional
measurement set, the State Estimator’s sensitivity to the network parameters uncertainty
will be notably smaller.

II
WLS State Estimation provides a mathematical expression for calculating the
variance covariance matrix of State Estimates. It is confirmed numerically that the standard
deviation of State Estimator’s output is underestimated significantly when there is network
parameter uncertainty. Thus the State Estimator’s uncertainty has been analyzed versus the
parameters uncertainty and compared with the theoretical WLS value.
Lastly an analysis is carried out to illustrate how much the State Estimator’s results
are correlated having network parameters uncertainty. Interestingly it is seen that when
the network parameters uncertainty increases, it uncorrelates significantly the estimation
errors.

III
Acknowledgement
First of all, I would like to express my deepest gratitude to my advisor, Prof. Gabriele
D’Antona, for his admirable support and guidance throughout the research. I am truly
indebted to my professors at department of Electrical Engineering at Politecnico di
Milano for their guidance and support through my studies.
I would also like to extend my appreciation to my wife, Fahimeh Sadeghian for her love,
patience, and encouragement. She allowed me to spend most of my time on this thesis.
Very thanks also go to all those who have somehow contributed to the thesis namely
Mohsen Davoudi and I like to give my gratefulness to Prof. Marco Riva and Prof.
Emanuele Ciapessoni for letting me to concentrate more on finalizing the writing of my
thesis at last month.
Last but not least, I must acknowledge my kind parents whom without their support, I
could never been capable of accomplishing my studies and academic work.
Mehdi Davoudi
Politecnico di Milano
February 2012

IV
Dedication
This work is dedicated to Professor D’Antona
and my family.

V
Contents
ABSTRACT .................................................................................................................................... I
CONTENTS .................................................................................................................................. V
1 INTRODUCTION .................................................................................................................... 1
1.1 Foreword .................................................................................................................................... 1
1.2 State Estimation ......................................................................................................................... 2
1.3 Desirable properties of an estimator .......................................................................................... 3 1.3.1 Unbiasedness ........................................................................................................................ 4
1.3.2 Efficiency of an Estimator and Minimum Variance ............................................................... 4
1.3.3 Minimum Mean-Squared Error (MSE) ................................................................................... 5
1.3.4 Consistency ........................................................................................................................... 6
1.3.5 Sufficiency ............................................................................................................................. 7
1.4 Novelty of This Study and Literature Review .............................................................................. 7
1.5 Notations and Operators ............................................................................................................ 8
2 IMPLEMENTATION OF LOAD FLOW ........................................................................... 10
2.1 Literature Review on Load Flow Methods ................................................................................ 11
2.2 Formation of Nodal Admittance Matrix .................................................................................... 13 2.2.1 Bus incidence matrix A ........................................................................................................ 13
2.2.2 Branch Model ...................................................................................................................... 14
2.2.3 Shunt Elements ................................................................................................................... 15
2.2.4 Transformers Model ............................................................................................................ 16
2.2.5 Primitive Network Matrix .................................................................................................... 16
2.2.6 Nodal Admittance Matrix .................................................................................................... 18
2.3 Nodal Power Equations Using the Nodal Admittances .............................................................. 18
2.4 Newton–Raphson Power Flow .................................................................................................. 19
2.5 Newton–Raphson Solution Algorithm ...................................................................................... 23
3 IMPLEMENTATION OF WLS STATE ESTIMATOR ................................................... 25
3.1 Power Equations Using the Physical Admittances .................................................................... 25 3.1.1 Complex Power Flow equations .......................................................................................... 25

VI
3.2 Measurement Model ................................................................................................................ 28
3.3 Minimization Problem .............................................................................................................. 30 3.3.1 Jacobian Matrix structure and components ....................................................................... 32
3.4 Minimization Problem Considering the Measurements Uncertainty ........................................ 36
4 ALGORITHM DEVELOPMENT ........................................................................................ 40
4.1 Parameters Model .................................................................................................................... 42
4.2 Sub-blocks Details .................................................................................................................... 43 4.2.1 Newton Raphson Load Flow ................................................................................................ 43
4.2.2 Calculation of Measurement Quantities ............................................................................. 43
4.2.3 WLS State Estimation .......................................................................................................... 44
4.3 Monte Carlo Procedure ............................................................................................................ 44
5 SIMULATION RESULTS .................................................................................................... 46
5.1 General Criteria for Evaluation of the Simulation Results ......................................................... 48 5.1.1 Mean and Standard Deviation of State Estimator ............................................................... 48
5.1.2 Bias Test for State Estimator ............................................................................................... 49
5.1.3 Correlation of State Estimator’s Errors ............................................................................... 49
5.1.4 Parameter’s Correlation Effect ............................................................................................ 50
5.1.5 The Results with PMU ......................................................................................................... 50
5.2 Test of Algorithm on IEEE 14-Bus Case ...................................................................................... 51 5.2.1 Mean and Standard Deviation of State Estimator ............................................................... 52
5.2.2 Bias Testing for State Estimator .......................................................................................... 55
5.2.3 Correlation of State Estimator’s Errors ............................................................................... 56
5.2.4 Parameter’s Correlation Effect on IEEE 14-Bus case ........................................................... 58
5.2.5 The Results with PMU ......................................................................................................... 59
5.3 Test of Algorithm on IEEE 30-Bus Case ...................................................................................... 61 5.3.1 Mean and Standard Deviation of State Estimator ............................................................... 62
5.3.2 Bias Testing for State Estimator .......................................................................................... 63
5.3.3 Correlation of State Estimator’s Errors ............................................................................... 65
5.3.4 Parameter’s Correlation Effect on IEEE 30-Bus case ........................................................... 66
5.3.5 The Results with PMU ......................................................................................................... 68
5.4 Test of Algorithm on IEEE 57-Bus Case ...................................................................................... 69 5.4.1 Mean and Standard Deviation of State Estimator ............................................................... 71
5.4.2 Bias Testing for State Estimator .......................................................................................... 72
5.4.3 Correlation of State Estimator’s Errors ............................................................................... 74
5.4.4 Parameter’s Correlation Effect on IEEE 57-Bus case ........................................................... 75
5.4.5 The Results with PMU ......................................................................................................... 77
5.5 Test of Algorithm on IEEE 118-Bus Case .................................................................................... 79

VII
5.5.1 Mean and Standard Deviation of State Estimator ............................................................... 80
5.5.2 Bias Testing for State Estimator .......................................................................................... 82
5.5.3 Correlation of State Estimator’s Errors ............................................................................... 83
5.5.4 Parameter’s Correlation Effect on IEEE 118-Bus case ......................................................... 85
5.5.5 The Results with PMU ......................................................................................................... 86
CONCLUSIONS .......................................................................................................................... 89
BIBLIOGRAPHY ....................................................................................................................... 91
APPENDICES ............................................................................................................................ 95
Proof of the Jacobian of 𝑱𝒙4T ............................................................................................................... 95
Proof of the Hessian of 𝑱𝒙4T ................................................................................................................ 96
Derivation of power network equations using a sample network ..................................................... 97
Matlab Codes: Implementation of Newton-Raphson Load Flow ..................................................... 101
Matlab Codes: Implementation of WLS State Estimation ............................................................... 105
Matlab Codes: Building the bus admittance matrix ........................................................................ 111
Matlab Codes: Calculation of Power injections and power flows measurements ........................... 112
Matlab Codes: Measurement data calculation ............................................................................... 114
Matlab Codes: Line Data File Structure (linedata.m) ....................................................................... 116
Matlab Codes: Bus Data File Structure (busdata.m) ........................................................................ 117
Matlab Codes: Measurement Data File Structure (measurement14.m) .......................................... 118
Matlab Codes: Implementation of Proposed Algorithm .................................................................. 119
Network Data for IEEE test cases .................................................................................................... 124
LIST OF FIGURES ................................................................................................................. 130
LIST OF TABLES ................................................................................................................... 133
INDEX ...................................................................................................................................... 134

CHAPTER 1
1 Introduction
1.1 Foreword
n large power networks, there are vast number of connected generators and loads so
there will be large number of nodes and branches. Electric power systems are one of
the biggest subjects that scientists have been putting too many efforts to understand and
predict their complex behavior through mathematical models. The hugeness of the power
transmission system forced early power engineers to be among the first to develop com-
putational approaches to solving the equations that describe them.
The computational methods are essential for power system planners and operators to keep
a consistent and secure operating environment [Crow 2007]. Between the computational
tools, State Estimation (SE) has key role in order to analyze the contingencies of power
system to determine any required corrective actions.
I

Chapter 1. Introduction 2
1.2 State Estimation
Estimation theory is a subdivision of statistics and signal processing that deals with esti-
mating the values of parameters dependent upon measured data that has random compo-
nents. The parameters describe an underlying physical setting in such a way that their
values affect the distribution of the measured data. The estimator’s task is to approximate
the unknown parameters using the available measurements.
Power system state estimation is a tool to determine the voltage and phases on all nodes
of power network that is firstly proposed by Fred Schweppe in [Schweppe 1970a, 1970b,
1970c].
Therefore all of the node voltages along with the angles across the network are of interest
to be calculated using power network parameters and also a set of measurements in the
power network including: voltage magnitudes and power fluxes and angles which pro-
vided by Phasor Measurement Units (PMU).
Implementation of synchronized phasor measurements presents an opportunity for im-
provements of power system state estimation and if PMU’s were installed at all nodes,
the State Estimation wouldn’t be essential but from the economical point of view, having
PMU’s installed all over network is not applicable, therefore the task of State Estimation
still is crucial.
As already stated, the data which are fed into a State Estimator are including the parame-
ters of the power grid such as the transmission line’s resistance, reactance and suscep-
tance along with a set of measurements and the output of State Estimator is the states of
the power network (i.e. voltages and related phases). The traditional measurements in-
clude a portion of the bus voltage magnitudes, active and reactive power injections at
buses and active and reactive power flow through transmission lines. The nominal pa-
rameters of network and also the measurements across the network actually are not accu-
rate and have various uncertainties.
Form the viewpoint of power system planners, to improve the network quality, reliability
and security it is very important to know where to invest. To get better State Estimators,
they can either increase the accuracy of measurements by purchasing new high precision
measurement devices or perform accurate measurement of network parameters across

Chapter 1. Introduction 3
network and make a model of it in real-time. Rationally having both measurement and
parameters accuracy improvement is the best way but could not be economical and they
have to find an optimized solution. Having exact measurements but very uncertain net-
work parameters (or vice versa) will not necessarily improve dramatically the SE but it is
very interesting to know that how much it is effective. This paper focuses on the effects
of parameters uncertainty and measurement noise on State Estimator and the results will
be useful to determine tolerable uncertainty values of measurement and parameter.
In this thesis an algorithm is proposed in order to observe the effects of parameter and
measurement uncertainties on the quality of power system state estimation. In the algo-
rithm the core components include a load flow and a WLS State Estimation, so in the
next two chapters the implementation of Load Flow and State Estimator are focused and
then development of algorithm and Monte Carlo procedure are described in detail.
Afterward the algorithm is tested on different standard power system test cases to analyze
the sensitivity of power system state estimation regarding to the parameters and
measurements noise.
1.3 Desirable properties of an estimator
In order to evaluate an estimator, it is needed to define clearly the mean of a “good”
estimator. A deterministic parameter 𝑋, is derived from n points of a random data
sequence x(n) and the estimation of 𝑋 gives 𝑋� that is a random variable which basically is
a function of x(n), i.e.
𝑋� = 𝐹�𝑥(𝑛)� .
𝑋� is pertaining to an estimator and each single value taken by the random variable 𝑋� is an
estimate [Clarkson 1993].
Generally there may not be a “natural estimator” of a parameter 𝑋, hence several possible
estimators must be considered, with no clear insight of which one to be chosen. For this
regard, we must decide on the criteria by which we judge the quality of an estimator,
therefore a list of desirable properties of estimators is set out in the following subsections
briefly [Priestly 1981] [Clarkson 1993].

Chapter 1. Introduction 4
1.3.1 Unbiasedness
The 𝑋� is an unbiased estimator for 𝑋 if the average value of 𝑋� over all possible samples is
equal to “true value” 𝑋 whatever value 𝑋 takes, that is 𝐸�𝑋�� = 0 for all 𝑋.
The estimator is said to be “biased” if the above equation does not hold. The bias of 𝑋� is
defined as:
𝑏𝑖𝑎𝑠(𝑋�) = 𝑋� − 𝑋
where 𝑋� = 𝐸{𝑋�} .
Since the sampling distribution of 𝑋� will depend on n, the number of observations in the
sample 𝑏𝑖𝑎𝑠�𝑋�� will also depend on n.
If 𝑏𝑖𝑎𝑠�𝑋�� → 0 as 𝑛 → ∞ then 𝑋� is said to be asymptotically unbiased. Unbiasedness is
clearly a desirable property but a biased estimator may still be quite useful provided if it
is asymptotically unbiased. On the other hand, generally the lack of asymptotically
unbiasedness would be considered a serious defect in an estimator.
In general, the basic structure of power system state estimation implies some assumptions
which consequently introduce a bias meaning the inconsistency between the physical
system and the mathematical model and have resulted in practical difficulties manifested
by poor numerical reliability of the iterative state estimation algorithm [Meliopoulos
2001].
1.3.2 Efficiency of an Estimator and Minimum Variance
The efficiency of an estimator is determined by its variance. An estimator is more
efficient if its variance is lower. The variance of the estimated states is an indicator of the
state estimator performance [Bi 2008]. In this thesis, the average value of the variances
of the estimated states is taken as the performance indicator of the proposed state
estimator. The variance of an estimator 𝑋� is:
𝑉𝑎𝑟�𝑋�� = 𝐸 ��𝑋� − 𝑋��2�
In the case that there are several different estimators e.g. 𝑋1 and 𝑋2 for the same
parameter 𝑋, if the bias of the estimators are the same then the estimator would be

Chapter 1. Introduction 5
preferred that its sampling distribution has the smaller variance. Suppose two sampling
variances are shown in Figure 1.1 that 𝑋1 has the smaller variance. The values of
𝑋�1 over different samples are more concentrated around the true value 𝑋 than are the
values of 𝑋�2. Consequently the probability that 𝑋�1 lies in a distinct interval is higher than
the probability that 𝑋�2 lies in the same interval. In this case the 𝑋�1 is said to be a more
efficient estimator than 𝑋�2.
Figure 1.1: Sampling distributions of two different estimators.
Relative efficiency of two different estimators 𝑋1 and 𝑋2 for the same parameter 𝑋, is
commonly evaluated as a percentage of the ratio between the related variances:
𝑅𝑒𝑙𝑎𝑡𝑖𝑣𝑒 𝐸𝑓𝑓𝑖𝑐𝑖𝑒𝑛𝑐𝑦 =𝑉𝑎𝑟(𝑋�1)𝑉𝑎𝑟(𝑋�2)
× 100%
1.3.3 Minimum Mean-Squared Error (MSE)
In general, when an estimation procedure is biased, the efficiency is not a good measure
of quality of the estimator e.g. in the case of having two different estimators 𝑋1 and 𝑋2
for the same parameter, 𝑋�1 may be unbiased but have a high variance, whereas 𝑋�2 may be
biased but have low variance.
0
𝑋�2
𝑋�1
𝑋

Chapter 1. Introduction 6
Under this situation it is important to define the measure of mean-squared error which
considers both bias and variance to determine which estimator is better. The mean-
squared error for the estimator 𝑋� is defined as:
𝑀𝑆𝐸(𝑋�) = 𝐸 ��𝑋� − 𝑋�2�
Using the stated definitions of variance and bias, the mean-squared error could be
expressed in other form as:
𝑀𝑆𝐸(𝑋�) = 𝐸 ��𝑋� − 𝐸{𝑋�} + 𝑏𝑖𝑎𝑠(𝑋�)�2�
𝑀𝑆𝐸(𝑋�) = 𝐸 ��𝑋� − 𝐸{𝑋�}�2
+ 𝑏𝑖𝑎𝑠2�𝑋�� + 2 𝑏𝑖𝑎𝑠(𝑋�)�𝑋� − 𝐸{𝑋�}��
𝑀𝑆𝐸�𝑋�� = 𝐸 ��𝑋� − 𝐸{𝑋�}�2� + 𝑏𝑖𝑎𝑠2�𝑋�� + 2 𝑏𝑖𝑎𝑠�𝑋��𝐸��𝑋� − 𝐸{𝑋�}��
Considering that in the above equation the 𝐸��𝑋� − 𝐸{𝑋�}�� ≡ 0, the first term is the
variance and the second term is the bias squared, the mean-squared error will be finally:
𝑀𝑆𝐸�𝑋�� = 𝑉𝑎𝑟�𝑋�� + 𝑏𝑖𝑎𝑠2�𝑋�� .
The mean-squared error is more complete measure of the quality of an estimator than bias
or variance itself. So, if there are several estimators which are biased, a sensible
procedure would be to choose the estimator with smaller mean squared error.
This procedure is perfectly consistent with the measure of efficiency, when an estimator
is unbiased. In the latter case, mean squared error will reduce only the variance. So, for
an unbiased estimator, the MSE is the variance. Like the variance, MSE has the same
units of measurement as the square of the quantity being estimated. Similar to standard
deviation, taking the square root of MSE gives the root mean square error (RMSE),
which has the same units as the quantity being estimated. For an unbiased estimator, the
RMSE is the square root of the variance which obviously is the standard deviation.
1.3.4 Consistency
Another desirable feature for any estimator is that the more observations used, the closer
the parameter estimate 𝑋� should be to the parameter 𝑋. It is reasonable to expect that an
estimator based on more observations should be more accurate than one based on less
observations.

Chapter 1. Introduction 7
Formally, 𝑋� is called a consistent estimator for 𝑋 if 𝑋� converges to 𝑋 as the sample size
goes to infinity. One of the sufficient conditions for consistency is that the mean squared
error of 𝑋� should converge to 0 as the sample size goes to infinity:
lim𝑛→∞
�𝑀𝑆𝐸�𝑋��� = 0
The mean squared error is the summation of variance with the bias squared, hence
equivalently the sufficient conditions for consistency could be:
lim𝑛→∞ �𝑉𝑎𝑟�𝑋��� = 0 and lim𝑛→∞ �𝑏𝑖𝑎𝑠2�𝑋��� = 0.
1.3.5 Sufficiency
The 𝑋� is a sufficient statistic for 𝑋, if the distribution of the observed data conditioned on
𝑋� is not depended on 𝑋, i.e. the observed data only give information about 𝑋 if their
probability density functions depend on 𝑋.
In a simpler words, sufficiency means that the estimator contains all of the information in
the observations which is relevant to 𝑋. If the estimation process is such that all relevant
information form observations are included in 𝑋�, then the density of the data conditioned
on the estimate will not depend on 𝑋, hence the estimator will be sufficient.
1.4 Novelty of This Study and Literature Review
In the literature, the topics which are more investigated on power system State Estimation
include the optimal placement of measurement devices (in particular considering PMU),
bad data detection and data loss, network observability, wide-area state estimation and
dynamic state estimation (DSE) techniques.
At present Least Squares (LS) method of state estimation is most widely used in power
system and Weighted Least Squares (WLS) method is the one that used more often in
algorithms [Li 2011].
This thesis investigates the effects of parameter and measurement uncertainties on the
results of the power system Weighted Least Squares (WLS) State Estimation. The

Chapter 1. Introduction 8
performance of State Estimator is based mainly on the accuracy of its inputs hence this
investigation is exactly related to the uncertainty of them.
The novelty of this thesis lies in the analysis of how the results of WLS State Estimation
are affected when there exist both:
• The network parameters uncertainty.
• The measurements uncertainty.
This study contains useful approaches for power system planners to improve the State
Estimation by determining whether to invest on increasing the measurement preciseness
or perform an accurate measurement along power network to get accurate values of
network parameters.
There are two interesting researches are done by Muscas et al. in [Muscas 2007a] and
[Muscas 2007a] which both the uncertainty introduced by the measurement devices and
the tolerance of the network parameters (line impedances) are taken into account and the
aim is the optimal number and location of measurement devices. In contrast, the analyses
used in this thesis are more focused on the changes of the results of State Estimator
versus the network parameters uncertainty. Therefore the difference with this thesis work
is that the goals are different while the approaches are similar.
Recently there is also a relevant investigation done by Rakpenthai et al. in [Rakpenthai
2012] that the network parameter uncertainty is also considered based on Parametric
Interval Linear Systems. They proposed an analytical approach to find the bounds of state
variables of the power system whose transmission line network parameters are within
particular upper and lower bounds. The state estimation problem is formulated as a
parametric interval linear system of equations and a novel method to find the outer
solution or the bounds of state variables is suggested. On the contrary, in this thesis a
statistical approach is utilized and we are dealing with uncertainties, not the intervals.
1.5 Notations and Operators
In this thesis the following notation for expressing matrices and the mathematical
operations are used:
• Rectangular matrices expressed by uppercase and boldface letters, e.g. 𝑨

Chapter 1. Introduction 9
• Vectors expressed by lowercase and boldface letters, e.g. 𝒂
• Scalars expressed by lowercase and italic letters, e.g. 𝑎
• Complex quantities expressed by a hat over the letters, e.g. 𝑨�
• Magnitude of a complex matrix expressed by bars around the matrix, e.g. |𝑨|
The following operators are also used for some matrix operations:
• 𝐫𝐞𝐚𝐥(. ) and 𝐢𝐦𝐚𝐠(. ) operators denote the extractions of real and imaginary
elements of a complex vector or matrix respectively.
• 𝐝𝐢𝐚𝐠(. ) operator returns the main diagonal elements of a matrix as a vector.
• 𝐯𝐞𝐜𝐭(. ) operator creates a vector from all the columns of a matrix.

CHAPTER 2
2 Implementation of Load Flow
n this chapter a load flow method is described. It is used to make the calculated
measurement that is one of main components of the proposed algorithm.
Load flow analysis is the most important and fundamental tool including numerical
analysis applied to a power system to investigate problems in power system operating
and planning. It analyzes the power systems in normal steady-state operation and it
usually uses simplified notation such as a one-line diagram and per-unit system. The
power flow problem consists of a given transmission network where all lines are
represented by a Pi-equivalent circuit and transformers by an ideal voltage transformer in
series with an impedance. Once the loads, active and reactive power injections and
network parameters are defined, load flow analysis solves the bus voltages and phases
hence the branch power flow can be calculated. Generators and loads represent the
boundary conditions of the solution. Mathematically, the power flow requires a solution
of a system of simultaneous nonlinear equations. With the increase of power system scale
continuously, the dimension of load flow equations now becomes very high and for the
equations with such high dimensions, we cannot ensure that any mathematical method
can converge to the right solution. Hence, choosing the reliable method is essential
[Wang 2009], [Grainger 1994].
I

Chapter 2. Implementation of Load Flow 11
2.1 Literature Review on Load Flow Methods
Early on the development of first digital computers, the widely used method was Gauss-
Seidel iterative method that was based on the nodal admittance matrix of the power
system the impedance matrix that represents the topology and parameters of the power
network [Stagg 1968]. The fundamental of this method is rather simple and its memory
requirement is relatively small but its convergence is not satisfactory.
To solve this problem, the sequential substitution method based on the nodal impedance
matrix is used which is also called the impedance method. The main difficulty of the
impedance method is [Brown 1963]:
• High memory requirement.
• Computing burden.
The first solution for overcoming the disadvantages of the impedance method is a
piecewise solution of the impedance matrix load flow. It presents a method which
involves splitting a power system into pieces so that it permits use of the impedance
matrix method on large systems. This method retains the same features and convergence
characteristics of impedance method [Andreich 1968].
The other -and better- solution for overcoming the disadvantages of the impedance
method is the Newton–Raphson method [Tinney 1967] which is more widely used and
preferred even at this time. Its prominent features are:
• More accurate and reliable.
• Less number of iterations for convergence.
• Independency of the iteration number to number of buses in the system.
• Faster computations.
The Newton–Raphson power flow is the most robust power flow algorithm used in
practice but however since 1970s the load flow methods continue to develop and among
them the most successful is the fast decoupled method [Scott 1974].
Comparing the Newton method with the fast decoupled method, the latter method is
faster and much simpler and more efficient algorithmically and needs less storage, but it
may fail to converge when some of the basic assumptions do not hold. Convergence of

Chapter 2. Implementation of Load Flow 12
iterative methods depends on the dominance of the diagonal elements of the bus
admittance matrix. A comparison of the convergence of the Gauss-Seidel, Newton-
Raphson and the fast decoupled method power flow algorithms is shown in Figure 2.1
[Wood 1996].
Figure 2.1: Comparison of Various Methods for Power Flow Solution [Wood 1996].
Since, Newton–Raphson method is a gradient method, the method is quite complicated
and therefore, programming is also comparatively difficult and complicated. With this
method the memory that is needed is rather large for large size systems but still the
method is versatile, reliable and accurate and best matched for load flow calculation of
large size systems [Murty 2011].
Until now the research on load flow analysis has been still very active. The artificial
neural network algorithm [Nguyen 1995] [Chan 2000], the genetic algorithm [Wong
1999] and Fuzzy-logic method [Lo 1999], have also been applied to load flow analysis.
However, up to now these new models and new algorithms still cannot replace the
Newton-Raphson or fast decoupled methods.
Gauss-Seidel
Fast Decoupled
Newton-Raphson
𝑳𝒐𝒈
(𝒎𝒂𝒙
|∆𝑷
|)
𝑰𝒕𝒆𝒓𝒂𝒕𝒊𝒐𝒏𝒔

Chapter 2. Implementation of Load Flow 13
According to the literature review, because of the applicability of the Newton-Raphson
method on large size systems and its stability for convergence, in this thesis Newton-
Raphson method is implemented for the calculation of actual state of power system based
on the network parameters, power injections and loads regardless of its complicated
programming.
2.2 Formation of Nodal Admittance Matrix
The formulation of an appropriate mathematical model is the first step in the analysis of
an electrical network. The model must be able to describe the characteristics of individual
network components and the relations that rule the interconnection of the components.
The network matrix equations provide a suitable mathematical model for digital
processing. The elements of a network matrix depend on the selection of independent
variables like currents or voltages (the elements of network matrix, hence, will be
impedances or admittances) [Stagg 1968].
In the simulations of this thesis, the method of singular transformations is used for
forming the bus admittance matrix. This method is chosen because in practice it
performed faster simulations in Matlab simulation environment, compared to the methods
that are described in [Zimmerman 2011] and [Wang 2009].
This section will explain the basic power network models and matrices and finally works
ut the bus admittance matrix by singular transformations.
2.2.1 Bus incidence matrix A
The incidence of branches to buses in a connected power network is shown by the
element-node incidence matrix A. It does not provide any information about the electrical
characteristics of the power network parameters.
This matrix is rectangular and the dimension of it is 𝑁𝑏𝑢𝑠 × 𝑁𝑏𝑟𝑎𝑛𝑐ℎ. The aij elements of
A are 1 if the ith branch is incident to and oriented away from the jth bus and the aij
elements will be -1 if the ith branch is incident to and oriented toward the jth bus. The
other elements are zero.

Chapter 2. Implementation of Load Flow 14
If the rows of A are arranged according to a particular tree, the matrix can be partitioned
into two sub-matrices. The first part is the incidence of the links going from buses to the
zero reference bus that is equal to identity matrix I of the size 𝑁𝐵𝑢𝑠 and the last sub-
matrix is the incidence of network branches as shown in Figure 2.2.
2.2.2 Branch Model
A transmission line can be modeled by a two port pi-model as shown in Figure 2.3. Where
for each line connecting bus h to k, a positive sequence series impedance of
𝑅ℎ𝑘 + 𝑗𝑋ℎ𝑘 and total line charging susceptance of 𝑗𝐵ℎ𝑘 is considered.
Bus
Branch
Buses Li
nks
𝑨𝑙𝑖𝑛𝑘𝑠 = �1 ⋯ 0⋮ ⋱ ⋮0 ⋯ 1
�𝑁𝐵𝑢𝑠×𝑁𝐵𝑢𝑠
Bra
nche
s
𝑨𝑏𝑟𝑎𝑛𝑐ℎ𝑒𝑠 = � �𝑁𝑏𝑟𝑎𝑛𝑐ℎ×𝑁𝐵𝑢𝑠
Figure 2.2 Illustration of the structure of Bus Incidence Matrix by the two sub-matrices.

Chapter 2. Implementation of Load Flow 15
Figure 2.3 Equivalent pi-model for a transmission line.
2.2.3 Shunt Elements
Shunt capacitors or reactors for voltage and/or reactive power control, are represented by
their per phase susceptance at the corresponding bus. The sign of the susceptance value
will determine the type of the shunt element (positive sign shows a shunt capacitor and
negative sign shows a reactor). The Figure 2.4 Illustrates the shunt conductance and
susceptance for an instance bus, k.
Figure 2.4 Illustration of Shunt conductance and Shunt Susceptance for an instance bus, k.
k
0
𝑮𝒌 + 𝒋 ∗ 𝑩𝒌
𝑹𝒉𝒌
𝒋𝑩𝒉𝒌
𝟐
h k
0 0
𝒋𝑿𝒉𝒌
𝒋𝑩𝒉𝒌
𝟐

Chapter 2. Implementation of Load Flow 16
2.2.4 Transformers Model
Transmission lines with transformers can be modeled as series impedances, in series with
ideal transformers as shown in Figure 2.5. The two transformer terminal buses h and k are
named as the tap side bus and the impedance side bus respectively.
Figure 2.5 One-line diagram of a transmission line with transformer.
In Figure 2.6 the two port pi-model of a transmission line is shown considering the effects
of transformer tap value, a.
Figure 2.6 Equivalent pi-model for a transmission line with transformer tap parameter.
2.2.5 Primitive Network Matrix
The electrical characteristics of the individual network components can be presented
easily in the form of a primitive network matrix 𝒀�𝑝𝑟𝑖𝑚𝑖𝑡𝑖𝑣𝑒 . The primitive network matrix
describes the characteristics of each component. It does not present anything about the
network connections.
The diagonal elements of matrix 𝒀�𝑝𝑟𝑖𝑚𝑖𝑡𝑖𝑣𝑒 are the self-admittances and the off-diagonal
elements are the mutual admittances. Assuming there is no mutual coupling between
elements, the 𝒀�𝑝𝑟𝑖𝑚𝑖𝑡𝑖𝑣𝑒 matrix will be a diagonal matrix. The diagonal elements of
𝑹𝒉𝒌 h k
𝒋𝑿𝒉𝒌
a:1
𝒂(𝑹𝒉𝒌 + 𝒋𝑿𝒉𝒌)
(𝟏 − 𝒂)𝒂𝟐(𝑹𝒉𝒌 + 𝒋𝑿𝒉𝒌)
h k
0 0
(𝒂 − 𝟏)𝒂(𝑹𝒉𝒌 + 𝒋𝑿𝒉𝒌)

Chapter 2. Implementation of Load Flow 17
𝒀�𝑝𝑟𝑖𝑚𝑖𝑡𝑖𝑣𝑒 are like a vector that consists of two parts, first the total bus admittances that
are connected from buses to the Reference bus (Bus number 0) and next the branch
admittances as clearly depicted in Figure 2.7.
⎣⎢⎢⎢⎢⎢⎢⎢⎢⎢⎢⎡
�
�
𝑌�1,0
⋮
𝑌�𝑁𝑏𝑢𝑠,0_________
⎭⎪⎬
⎪⎫
𝑇𝑜𝑡𝑎𝑙 𝐵𝑢𝑠 𝐴𝑑𝑚𝑖𝑡𝑡𝑎𝑛𝑐𝑒𝑠
�
𝑦�1
⋮
𝑦�𝑁𝑏𝑟𝑎𝑛𝑐ℎ
⎭⎪⎬
⎪⎫
𝐵𝑟𝑎𝑛𝑐ℎ 𝐴𝑑𝑚𝑖𝑡𝑡𝑎𝑛𝑐𝑒𝑠
⎦⎥⎥⎥⎥⎥⎥⎥⎥⎥⎥⎤
(𝑁𝑏𝑢𝑠+𝑁𝑏𝑟𝑎𝑛𝑐ℎ) × 1
�
Figure 2.7 The vector of diagonal elements of 𝑌�𝑝𝑟𝑖𝑚𝑖𝑡𝑖𝑣𝑒 .
The Bus Admittance elements of this vector for tap side buses are defined as:
𝑌�𝑖,0 = � �𝑗𝐵𝑛
2+
(1 − 𝑎)𝑎2(𝑅𝑛 + 𝑗𝑋𝑛)�
all the branchesconnected to bus i
𝑛=1
+ 𝑌𝑠ℎ𝑢𝑛𝑡
Where 𝑅𝑛 and 𝑋𝑛 are respectively the resistance and reactance of the branches that are
connected to bus i. 𝑌𝑠ℎ𝑢𝑛𝑡 is the shunt admittance connected to bus i.
The Bus Admittance elements for impedance side buses are defined as:
𝑌�𝑖,0 = � �𝑗𝐵𝑛
2+
(𝑎 − 1)𝑎(𝑅𝑛 + 𝑗𝑋𝑛)�
all the branchesconnected to bus i
𝑛=1
+ 𝑌𝑠ℎ𝑢𝑛𝑡
The transformer tap value a, for a non-transformer branch is considered 1. The Branch
Admittance elements are defined as:
𝑦�1:𝑁𝑏𝑟𝑎𝑛𝑐ℎ =1
𝑎(𝑅ℎ𝑘 + 𝑗𝑋ℎ𝑘)
Where 𝑅ℎ𝑘 and 𝑋ℎ𝑘 are respectively the resistance and reactance of an instance branch
that connects bus h to k.

Chapter 2. Implementation of Load Flow 18
2.2.6 Nodal Admittance Matrix
It is necessary to convert the primitive network matrix into a network matrix that
describes the performance of the interconnected network. It is done by using singular
transformations of the bus primitive network matrix with the bus incidence matrix.
Therefore, the bus admittance matrix 𝒀�𝑏𝑢𝑠 can be extracted by using the bus incidence
matrix 𝑨 to relate the primitive network’s variables and parameters to the bus quantities
of interconnected network [Stagg 1968].
𝒀𝑏𝑢𝑠 = 𝑨𝑇 𝒀�𝑝𝑟𝑖𝑚𝑖𝑡𝑖𝑣𝑒 𝑨
The bus incidence matrix is singular, so the [𝑨𝑇 𝒀�𝑝𝑟𝑖𝑚𝑖𝑡𝑖𝑣𝑒 𝑨] is singular transformation of
𝒀�𝑝𝑟𝑖𝑚𝑖𝑡𝑖𝑣𝑒 .
2.3 Nodal Power Equations Using the Nodal Admittances
Power system load flow is considered as the problem of finding the voltage and phase for
each bus when all the active and reactive power injections are specified. If the complex
power can be represented by equations of complex voltages, then a nonlinear equation
solving method can be used to find a solution of the node voltage. In this section the
nodal power equations are deduced using the nodal admittances. [Wang 2009, p.76]
The complex node power equations have two representation forms, polar and rectangular
form:
𝑆ℎ̅ = 𝑃ℎ + 𝑗𝑄ℎ = 𝑉�ℎ�𝑌�ℎ𝑘∗ 𝑉�𝑘∗𝑛
𝑘=1
Which the index ℎ is the bus number from 1 to 𝑁𝑏𝑢𝑠. The node admittance matrix 𝑌�ℎ𝑘 is a
sparse matrix and accordingly the terms in the summation are not many. The elements of
node admittance matrix can be written as:
𝑌�ℎ𝑘 = 𝐺ℎ𝑘 + 𝑗𝐵ℎ𝑘
Consequently the complex node power can be expressed as:
𝑃ℎ + 𝑗𝑄ℎ = 𝑉�ℎ � (𝐺ℎ𝑘 − 𝑗𝐵ℎ𝑘)𝑉�𝑘∗𝑁𝑏𝑢𝑠
𝑘=1

Chapter 2. Implementation of Load Flow 19
And if we consider the voltages in polar form: 𝑉�ℎ = |𝑉ℎ|𝑒𝑗𝜃ℎ ,
𝑃ℎ + 𝑗𝑄ℎ = |𝑉ℎ|𝑒𝑗𝜃ℎ � (𝐺ℎ𝑘 − 𝑗𝐵ℎ𝑘)|𝑉𝑘|𝑒−𝑗𝜃𝑘𝑁𝑏𝑢𝑠
𝑘=1
𝑃ℎ + 𝑗𝑄ℎ = |𝑉ℎ| � |𝑉𝑘|(𝐺ℎ𝑘 − 𝑗𝐵ℎ𝑘)𝑒𝑗(𝜃ℎ𝑘)
𝑁𝑏𝑢𝑠
𝑘=1
That 𝜃ℎ𝑘 = 𝜃ℎ − 𝜃𝑘 is the voltage phase difference between node ℎ and 𝑘. By using
Euler rule: 𝑒𝑗𝜃 = cos 𝜃 + 𝑗 sin𝜃 we can combine the exponential forms:
𝑃ℎ + 𝑗𝑄ℎ = |𝑉ℎ| � |𝑉𝑘|(𝐺ℎ𝑘 − 𝑗𝐵ℎ𝑘) (cos𝜃ℎ𝑘 + 𝑗 sin𝜃ℎ𝑘)𝑁𝑏𝑢𝑠
𝑘=1
𝑃ℎ + 𝑗𝑄ℎ = |𝑉ℎ| � |𝑉𝑘|(𝐺ℎ𝑘 cos 𝜃ℎ𝑘 + 𝑗𝐺ℎ𝑘 sin𝜃ℎ𝑘 − 𝑗𝐵ℎ𝑘 cos 𝜃ℎ𝑘 + 𝐵ℎ𝑘 sin𝜃ℎ𝑘)𝑁𝑏𝑢𝑠
𝑘=1
Dividing above equation into real and imaginary parts gives the active and reactive
power injection at bus 𝒉 in polar form:
𝑃ℎ = |𝑉ℎ| � |𝑉𝑘|(𝐺ℎ𝑘 cos 𝜃ℎ𝑘 + 𝐵ℎ𝑘 sin𝜃ℎ𝑘)𝑁𝑏𝑢𝑠
𝑘=1
𝑄ℎ = |𝑉ℎ| � |𝑉𝑘|(𝐺ℎ𝑘 sin𝜃ℎ𝑘 − 𝐵ℎ𝑘 cos 𝜃ℎ𝑘)𝑁𝑏𝑢𝑠
𝑘=1
The last two equations are the polar form of the nodal active and reactive power
equations which are the main equations in the Newton-Raphson calculation procedure.
2.4 Newton–Raphson Power Flow
Since the active and reactive powers are represented by equations of voltage magnitude
and phases in previous section, a non-linear equation solving method can be applied to
extract the voltage and phases for each bus.
The Newton–Raphson method is an efficient step-by-step procedure to solve nonlinear
equations that it transforms the procedure of solving nonlinear equations into the

Chapter 2. Implementation of Load Flow 20
procedure of repeatedly solving linear equations. This chronological linearization process
is the main part of the Newton–Raphson method [Wang 2009].
For building the mathematical models of the load flow problem, the simultaneous
nonlinear equations of node voltage phasors, which are derived in the previous section,
are expressed in the following forms to define the power mismatches in polar
coordinates:
∆𝑃ℎ = 𝑃𝑠𝑝,ℎ − |𝑉ℎ| � |𝑉𝑘|(𝐺ℎ𝑘 cos 𝜃ℎ𝑘 + 𝐵ℎ𝑘 sin𝜃ℎ𝑘)𝑁𝑏𝑢𝑠
𝑘=1
= 0
∆𝑄ℎ = 𝑄𝑠𝑝,ℎ − |𝑉ℎ| � |𝑉𝑘|(𝐺ℎ𝑘 sin 𝜃ℎ𝑘 − 𝐵ℎ𝑘 cos𝜃ℎ𝑘)𝑁𝑏𝑢𝑠
𝑘=1
= 0
• ∆𝑃ℎ and ∆𝑄ℎ are the magnitudes of active and reactive power errors respectively
and the index ℎ is the bus number (from 1 to 𝑁𝑏𝑢𝑠).
• 𝑃𝑠𝑝,ℎ and 𝑄𝑠𝑝,ℎ are the specified active and reactive powers at bus ℎ.
• 𝐺ℎ𝑘 and 𝐵ℎ𝑘 come from the definition of bus admittance matrix in previous
chapter which it was divided into real and imaginary parts as : 𝑌�ℎ𝑘 = 𝐺ℎ𝑘 + 𝑗𝐵ℎ𝑘.
Reminding that for the load flow analysis, active and reactive powers at all the buses
(except slack bus) in the power system network are specified explicitly.
Assuming that the slack bus is the first bus and the number of PV buses is 𝑁𝑃𝑉. Hence
there will be (𝑁𝑏𝑢𝑠 − 1) equations for active power:
⎩⎪⎪⎨
⎪⎪⎧∆𝑃2 = 𝑃𝑠𝑝,2 − |𝑉2| � |𝑉𝑘|(𝐺2𝑘 cos 𝜃2𝑘 + 𝐵2𝑘 sin𝜃2𝑘)
𝑁𝑏𝑢𝑠
𝑘=1
= 0
⋮
∆𝑃𝑁𝑏𝑢𝑠 = 𝑃𝑠𝑝,𝑁𝑏𝑢𝑠− �𝑉𝑁𝑏𝑢𝑠� � |𝑉𝑘|(𝐺𝑁𝑏𝑢𝑠𝑘 cos𝜃𝑁𝑏𝑢𝑠𝑘 + 𝐵𝑁𝑏𝑢𝑠𝑘 sin𝜃𝑁𝑏𝑢𝑠𝑘)
𝑁𝑏𝑢𝑠
𝑘=1
= 0
�
and (𝑁𝑏𝑢𝑠 − 𝑁𝑃𝑉 − 1) equations for reactive power:

Chapter 2. Implementation of Load Flow 21
⎩⎪⎪⎨
⎪⎪⎧∆𝑄2 = 𝑄𝑠𝑝,2 − |𝑉2| � |𝑉𝑘|(𝐺2𝑘 sin𝜃2𝑘 − 𝐵2𝑘 cos 𝜃2𝑘)
𝑁𝑏𝑢𝑠
𝑘=1
= 0
⋮
∆𝑄𝑁𝑏𝑢𝑠= 𝑄𝑠𝑝,𝑁𝑏𝑢𝑠
− �𝑉𝑁𝑏𝑢𝑠� � |𝑉𝑘|(𝐺𝑁𝑏𝑢𝑠𝑘 sin 𝜃𝑁𝑏𝑢𝑠𝑘 − 𝐵𝑁𝑏𝑢𝑠𝑘 cos 𝜃𝑁𝑏𝑢𝑠𝑘)𝑁𝑏𝑢𝑠
𝑘=1
= 0
�
Hence the total number of above equations will be (2𝑁𝑏𝑢𝑠 − 𝑁𝑃𝑉 − 2) that is equal to the
number of unknowns which are (𝑁𝑏𝑢𝑠 − 𝑁𝑃𝑉 − 1) voltage magnitudes and (𝑁𝑏𝑢𝑠 − 1)
angles.
The load flow analyzer considers the acceptable tolerance for ∆𝑃ℎ and ∆𝑄ℎ and it solves
the bus voltages (on all buses except slack and PV buses) along with the bus angles (on
all buses except slack bus).
Considering the first order of Taylor Series expansion and neglecting the higher order
terms of the non-linear equations for active and reactive power around the vector of
unknowns that is composed of voltage magnitudes and angles of size (2𝑁𝑏𝑢𝑠 − 𝑁𝑃𝑉 − 2)
gives:
⎣⎢⎢⎢⎢⎢⎢⎡
∆𝑃 ___
∆𝑄
⎦⎥⎥⎥⎥⎥⎥⎤
=
⎣⎢⎢⎢⎢⎢⎡� 𝑨 = 𝜕𝑃
𝜕𝜃� � 𝑩 = 𝜕𝑃
𝜕𝑉�
� 𝑪 = 𝜕𝑄𝜕𝜃
� � 𝑫 = 𝜕𝑄𝜕𝑉
�⎦⎥⎥⎥⎥⎥⎤
⎣⎢⎢⎢⎢⎢⎢⎡
∆𝜃 ___ ∆𝑉
⎦⎥⎥⎥⎥⎥⎥⎤
Mismatches Jacobians Corrections
∆𝜃 and ∆𝑉 are the voltage angle correction values and voltage magnitude correction
values respectively. The last expression in extended from will be:
⎣⎢⎢⎢⎢⎢⎡∆𝑃2⋮
∆𝑃𝑁𝑏𝑢𝑠_______∆𝑄2⋮
∆𝑄𝑁𝑏𝑢𝑠⎦⎥⎥⎥⎥⎥⎤
=
⎣⎢⎢⎢⎢⎢⎡�𝐴22 ⋯ 𝐴2,𝑁𝑏𝑢𝑠⋮ ⋱ ⋮
𝐴𝑁𝑏𝑢𝑠,2 ⋯ 𝐴𝑁𝑏𝑢𝑠,𝑁𝑏𝑢𝑠
� �𝐵22 ⋯ 𝐵2,𝑁𝑏𝑢𝑠⋮ ⋱ ⋮
𝐵𝑁𝑏𝑢𝑠,2 ⋯ 𝐵𝑁𝑏𝑢𝑠,𝑁𝑏𝑢𝑠
�
�𝐶22 ⋯ 𝐶2,𝑁𝑏𝑢𝑠⋮ ⋱ ⋮
𝐶𝑁𝑏𝑢𝑠,2 ⋯ 𝐶𝑁𝑏𝑢𝑠,𝑁𝑏𝑢𝑠
� �𝐷22 ⋯ 𝐷2,𝑁𝑏𝑢𝑠⋮ ⋱ ⋮
𝐷𝑁𝑏𝑢𝑠,2 ⋯ 𝐷𝑁𝑏𝑢𝑠,𝑁𝑏𝑢𝑠
�⎦⎥⎥⎥⎥⎥⎤
⎣⎢⎢⎢⎢⎢⎡∆𝜃2⋮
∆𝜃𝑁𝑏𝑢𝑠_______∆𝑉2⋮
∆𝑉𝑁𝑏𝑢𝑠⎦⎥⎥⎥⎥⎥⎤

Chapter 2. Implementation of Load Flow 22
The matrices of 𝑨, 𝑩, 𝑪 and 𝑫 are the sub-blocks of the Jacobian matrix where their
elements can be calculated by differentiating the equations of active and reactive power
with respect to voltage angles and magnitudes. Hence the elements of the Jacobian matrix
can be obtained using the following equations (for each sub-block, the first equation is
related to the off-diagonal elements and the second one is for diagonal elements):
⎩⎪⎨
⎪⎧𝐴𝑖𝑗 =
𝜕𝑃𝑖𝜕𝜃𝑗
= −𝑉𝑖𝑉𝑗�𝐺𝑖𝑗 sin𝜃𝑖𝑗 − 𝐵𝑖𝑗 cos 𝜃𝑖𝑗� 𝑓𝑜𝑟 𝑖 ≠ 𝑗
𝐴𝑖𝑖 =𝜕𝑃𝑖𝜕𝜃𝑖
= 𝑉𝑖 � 𝑉𝑗�𝐺𝑖𝑗 sin 𝜃𝑖𝑗 − 𝐵𝑖𝑗 cos 𝜃𝑖𝑗�𝑗≠𝑖
𝑗∈𝑁𝑏𝑢𝑠
�
⎩⎪⎨
⎪⎧𝐵𝑖𝑗 =
𝜕𝑃𝑖𝜕𝑉𝑗
= −𝑉𝑖�𝐺𝑖𝑗 cos 𝜃𝑖𝑗 + 𝐵𝑖𝑗 sin𝜃𝑖𝑗� 𝑓𝑜𝑟 𝑖 ≠ 𝑗
𝐵𝑖𝑖 =𝜕𝑃𝑖𝜕𝑉𝑖
= � −𝑉𝑗�𝐺𝑖𝑗 cos 𝜃𝑖𝑗 + 𝐵𝑖𝑗 sin𝜃𝑖𝑗� − 2𝑉𝑖𝐺𝑖𝑖
𝑗≠𝑖
𝑗∈𝑁𝑏𝑢𝑠
�
⎩⎪⎨
⎪⎧𝐶𝑖𝑗 =
𝜕𝑄𝑖𝜕𝜃𝑗
= 𝑉𝑖𝑉𝑗�𝐺𝑖𝑗 cos 𝜃𝑖𝑗 + 𝐵𝑖𝑗 sin𝜃𝑖𝑗� 𝑓𝑜𝑟 𝑖 ≠ 𝑗
𝐶𝑖𝑖 =𝜕𝑄𝑖𝜕𝜃𝑖
= −𝑉𝑖 � 𝑉𝑗�𝐺𝑖𝑗 cos 𝜃𝑖𝑗 + 𝐵𝑖𝑗 sin𝜃𝑖𝑗�𝑗≠𝑖
𝑗∈𝑁𝑏𝑢𝑠
�
⎩⎪⎨
⎪⎧𝐷𝑖𝑗 =
𝜕𝑄𝑖𝜕𝑉𝑗
= −𝑉𝑖�𝐺𝑖𝑗 sin𝜃𝑖𝑗 − 𝐵𝑖𝑗 cos 𝜃𝑖𝑗� 𝑓𝑜𝑟 𝑖 ≠ 𝑗
𝐷𝑖𝑖 =𝜕𝑄𝑖𝜕𝑉𝑖
= � −𝑉𝑗�𝐺𝑖𝑗 sin𝜃𝑖𝑗 − 𝐵𝑖𝑗 cos 𝜃𝑖𝑗� + 2𝑉𝑖𝐵𝑖𝑖
𝑗≠𝑖
𝑗∈𝑁𝑏𝑢𝑠
�
Jacobian matrix is a sparse matrix, and the place of zeros in this matrix is the same as
place of zeros in bus admittance matrix because considering the equations of Jacobian
matrix for off-diagonal elements, it can be seen that each of them is related to only one
element of the bus admittance matrix. Therefore, if the element in the admittance matrix
is zero, the corresponding element in the Jacobian matrix is also zero. The Jacobian
matrix is not, however, symmetrical. The elements of Jacobian matrix are a function of
node voltage phasors and so during the iterative process they vary with node voltages
[Wang 2009].

Chapter 2. Implementation of Load Flow 23
For saving the computation time, the voltage magnitudes in the correction vector can be
changed to ∆𝑉𝑉
because in this case the equations for calculating sub-matrices for A and D
𝐴𝑖𝑗 = 𝐷𝑖𝑗 and 𝐵𝑖𝑗 = −𝐶𝑖𝑗. If we consider this situation, the number of elements to be
calculated for Jacobian matrix are only 2(𝑁𝑏𝑢𝑠 − 1) + [2(𝑁𝑏𝑢𝑠 − 1)]2 2⁄ instead of
[2(𝑁𝑏𝑢𝑠 − 1)]2 [Murty 2011].
2.5 Newton–Raphson Solution Algorithm
The flowchart for implementation of Newton-Raphson Load Flow procedure in Polar
Coordinates is depicted in Figure 2.8.

Chapter 2. Implementation of Load Flow 24
Figure 2.8 Flowchart for implementation of Newton-Raphson Load Flow

CHAPTER 3
3 Implementation of WLS State Estimator
3.1 Power Equations Using the Physical Admittances
o examine the behavior of the state estimator in the presence of uncertainty in the
network parameters, we extract the basic equations that relate the active and
reactive power injections to the voltages, angles and the network parameters using the
physical admittances. Firstly we describe the equivalent pi-model for a branch and then
we write the node power equations.
3.1.1 Complex Power Flow equations
Consider an equivalent pi model for a transfer line as shown in Figure 3.1:
Figure 3.1 Equivalent pi-model for a branch connecting bus ℎ to bus 𝑘.
T
𝐼ℎ̅𝑘 𝑦�ℎ𝑘 = 𝑔ℎ𝑘 + 𝑗𝑏ℎ𝑘
𝑦�ℎ0 = 𝑔ℎ0 + 𝑗𝑏ℎ0 𝑦�𝑘0 = 𝑔𝑘0 + 𝑗𝑏𝑘0
𝐼�̅�ℎ 𝑉�ℎ 𝑉�𝑘 h k
0 0
1
2
3
𝑆ℎ̅𝑘 𝑆�̅�ℎ

Chapter 3. Implementation of WLS State Estimation 26
Where:
• 𝑉�ℎ and 𝑉�ℎ are the complex voltages in polar form at bus ℎ and 𝑘.
• 𝑦�ℎ0 and 𝑦�𝑘0 are the admittances of the shunt branches connected at bus ℎ and 𝑘.
• 𝑦�ℎ𝑘 is the admittance of the series branch connecting bus ℎ to bus 𝑘.
• 𝐼ℎ̅𝑘 and 𝐼�̅�ℎ are the line current flow between bus ℎ and bus 𝑘.
• 𝑆ℎ̅𝑘 and 𝑆�̅�ℎ are the complex power flows.
The reduced incidence matrix 𝐶 will be:
and the branch admittance matrix is:
𝑦�𝑏 = �𝑦�ℎ𝑘 0 0
0 𝑦�ℎ0 00 0 𝑦�𝑘0
�.
The nodal admittance matrix can be found by:
𝑌 = 𝐶𝑌𝑏𝐶𝑇
𝑌 = � 1 1 0−1 0 1� �
𝑦�ℎ𝑘 0 00 𝑦�ℎ0 00 0 𝑦�𝑘0
� �1 −11 00 1
�
𝑌 = �𝑦�ℎ𝑘 + 𝑦�ℎ0 −𝑦�ℎ𝑘−𝑦�ℎ𝑘 𝑦�ℎ𝑘 + 𝑦�𝑘0
�
According to Ohm's law: 𝐼 = 𝑌𝑉, the vector of injected currents can be extracted as:
�𝐼ℎ̅𝑘𝐼�̅�ℎ
� = �𝑦�ℎ𝑘 + 𝑦�ℎ0 −𝑦�ℎ𝑘−𝑦�ℎ𝑘 𝑦�ℎ𝑘 + 𝑦�𝑘0
� �𝑉�ℎ𝑉�𝑘�
�𝐼ℎ̅𝑘 = (𝑦�ℎ𝑘 + 𝑦�ℎ0)𝑉�ℎ − 𝑦�ℎ𝑘𝑉�𝑘 𝐼�̅�ℎ = −𝑦�ℎ𝑘𝑉�ℎ + (𝑦�ℎ𝑘 + 𝑦�𝑘0)𝑉�𝑘
�
Which 𝐼ℎ̅𝑘 is the current from bus ℎ to 𝑘. Finally the complex power 𝑆ℎ̅𝑘 that flows from bus
ℎ to bus 𝑘 will be:
𝑆ℎ̅𝑘 = 𝑉�ℎ 𝐼ℎ̅𝑘∗
𝐶 = � 1 1 0−1 0 1�
h k
1
2
3

Chapter 3. Implementation of WLS State Estimation 27
𝑆ℎ̅𝑘 = 𝑉�ℎ�(𝑦�ℎ𝑘 + 𝑦�ℎ0)𝑉�ℎ − 𝑦�ℎ𝑘𝑉�𝑘�∗
𝑆ℎ̅𝑘 = (𝑦�ℎ𝑘 + 𝑦�ℎ0)∗𝑉�ℎ𝑉�ℎ∗ − 𝑦�ℎ𝑘∗𝑉�ℎ𝑉�𝑘∗
Substituting the complex power flow 𝑆ℎ̅𝑘 with the elements of 𝑦�ℎ𝑘 = 𝑔ℎ𝑘 + 𝑗𝑏ℎ𝑘 yields:
𝑆ℎ̅𝑘 = (𝑔ℎ𝑘 − 𝑗𝑏ℎ𝑘 + 𝑔ℎ0 − 𝑗𝑏ℎ0)|𝑉�ℎ|2 − (𝑔ℎ𝑘 − 𝑗𝑏ℎ𝑘)|𝑉�ℎ||𝑉�𝑘|𝑒𝑗𝜃ℎ𝑘
Using Euler rule: 𝑒𝑗𝜃 = cos 𝜃 + 𝑗 sin𝜃 we will have:
𝑆ℎ̅𝑘 = �𝑔ℎ𝑘 + 𝑔ℎ0 − 𝑗(𝑏ℎ𝑘 + 𝑏ℎ0)�|𝑉�ℎ|2 − (𝑔ℎ𝑘 − 𝑗𝑏ℎ𝑘)(cos𝜃ℎ𝑘 + 𝑗 sin 𝜃ℎ𝑘)|𝑉�ℎ||𝑉�𝑘|
𝑆ℎ̅𝑘 == �𝑔ℎ𝑘 + 𝑔ℎ0 − 𝑗(𝑏ℎ𝑘 + 𝑏ℎ0)�|𝑉�ℎ|2 −− [(𝑔ℎ𝑘 cos 𝜃ℎ𝑘 + 𝑗𝑔ℎ𝑘 sin𝜃ℎ𝑘 − 𝑗𝑏ℎ𝑘 cos 𝜃ℎ𝑘 + 𝑏ℎ𝑘 sin𝜃ℎ𝑘)]|𝑉�ℎ||𝑉�𝑘|
𝑆ℎ̅𝑘 == (𝑔ℎ𝑘 + 𝑔ℎ0)|𝑉�ℎ|2 − 𝑗(𝑏ℎ𝑘 + 𝑏ℎ0)|𝑉�ℎ|2 − (𝑔ℎ𝑘 cos𝜃ℎ𝑘)|𝑉�ℎ||𝑉�𝑘| −− 𝑗(𝑔ℎ𝑘 sin𝜃ℎ𝑘)|𝑉�ℎ||𝑉�𝑘| + 𝑗(𝑏ℎ𝑘 cos 𝜃ℎ𝑘)|𝑉�ℎ||𝑉�𝑘| − (𝑏ℎ𝑘 sin𝜃ℎ𝑘)|𝑉�ℎ||𝑉�𝑘|
𝑆ℎ̅𝑘 == (𝑔ℎ𝑘 + 𝑔ℎ0)|𝑉�ℎ|2 − (𝑏ℎ𝑘 sin𝜃ℎ𝑘)|𝑉�ℎ||𝑉�𝑘| − (𝑔ℎ𝑘 cos 𝜃ℎ𝑘)|𝑉�ℎ||𝑉�𝑘| −− 𝑗(𝑔ℎ𝑘 sin𝜃ℎ𝑘)|𝑉�ℎ||𝑉�𝑘| + 𝑗(𝑏ℎ𝑘 cos 𝜃ℎ𝑘)|𝑉�ℎ||𝑉�𝑘| − 𝑗(𝑏ℎ𝑘 + 𝑏ℎ0)|𝑉�ℎ|2
𝑆ℎ̅𝑘 =
= (𝑔ℎ𝑘 + 𝑔ℎ0)|𝑉�ℎ|2 − (𝑔ℎ𝑘 cos 𝜃ℎ𝑘)|𝑉�ℎ||𝑉�𝑘| − (𝑏ℎ𝑘 sin𝜃ℎ𝑘)|𝑉�ℎ||𝑉�𝑘| +
+ 𝑗[−(𝑔ℎ𝑘 sin 𝜃ℎ𝑘)|𝑉�ℎ||𝑉�𝑘| + (𝑏ℎ𝑘 cos 𝜃ℎ𝑘)|𝑉�ℎ||𝑉�𝑘| − (𝑏ℎ𝑘 + 𝑏ℎ0)|𝑉�ℎ|2]
𝑆ℎ̅𝑘 =
= (𝑔ℎ𝑘 + 𝑔ℎ0)|𝑉�ℎ|2 − (𝑔ℎ𝑘 cos 𝜃ℎ𝑘 + 𝑏ℎ𝑘 sin𝜃ℎ𝑘)|𝑉�ℎ||𝑉�𝑘| + 𝑗[−(𝑏ℎ𝑘 + 𝑏ℎ0)|𝑉�ℎ|2 −
− (𝑔ℎ𝑘 sin𝜃ℎ𝑘 − 𝑏ℎ𝑘 cos 𝜃ℎ𝑘)|𝑉�ℎ||𝑉�𝑘|]
The complex power flow can decomposed into its real and imaginary parts:
𝑆ℎ̅𝑘 = 𝑃ℎ𝑘 + 𝑗𝑄ℎ𝑘
Therefore the active and reactive power flows can be finally extracted as:
𝑃ℎ𝑘 = (𝑔ℎ𝑘 + 𝑔ℎ0)|𝑉�ℎ|2 − (𝑔ℎ𝑘 cos 𝜃ℎ𝑘 + 𝑏ℎ𝑘 sin𝜃ℎ𝑘)|𝑉�ℎ||𝑉�𝑘|
𝑄ℎ𝑘 = −(𝑏ℎ𝑘 + 𝑏ℎ0)|𝑉�ℎ|2�−(𝑔ℎ𝑘 sin𝜃ℎ𝑘 − 𝑏ℎ𝑘 cos𝜃ℎ𝑘) �|𝑉�ℎ||𝑉�𝑘|

Chapter 3. Implementation of WLS State Estimation 28
3.2 Measurement Model
For a power network the set of measurements 𝒛 given are by:
𝒛 = �
𝑧1𝑧2⋮𝑧𝑚
� = �
𝑓1(𝑥1, … , 𝑥𝑛)𝑓2(𝑥1, … , 𝑥𝑛)
⋮𝑓𝑚(𝑥1, … , 𝑥𝑛)
�+ �
𝑟1𝑟2⋮𝑟𝑚
� = 𝒇(𝑥) + 𝒓
where:
𝑓𝑖(𝑥) is the non-linear function relating measurement 𝑖 to the state vector 𝑥
𝒓 is the vector of measurement errors
Regarding to the statistical properties of the measurement errors, for 𝑖 = 1, … ,𝑚 we
commonly have 𝐸[𝑟𝑖] = 0. Also the measurement errors are considered to be
independent, i.e. 𝐸�𝑟𝑖𝑟𝑗� = 0. Furthermore, they are assumed to have a Gaussian
distribution with zero mean.
The measurement vector 𝒛 is composed of the conventional measurements including:
Voltage magnitude, Active power injections, Reactive power injections, Active power
flows and Reactive power flows along with a set of phase measurements from PMU. The
measurement vector is in the following form:

Chapter 3. Implementation of WLS State Estimation 29
𝒛 =
⎣⎢⎢⎢⎢⎢⎢⎢⎢⎢⎢⎢⎢⎢⎢⎢⎢⎢⎢⎢⎢⎢⎢⎢⎢⎢⎢⎢⎢⎢⎢⎢⎢⎢⎢⎡
�
�
|𝑉1|
⋮
�𝑉𝑁𝑣�______
⎭⎪⎬
⎪⎫
𝑉𝑜𝑙𝑡𝑎𝑔𝑒 𝑀𝑎𝑔𝑛𝑖𝑡𝑢𝑑𝑒𝑠
�
𝑃1
⋮
𝑃𝑁𝑖______
⎭⎪⎬
⎪⎫
𝐴𝑐𝑡𝑖𝑣𝑒 𝑃𝑜𝑤𝑒𝑟 𝐼𝑛𝑗𝑒𝑐𝑡𝑖𝑜𝑛
�
𝑄1
⋮
𝑄𝑁𝑖______
⎭⎪⎬
⎪⎫
𝑅𝑒𝑐𝑡𝑖𝑣𝑒 𝑃𝑜𝑤𝑒𝑟 𝐼𝑛𝑗𝑒𝑐𝑡𝑖𝑜𝑛
�
𝑃𝐹1
⋮
𝑃𝐹𝑁𝑓______
⎭⎪⎬
⎪⎫
𝐴𝑐𝑡𝑖𝑣𝑒 𝐿𝑖𝑛𝑒 𝑃𝑜𝑤𝑒𝑟 𝐹𝑙𝑜𝑤
�
𝑄𝐹1
⋮
𝑄𝐹𝑁𝑓______
⎭⎪⎬
⎪⎫
𝑅𝑒𝑐𝑡𝑖𝑣𝑒 𝐿𝑖𝑛𝑒 𝑃𝑜𝑤𝑒𝑟 𝐹𝑙𝑜𝑤
�
𝜑1
⋮
𝜑𝑁𝜑______
⎭⎪⎬
⎪⎫
𝑃ℎ𝑎𝑠𝑒𝑠 𝐹𝑟𝑜𝑚 𝑃𝑀𝑈
⎦⎥⎥⎥⎥⎥⎥⎥⎥⎥⎥⎥⎥⎥⎥⎥⎥⎥⎥⎥⎥⎥⎥⎥⎥⎥⎥⎥⎥⎥⎥⎥⎥⎥⎥⎤
(𝑁𝑣+2𝑁𝑖+2𝑁𝑓+𝑁𝜑) × 1
�
For the non-linear functions relating measurement 𝑖 to the state vector, the power
injection and power flow equations, which are proven in previous chapter and in this
chapter, are considered. The equations can be summarized here as:

Chapter 3. Implementation of WLS State Estimation 30
⎩⎪⎪⎪⎪⎨
⎪⎪⎪⎪⎧𝑃ℎ = |𝑉ℎ| � |𝑉𝑘|(𝐺ℎ𝑘 cos 𝜃ℎ𝑘 + 𝐵ℎ𝑘 sin𝜃ℎ𝑘)
𝑁𝑏𝑢𝑠
𝑘=1
𝑄ℎ = |𝑉ℎ| � |𝑉𝑘|(𝐺ℎ𝑘 sin 𝜃ℎ𝑘 − 𝐵ℎ𝑘 cos𝜃ℎ𝑘)𝑁𝑏𝑢𝑠
𝑘=1
𝑃ℎ𝑘 = (𝑔ℎ𝑘 + 𝑔ℎ0)|𝑉�ℎ|2 − (𝑔ℎ𝑘 cos 𝜃ℎ𝑘 + 𝑏ℎ𝑘 sin𝜃ℎ𝑘)|𝑉�ℎ||𝑉�𝑘|
𝑄ℎ𝑘 = −(𝑏ℎ𝑘 + 𝑏ℎ0)|𝑉�ℎ|2�−(𝑔ℎ𝑘 sin 𝜃ℎ𝑘 − 𝑏ℎ𝑘 cos 𝜃ℎ𝑘) �|𝑉�ℎ||𝑉�𝑘|
�
3.3 Minimization Problem
For obtaining the states (voltages and related phases of the power system) from the
measurements, state estimation is applied to 𝒓 = 𝒛 − 𝒇(𝒙). So, the minimization problem
will be:
�𝑀𝐼𝑁 𝑱(𝒙) = 𝒓𝑻𝒓
𝑆.𝑇. 𝒓 = 𝒛 − 𝒇(𝒙)�
Which 𝑱(𝒙) is the objective function that is going to be minimized. The objective
function can be written as:
𝑱(𝒙) = [𝒛 − 𝒇(𝒙)]𝑻[𝒛 − 𝒇(𝒙)]
To minimize 𝑱(𝒙), its first derivative with respect to 𝒙 is equated to zero:
𝝏𝑱(𝒙)𝝏𝒙
= 𝟎
𝝏𝑱(𝒙)𝝏𝒙
=𝝏[𝒛𝑻𝒛 − 𝒛𝑻𝒇(𝒙) − 𝒇(𝒙)𝑻 𝒛 + 𝒇(𝒙)𝑻𝒇(𝒙)]
𝝏𝒙= −𝟐𝒛𝑻
𝝏𝒇(𝒙)𝝏𝒙
+ 𝟐𝒇(𝒙)𝑻𝝏𝒇(𝒙)𝝏𝒙
𝝏𝑱(𝒙)𝝏𝒙
= −𝟐[𝒛 − 𝒇(𝒙)]𝑻 �𝝏𝒇(𝒙)𝝏𝒙
�
The Jacobian matrix of 𝑱(𝒙) is defined by 𝒈(𝒙):
𝒈(𝒙) = �𝝏𝑱(𝒙)𝝏𝒙
�𝑻
= −𝟐 �𝝏𝒇(𝒙)𝝏𝒙
�𝑻
[𝒛 − 𝒇(𝒙)]
The Jacobian Matrix structure and equations of calculating its components will be
described in the next sub-section.

Chapter 3. Implementation of WLS State Estimation 31
The Hessian matrix of 𝑱(𝒙) is the second derivative with respect to 𝒙 and called Gain
Matrix:
𝑯(𝒙) =𝝏𝒈(𝒙)𝝏𝒙
= 𝟐 �𝝏𝒇(𝒙)𝝏𝒙
�𝑻
�𝝏𝒇(𝒙)𝝏𝒙
�
𝑯(𝒙) is symmetric, positive definite and is a matrix populated primarily with zeros (a
sparse matrix).
The Taylor Series expansion of the non linear function 𝒈(𝒙) around the state vector 𝑥𝑘
gives:
𝒈(𝒙) = 𝒈(𝒙𝒌) +𝝏𝒈(𝒙𝒌)𝝏𝒙
(𝒙 − 𝒙𝒌) + ⋯ = 𝟎
Considering the first order of Taylor Series expansion and neglecting the higher order
terms, directs us to an iterative solution of Gauss-Newton method:
𝒙𝑘+1 = 𝒙𝑘 − �𝜕𝒈(𝒙𝑘)𝜕𝒙� �
−1
𝒈(𝒙𝑘)
Where 𝑘 is the iteration index and 𝒙𝑘 is the state vector at iteration 𝑘. Supposing:
𝛥𝒙𝑘+1 = 𝒙𝑘+1 − 𝑥𝑘
We will have:
𝛥𝒙𝑘+1 = −[𝑯(𝒙𝑘)]−1𝒈(𝒙𝑘)
Finding the inverse of 𝑯(𝒙𝑘) in high dimensions for large networks can be an expensive
and time consuming operation. In such cases, instead of directly inverting the 𝑯(𝒙𝑘), it's
better to calculate the 𝛥𝒙𝑘+1 as the solution to the system of linear equations:
[𝑯(𝒙𝑘)]𝛥𝒙𝑘+1 = −𝒈(𝒙𝑘)
[𝑯(𝒙𝑘)]𝛥𝒙𝑘+1 = 2 �𝜕𝒇(𝒙𝑘)𝜕𝒙
�𝑇
[𝒛 − 𝒇(𝒙𝑘)]
This can be solved by triangular factorization techniques, like the Cholesky factorization.
The set of equation given by [𝑯(𝒙𝑘)]𝛥𝒙𝑘+1 is also mentioned as the Normal Equations.

Chapter 3. Implementation of WLS State Estimation 32
3.3.1 Jacobian Matrix structure and components
According to the measurement vector structure, the Jacobian matrix will be in the
following form:
𝒈 =
⎣⎢⎢⎢⎢⎢⎢⎢⎢⎢⎢⎢⎢⎢⎢⎢⎢⎢⎡�
𝒈𝟏𝟏 � �
𝒈𝟏𝟐 �
� 𝒈𝟐𝟏 � �
𝒈𝟐𝟐 �
� 𝒈𝟑𝟏 � �
𝒈𝟑𝟐 �
� 𝒈𝟒𝟏 � �
𝒈𝟒𝟐 �
� 𝒈𝟓𝟏 � �
𝒈𝟓𝟐 �
� 𝒈𝟔𝟏 � �
𝒈𝟔𝟐 �
⎦⎥⎥⎥⎥⎥⎥⎥⎥⎥⎥⎥⎥⎥⎥⎥⎥⎥⎤
Where the sub-matrices is described in the following:
• 𝒈𝟏𝟏 is the Derivative of Voltage Magnitudes with respect to angles:
𝒈𝟏𝟏 =𝜕|𝑉�|𝜕𝜃
= �0 ⋯ 0⋮ ⋱ ⋮0 ⋯ 0
�𝑁𝑣×(𝑁𝑏𝑢𝑠−1)
All the elements are zero.
• 𝒈𝟏𝟐 is the derivative of Voltage Magnitudes with respect to Voltage Magnitudes:
𝒈𝟏𝟐 =𝜕|𝑉�|𝜕|𝑉�|
= �
1 0 0 …0 1 0 …0 0 1 …⋮ ⋮ ⋮ ⋱
�
𝑁𝑣×(𝑁𝑏𝑢𝑠)
All the elements are zero except the diagonals that are one.
• 𝒈𝟐𝟏 is the derivative of Real Power Injections with respect to Angles:

Chapter 3. Implementation of WLS State Estimation 33
𝒈𝟐𝟏 =𝜕𝑃𝜕𝜃
=
⎣⎢⎢⎢⎢⎡𝜕𝑃1𝜕𝜃2
⋯ 𝜕𝑃1
𝜕𝜃𝑁𝑏𝑢𝑠⋮ ⋱ ⋮
𝜕𝑃𝑁𝑝𝑖𝜕𝜃2
⋯𝜕𝑃𝑁𝑝𝑖𝜕𝜃𝑁𝑏𝑢𝑠⎦
⎥⎥⎥⎥⎤
𝑁𝑝𝑖×(𝑁𝑏𝑢𝑠−1)
Equations for calculation of 𝒈𝟐𝟏 components:
𝜕𝑃𝑘𝜕𝜃𝑘
= −𝐵𝑘𝑘|𝑉�𝑘|2 + ��𝑉�𝑗�(−𝐺𝑘𝑗 sin 𝜃𝑘𝑗 + 𝐵𝑘𝑗 cos 𝜃𝑘𝑗)𝑁𝑏𝑢𝑠
𝑗=1
𝜕𝑃𝑘𝜕𝜃𝑗
= |𝑉�𝑘|�𝑉�𝑗�(𝐺𝑘𝑗 sin𝜃𝑘𝑗 − 𝐵𝑘𝑗 cos 𝜃𝑘𝑗)
• 𝒈𝟐𝟐 is the derivative of Real Power Injections with respect to Voltage
Magnitudes:
𝒈𝟐𝟐 =𝜕𝑃𝜕|𝑉�|
=
⎣⎢⎢⎢⎢⎡𝜕𝑃1𝜕|𝑉�1|
⋯ 𝜕𝑃1
𝜕�𝑉�𝑁𝑏𝑢𝑠�⋮ ⋱ ⋮
𝜕𝑃𝑁𝑝𝑖𝜕|𝑉�1|
⋯𝜕𝑃𝑁𝑝𝑖𝜕�𝑉�𝑁𝑏𝑢𝑠�⎦
⎥⎥⎥⎥⎤
𝑁𝑝𝑖×(𝑁𝑏𝑢𝑠)
Equations for calculation of 𝒈𝟐𝟐 components:
𝜕𝑃𝑘𝜕|𝑉�𝑘|
= 𝐺𝑘𝑘|𝑉�𝑘| + ��𝑉�𝑗�(𝐺𝑘𝑗 cos 𝜃𝑘𝑗 + 𝐵𝑘𝑗 sin𝜃𝑘𝑗)𝑛
𝑗=1
𝜕𝑃𝑘𝜕�𝑉�𝑗�
= |𝑉�𝑘|(𝐺𝑘𝑗 cos𝜃𝑘𝑗 + 𝐵𝑘𝑗 sin𝜃𝑘𝑗)
• 𝒈𝟑𝟏 is the derivative of Reactive Power Injections with respect to Angles:
𝒈𝟑𝟏 =𝜕𝑄𝜕𝜃
=
⎣⎢⎢⎢⎢⎡𝜕𝑄1𝜕𝜃2
⋯ 𝜕𝑄1𝜕𝜃𝑁𝑏𝑢𝑠
⋮ ⋱ ⋮𝜕𝑄𝑁𝑞𝑖𝜕𝜃2
⋯𝜕𝑄𝑁𝑞𝑖𝜕𝜃𝑁𝑏𝑢𝑠⎦
⎥⎥⎥⎥⎤
𝑁𝑞𝑖×(𝑁𝑏𝑢𝑠−1)
Equations for calculation of 𝒈𝟑𝟏 components:

Chapter 3. Implementation of WLS State Estimation 34
𝜕𝑄𝑘𝜕𝜃𝑘
= −𝐺𝑘𝑘|𝑉�𝑘|2 + ��𝑉�𝑗�(𝐺𝑘𝑗 cos 𝜃𝑘𝑗 + 𝐵𝑘𝑗 sin𝜃𝑘𝑗)𝑛
𝑗=1
𝜕𝑄𝑘𝜕𝜃𝑗
= −|𝑉�𝑘|�𝑉�𝑗�(𝐺𝑘𝑗 cos 𝜃𝑘𝑗 + 𝐵𝑘𝑗 sin𝜃𝑘𝑗)
• 𝒈𝟑𝟐 is the derivative of Reactive Power Injections with respect to Voltage
Magnitudes:
𝒈𝟑𝟐 =𝜕𝑄𝜕|𝑉�|
=
⎣⎢⎢⎢⎢⎡𝜕𝑄1𝜕|𝑉�1|
⋯ 𝜕𝑄1
𝜕�𝑉�𝑁𝑏𝑢𝑠�⋮ ⋱ ⋮
𝜕𝑄𝑁𝑞𝑖𝜕|𝑉�1|
⋯𝜕𝑄𝑁𝑞𝑖𝜕�𝑉�𝑁𝑏𝑢𝑠�⎦
⎥⎥⎥⎥⎤
𝑁𝑞𝑖×(𝑁𝑏𝑢𝑠)
Equations for calculation of 𝒈𝟑𝟐 components:
𝜕𝑄𝑘𝜕|𝑉�𝑘|
= −𝐵𝑘𝑘|𝑉�𝑘| + ��𝑉�𝑗�(𝐺𝑘𝑗 sin𝜃𝑘𝑗 − 𝐵𝑘𝑗 cos 𝜃𝑘𝑗)𝑛
𝑗=1
𝜕𝑄𝑘𝜕�𝑉�𝑗�
= |𝑉�𝑘|(𝐺𝑘𝑗 sin𝜃𝑘𝑗 − 𝐵𝑘𝑗 cos 𝜃𝑘𝑗)
• 𝒈𝟒𝟏 is the derivative of Real Power Flows with respect to Angles:
𝒈𝟒𝟏 =𝜕𝑃𝑓𝑙𝜕𝜃
=
⎣⎢⎢⎢⎢⎡𝜕𝑃𝑓𝑙1𝜕𝜃2
⋯ 𝜕𝑃𝑓𝑙1𝜕𝜃𝑁𝑏𝑢𝑠
⋮ ⋱ ⋮𝜕𝑃𝑓𝑙𝑁𝑝𝑓𝜕𝜃2
⋯𝜕𝑃𝑓𝑙𝑁𝑝𝑓𝜕𝜃𝑁𝑏𝑢𝑠 ⎦
⎥⎥⎥⎥⎤
𝑁𝑝𝑓×(𝑁𝑏𝑢𝑠−1)
Equations for calculation of 𝒈𝟒𝟏 components:
𝜕𝑃𝑓𝑙ℎ𝑘𝜕𝜃ℎ
= |𝑉�ℎ||𝑉�𝑘|(𝑔ℎ𝑘 sin𝜃ℎ𝑘 − 𝑏ℎ𝑘 cos 𝜃ℎ𝑘)
𝜕𝑃𝑓𝑙ℎ𝑘𝜕𝜃𝑘
= −|𝑉�ℎ||𝑉�𝑘|(𝑔ℎ𝑘 sin𝜃ℎ𝑘 − 𝑏ℎ𝑘 cos𝜃ℎ𝑘)
• 𝒈𝟒𝟐 is the derivative of Real Power Flows with respect to Voltage Magnitudes:

Chapter 3. Implementation of WLS State Estimation 35
𝒈𝟒𝟐 =𝜕𝑃𝑓𝑙𝜕|𝑉�|
=
⎣⎢⎢⎢⎢⎡𝜕𝑃𝑓𝑙1𝜕|𝑉�1|
⋯ 𝜕𝑃𝑓𝑙1
𝜕�𝑉�𝑁𝑏𝑢𝑠�⋮ ⋱ ⋮
𝜕𝑃𝑓𝑙𝑁𝑝𝑓𝜕|𝑉�1|
⋯𝜕𝑃𝑓𝑙𝑁𝑝𝑓𝜕�𝑉�𝑁𝑏𝑢𝑠�⎦
⎥⎥⎥⎥⎤
𝑁𝑝𝑓×(𝑁𝑏𝑢𝑠)
Equations for calculation of 𝒈𝟒𝟐 components:
𝜕𝑃𝑓𝑙ℎ𝑘𝜕|𝑉�ℎ|
= −|𝑉�𝑘|(𝑔ℎ𝑘 cos 𝜃ℎ𝑘 + 𝑏ℎ𝑘 sin𝜃ℎ𝑘) + 2(𝑔ℎ𝑘 + 𝑔ℎ0)|𝑉�ℎ|
𝜕𝑃𝑓𝑙ℎ𝑘𝜕|𝑉�𝑘|
= −|𝑉�ℎ|(𝑔ℎ𝑘 cos 𝜃ℎ𝑘 + 𝑏ℎ𝑘 sin𝜃ℎ𝑘)
• 𝒈𝟓𝟏 is the derivative of Reactive Power Flows with respect to Angles:
𝒈𝟓𝟏 =𝜕𝑄𝑓𝑙𝜕𝜃
=
⎣⎢⎢⎢⎢⎡𝜕𝑄𝑓𝑙𝜕𝜃2
⋯ 𝜕𝑄𝑓𝑙1𝜕𝜃𝑁𝑏𝑢𝑠
⋮ ⋱ ⋮𝜕𝑄𝑓𝑙𝑁𝑞𝑓𝜕𝜃2
⋯𝜕𝑄𝑓𝑙𝑁𝑞𝑓𝜕𝜃𝑁𝑏𝑢𝑠 ⎦
⎥⎥⎥⎥⎤
𝑁𝑞𝑓×(𝑁𝑏𝑢𝑠−1)
Equations for calculation of 𝒈𝟓𝟏 components:
𝜕𝑄𝑓𝑙ℎ𝑘𝜕𝜃ℎ
= −|𝑉�ℎ||𝑉�𝑘|(𝑔ℎ𝑘 cos 𝜃ℎ𝑘 + 𝑏ℎ𝑘 sin𝜃ℎ𝑘)
𝜕𝑄𝑓𝑙ℎ𝑘𝜕𝜃𝑘
= |𝑉�ℎ||𝑉�𝑘|(𝑔ℎ𝑘 cos 𝜃ℎ𝑘 + 𝑏ℎ𝑘 sin𝜃ℎ𝑘)
• 𝒈𝟓𝟐 is the derivative of Reactive Power Flows with respect to Voltage
Magnitudes:
𝒈𝟓𝟐 =𝜕𝑄𝑓𝑙𝜕|𝑉�|
=
⎣⎢⎢⎢⎢⎡𝜕𝑄𝑓𝑙1𝜕|𝑉�1|
⋯ 𝜕𝑄𝑓𝑙1𝜕�𝑉�𝑁𝑏𝑢𝑠�
⋮ ⋱ ⋮𝜕𝑄𝑓𝑙𝑁𝑞𝑓𝜕|𝑉�1|
⋯𝜕𝑄𝑓𝑙𝑁𝑞𝑓𝜕�𝑉�𝑁𝑏𝑢𝑠�⎦
⎥⎥⎥⎥⎤
𝑁𝑞𝑓×(𝑁𝑏𝑢𝑠)
Equations for calculation of 𝒈𝟓𝟐 components:

Chapter 3. Implementation of WLS State Estimation 36
𝜕𝑄𝑓𝑙ℎ𝑘𝜕|𝑉�ℎ|
= −|𝑉�𝑘|(𝑔ℎ𝑘 sin 𝜃ℎ𝑘 − 𝑏ℎ𝑘 cos 𝜃ℎ𝑘) − 2(𝑏ℎ𝑘 + 𝑏ℎ0)|𝑉�ℎ|
𝜕𝑄𝑓𝑙ℎ𝑘𝜕|𝑉�𝑘|
= −|𝑉�ℎ|(𝑔ℎ𝑘 sin 𝜃ℎ𝑘 − 𝑏ℎ𝑘 cos 𝜃ℎ𝑘)
• 𝒈𝟔𝟏 is the derivative of PMU Angles with respect to Angles:
𝒈𝟔𝟏 =𝜕𝜃𝜕𝜃
= �𝑎𝑙𝑙 𝑧𝑒𝑟𝑜𝑠𝑒𝑥𝑐𝑒𝑝𝑡
𝑜𝑛𝑒 (−1) 𝑖𝑛 𝑒𝑎𝑐ℎ 𝑟𝑜𝑤�
𝑁𝜃×(𝑁𝑏𝑢𝑠−1)
In each row there is only a (-1) corresponding to the PMU bus
number and the other elements are zero.
• 𝒈𝟔𝟐 is the derivative of PMU Angles with respect to Voltage Magnitudes:
𝒈𝟔𝟐 =𝜕𝜃𝜕|𝑉�|
= �0 ⋯ 0⋮ ⋱ ⋮0 ⋯ 0
�𝑁𝜃×(𝑁𝑏𝑢𝑠)
All the elements are zero.
3.4 Minimization Problem Considering the Measurements Uncertainty
In realistic networks, all the measurements are not accurate and have deviation from the
real values. Besides some values of measurement vector 𝑧 are not practically measured
and some predictive statistics and history are used to determine them (e.g. some power
fluxes) [Valenzuela 2000]. So the measurements are depend upon uncertain quantities
and can be considered as random variables.
To extract the states of the system (voltages and related phases) from the measurements,
Weighted Least Squares (WLS) estimation is applied to �𝒛 − 𝒇(𝑥)�. WLS state
estimation will minimize the weighted sum of the squares of the measurement residuals.
𝒛 = �
𝑧1𝑧2⋮𝑧𝑚
� = �
𝑓1(𝑥1, … , 𝑥𝑛)𝑓2(𝑥1, … , 𝑥𝑛)
⋮𝑓𝑚(𝑥1, … , 𝑥𝑛)
�+ �
𝑟1𝑟2⋮𝑟𝑚
� = 𝒇(𝑥) + 𝒓

Chapter 3. Implementation of WLS State Estimation 37
The minimization problem will be:
�𝑀𝐼𝑁 𝑱(𝒙) = 𝒓𝑻 𝜮𝒛−𝟏 𝒓
𝑆.𝑇. 𝒓 = 𝒛 − 𝒇(𝑥)�
The 𝜮𝒛 is the variance-covariance matrix of measurement errors. Its inverse represents
the weighting matrix that is the inverse of measurement covariance matrix. The elements
of weighting matrix 𝜮𝒛−1 cause to be connected with the influence of measurements
[Huang 2003].
𝜮𝒛 = 𝑐𝑜𝑣(𝒓) = 𝐸[𝒓.𝒓𝑇]
𝜮𝒛−𝟏 =
⎣⎢⎢⎡𝜎1
2 0 ⋯ 00⋮
𝜎22
⋱⋮0
0 ⋯ 0 𝜎𝑚2 ⎦⎥⎥⎤−1
Which 𝜎𝑚2 is the variance, and 𝜎𝑚 is the standard deviation of 𝑚𝑡ℎ measurement.
Standard deviation of each measurement is deliberated to reflect the expected accuracy of
the corresponding meter used.
The objective function can be written as:
𝑱(𝑥) = [𝒛 − 𝒇(𝑥)]𝑇𝜮𝒛−𝟏[𝒛 − 𝒇(𝑥)]
For minimization, the first derivative with respect to 𝑥 is equated to zero:
𝜕𝑱(𝒙)𝜕𝒙
= 0
The Jacobian matrix of 𝑱(𝒙) is defined by 𝒈(𝒙):
𝒈(𝑥) = �𝝏𝑱(𝒙)𝝏𝒙
�𝑇
= −2 �𝝏𝒇(𝒙)𝝏𝒙
�𝑇
𝜮𝒛−𝟏[𝒛 − 𝒇(𝒙)] = 0
All the proofs for 𝒈(𝒙) can be found in the appendices.
The Hessian matrix of 𝑱(𝒙) is the second derivative with respect to 𝒙:
𝑯(𝒙) =𝝏𝒈(𝒙)𝝏𝒙
≅ 𝟐 �𝝏𝒇(𝒙)𝝏𝒙
�𝑻
𝜮𝒛−𝟏 �𝝏𝒇(𝒙)𝝏𝒙
�
All the proofs for 𝑯(𝒙) also can be found in the appendices.

Chapter 3. Implementation of WLS State Estimation 38
The Taylor Series expansion of the non linear function 𝒈(𝒙) around the state vector 𝒙𝑘
gives:
𝒈(𝒙) = 𝒈(𝒙𝑘) +𝜕𝒈(𝒙𝑘)𝜕𝒙
(𝒙 − 𝒙𝑘) + ⋯ = 0
Considering the first order of Taylor Series expansion and neglecting the higher order
terms, directs us to an iterative solution of Gauss-Newton method:
𝒙𝑘+1 = 𝒙𝑘 − �𝜕𝒈(𝒙𝑘)𝜕𝒙
�−1𝒈(𝒙𝑘)
Where 𝑘 is the iteration index and 𝑥𝑘 is the state vector at iteration 𝑘. Supposing:
𝜟𝒙𝑘+1 = 𝒙𝑘+1 − 𝒙𝑘
We will have:
𝜟𝒙𝑘+𝟏 = −[𝑯(𝒙𝑘)]−𝟏𝒈(𝒙𝑘)
𝑯(𝒙𝑘) is symmetric, positive definite, sparse matrix and called the Gain Matrix. Finding
the inverse of 𝑯(𝒙𝑘) in high dimensions for large networks can be an expensive and time
consuming operation. In such cases, instead of directly inverting the 𝑯(𝒙𝑘), it's better to
calculate the 𝛥𝒙𝑘+1 as the solution to the system of linear equations:
[𝑯(𝒙𝑘)]𝜟𝒙𝑘+𝟏 = −𝒈(𝒙𝑘)
[𝑯(𝒙𝑘)]𝜟𝒙𝑘+𝟏 = 𝟐 �𝝏𝒇(𝒙𝑘)𝝏𝒙
�𝑻
𝜮𝒛−𝟏[𝒛 − 𝒇(𝒙𝑘)]
This can be solved by Cholesky factorization. The set of equation given by
[𝑯(𝒙𝑘)]𝜟𝒙𝑘+𝟏 is also mentioned as the Normal Equations.
The conditions for stopping the iterations are firstly if the number of iterations is enough
or the difference in two successive state variables is less than a satisfactory tolerance, i.e.
max|𝛥𝒙𝑘+1| < 𝑇𝑜𝑙𝑒𝑟𝑎𝑛𝑐𝑒.
The variance covariance matrix of the estimates can be extracted by:
𝜮𝒙 = ��𝝏𝒇(𝒙)𝝏𝒙
�𝑻
𝜮𝒛−𝟏 �𝝏𝒇(𝒙)𝝏𝒙
��
−𝟏

Chapter 3. Implementation of WLS State Estimation 39
As it can be seen in the last equation, the parameters uncertainty does not have any
contribution to the computation of variance covariance matrix of the estimates. In the
next chapter a method is proposed to consider both the contribution of measurement and
parameters uncertainty on variance covariance matrix of estimates.

CHAPTER 5
4 Algorithm Development
he flowchart of implementation is depicted in Figure 4.1. In the following, the sub-
blocks and the steps are described in detail.
T

Chapter 5. Algorithm Development 41
Figure 4.1 Flowchart of the Algorithm Implementation

Chapter 5. Algorithm Development 42
4.1 Parameters Model
In our study, nominal values of resistance, reactance and susceptance characterizing the
network elements are randomly perturbed extracting their values from a multivariate
Gaussian distribution. The mean vector µ of the distribution was represented by the
nominal values of the parameters, and the variance-covariance matrix was build
considering a standard deviation as a fixed percentage α of the nominal value, i.e. for the
ith parameter σi = α × µi and assigning a prescribed correlation coefficient ρij for each
couple i,j of parameters. Furthermore the parameters with zero nominal values were not
perturbed.
Since all these parameters, for physical reason, are defined by positive real numbers, it is
important to avoid perturbations so wide resulting in negative parameters. For this
reasons it was evaluated the probability to get negative results for such extraction for
standard deviations less than 25% of the nominal values. Surprisingly it was found that
this probability is independent from the nominal values but it is just a function of α. The
authors were not able to find in literature a demonstration of such a property of the
Normal multivariate distribution but we just verified this property numerically computing
the probability P of getting at least one negative value among N parameter as:
𝑷 = 𝑷(𝛂) = 𝒑 ��(𝝅𝒊 ≤ 𝟎)𝑵
𝒊=𝟏
� =
= � 𝒑{𝝅𝒊 ≤ 𝟎}𝑵
𝒊=𝟏−� � 𝒑�(𝝅𝒊 ≤ 𝟎)��𝝅𝒋 ≤ 𝟎��
𝑵
𝒋=𝒊
𝑵
𝒊=𝟏+
+ � � � 𝒑�(𝝅𝒊 ≤ 𝟎)��𝝅𝒋 ≤ 𝟎��(𝝅𝒌 ≤ 𝟎)�𝑵
𝒌=𝒋
𝑵
𝒋=𝒊
𝑵
𝒊=𝟏+ (−𝟏)𝑵+𝟏𝒑 ��(𝝅𝒊 ≤ 𝟎)
𝑵
𝒊=𝟏
�
The probability of the intersecting events in the previous equation was computed
marginalizing the known multivariate Normal distribution, e.g. the probability of the
event 𝑝�(𝜋𝑖 ≤ 0)⋂(𝜋𝑗 ≤ 0)⋂(𝜋𝑘 ≤ 0)� was computed as:
𝒑 �(𝝅𝒊 ≤ 𝟎)��𝝅𝒋 ≤ 𝟎��(𝝅𝒌 ≤ 𝟎)� = � � � 𝑵(𝝅𝒊,𝝅𝒋,𝝅𝒌)𝒅𝝅𝒊𝒅𝝅𝒋𝒅𝝅𝒌𝟎
−∞
𝟎
−∞
𝟎
−∞
with

Chapter 5. Algorithm Development 43
𝑁�𝜋𝑖,𝜋𝑗 ,𝜋𝑘� = � 𝑁(𝜋1, … ,𝜋𝑁) � 𝑑𝜋𝑚
𝑁
𝑚≠𝑖,𝑗,𝑘ℝ𝑁−3
and N(•) being the multivariate Normal probability density function.
As a numeric example, let’s consider the values of network parameters in IEEE 14 bus
test case. With a parameter standard deviation of 0.25 which is the greatest standard
deviation used in the simulations of this paper, the probability of reaching to a negative
number for resistance, reactance or susceptance will be 𝑃 = 0.5 × 10⁻⁵ that is negligible
for the number of Monte Carlo trials we have considered. Practically, in the simulations
if a negative value is observed, until getting a positive value, the program will repeat the
parameter perturbation, without affecting the parameters probability density function.
4.2 Sub-blocks Details
4.2.1 Newton Raphson Load Flow
The realistic parameters along with the power injections are used to get the actual states
which are the voltage and phases of power network for each bus using power flow
solution by Newton Raphson (NR) method [Tinney 1967]. Since 1970s the load flow
methods continue to develop and among them the most successful is the Fast Decoupled
method [Wood 1996]. Comparing with the NR method, this method is faster and simpler
and more efficient algorithmically and needs less storage, but it may fail to converge
when some of the basic assumptions do not hold. Therefore the NR load flow is chosen
because it is the most robust power flow algorithm that widely used in practice.
The states that are generated by NR load flow are used for the next part that is the
calculation of exact measurement data. NR states are also taken as the reference (actual
states) for comparing the results of State Estimator afterwards.
4.2.2 Calculation of Measurement Quantities
The exact measurement data can be calculated using Newton-Raphson load flow states to
extract the measured quantities. To convert the exact measurement data to realistic

Chapter 5. Algorithm Development 44
measurement data (which always affected by uncertainty), Normal random numbers with
zero mean and variances according to the measurement devices’ uncertainty are added.
4.2.3 WLS State Estimation
In the last stage the nominal network parameters and the realistic (perturbed)
measurement data are used as inputs to WLS State Estimator to get the State Estimator’s
states and compared to the NR states to get the State Estimation Error.
4.3 Monte Carlo Procedure
Monte Carlo simulation method is based on probability and statistics theory and
methodology. For numerical problems in a large number of dimensions, Monte Carlo
experiments are often more efficient than conventional numerical methods on the other
hand Monte Carlo experiments needs sampling from high dimensional probability
distributions [Hastings 1970]. In Monte Carlo simulation method, the state of each
component in the system is determined by sampling [Wang 2009]. Monte Carlo
experiments rely on repeated random sampling to compute their results when it is
infeasible to compute an exact result with a deterministic algorithm.
In this thesis the uncertainty analysis is performed by Monte Carlo simulation and the
steps are described more in detail in the following:
Step1: Read and preprocess the data:
The data pertaining to network parameters (transmission line’s nominal data),
measurement locations and the standard deviations of measurement instruments
are read. The nominal bus admittance matrix is built.
Step2: Repeat for 𝑖 = 𝟏 to 𝑃 sigmas defined per parameters uncertainty (sampling
of parameters noise):
1. Repeat for j=1 to MC_tests defined per maximum number of Monte Carlo
trials:
I. Perturb each of the parameters by 𝑖𝑡ℎ sigma.
II. Repeat I if we get negative values.

Chapter 5. Algorithm Development 45
III. Create the perturbed bus admittance matrix using perturbed network
parameters.
IV. Perform Newton-Raphson load flow using bus power injections and
perturbed bus admittance matrix and collect NR states.
V. Calculate the exact measurement data using NR states, perturbed bus
admittance matrix and measurement locations.
VI. Perform WLS State Estimation (SE) using the nominal bus admittance
matrix and perturbed measurements and collect the SE states.
VII. Subtract the NR states from SE states to get the SE error.
2. Calculate the RMS of SE errors and the standard deviations for all Monte
Carlo trials.
Step3: Show the results using statistical indices.
In the next chapter, the algorithm is implemented on different IEEE power test cases and
the numerical results are shown.

CHAPTER 6
5 Simulation Results
o analyze the effects of parameter and measurement uncertainties on the power
system state estimation results, the algorithm is tested on several IEEE power
network test cases such as: 14-bus, 30-bus, 57-bus and 118-bus test cases. The network
data files can be downloaded from Power Systems Test Case Archive in [Christie 1999].
In the following sections firstly it is briefly described that how the measurement set is
chosen and then the general criteria for evaluation of simulation results are defined.
Finally for each IEEE test case, the inputs (network data and measurements) are reported
and the simulations results are shown.
For each test case a set of measurement chosen to avoid an unobservable network.
Degree of redundancy (η) is generally expressed as the ratio of number of meters by the
number of states and is a very important quantity because the more redundant
measurements, the more chances for bad data to be detected [Clements 1988]. The
measurement redundancy ratio is defined by:
η =Number of Measurements
Number of States
T

Chapter 6. Simulation Results 47
Which the number of states is (2𝑁𝑏𝑢𝑠 − 1) for 𝑁𝑏𝑢𝑠 network buses. In fact for practical
implementation, there should be enough redundancy in measurement all over the network
[Pajic 2007].
The measurement set is chosen by calculating “perfect measurements” from the data
available (IEEE test cases come with both network parameters and true states). The
measurement set includes almost all the PV buses (voltage and power injection
measurements) together with some active and reactive power flow measurements.
Choosing of measurement locations are inspired from the literature; for instance for IEEE
14-bus from [Lukomski 2008] [Baran 1995], for IEEE 30-bus from [Kerdchuen 2009],
for IEEE 57-bus from [Chen 2006] and for IEEE 118-bus from [Rakpenthai 2005]. Some
of them altered by the author because of algorithm stability issues according to the
experience.
In reality, actual measurements are not exact and there is a level of uncertainty present in
the measurements. Therefore measurement error must be considered. For instance for the
test cases, the uncertainty for of voltage measurement considered as 0.1 percent of read
value and for power measurement considered as 1 percent of read value:
• 𝜎𝑉 = 0.001
• 𝜎𝑃𝑖𝑛𝑗 = 𝜎𝑄𝑖𝑛𝑗 = 𝜎𝑃𝑓𝑙 = 𝜎𝑄𝑓𝑙 = 0.01
These quantities represent the expected accuracy of the meters used and are expressed in
the diagonal elements of the weighting matrix since measurement errors are considered
independent.
In the simulations, the following samples of uncertainty for network parameters are
assigned:
• 𝜎𝑝𝑎𝑟𝑎𝑚 = 0.00, 0.05, 0.10, 0.15, 0.20 and 0.25.
The number of Monte Carlo trials is chosen so that the population of samples is sufficient
amount and experimentally it is seen that, for each parameter uncertainty, 1000 Monte
Carlo Trials are sufficient for our analysis. Besides, for most of our simulations the
increase of trials does not affect the results remarkably or extraordinary but for some of
the test cases, the trials are increased up to 5000 to have more reliable data (in the
simulations any change in the number of trials are reported clearly).

Chapter 6. Simulation Results 48
For each network parameter uncertainty, the following actions are done:
The developed algorithm that described in previous chapter is run on test cases.
Thus for 𝑁𝑀𝐶 Monte Carlo Trials, 𝑁𝑀𝐶 values for each state are extracted.
Then all of these values are formed a new matrix of size 𝑁𝑀𝐶 × 𝑁𝑏𝑢𝑠 for voltage
magnitude and another matrix of size 𝑁𝑀𝐶 × (𝑁𝑏𝑢𝑠 − 1) for angles.
Then for each state, the mean is computed (mean of each column).
Finally the mean and standard deviation of all the buses is computed.
The mean and standard deviation of voltage magnitudes and angles of each IEEE test
case are used in order to evaluate the State Estimator’s output accuracy according to the
criteria that is described in the next section.
5.1 General Criteria for Evaluation of the Simulation Results
In this section a general criteria is defined according to the desirable properties of a
power state estimator, to evaluate the simulation results. These measures include
evaluation of the mean and standard deviation, biasness and root mean square of state
estimator.
In addition, another simulation is performed to show how much the State Estimator’s
results are mutually connected to each other taking into account that there exists network
parameters uncertainty. The simulations are also repeated for the test networks including
PMU measurement data.
5.1.1 Mean and Standard Deviation of State Estimator
The error bars plots are used to illustrate the mean and standard deviation of voltage
magnitude and voltage angles versus all the network parameters uncertainty samples.
Please note that the states are shown separately in two different figures and the voltage
magnitudes are in Per Unit and the angles are in degrees.
As already described, in WLS State Estimation the theoretical standard deviations of
State Estimator errors can be extracted by taking the square root of the diagonal elements

Chapter 6. Simulation Results 49
of the variance covariance matrix of the estimates. In the figures the distribution of the
theoretical standard deviations are depicted as two horizontal lines (1𝜎 above and below
the mean).
As will be seen, in the figures the mean of errors for both voltage magnitudes and angles
don’t start from zero that it implies the effect of the measurement uncertainty.
5.1.2 Bias Test for State Estimator
Another important analysis that can be performed is to check for which network
parameters uncertainties the State Estimator is biased. It is done by using the ratio of
absolute value of voltage error Means by the related Standard Deviations versus the
network parameters uncertainty.
To determine if the State Estimator is biased or not, a threshold can be defined. To have a
vision of this threshold, a horizontal dashed line is also depicted in the figures. It means
that the state estimator is not biased for the network parameters uncertainty range below
this line. To illustrate the dashed line, the value of the Mean of state errors over the
standard deviation is calculated by performing a hypothesis testing considering the
threshold.
5.1.3 Correlation of State Estimator’s Errors
This analysis is intended to show how much the State Estimator’s results are mutually
connected to each other taking into account that there exists network parameters
uncertainty. The State Estimator’s Error correlation coefficient matrix describes the
normalized measure of the strength of linear relationship between State Estimator’s
Errors. Correlation coefficients are given by:
𝑅(𝑖, 𝑗) =𝐶𝑜𝑣_𝑆𝐸(𝑖, 𝑗)
�𝐶𝑜𝑣_𝑆𝐸(𝑖, 𝑖)𝐶𝑜𝑣_𝑆𝐸(𝑗, 𝑗)
where 𝐶𝑜𝑣_𝑆𝐸 is the covariance matrix of State Estimator’s errors. The diagonals of
Correlation coefficients matrix are equal to 1 and the other elements of correlation
coefficients matrix will be in the range between -1 to 1.
For each network case, the correlation coefficients of State Estimator’s errors are plotted
versus parameters uncertainty for Voltage errors and Phase errors.

Chapter 6. Simulation Results 50
The values close to 0 suggest there is no linear relationship between the data. Values
close to 1 suggest that there is a positive linear relationship between the data and the
values close to -1 suggest that there is a negative linear relationship between the data
(anti-correlation).
5.1.4 Parameter’s Correlation Effect
Another analysis about the correlation effect that is performed in this section is the
evaluation effects of parameter’s correlation on different IEEE test cases.
For this aim, firstly the nominal values of line resistances are correlated with a correlation
coefficient (the line resistances with zero nominal values were not correlated).
Then the ratio of the mean of voltage magnitudes errors (and angles errors separately) by
standard deviations for each test case is displayed versus the network parameter
uncertainties.
Having parameters correlated, a threshold again is set by a horizontal dashed line in the
figures to determine if the State Estimator is biased or not.
5.1.5 The Results with PMU
In this analysis, the bias testing of State Estimator is performed when PMU
measurements are also included in the measurement set.

Chapter 6. Simulation Results 51
5.2 Test of Algorithm on IEEE 14-Bus Case
The one-line diagram of the IEEE 14-Bus test case with measurement locations is
illustrated in Figure 5.1. This network has been used in many references that are cited in
this thesis and in many examples during the research. The original network and data files
can be found in [Christie 1999].
Figure 5.1 IEEE 14-Bus Test Case with Measurement locations
For not experiencing the observability problem, totally 41 measurements are selected. For
14 buses, there are (2 × 14 − 1) states, so the measurement redundancy ratio will be:
η ≈ 1.5
The measurement set for this test case almost includes all the PV buses (voltage and
power injection measurements) together with some power flow measurements as the
following:
• Voltage magnitudes at buses 1, 2, 3, 6 and 8.
• 9 active and reactive power injections at buses 1, 2, 6, 8, 9, 10, 11, 12 and 14.
• 9 active and reactive power flows on branches 1–2, 1–5, 2–3, 2–4, 3–4, 4–5, 4–7,
5–6, and 6–13.
For each 𝜎𝑝𝑎𝑟𝑎𝑚, the actions that are done could be summarized as:
The developed algorithm that described in previous chapter is run on this test
case. Thus 1000 values for each state are extracted which divided into one matrix
G
C
G
C
C
1
5
6
2
3
4
8 7
9
10 11
14
13
12
Generators
Synchronous Condensers
G
C
Bus voltage measurement Power injection measurement Power flow measurement

Chapter 6. Simulation Results 52
of 1000 by 14 for voltage magnitude and another matrix of size 1000 by 13 for
phases.
Then for each state, the mean is computed.
Then the mean and standard deviation of all buses for each parameter uncertainty
is computed.
5.2.1 Mean and Standard Deviation of State Estimator
The error bars plots for mean and standard deviation of voltage magnitude and voltage
angles versus all the network parameters uncertainty samples are shown respectively in
Figure 5.2 and Figure 5.3.
Figure 5.2 Mean and Standard Deviation of Voltage Magnitude Errors for IEEE 14-Bus test case.
0 0.05 0.1 0.15 0.2 0.250
0.002
0.004
0.006
0.008
0.01
0.012std(V errors)
Mea
n of
sta
ndar
d de
viat
ions
of V
olta
ge e
rrors
Parameters Standard Deviations

Chapter 6. Simulation Results 53
Figure 5.3 Mean and Standard Deviation of Voltage Angle Errors for IEEE 14-Bus test case.
In the figures the mean of errors for both voltage magnitudes and angles don’t start from
zero point showing the effect of the measurement uncertainty.
The figures clearly show that by growth of the network parameters uncertainty, the mean
and standard deviation of errors will considerably grow.
Therefore the State Estimation’s standard deviation is underestimated enormously, if just
the theoretical standard deviations are taken into consideration.
To see how much the mean standard deviation and deviation of State Estimator errors are
affected by measurement uncertainty, the same procedure is done for different
measurement uncertainties. In Figure 5.4 and Figure 5.5 using different line styles
displaying different measurement uncertainties, the error bar plots for mean and standard
deviation of voltage magnitude and voltage angles versus all the network parameters
uncertainty are shown respectively. These figures are only shown for IEEE 14-Bus test
case.
0 0.05 0.1 0.15 0.2 0.250
0.2
0.4
0.6
0.8
1
1.2
1.4
1.6
1.8
2std(Phi errors)
Mea
n of
Sta
ndar
d de
viat
ions
of A
ngle
s
Parameters Standard Deviations

Chapter 6. Simulation Results 54
Figure 5.4 Mean and Standard Deviation of Voltage Magnitude Errors for Different Measurement Uncertainties for
IEEE 14-Bus test case
Figure 5.5 Mean and Standard Deviation of Voltage Angles Errors for Different Measurement Uncertainties for IEEE
14-Bus test case
0 0.05 0.1 0.15 0.2 0.250
0.005
0.01
0.015
0.02
0.025
0.03Voltage Magnitudes
Mea
n of
Erro
rs
Parameters Standard Deviations
σv = 0.05 σp = 0.10
σv = 0.01 σp = 0.05
σv = 0.001 σp = 0.01
σv = 0 σp = 0
0 0.05 0.1 0.15 0.2 0.250
0.2
0.4
0.6
0.8
1
1.2
1.4
1.6
1.8Voltage Angles
Mea
n of
Erro
rs
Parameters Standard Deviations
σv = 0.05 σp = 0.10
σv = 0.01 σp = 0.05
σv = 0.001 σp = 0.01
σv = 0 σp = 0

Chapter 6. Simulation Results 55
As seen in the figures above, when the measurement uncertainty grows, the starting point
goes farther from zero and the error mean shifts upward.
5.2.2 Bias Testing for State Estimator
Figure 5.6 and Figure 5.7 show the ratio of absolute value of voltage error Means by the
related Standard Deviations versus the network parameters uncertainty respectively for
voltage magnitudes and angles for IEEE 14-bus test case.
Figure 5.6 Ratio of the Mean of voltage magnitude errors by related Standard Deviations for IEEE 14-Bus test case.
0 0.05 0.1 0.15 0.2 0.250
0.05
0.1
0.15
0.2
0.25
0.3
0.35mean(V Errors) / std(V errors)
Parameters Standard Deviations
meanV errors over stdV errors)
5 Percent of Threshold
Mea
n of
vol
tage
mag
nitu
de e
rror
s ove
r STD
dev
.

Chapter 6. Simulation Results 56
Figure 5.7 Ratio of the Mean of voltage angle errors by related Standard Deviations for IEEE 14-Bus test case.
A horizontal dashed line is also depicted in the figures to give an idea about the 5 percent
of threshold, meaning that the state estimator is not biased for the network parameters
uncertainty range below this line.
According to the figures, it is apparent that the State Estimator is not biased for the
parameters uncertainties up to nearly 7 percent.
5.2.3 Correlation of State Estimator’s Errors
In Figure 5.8 and Figure 5.9 the correlation coefficients of State Estimator’s errors versus
parameters uncertainty are shown for Voltage errors and Phase errors respectively.
0 0.05 0.1 0.15 0.2 0.250
0.05
0.1
0.15
0.2
0.25mean(Phi Errors) / std(Phi errors)
Parameters Standard Deviations
mean phi errors over std phi errors)5 Percent of Threshold
Mea
n of
vol
tage
ang
le e
rror
s ove
r STD
dev
.

Chapter 6. Simulation Results 57
Figure 5.8 Correlation of State Estimator’s Errors (Voltage) of IEEE 14-Bus test case.
Figure 5.9 Correlation of State Estimator’s Errors (Phase) of IEEE 14-Bus test case.
0 0.05 0.1 0.15 0.2 0.25-1
-0.8
-0.6
-0.4
-0.2
0
0.2
0.4
0.6
0.8
1Correlation of State Estimator’s Voltages Errors
Cor
rela
tion
Coe
ffici
ents
Parameters Standard Deviations
0 0.05 0.1 0.15 0.2 0.25-1
-0.8
-0.6
-0.4
-0.2
0
0.2
0.4
0.6
0.8
1Correlation of State Estimator’s Phases Errors
Cor
rela
tion
Coe
ffici
ents
Parameters Standard Deviations

Chapter 6. Simulation Results 58
In Figure 5.8 and Figure 5.9 it is noticeable that the State Estimator’s Errors are
correlated so much when there is no parameters uncertainty. By increasing the network
parameters uncertainty up to about 10%, the estimated voltage errors will be roughly
uncorrelated but the estimated voltage phases will be still correlated even for large
parameters uncertainties up to 25%.
5.2.4 Parameter’s Correlation Effect on IEEE 14-Bus case
To perform this analysis, the nominal values of line resistances are correlated with the
correlation coefficient of 0.8 and the line resistances with zero nominal values were not
correlated.
With having parameters correlation, the ratio of the mean of voltage magnitudes and
angles errors by Standard Deviations for IEEE 14-Bus test case are shown in Figure 5.10
and Figure 5.11.
Figure 5.10 Ratio of the Mean of voltage magnitudes errors by Standard Deviations with parameters correlation for
IEEE 14-Bus test case.
0 0.05 0.1 0.15 0.2 0.250
5
10
15
20
25
30
35
40mean(V Errors) / std(V errors)
Parameters Standard Deviations
meanV errors over stdV errors)
5 Percent of Threshold
Mea
n of
vol
tage
mag
nitu
de e
rror
s ove
r STD
dev
.

Chapter 6. Simulation Results 59
Figure 5.11 Ratio of the Mean of voltage angles errors by Standard Deviations with parameters correlation for IEEE
14-Bus test case.
By comparing the Figure 5.6 and Figure 5.7 with above figures (Figure 5.10 and Figure
5.11), it can be concluded that when the network parameters are correlated, the State
Estimator is more biased (for smaller parameters uncertainties).
5.2.5 The Results with PMU
Figure 5.12 and Figure 5.13 show the bias tests for voltage magnitudes and phases
respectively when there exist two PMUs on bus number 6 and 9.
0 0.05 0.1 0.15 0.2 0.250
5
10
15
20
25
30
35mean(Phi Errors) / std(Phi errors)
Parameters Standard Deviations
mean phi errors over std phi errors)5 Percent of Threshold
Mea
n of
vol
tage
ang
le e
rror
s ove
r STD
dev
.

Chapter 6. Simulation Results 60
Figure 5.12 Ratio of the Mean of voltage magnitude errors by related Standard Deviations with the presence of PMU
measurements for IEEE 14-Bus test case.
Figure 5.13 Ratio of the Mean of voltage Angle errors by related Standard Deviations with the presence of PMU
measurements for IEEE 14-Bus test case.
0 0.05 0.1 0.15 0.2 0.250
1
2
3
4
5
6
7
8
9mean(V Errors) / std(V errors)
Parameters Standard Deviations
meanV errors over stdV errors)
5 Percent of Threshold
0 0.05 0.1 0.15 0.2 0.25-1
-0.5
0
0.5
1
1.5
2
2.5
3
3.5
4mean(Phi Errors) / std(Phi errors)
Parameters Standard Deviations
mean phi errors over std phi errors)5 Percent of Threshold
Mea
n of
vol
tage
mag
nitu
de e
rror
s ove
r STD
dev
. M
ean
of v
olta
ge a
ngle
err
ors o
ver S
TD d
ev.

Chapter 6. Simulation Results 61
As it is clear in the figures, when there is PMU installed, the output of SE voltage
magnitudes are less biased (for bigger range of network parameters) and the SE output of
phases are totally not biased.
5.3 Test of Algorithm on IEEE 30-Bus Case
The one-line diagram of the IEEE 30-Bus test case is illustrated in Figure 5.14. The
original network and data files can be found in [Christie 1999].
Figure 5.14 IEEE 30-Bus Test Case One-Line Diagram
For not experiencing the observability problem, totally 83 measurements are selected.
The measurement redundancy ratio will be:
η ≈ 1.4
The measurement set for this test case almost includes all the PV buses (voltage and
power injection measurements) together with power flow measurements as the following:

Chapter 6. Simulation Results 62
• Voltage magnitudes at buses 1, 2, 3, 4, 5, 6, 7, 8, 9, 10 and 11.
• Active and reactive power injections at buses: 2, 3, 5, 8, 9, 11, 12, 13, 17, 20, 25,
27, 28 and 29.
• Active and reactive power flows on branches: 1-3, 2-6, 2-4, 7-5, 4-6, 6-28, 6-8, 6-
9, 10-6,12-13, 12-15, 10-20, 10-17, 10-21, 14-15, 15-23, 15-18, 22-24, 25-26, 25-
27, 28-27 and 29-30.
5.3.1 Mean and Standard Deviation of State Estimator
The error bars plots for mean and standard deviation of voltage magnitude and voltage
angles versus all the network parameters uncertainty samples are shown respectively in
the Figure 5.15 and Figure 5.16.
Figure 5.15 Mean and Standard Deviation of Voltage Magnitude Errors for IEEE 30-Bus test case.
0 0.05 0.1 0.15 0.2 0.250
1
2
3
4
5
6
7
8
9x 10
-3 std(V errors)
Mea
n of
sta
ndar
d de
viat
ions
of V
olta
ge e
rrors
Parameters Standard Deviations

Chapter 6. Simulation Results 63
Figure 5.16 Mean and Standard Deviation of Voltage Angle Errors for IEEE 30-Bus test case.
In the figures, the mean of errors for both voltage magnitudes and angles don’t start from
zero point showing the effect of the measurement uncertainty.
The figures clearly show that by growth of the network parameters uncertainty, the mean
and standard deviation of errors will considerably grow.
Therefore the State Estimation’s standard deviation is underestimated enormously, if just
the theoretical standard deviations are taken into consideration.
5.3.2 Bias Testing for State Estimator
Figure 5.17 and Figure 5.18 show the ratio of absolute value of voltage error Means by
the related Standard Deviations versus the network parameters uncertainty respectively
for voltage magnitudes and angles for IEEE 30-bus test case.
0 0.05 0.1 0.15 0.2 0.250
0.2
0.4
0.6
0.8
1
1.2
1.4
1.6
1.8
2std(Phi errors)
Mea
n of
Sta
ndar
d de
viat
ions
of A
ngle
s
Parameters Standard Deviations

Chapter 6. Simulation Results 64
Figure 5.17 Mean and Standard Deviation of Voltage Magnitude Errors for IEEE 30-Bus test case.
Figure 5.18 Mean and Standard Deviation of Voltage Angle Errors for IEEE 30-Bus test case.
0 0.05 0.1 0.15 0.2 0.25-1
0
1
2
3
4
5
6
7
8
9mean(V Errors) / std(V errors)
Parameters Standard Deviations
meanV errors over stdV errors)
5 Percent of Threshold
0 0.05 0.1 0.15 0.2 0.250
1
2
3
4
5
6
7mean(Phi Errors) / std(Phi errors)
Parameters Standard Deviations
mean phi errors over std phi errors)5 Percent of Threshold
Mea
n of
vol
tage
mag
nitu
de e
rror
s ove
r STD
dev
. M
ean
of v
olta
ge a
ngle
err
ors o
ver S
TD d
ev.

Chapter 6. Simulation Results 65
A horizontal dashed line is also depicted in the figures to give an idea about the 5 percent
of threshold, meaning that the state estimator is not biased for the network parameters
uncertainty range below this line.
According to the figures, it is apparent that the State Estimator is not biased for the
parameters uncertainties up to nearly 10 percent.
5.3.3 Correlation of State Estimator’s Errors
In Figure 5.19 and Figure 5.20 the correlation coefficients of State Estimator’s errors
versus parameters uncertainty are shown for Voltage errors and Phase errors respectively.
Figure 5.19 Correlation of State Estimator’s Errors (Voltage Magnitude) of IEEE 30-Bus test case.
0 0.05 0.1 0.15 0.2 0.25-1
-0.8
-0.6
-0.4
-0.2
0
0.2
0.4
0.6
0.8
1Correlation of State Estimator’s Voltages Errors
Cor
rela
tion
Coe
ffici
ents
Parameters Standard Deviations

Chapter 6. Simulation Results 66
Figure 5.20 Correlation of State Estimator’s Errors (Angles) of IEEE 30-Bus test case.
In Figure 5.19 it is noticeable that the State Estimator’s Voltage Magnitude Errors are a
little bit correlated and by increment of network uncertainty, the correlation goes even
lesser. This behavior is because of the voltage measurement locations that are less
compared to IEEE case 14-bus.
The Figure 5.20 shows that the State Estimator’s Angles Errors are correlated so much
when there is no parameters uncertainty and the Angles errors will be still correlated even
for large parameters uncertainties up to 25%.
5.3.4 Parameter’s Correlation Effect on IEEE 30-Bus case
To perform this analysis, the nominal values of line resistances are correlated with the
correlation coefficient of 0.8 and the line resistances with zero nominal values were not
correlated.
With having parameters correlation, the ratios of the mean of voltage magnitudes and
angles errors by Standard Deviations for IEEE 30-Bus test case are shown in Figure 5.21
and Figure 5.22.
0 0.05 0.1 0.15 0.2 0.25-1
-0.8
-0.6
-0.4
-0.2
0
0.2
0.4
0.6
0.8
1Correlation of State Estimator’s Phases Errors
Cor
rela
tion
Coe
ffici
ents
Parameters Standard Deviations

Chapter 6. Simulation Results 67
Figure 5.21 Ratio of the Mean of voltage magnitudes errors by Standard Deviations with parameters correlation for
IEEE 30-Bus test case.
Figure 5.22 Ratio of the Mean of voltage angles errors by Standard Deviations with parameters correlation for IEEE
30-Bus test case.
0 0.05 0.1 0.15 0.2 0.25-2
0
2
4
6
8
10
12
14
16mean(V Errors) / std(V errors)
Parameters Standard Deviations
meanV errors over stdV errors)
5 Percent of Threshold
0 0.05 0.1 0.15 0.2 0.250
5
10
15mean(Phi Errors) / std(Phi errors)
Parameters Standard Deviations
mean phi errors over std phi errors)5 Percent of Threshold
Mea
n of
vol
tage
mag
nitu
de e
rror
s ove
r STD
dev
. M
ean
of v
olta
ge a
ngle
err
ors o
ver S
TD d
ev.

Chapter 6. Simulation Results 68
By comparing the Figure 5.21 and Figure 5.22 with the bias testing figures without
parameter correlation for this test case in Figure 5.17 and Figure 5.18, it can be
concluded that when the network parameters are correlated, the State Estimator is more
biased (for smaller parameters uncertainties).
5.3.5 The Results with PMU
According to the optimal PMU locations developed in [Chakrabarti 2009], for this test
case PMU are placed on 5 buses that shown in Table 5.1.
Table 5.1 PMU locations for IEEE 30-Bus test case PMU placed on bus number:
2 4 6
10 12
Figure 5.23 and Figure 5.24 show the bias tests for voltage magnitudes and phases
respectively.
Figure 5.23 Ratio of the Mean of voltage magnitude errors by related Standard Deviations with the presence of PMU
measurements for IEEE 30-Bus test case.
0 0.05 0.1 0.15 0.2 0.250
1
2
3
4
5
6
7
8mean(V Errors) / std(V errors)
Parameters Standard Deviations
meanV errors over stdV errors)
5 Percent of Threshold
Mea
n of
vol
tage
mag
nitu
de e
rror
s ove
r STD
dev
.

Chapter 6. Simulation Results 69
Figure 5.24 Ratio of the Mean of voltage Angle errors by related Standard Deviations with the presence of PMU
measurements for IEEE 30-Bus test case.
As it is clear in Figure 5.24, when there are PMUs installed, the output of State
Estimator’s voltage Angles are not biased for the network parameter uncertainties up to
25%.
It is mentionable that in Figure 5.23, the bias behavior is not affected significantly in this
test case, it is mostly because the PMUs are placed on the buses that there was already
voltage meter available.
5.4 Test of Algorithm on IEEE 57-Bus Case
The one-line diagram of the IEEE 57-Bus test case is illustrated in Figure 5.25. The
original network and data files can be found in [Christie 1999].
0 0.05 0.1 0.15 0.2 0.25-0.5
0
0.5
1
1.5
2
2.5
3
3.5mean(Phi Errors) / std(Phi errors)
Parameters Standard Deviations
mean phi errors over std phi errors)5 Percent of Threshold
Mea
n of
vol
tage
ang
le e
rror
s ove
r STD
dev
.

Chapter 6. Simulation Results 70
Figure 5.25 IEEE 57-Bus Test Case One-Line Diagram
For this test case, totally 166 measurements are selected. The measurement redundancy
ratio will be:
η ≈ 1.47
The measurement set for this test case almost includes all the PV buses (voltage and
power injection measurements) together with power flow measurements as the following:
• Voltage magnitudes at PV buses: 1, 2, 3, 6, 8 and 9.
• Active and reactive power injections at buses: 1, 2, 3, 5, 6, 7, 8, 9, 11, 17, 20, 21,
25, 29, 30, 31, 33, 34, 37, 38, 39, 40, 44, 45, 46, 48, 49, 52, 54, 55, 56 and 57.
• Active and reactive power flows on branches: 1-2, 1-15, 2-3, 3-4, 4-5, 7-6, 8-
6, 8-9, 9-13, 11-9, 11-13, 12-13, 13-49, 14-15, 19-18, 20-19, 23-22, 24-23,
24-25, 24-26, 27-26, 27-28, 30-25, 30-31, 31-32, 32-34, 32-33, 34-35, 36-

Chapter 6. Simulation Results 71
35, 36-37, 36-40, 37-38, 38-22, 38-40, 40-49, 40-56, 41-43, 42-41, 45-15,
46-47, 47-48, 48-49, 49-50, 50-51, 52-53, 53-54, 54-55 and 55-9.
5.4.1 Mean and Standard Deviation of State Estimator
The error bars plots for mean and standard deviation of voltage magnitude and voltage
angles versus all the network parameters uncertainty samples are shown respectively in
the Figure 5.26 and Figure 5.27.
Figure 5.26 Mean and Standard Deviation of Voltage Magnitude Errors for IEEE 57-Bus test case.
0 0.05 0.1 0.15 0.2 0.250
0.002
0.004
0.006
0.008
0.01
0.012
0.014
0.016std(V errors)
Mea
n of
sta
ndar
d de
viat
ions
of V
olta
ge e
rrors
Parameters Standard Deviations

Chapter 6. Simulation Results 72
Figure 5.27 Mean and Standard Deviation of Voltage Angle Errors for IEEE 57-Bus test case.
In the figures, the mean of errors for both voltage magnitudes and angles don’t start from
zero point showing the effect of the measurement uncertainty.
The figures clearly show that by growth of the network parameters uncertainty, the mean
and standard deviation of errors will considerably grow. Therefore if just the theoretical
standard deviations are taken into consideration, the State Estimation’s standard deviation
is underestimated enormously.
5.4.2 Bias Testing for State Estimator
Figure 5.28 and Figure 5.29 show the ratio of absolute value of voltage error Means by
the related Standard Deviations versus the network parameters uncertainty respectively
for voltage magnitudes and angles for IEEE 57-bus test case.
0 0.05 0.1 0.15 0.2 0.250
0.2
0.4
0.6
0.8
1
1.2
1.4
1.6
1.8
2std(Phi errors)
Mea
n of
Sta
ndar
d de
viat
ions
of A
ngle
s
Parameters Standard Deviations

Chapter 6. Simulation Results 73
Figure 5.28 Mean and Standard Deviation of Voltage Magnitude Errors for IEEE 57-Bus test case.
Figure 5.29 Mean and Standard Deviation of Voltage Angle Errors for IEEE 57-Bus test case.
0 0.05 0.1 0.15 0.2 0.250
2
4
6
8
10
12
14
16
18mean(V Errors) / std(V errors)
Parameters Standard Deviations
meanV errors over stdV errors)
5 Percent of Threshold
0 0.05 0.1 0.15 0.2 0.250
1
2
3
4
5
6
7
8
9mean(Phi Errors) / std(Phi errors)
Parameters Standard Deviations
mean phi errors over std phi errors)5 Percent of Threshold
Mea
n of
vol
tage
mag
nitu
de e
rror
s ove
r STD
dev
. M
ean
of v
olta
ge a
ngle
err
ors o
ver S
TD d
ev.

Chapter 6. Simulation Results 74
A horizontal dashed line is also depicted in the figures to give an idea about the 5 percent
of threshold, meaning that the state estimator is not biased for the network parameters
uncertainty range below this line.
According to the figures, it is apparent that for this power network test case the State
Estimator’s Voltage Magnitude and Voltage Angle outputs are not biased for the
parameters uncertainties up to nearly 4 percent and 8 percent respectively.
5.4.3 Correlation of State Estimator’s Errors
In Figure 5.30 and Figure 5.31 the correlation coefficients of State Estimator’s errors
versus parameters uncertainty are shown for Voltage errors and Phase errors respectively.
Figure 5.30 Correlation of State Estimator’s Errors (Voltage Magnitude) of IEEE 57-Bus test case.
0 0.05 0.1 0.15 0.2 0.25-1
-0.8
-0.6
-0.4
-0.2
0
0.2
0.4
0.6
0.8
1Correlation of State Estimator’s Voltages Errors
Cor
rela
tion
Coe
ffici
ents
Parameters Standard Deviations

Chapter 6. Simulation Results 75
Figure 5.31 Correlation of State Estimator’s Errors (Angles) of IEEE 57-Bus test case.
In Figure 5.30 it is noticeable that the State Estimator’s Voltage Magnitude Errors are a
little bit correlated and by increment of network uncertainty, the correlation goes even
lesser. This behavior is because of the voltage measurement locations that are less
compared to IEEE case 14-bus.
The Figure 5.31 shows that the State Estimator’s Angles Errors are correlated
considerably when there is parameters uncertainty and the Angles errors will be still
correlated even for large parameters uncertainties up to 25%. State Estimator’s Angles
Errors are less correlated when there is no parameters uncertainty.
5.4.4 Parameter’s Correlation Effect on IEEE 57-Bus case
To perform this analysis, the nominal values of line resistances are correlated with the
correlation coefficient of 0.8 and the line resistances with zero nominal values were not
correlated.
With having parameters correlation, the ratio of the mean of voltage magnitudes and
angles errors by Standard Deviations for IEEE 57-Bus test case are shown in Figure 5.32
and Figure 5.33.
0 0.05 0.1 0.15 0.2 0.25-1
-0.8
-0.6
-0.4
-0.2
0
0.2
0.4
0.6
0.8
1Correlation of State Estimator’s Phases Errors
Cor
rela
tion
Coe
ffici
ents
Parameters Standard Deviations

Chapter 6. Simulation Results 76
Figure 5.32 Ratio of the Mean of voltage magnitudes errors by Standard Deviations with parameters correlation for
IEEE 57-Bus test case.
Figure 5.33 Ratio of the Mean of voltage angles errors by Standard Deviations with parameters correlation for IEEE
57-Bus test case.
0 0.05 0.1 0.15 0.2 0.250
5
10
15
20
25mean(V Errors) / std(V errors)
Parameters Standard Deviations
meanV errors over stdV errors)
5 Percent of Threshold
0 0.05 0.1 0.15 0.2 0.250
2
4
6
8
10
12
14mean(Phi Errors) / std(Phi errors)
Parameters Standard Deviations
mean phi errors over std phi errors)5 Percent of Threshold
Mea
n of
vol
tage
mag
nitu
de e
rror
s ove
r STD
dev
. M
ean
of v
olta
ge a
ngle
err
ors o
ver S
TD d
ev.

Chapter 6. Simulation Results 77
By comparing Figure 5.32 and Figure 5.33 with the figures of bias testing without
parameter correlation for this test case (Figure 5.28 and Figure 5.29), it is evident that
when the network parameters are correlated, the State Estimator is more biased and.
This test case showed this effect prominently after increasing the number of Monte Carlo
trials to 5000.
5.4.5 The Results with PMU
According to the optimal PMU locations developed in [Chakrabarti 2009], for this test
case 7 PMUs are placed on the buses that shown in Table 5.2.
Table 5.2 PMU locations for IEEE 57-Bus test case PMU placed on bus number:
4 9
15 20 24 53 57
Figure 5.34 and Figure 5.35 show the bias tests for voltage magnitudes and phases
respectively.

Chapter 6. Simulation Results 78
Figure 5.34 Ratio of the Mean of voltage magnitude errors by related Standard Deviations with the presence of PMU
measurements for IEEE 57-Bus test case.
Figure 5.35 Ratio of the Mean of voltage Angle errors by related Standard Deviations with the presence of PMU
measurements for IEEE 57-Bus test case.
0 0.05 0.1 0.15 0.2 0.250
1
2
3
4
5
6
7
8
9mean(V Errors) / std(V errors)
Parameters Standard Deviations
meanV errors over stdV errors)
5 Percent of Threshold
0 0.05 0.1 0.15 0.2 0.25-1
0
1
2
3
4
5
6
7mean(Phi Errors) / std(Phi errors)
Parameters Standard Deviations
mean phi errors over std phi errors)5 Percent of Threshold
Mea
n of
vol
tage
ang
le e
rror
s ove
r STD
dev
. M
ean
of v
olta
ge m
agni
tude
err
ors o
ver S
TD d
ev.

Chapter 6. Simulation Results 79
According to the Figure 5.34 and Figure 5.35, when there are PMU measurements for
this test case, the output of State Estimator’s voltage Magnitudes and Angles are less
biased (for bigger range of network parameters).
5.5 Test of Algorithm on IEEE 118-Bus Case
The one-line diagram of the IEEE 118-Bus test case is illustrated in Figure 5.36. Network
parameters and Bus data for this test case can be found in [Christie 1999].
Figure 5.36 IEEE 118-Bus Test Case One-Line Diagram
For this test case, totally 365 measurements are selected. The measurement redundancy
ratio will be:
η ≈ 1.55
The measurement set for this test case almost includes all the PV buses (voltage and
power injection measurements) together with power flow measurements as the following:
• Voltage magnitudes at PV buses: 1, 2, 3, 4, 5, 6, 7, 8, 9, 10, 11, 12, 13, 14, 15, 16,
17, 18, 19, 20, 21, 22, 23, 24, 25, 26, 27, 28, 29, 30, 31, 32, 33, 34, 35, 36, 37, 38,

Chapter 6. Simulation Results 80
39, 40, 41, 42, 43, 44, 45, 46, 47, 48, 49, 50, 51, 52, 53, 54, 55, 56, 57, 58, 59, 60,
61, 62, 63, 64, 65, 66, 67, 68, 69, 70, 71, 72, 73, 74, 75, 76, 77, 78, 79, 80, 81, 82,
83, 84, 85, 86, 87, 88, 89, 90, 91, 92, 93, 94, 95, 96, 97, 98, 99, 100, 101, 102,
103, 104, 105, 106, 107, 108, 109, 110, 111, 112 and 113.
• Active and reactive power injections at buses: 2, 3, 7, 8, 10, 12, 13, 15, 16, 17, 18,
21, 22, 23, 24, 27, 28, 29, 31, 33, 38, 41, 43, 44, 45, 46, 47, 48, 50, 51, 52, 63, 65,
69, 70, 71, 73, 74, 75, 81, 82, 83, 84, 86, 88, 90, 91, 92, 93, 94, 95, 96, 97, 100,
101, 102, 103, 104, 105, 106, 110, 111, 112, 113, 115, 116 and 118.
• Active and reactive power flows on branches: 1-2, 1-3, 3-5, 5-6, 7-12, 8-5, 8-9, 9-
10, 11-4, 12-14, 17-15, 17-30, 18-17, 19-20, 25-26, 29-31, 31-32, 32-114, 34-36,
35-36, 35-37, 37-39, 37-40, 38-37, 38-65, 39-40, 40-41, 49-54, 50-49, 51-49, 51-
52, 51-58, 52-53, 54-55, 54-59, 59-55, 59-56, 59-60, 59-61, 61-60, 63-59, 64-61,
65-68, 66-49, 66-62, 66-67, 69-68, 71-70, 77-78, 80-77, 80-79, 80-98, 81-68, 83-
84, 85-86, 86-87, 95-96, 96-97 and 105-108.
5.5.1 Mean and Standard Deviation of State Estimator
The error bars plots for mean and standard deviation of voltage magnitude and voltage
angles versus all the network parameters uncertainty samples are shown respectively in
the Figure 5.37 and Figure 5.38.

Chapter 6. Simulation Results 81
Figure 5.37 Mean and Standard Deviation of Voltage Magnitude Errors for IEEE 118-Bus test case.
Figure 5.38 Mean and Standard Deviation of Voltage Angle Errors for IEEE 118-Bus test case.
0 0.05 0.1 0.15 0.2 0.250
1
2
3
4
5
6
7x 10
-3 std(V errors)
Mea
n of
sta
ndar
d de
viat
ions
of V
olta
ge e
rrors
Parameters Standard Deviations
0 0.05 0.1 0.15 0.2 0.250
0.5
1
1.5
2
2.5
3
3.5std(Phi errors)
Mea
n of
Sta
ndar
d de
viat
ions
of A
ngle
s
Parameters Standard Deviations

Chapter 6. Simulation Results 82
The figures clearly show that by growth of the network parameters uncertainty, the mean
and standard deviation of errors will considerably grow. Therefore if just the theoretical
standard deviations are taken into consideration, the State Estimation’s standard deviation
is underestimated enormously. The results are based on 5000 Monte Carlo Trials.
In the figures, the mean of errors for both voltage magnitudes and angles don’t start from
zero point showing the effect of the measurement uncertainty.
5.5.2 Bias Testing for State Estimator
Figure 5.39 and Figure 5.40 show the ratio of absolute value of voltage error Means by
the related Standard Deviations versus the network parameters uncertainty respectively
for voltage magnitudes and angles for IEEE 118-bus test case.
Figure 5.39 Mean and Standard Deviation of Voltage Magnitude Errors for IEEE 118-Bus test case.
0 0.05 0.1 0.15 0.2 0.250
2
4
6
8
10
12
14
16
18mean(V Errors) / std(V errors)
Parameters Standard Deviations
meanV errors over stdV errors)
5 Percent of Threshold
Mea
n of
vol
tage
mag
nitu
de e
rror
s ove
r STD
dev
.

Chapter 6. Simulation Results 83
Figure 5.40 Mean and Standard Deviation of Voltage Angle Errors for IEEE 118-Bus test case.
A horizontal dashed line is also depicted in the figures to give an idea about the 5 percent
of threshold, meaning that the state estimator is not biased for the network parameters
uncertainty range below this line.
According to the figures, it is apparent that for this test case the State Estimator’s Voltage
Magnitude and Voltage Angle outputs are not biased for the parameters uncertainties up
to nearly 6 percent and 12 percent respectively.
5.5.3 Correlation of State Estimator’s Errors
In Figure 5.41 and Figure 5.42 the correlation coefficients of State Estimator’s errors
versus parameters uncertainty are shown for Voltage errors and Phase errors respectively.
0 0.05 0.1 0.15 0.2 0.25-1
0
1
2
3
4
5
6
7mean(Phi Errors) / std(Phi errors)
Parameters Standard Deviations
mean phi errors over std phi errors)5 Percent of Threshold
Mea
n of
vol
tage
ang
le e
rror
s ove
r STD
dev
.

Chapter 6. Simulation Results 84
Figure 5.41 Correlation of State Estimator’s Errors (Voltage Magnitude) of IEEE 118-Bus test case.
Figure 5.42 Correlation of State Estimator’s Errors (Angles) of IEEE 118-Bus test case.
0 0.05 0.1 0.15 0.2 0.25-1
-0.8
-0.6
-0.4
-0.2
0
0.2
0.4
0.6
0.8
1Correlation of State Estimator’s Voltages Errors
Cor
rela
tion
Coe
ffici
ents
Parameters Standard Deviations
0 0.05 0.1 0.15 0.2 0.25-1
-0.8
-0.6
-0.4
-0.2
0
0.2
0.4
0.6
0.8
1Correlation of State Estimator’s Phases Errors
Cor
rela
tion
Coe
ffici
ents
Parameters Standard Deviations

Chapter 6. Simulation Results 85
In Figure 5.41 it is noticeable that the State Estimator’s Voltage Magnitude Errors are
almost not correlated to each other and by increment of network uncertainty it remains
uncorrelated. This behavior is mostly because of choosing too many Voltage Magnitudes
measurements. The Figure 5.42 shows that the State Estimator’s Angles Errors are
moderately correlated and when there is parameters uncertainty, the Angles errors will be
still correlated even for large parameters uncertainties up to 25%.
5.5.4 Parameter’s Correlation Effect on IEEE 118-Bus case
To perform this analysis, the nominal values of line resistances are correlated with the
correlation coefficient of 0.8 and the line resistances with zero nominal values were not
correlated.
With having parameters correlation, the ratios of the mean of voltage magnitudes and
angles errors by Standard Deviations for IEEE 118-Bus test case are shown in Figure
5.43 and Figure 5.44.
Figure 5.43 Ratio of the Mean of voltage magnitudes errors by Standard Deviations with parameters correlation for
IEEE 118-Bus test case.
0 0.05 0.1 0.15 0.2 0.25-10
-5
0
5
10
15
20mean(V Errors) / std(V errors)
Parameters Standard Deviations
meanV errors over stdV errors)
5 Percent of Threshold
Mea
n of
vol
tage
mag
nitu
de e
rror
s ove
r STD
dev
.

Chapter 6. Simulation Results 86
Figure 5.44 Ratio of the Mean of voltage angles errors by Standard Deviations with parameters correlation for IEEE
118-Bus test case.
By comparing Figure 5.43 and Figure 5.44 with the figures of bias testing without
parameter correlation for this test case (Figure 5.39 and Figure 5.40), it is evident that
when the network parameters are correlated, the State Estimator’s Voltage magnitude
errors are totally biased and the State Estimator’s Voltage magnitude errors is on the edge
of biasness for different network parameters.
5.5.5 The Results with PMU
According to the optimal PMU locations developed in [Chakrabarti 2009], for this test
case 13 PMUs are placed on the buses that shown in Table 5.3.
Table 5.3 PMU locations for IEEE 118-Bus test case PMU placed on bus number:
3 12 21 30 37 45 56
0 0.05 0.1 0.15 0.2 0.25-40
-30
-20
-10
0
10
20
30
40
50
60mean(Phi Errors) / std(Phi errors)
Parameters Standard Deviations
mean phi errors over std phi errors)5 Percent of Threshold
Mea
n of
vol
tage
ang
le e
rror
s ove
r STD
dev
.

Chapter 6. Simulation Results 87
64 75 85 94 105 114
Figure 5.45 and Figure 5.46 show the bias tests for voltage magnitudes and phases
respectively.
Figure 5.45 Ratio of the Mean of voltage magnitude errors by related Standard Deviations with the presence of PMU
measurements for IEEE 118-Bus test case.
0 0.05 0.1 0.15 0.2 0.250
1
2
3
4
5
6
7
8mean(V Errors) / std(V errors)
Parameters Standard Deviations
meanV errors over stdV errors)
5 Percent of Threshold
Mea
n of
vol
tage
mag
nitu
de e
rror
s ove
r STD
dev
.

Chapter 6. Simulation Results 88
Figure 5.46 Ratio of the Mean of voltage Angle errors by related Standard Deviations with the presence of PMU
measurements for IEEE 118-Bus test case.
Considering the Figure 5.45 and Figure 5.46 and comparing them with Figure 5.39 and
Figure 5.40, it is apparent when there are PMU measurements for this test case, the
output of State Estimator’s voltage Magnitudes are less biased (for bigger range of
network parameters) and the output of State Estimator’s voltage Angles are not biased at
least for the parameters uncertainty up to 25%.
0 0.05 0.1 0.15 0.2 0.25-2
-1
0
1
2
3
4
5mean(Phi Errors) / std(Phi errors)
Parameters Standard Deviations
mean phi errors over std phi errors)5 Percent of Threshold
Mea
n of
vol
tage
ang
le e
rror
s ove
r STD
dev
.

89
Conclusions
In this thesis an algorithm for analyzing both the effects of network parameters
uncertainty along with the measurement uncertainty on WLS state estimator is proposed
and simulated on IEEE 14-Bus, 30-Bus, 57-Bus and 118-Bus test cases in Matlab
simulation environment. The results of simulations show that the state estimator’s
accuracy is affected considerably according to the network parameters uncertainty and
the amount of variations are illustrated by means of state errors distribution (in terms of
error bars representing the distribution mean and 1𝜎 standard deviation) versus the
network parameters uncertainty for the test cases.
The lack of literature studies about the analysis of network parameters effects on
WLS State Estimator’s bias performance led us to perform a new prominent analysis to
find how network parameters uncertainty can affect the state estimator’s bias (for a given
measurement uncertainly). Hence it is done by using the ratio of absolute value of state
error means by the related standard deviations versus the network parameters uncertainty
and comparing it with a predefined threshold.
WLS State Estimation provides a mathematical expression for calculating the
variance covariance matrix of State Estimates and when there is network parameters
uncertainty, the simulations confirm that the State Estimation’s standard deviation is
underestimated enormously because only the uncertainty of measurement data is
considered.
Phasor Measurement Unit (PMU) can be used to make the state estimates less
sensitive to the network parameters uncertainty, because the analysis show that when
PMU measurement data are included in the traditional measurement set, the outputs of

90
State estimator are comparatively much less biased so that in some test cases, the State
estimator’s phases are totally unbiased for huge range of network parameters.
Lastly an analysis is carried out to illustrate how much the State Estimator’s results
are mutually connected to each other when the network parameters have uncertainty. The
results reveal that when there is no parameters uncertainty the State Estimator’s Angle
errors are correlated considerably and by increment of network parameter uncertainty, the
correlation effect will be a little bit smaller. While the State Estimator’s Voltage
Magnitude errors are correlated moderately when there is no parameters uncertainty and
by increment of network parameter uncertainty, the correlation effect will significantly
goes smaller.

91
Bibliography
[Andreich 1968] R. G. Andreich, H. E. Brown, H. H. Happ, C.E. Person, “The Piecewise
Solution Of The Impedance Matrix Load Flow”, IEEE Transactions On Power Apparatus
And Systems, 87(10), 1877-1882, 1968.
[Baran 1995] Baran, M.E., Jinxiang Zhu, Hongbo Zhu, Garren, K.E., "A Meter Placement
Method For State Estimation", IEEE Transactions On Power Systems, Vol.10, No.3,
pp.1704-1710, Aug 1995.
[Bi 2008] T.S. Bi, X.H. Qin, Q.X. Yang, “A Novel Hybrid State Estimator For Including Synchronized Phasor Measurements”, Electric Power Syst. Res., 78, pp. 1343–1352,
2008.
[Brown 1963] H. E. Brown, G. K. Carter, II. H. Happ, And C. E. Person, "Power Flow Solution By Impedance Matrix Iterative Method," IEEE Trans. Power Apparatus And
System, Vol. 82, pp. 1-10, April 1963.
[Chakrabarti 2009] Saikat Chakrabarti, Elias Kyriakides, “Placement Of Synchronized Measurements For Power System Observability”, IEEE TRANSACTIONS ON POWER
DELIVERY, VOL. 24, NO. 1, JANUARY 2009.
[Chan 2000] W.L. Chan, A.T.P. So, L.L. Lai, “Initial Applications Of Complex Artificial Neural Networks To Load-Flow Analysis”, IEE Proceedings Of Generation Transmission
Distribution, 147(6), 361–366, 2000.
[Chen 2006] Jian Chen, Abur, A., "Placement Of Pmus To Enable Bad Data Detection In
State Estimation,", IEEE Transactions On Power Systems, Vol.21, No.4, pp.1608-1615,
Nov. 2006.

92
[Christie 1999] Richard D. Christie, “Data For The IEEE 14, 30, 57, 118, 300-Bus Test
System”, University Of Washington 1999, Online Available:
Http://Www.Ee.Washington.Edu/Research/Pstca/
[Clarkson 1993] Peter M. Clarkson, “Optimal And Adaptive Signal Processing”, CRC
Press, 1993.
[Clements 1988] K. A. Clements, P. W. Davis, “Detection And Identification Of Topology
Errors In Electric Power Systems”, IEEE Trans. Power System, Vol. 3, No. 4, pp. 1748–
1753, Nov. 1988.
[Crow 2007] Mariesa L. Crow, “Computational Methods For Electric Power Systems,” In
Electric Power Engineering Handbook: Power Systems, 2nd Ed By Leonard L. Grigsby,
CRC Press, 2007, Ch. 1, Sec. 5.
[Grainger 1994] J. Grainger, W. Stevenson: “Power System Analysis”, Mcgraw-Hill, ISBN 0-07-061293-5, 1994.
[Hastings 1970] W. K. Hastings, “Monte Carlo Sampling Methods Using Markov Chains
And Their Applications,” Biometrika, Vol. 57, No. 1, pp. 97-109, 1970.
[Huang 2003] Shyh-Jier Huang, Jeu-Min Lin “A Changeable Weighting Matrix Applied For
State Estimation Of Electric Power”, PEDS 2003.
[Kerdchuen 2009] T. Kerdchuen, “Measurement Scheme Improving For State Estimation Using Stochastic Tabu Search”, International Journal Of Electrical And Electronics
Engineering, pp.3-9, 2009.
[Li 2011] Wei-Guo Li, Jin Li, Ao Gao And Jin-Hong Yand, “Review And Research Trends
On State Estimation Of Electrical Power Systems”, Power And Energy Engineering
Conference (APPEEC), 2011 Asia-Pacific , Vol., No., pp.1-4, 25-28, March 2011.
[Lo 1999] K.L. Lo, Y.J. Lin, W.H. Siew, “Fuzzy-Logic Method For Adjustment Of Variable
Parameters In Load Flow Calculation”, IEE Proceedings Of Generation Transmission Distribution, 146(3), 276–282, 1999.
[Lukomski 2008] Robert Lukomski, Kazimierz Wilkosz, “Methods Of Measurement
Placement Design For Power System State Estimation”, POWER SYSTEM MODELING
AND CONTROL, AT&P Journal PLUS2, 2008.

93
[Meliopoulos 2001] A. P. Sakis Meliopoulos, Bruce Fardanesh, Shalom Zelingher, “Power
System State Estimation: Modeling Error Effects And Impact On System Operation”,
Hawaii International Conference On System Sciences, January 2001.
[Murty 2011] P. S. R. Murty, "Operation And Control In Power Systems", Taylor And
Francis, ISBN: 9780415665650, 2011.
[Muscas 2007a] C. Muscas, F. Pilo, G. Pisano And S. Sulis, "Optimal Measurement
Devices Allocation For Harmonic State Estimation Considering Parameters Uncertainty
In Distribution Networks”, EPQU’07, 9th International Conference Electrical Power
Quality And Utilization, Spain, October 2007.
[Muscas 2007b] C. Muscas, F. Pilo, G. Pisano And S. Sulis, "Considering The Uncertainty
On The Network Parameters In The Optimal Planning Of Measurement Systems For
Distribution State Estimation”, IEEE IMTC/2007, Poland, May 2007.
[Nguyen 1995] T. Nguyen, “Neural Network Load-Flow”, IEE Proceedings Of Generation
Transmission Distribution, 142(1), 51–58, 1995.
[Pajic 2007] Slobodan Pajic, “Power System State Estimation And Contingency Constrained Optimal Power Flow - A Numerically Robust Implementation”, Phd
Dissertation, Worcester Polytechnic Institute, April 2007.
[Priestly 1981] M. B. Priestly, “Spectral Analysis And Time Series”, Vol 1, Academic Press, 1981.
[Rakpenthai 2005] Chawasak Rakpenthai, Suttichai Premrudeepreechacharn, Sermsak
Uatrongjit, Neville R. Watson, “Measurement Placement For Power System State
Estimation Using Decomposition Technique”, Electric Power Systems Research, Volume
75, Issue 1, Pages 41-49, July 2005.
[Rakpenthai 2012] Chawasak Rakpenthai, Sermsak Uatrongjit And Suttichai
Premrudeepreechacharn, “State Estimation Of Power System Considering Network Parameter Uncertainty Based On Parametric Interval Linear Systems”, IEEE Transactions
On Power Systems, Vol. 27, No. 1, pp. 305-313, Feb. 2012.
[Schweppe 1970a] F. C. Schweppe And J. Wildes, “Power System Static-State Estimation, Part I: Exact Model,” IEEE Trans. On Power Apparatus And Systems, Vol. 89,
No. 1, pp. 120-125, January 1970.

94
[Schweppe 1970b] F. C. Schweppe And D. B. Rom, “Power System Static-State
Estimation,Part II: Approximate Model,” IEEE Trans. On Power Apparatus And Systems,
Vol. 89, No. 1, pp. 125-130, January 1970.
[Schweppe 1970c] F. C. Schweppe, “Power System Static-State Estimation, Part III:
Implementation,” IEEE Trans. On Power Apparatus And Systems, Vol. 89, No. 1, pp. 130-
135, January 1970.
[Scott 1974] B. Scott, O. Alsac, “Fast Decoupled Load Flow”, IEEE Transactions On Power
Apparatus And Systems, 93(3), 859–869, 1974.
[Stagg 1968] G. W. Stagg, A. H. El-Abiad: “Computer Methods In Power Systems”,
Mcgraw-Hill, 1968.
[Tinney 1967] W. F. Tinney, C. E. Hart, “Power Flow Solution By Newton’s Method”, IEEE
Transactions On Power Apparatus And Systems, 86(4), 1449–1460, Nov. 1967.
[Valenzuela 2000] Jorge Valenzuela, Mainak Mazumdar: “Statistical Analysis Of Electric
Power Production Costs”, IIE 2000.
[Wang 2009] Xi-Fan Wang, Yonghua Song, Malcolm Irving: “Modern Power Systems Analysis”, ISBN 978-0-387-72852-0, 2009.
[Wong 1999] K.P. Wong, A. Li, T.M.Y. Law, “Advanced Constrained Genetic Algorithm
Load Flow Method”, Proceedings Of Generation Transmission Distribution, 146(6), 609–616, 1999.
[Wood 1996] Allen J. Wood, Bruce F. Wollenberg, "Power Generation, Operation, And
Control", Wiley, ISBN: 978-0471586999, 1996.
[Zimmerman 2011] R. D. Zimmerman, C. E. Murillo-Sanchez And R. J. Thomas,
“Matpower: Steady-State Operations, Planning And Analysis Tools For Power Systems
Research And Education", IEEE Transactions On Power Systems, Vol. 26, No. 1, pp. 12-
19, Feb. 2011.

Appendices 95
Appendices
Proof of the Jacobian of 𝑱(𝒙)
The first derivative of 𝐽(𝑥) with respect to 𝑥 is:
𝜕𝐽(𝑥)𝜕𝑥
=𝜕[𝑦𝑇𝛴𝑦−1 𝑦 − 𝑦𝑇𝛴𝑦−1 𝑓(𝑥) − 𝑓(𝑥)𝑇𝛴𝑦−1 𝑦 + 𝑓(𝑥)𝑇𝛴𝑦−1 𝑓(𝑥)]
𝜕𝑥
𝜕𝐽(𝑥)𝜕𝑥
= −𝑦𝑇𝛴𝑦−1𝜕𝑓(𝑥)𝜕𝑥
− 𝑦𝑇𝛴𝑦−1𝑇 𝜕𝑓(𝑥)𝜕𝑥
+ 𝑓(𝑥)𝑇𝛴𝑦−1𝑇 𝜕𝑓(𝑥)
𝜕𝑥+ 𝑓(𝑥)𝑇𝛴𝑦−1
𝜕𝑓(𝑥)𝜕𝑥
The variance-covariance matrix of measurements 𝛴𝑦−1 is symmetrical so we can simplify:
𝜕𝐽(𝑥)𝜕𝑥
= −2𝑦𝑇𝛴𝑦−1𝜕𝑓(𝑥)𝜕𝑥
+ 2𝑓(𝑥)𝑇𝛴𝑦−1𝜕𝑓(𝑥)𝜕𝑥
𝜕𝐽(𝑥)𝜕𝑥
= −2[𝑦 − 𝑓(𝑥)]𝑇𝛴𝑦−1 �𝜕𝑓(𝑥)𝜕𝑥
�
The Jacobian matrix of 𝐽(𝑥) is defined by 𝑔(𝑥):
𝑔(𝑥) = �𝜕𝐽(𝑥)𝜕𝑥
�𝑇
𝑔(𝑥) = −2 �𝜕𝑓(𝑥)𝜕𝑥
�𝑇
𝛴𝑦−1[𝑦 − 𝑓(𝑥)]

Appendices 96
Proof of the Hessian of 𝑱(𝒙)
The Hessian matrix of 𝐽(𝑥) is the second derivative with respect to 𝑥:
𝐻(𝑥) =𝜕𝑔(𝑥)𝜕𝑥
𝐻(𝑥) =𝜕 �−2 �𝜕𝑓(𝑥)
𝜕𝑥 �𝑇𝛴𝑦−1[𝑦 − 𝑓(𝑥)]�
𝜕𝑥
𝐻(𝑥) =𝜕 �−2 �𝜕𝑓(𝑥)
𝜕𝑥 �𝑇𝛴𝑦−1𝑦 + 2 �𝜕𝑓(𝑥)
𝜕𝑥 �𝑇𝛴𝑦−1𝑓(𝑥)�
𝜕𝑥
𝐻(𝑥) = −2𝑦𝑇𝛴𝑦−1𝜕2𝑓(𝑥)𝜕𝑥2
+ 2𝑓(𝑥)𝑇𝛴𝑦−1𝜕2𝑓(𝑥)𝜕𝑥2
+ 2 �𝜕𝑓(𝑥)𝜕𝑥
�𝑇
𝛴𝑦−1 �𝜕𝑓(𝑥)𝜕𝑥
�
𝐻(𝑥) = 2[𝑓(𝑥)𝑇 − 𝑦𝑇]𝛴𝑦−1𝜕2𝑓(𝑥)𝜕𝑥2
+ 2 �𝜕𝑓(𝑥)𝜕𝑥
�𝑇
𝛴𝑦−1 �𝜕𝑓(𝑥)𝜕𝑥
�
𝐻(𝑥) = 2[−𝑟]𝑇𝛴𝑦−1𝜕2𝑓(𝑥)𝜕𝑥2
+ 2 �𝜕𝑓(𝑥)𝜕𝑥
�𝑇
𝛴𝑦−1 �𝜕𝑓(𝑥)𝜕𝑥
�
By neglecting the first part of above equation, we can write the Hessian matrix of 𝐽(𝑥) as:
𝐻(𝑥) ≅ 2 �𝜕𝑓(𝑥)𝜕𝑥
�𝑇
𝛴𝑦−1 �𝜕𝑓(𝑥)𝜕𝑥
�

Appendices 97
Derivation of power network equations using a sample network
In this section the equations for the power calculations for a node will be inspected. Let’s
consider a sample power network as shown in the figure below:
Figure 5.47 Tree of the connected graph of a sample power network
Here all the complex power injections for one node are going to be written and it could
be applied to all the nodes in the network. We consider node 3 and all the branches
connected to it (Figure below):
Figure 5.48 The Node 3 in the sample power network along with the all branches connected and the illustration of
equivalent pi model for each branch
To find the power injections 𝑆2 and 𝑆3 and 𝑆6 we use the equivalent pi model described in
the previous section. The power injection equations will be:
3
2
5
4 3
2
6
𝑆32 𝑆34
𝑆36
3
2
5
4
6
1
G
L
2
6
3
4
5
7
8
1
Branch Node

Appendices 98
𝑆3̅2 = (𝑦�2 + 𝑦�30)∗𝑉�3𝑉�3∗ − 𝑦�2∗𝑉�3𝑉�2∗
𝑆3̅4 = (𝑦�3 + 𝑦�30)∗𝑉�3𝑉�3∗ − 𝑦�3∗𝑉�3𝑉�4∗
𝑆3̅6 = (𝑦�6 + 𝑦�30)∗𝑉�3𝑉�3∗ − 𝑦�6∗𝑉�3𝑉�6∗
The relationship between the injected complex powers in a node is ∑𝑆� = 0. For node 3 it
will be:
𝑆3̅2 + 𝑆3̅4 + 𝑆3̅6 = 0
(𝑦�2 + 𝑦�30)∗𝑉�3𝑉�3∗ − 𝑦�2∗𝑉�3𝑉�2∗ + (𝑦�3 + 𝑦�30)∗𝑉�3𝑉�3∗ − 𝑦�3∗𝑉�3𝑉�4∗ + (𝑦�6 + 𝑦�30)∗𝑉�3𝑉�3∗ − 𝑦�6∗𝑉�3𝑉�6∗ = 0
(𝑦�2 + 𝑦�3 + 𝑦�6 + 3𝑦�30)∗|𝑉�3|2 − [𝑦�2∗𝑉�2∗ + 𝑦�3∗𝑉�4∗ + 𝑦�6∗𝑉�6∗]𝑉�3 = 0
The last equation is the desired non-linear function that relates the states to the physical
admittances for the sample power network.
Generalization of Power Equations
The total power fluxes equation for the sample network will be written in order to
conclude the equations for a general network easier. The injected powers in nodes are the
measured quantities.
Figure 5.49 Sample network with two branches connected to a generator (power injector) along with the illustration of
equivalent pi model
𝑆�̅�ℎ = (𝑦�𝑘ℎ + 𝑦�𝑘0)∗𝑉�𝑘𝑉�𝑘∗ − 𝑦�𝑘ℎ∗𝑉�𝑘𝑉�ℎ∗
𝑆�̅�𝑖 = (𝑦�𝑘𝑖 + 𝑦�𝑘0)∗𝑉�𝑘𝑉�𝑘∗ − 𝑦�𝑘𝑖∗𝑉�𝑘𝑉�𝑖∗
In node 𝑘, the injected power, 𝐺 is equal to the total power fluxes:
𝑆�̅� = 𝑆�̅�ℎ + 𝑆�̅�𝑖
k
h
G
i
𝑆𝑘𝑖
𝑆𝑘ℎ 𝑆𝑘

Appendices 99
𝑆�̅� = (𝑦�𝑘ℎ + 𝑦�𝑘0)∗𝑉�𝑘𝑉�𝑘∗ − 𝑦�𝑘ℎ∗𝑉�𝑘𝑉�ℎ∗ + (𝑦�𝑘𝑖 + 𝑦�𝑘0)∗𝑉�𝑘𝑉�𝑘∗ − 𝑦�𝑘𝑖∗𝑉�𝑘𝑉�𝑖∗
𝑆�̅� = (𝑦�𝑘ℎ + 𝑦�𝑘𝑖 + 2𝑦�𝑘0)∗|𝑉�𝑘|2 − (𝑦�𝑘ℎ𝑉�ℎ + 𝑦�𝑘𝑖𝑉�𝑖)∗𝑉�𝑘
The elements of node admittance can be written as:
𝑦�𝑘ℎ = 𝑔𝑘ℎ + 𝑗𝑏𝑘ℎ
Note that 𝑦�𝑘ℎ is equal to 𝑦�ℎ𝑘 and accordingly 𝑔𝑘ℎ = 𝑔ℎ𝑘 and 𝑏𝑘ℎ = 𝑏ℎ𝑘.
Consequently the complex node power injection can be expressed as:
𝑃𝑘 + 𝑗𝑄𝑘 =
= (𝑔𝑘ℎ + 𝑗𝑏𝑘ℎ + 𝑔𝑘𝑖 + 𝑗𝑏𝑘𝑖 + 2𝑔𝑘0 + 𝑗2𝑏𝑘0)∗|𝑉�𝑘|2 − (𝑔𝑘ℎ𝑉�ℎ + 𝑗𝑏𝑘ℎ𝑉�ℎ + 𝑔𝑘𝑖𝑉�𝑖 + 𝑗𝑏𝑘𝑖𝑉�𝑖)∗𝑉�𝑘
𝑃𝑘 + 𝑗𝑄𝑘 =
= (𝑔𝑘ℎ − 𝑗𝑏𝑘ℎ + 𝑔𝑘𝑖 − 𝑗𝑏𝑘𝑖 + 2𝑔𝑘0 − 𝑗2𝑏𝑘0)|𝑉�𝑘|2 − 𝑔𝑘ℎ𝑉�𝑘𝑉�ℎ∗ + 𝑗𝑏𝑘ℎ𝑉�𝑘𝑉�ℎ
∗ −
− 𝑔𝑘𝑖𝑉�𝑘𝑉�𝑖∗ + 𝑗𝑏𝑘𝑖𝑉�𝑘𝑉�𝑖
∗
And using polar form of voltage it will be:
𝑃𝑘 + 𝑗𝑄𝑘 =
= (𝑔𝑘ℎ − 𝑗𝑏𝑘ℎ + 𝑔𝑘𝑖 − 𝑗𝑏𝑘𝑖 + 2𝑔𝑘0 − 𝑗2𝑏𝑘0)|𝑉�𝑘|2 − 𝑔𝑘ℎ|𝑉�𝑘||𝑉�ℎ|𝑒𝑗𝜃𝑘ℎ + 𝑗𝑏𝑘ℎ|𝑉�𝑘||𝑉�ℎ|𝑒𝑗𝜃𝑘ℎ −
− 𝑔𝑘𝑖|𝑉�𝑘||𝑉�𝑖|𝑒𝑗𝜃𝑘𝑖 + 𝑗𝑏𝑘𝑖|𝑉�𝑘||𝑉�𝑖|𝑒𝑗𝜃𝑘𝑖
Using Euler rule: 𝑒𝑗𝜃 = cos 𝜃 + 𝑗 sin𝜃 we will have:
𝑃𝑘 + 𝑗𝑄𝑘 =
= (𝑔𝑘ℎ + 𝑔𝑘𝑖 + 2𝑔𝑘0 − 𝑗(𝑏𝑘ℎ + 𝑏𝑘𝑖 + 2𝑏𝑘0))|𝑉�𝑘|2 −
− 𝑔𝑘ℎ|𝑉�𝑘||𝑉�ℎ|(cos𝜃𝑘ℎ + 𝑗 sin𝜃𝑘ℎ) + 𝑗𝑏𝑘ℎ|𝑉�𝑘||𝑉�ℎ|(cos𝜃𝑘ℎ + 𝑗 sin𝜃𝑘ℎ) −
− 𝑔𝑘𝑖|𝑉�𝑘||𝑉�𝑖|(cos𝜃𝑘𝑖 + 𝑗 sin 𝜃𝑘𝑖) + 𝑗𝑏𝑘𝑖|𝑉�𝑘||𝑉�𝑖|(cos𝜃𝑘𝑖 + 𝑗 sin𝜃𝑘𝑖)
𝑃𝑘 + 𝑗𝑄𝑘 =
= (𝑔𝑘ℎ + 𝑔𝑘𝑖 + 2𝑔𝑘0)|𝑉�𝑘|2 − 𝑗(𝑏𝑘ℎ + 𝑏𝑘𝑖 + 2𝑏𝑘0)|𝑉�𝑘|2 − 𝑔𝑘ℎ|𝑉�𝑘||𝑉�ℎ| cos 𝜃𝑘ℎ −
− 𝑗𝑔𝑘ℎ|𝑉�𝑘||𝑉�ℎ| sin𝜃𝑘ℎ + 𝑗𝑏𝑘ℎ|𝑉�𝑘||𝑉�ℎ| cos 𝜃𝑘ℎ − 𝑏𝑘ℎ|𝑉�𝑘||𝑉�ℎ| sin𝜃𝑘ℎ −
− 𝑔𝑘𝑖|𝑉�𝑘||𝑉�𝑖| cos 𝜃𝑘𝑖 − 𝑗𝑔𝑘𝑖|𝑉�𝑘||𝑉�𝑖| sin𝜃𝑘𝑖 + 𝑗𝑏𝑘𝑖|𝑉�𝑘||𝑉�𝑖| cos 𝜃𝑘𝑖 − 𝑏𝑘𝑖|𝑉�𝑘||𝑉�𝑖| sin𝜃𝑘𝑖

Appendices 100
𝑃𝑘 + 𝑗𝑄𝑘 =
= (𝑔𝑘ℎ + 𝑔𝑘𝑖 + 2𝑔𝑘0)|𝑉�𝑘|2 − 𝑔𝑘ℎ|𝑉�𝑘||𝑉�ℎ| cos 𝜃𝑘ℎ − 𝑏𝑘ℎ|𝑉�𝑘||𝑉�ℎ| sin𝜃𝑘ℎ −
− 𝑔𝑘𝑖|𝑉�𝑘||𝑉�𝑖| cos 𝜃𝑘𝑖 − 𝑏𝑘𝑖|𝑉�𝑘||𝑉�𝑖| sin 𝜃𝑘𝑖 + j[−(𝑏𝑘ℎ + 𝑏𝑘𝑖 + 2𝑏𝑘0)|𝑉�𝑘|2 −
− 𝑔𝑘ℎ|𝑉�𝑘||𝑉�ℎ| sin 𝜃𝑘ℎ + 𝑏𝑘ℎ|𝑉�𝑘||𝑉�ℎ| cos𝜃𝑘ℎ − 𝑔𝑘𝑖|𝑉�𝑘||𝑉�𝑖| sin 𝜃𝑘𝑖 +
+ 𝑏𝑘𝑖|𝑉�𝑘||𝑉�𝑖| cos 𝜃𝑘𝑖]
Splitting above equation into real and imaginary parts gives the active and reactive node
power injection at node 𝑘 in polar form.
𝑃𝑘 =
= (𝑔𝑘ℎ + 𝑔𝑘𝑖 + 2𝑔𝑘0)|𝑉�𝑘|2 − 𝑔𝑘ℎ|𝑉�𝑘||𝑉�ℎ| cos 𝜃𝑘ℎ − 𝑏𝑘ℎ|𝑉�𝑘||𝑉�ℎ| sin𝜃𝑘ℎ −
− 𝑔𝑘𝑖|𝑉�𝑘||𝑉�𝑖| cos 𝜃𝑘𝑖 − 𝑏𝑘𝑖|𝑉�𝑘||𝑉�𝑖| sin 𝜃𝑘𝑖
𝑄𝑘 =
= −(𝑏𝑘ℎ + 𝑏𝑘𝑖 + 2𝑏𝑘0)|𝑉�𝑘|2 − 𝑔𝑘ℎ|𝑉�𝑘||𝑉�ℎ| sin 𝜃𝑘ℎ + 𝑏𝑘ℎ|𝑉�𝑘||𝑉�ℎ| cos 𝜃𝑘ℎ −
− 𝑔𝑘𝑖|𝑉�𝑘||𝑉�𝑖| sin𝜃𝑘𝑖 + 𝑏𝑘𝑖|𝑉�𝑘||𝑉�𝑖| cos 𝜃𝑘𝑖
Above equations are the total power fluxes equations for the sample network (top figure).
To conclude it for a general network, we simplify and then use a summation notation to
include all nodes. Therefore firstly for active node power it can be written that:
𝑃𝑘 =
= (𝑔𝑘ℎ + 𝑔𝑘𝑖 + 2𝑔𝑘0)|𝑉�𝑘|2 − (𝑔𝑘ℎ cos 𝜃𝑘ℎ + 𝑏𝑘ℎ sin𝜃𝑘ℎ)|𝑉�𝑘||𝑉�ℎ| − (𝑔𝑘𝑖 cos 𝜃𝑘𝑖 +
+ 𝑏𝑘𝑖 sin𝜃𝑘𝑖)|𝑉�𝑘||𝑉�𝑖|
𝑃𝑘 = 𝐺𝑘𝑘|𝑉�𝑘|2 −�|𝑉�𝑘|�𝑉�𝑗��𝑔𝑘𝑗 cos 𝜃𝑘𝑗 + 𝑏𝑘𝑗 sin𝜃𝑘𝑗�𝑛
𝑗=1𝑗≠𝑘
Where the index 𝑗 is the node number from 1 to 𝑛. For reactive node power it can be
written in a similar way that:
𝑄𝑘 = −𝐵𝑘𝑘|𝑉�𝑘|2 −�|𝑉�𝑘|�𝑉�𝑗��𝑔𝑘𝑗 sin 𝜃𝑘𝑗 − 𝑏𝑘𝑗 cos 𝜃𝑘𝑗�𝑛
𝑗=1𝑗≠𝑘

Appendices 101
Matlab Codes: Implementation of Newton-Raphson Load Flow
function [V,phi] = newton(Ybus_nr) %% Newton-Raphson Load Flow global nbus baseMVA busdatas %% Getting busdata type = busdatas(:,2); % Type of Bus 1-Slack, 2-PV, 3-PQ V = busdatas(:,3); % Slach Voltage and Voltage mag intitials Vsp = busdatas(:,3); % Slach Voltage and Voltage mag intitials phi = busdatas(:,4); % Voltage Angle intitials Pg = busdatas(:,5)/baseMVA;
Qg = busdatas(:,6)/baseMVA;
Pl = busdatas(:,7)/baseMVA;
Ql = busdatas(:,8)/baseMVA;
Qmin = busdatas(:,9)/baseMVA; % Minimum Reactive Power Limit.. Qmax = busdatas(:,10)/baseMVA; % Maximum Reactive Power Limit.. Psp = Pg - Pl; % calculate powers in the busses: P Specified Qsp = Qg - Ql; % calculate powers in the busses: Q Specified pq = find(type == 3); % PQ Buses(there is no generation) pv = find(type == 2 | type == 1); % PV Buses npq = length(pq); % No. of PQ buses G_nr = real(Ybus_nr);
B_nr = imag(Ybus_nr);
Tol = 1;
itr = 1; %% Iteration Starts: while (Tol > 1e-9 && itr < 100) P = zeros(nbus,1);
Q = zeros(nbus,1);
% Calculate P and Q for i = 1:nbus for k = 1:nbus P(i) = P(i) + V(i)* V(k)*(G_nr(i,k)*cos(phi(i)-phi(k)) + B_nr(i,k)*sin(phi(i)-phi(k))); % pp. 77 Wang. (eq 2.9) Q(i) = Q(i) + V(i)* V(k)*(G_nr(i,k)*sin(phi(i)-phi(k)) - B_nr(i,k)*cos(phi(i)-phi(k))); % ... end end

Appendices 102
% Checking Q-limit violations.. if itr <= 7 && itr > 2 % Only checked up to 7th iterations.. for n = 2:nbus if type(n) == 2 QG = Q(n)+Ql(n);
if QG < Qmin(n) V(n) = V(n) + 0.01;
elseif QG > Qmax(n) V(n) = V(n) - 0.01;
end end end end dP = Psp-P; % Calculate change from specified value pp.78 Wang. (eq 2.13) dQ1 = Qsp-Q; % ... k = 1; dQ = zeros(npq,1); for i = 1:nbus if type(i) == 3 dQ(k,1) = dQ1(i); k = k+1; end end r = [dP(2:nbus); dQ]; % Mismatch Vector, not considering the first value that is the slack bus P,Q %% The Jacobian matrix % J1 - Derivative of Real Power Injections with Angles J1 = zeros(nbus-1,nbus-1);
for i = 1:(nbus-1) m = i+1; for k = 1:(nbus-1) n = k+1; if n == m for n = 1:nbus J1(i,k) = J1(i,k) - V(m)* V(n)*(G_nr(m,n)*sin(phi(m)-phi(n)) - B_nr(m,n)*cos(phi(m)-phi(n))); % pp. 84 Wang. eq(2.41) end J1(i,k) = J1(i,k) - V(m)^2*B_nr(m,m);
else J1(i,k) = V(m)* V(n)*(G_nr(m,n)*sin(phi(m)-phi(n)) - B_nr(m,n)*cos(phi(m)-phi(n))); % pp. 84 Wang. eq(2.42) end end end % J2 - Derivative of Real Power Injections with V J2 = zeros(nbus-1,npq);

Appendices 103
for i = 1:(nbus-1) m = i+1; for k = 1:npq n = pq(k); if n == m for n = 1:nbus J2(i,k) = J2(i,k) + V(n)*(G_nr(m,n)*cos(phi(m)-phi(n)) + B_nr(m,n)*sin(phi(m)-phi(n))); end J2(i,k) = J2(i,k) + V(m)*G_nr(m,m);
else J2(i,k) = V(m)*(G_nr(m,n)*cos(phi(m)-phi(n)) + B_nr(m,n)*sin(phi(m)-phi(n))); end end end % J3 - Derivative of Reactive Power Injections with Angles J3 = zeros(npq,nbus-1);
for i = 1:npq m = pq(i); for k = 1:(nbus-1) n = k+1; if n == m for n = 1:nbus J3(i,k) = J3(i,k) + V(m)* V(n)*(G_nr(m,n)*cos(phi(m)-phi(n)) + B_nr(m,n)*sin(phi(m)-phi(n))); end J3(i,k) = J3(i,k) - V(m)^2*G_nr(m,m);
else J3(i,k) = V(m)* V(n)*(-G_nr(m,n)*cos(phi(m)-phi(n)) - B_nr(m,n)*sin(phi(m)-phi(n))); % pp. 84 Wang. eq(2.44) !!!!! MANFI end end end % J4 - Derivative of Reactive Power Injections with V J4 = zeros(npq,npq);
for i = 1:npq m = pq(i); for k = 1:npq n = pq(k); if n == m for n = 1:nbus J4(i,k) = J4(i,k) + V(n)*(G_nr(m,n)*sin(phi(m)-phi(n)) - B_nr(m,n)*cos(phi(m)-phi(n))); end J4(i,k) = J4(i,k) - V(m)*B_nr(m,m);
else J4(i,k) = V(m)*(G_nr(m,n)*sin(phi(m)-phi(n)) - B_nr(m,n)*cos(phi(m)-phi(n))); % pp. 85 Wang. eq(2.48) !!!!! MANFI end end end

Appendices 104
J = [J1 J2;
J3 J4]; % Jacobian Matrix % J = Jacob(busdatas,ybus,nbus); X = J\r; % inv(J)*r; <TIME SAVING> % Correction Vector dTh = X(1:nbus-1); % Change in Voltage Angle dV = X(nbus:end); % Change in Voltage Magnitude %% record the phita V and phita Angle dV_sq(itr,:) = dV'; dTh_sq(itr,:) = dTh'; %% Updating State Vectors phi(2:nbus) = dTh + phi(2:nbus); % Angle update k = 1; for i = 1:nbus if type(i) == 3 V(i) = dV(k) + V(i); % Voltage Magnitude update k = k+1; else V(i) = Vsp(i); % reset the slack and PV bus voltages to the specified values end end itr = itr + 1; % iteration counter Tol = max(abs(r));
end % end of Iterations % fprintf('N-R Iterations = %4d', itr);fprintf('\n'); %% Figure of convergence % figure % plot([1:itr-1],diag(dV_sq*dV_sq'),[1:itr-1],diag(dTh_sq*dTh_sq'),'g'); % title('Load Flow: phita-V and phita-Phi decrease according to Iterations'); xlabel('iteration'); ylabel('phita V & Angle'); grid on % figure for convergence end

Appendices 105
Matlab Codes: Implementation of WLS State Estimation
max_iters = 50; % number of iterations tol = 1e-6; % normally e-6 %% State Vector initialization: V_SE = ones(nbus,1); % Initialize the bus voltages: all ones V_SE(v_meas_bus_nr,1) = v_meas_perturbed; % put the slack bus voltage and PV bus voltages phi_SE = zeros(nbus,1); % Initialize the bus angles: all zeroz % if pmu_meas_bus_nr % phi_SE(pmu_meas_bus_nr(:,2),1) = - phi_meas_perturbed; % put the phases az inits % end
state = [phi_SE(2:end); V_SE]; % State Vector size: 27 = (2*n)-1 iters = 0; converged = 0; while (~converged && iters < max_iters) iters = iters + 1; %% Measurement Function: f f1 = V_SE(v_meas_bus_nr,1); % Voltage Magnitude (Traditional + PMU) f2 = zeros(n_pi_meas,1); f3 = zeros(n_qi_meas,1); f4 = zeros(n_pf_meas,1); f5 = zeros(n_qf_meas,1); if pmu_meas_bus_nr f6 = phi_SE(pmu_meas_bus_nr(:,1),1) - phi_SE(pmu_meas_bus_nr(:,2),1); % PMU Phases else f6 = []; end % V_SE = V_nr; % phi_SE = phi_nr; %Real power injection calculation OK for i = 1:n_pi_meas m = pi_meas_bus_nr(i); for k = 1:nbus f2(i) = f2(i) + V_SE(m)*V_SE(k)*(G(m,k)*cos(phi_SE(m)-phi_SE(k)) + B(m,k)*sin(phi_SE(m)-phi_SE(k))); end end % Reactive power injection calculations OK for i = 1:n_qi_meas m = qi_meas_bus_nr(i); for k = 1:nbus f3(i) = f3(i) + V_SE(m)*V_SE(k)*(G(m,k)*sin(phi_SE(m)-phi_SE(k)) - B(m,k)*cos(phi_SE(m)-phi_SE(k))); end end

Appendices 106
% Real power flows calculation OK for i = 1:n_pf_meas m = pf_meas_bus_nr(i,1); n = pf_meas_bus_nr(i,2); f4(i) = -V_SE(m)^2*(G(m,n)) + V_SE(m)*V_SE(n)*(G(m,n)*cos(phi_SE(m)-phi_SE(n)) + B(m,n)*sin(phi_SE(m)-phi_SE(n))); end % Reactive power flows calculation OK for i = 1:n_qf_meas m = qf_meas_bus_nr(i,1); n = qf_meas_bus_nr(i,2); f5(i) = V_SE(m)^2*(B(m,n)- bbus(m,n)) + V_SE(m)*V_SE(n)*(G(m,n)*sin(phi_SE(m)-phi_SE(n)) - B(m,n)*cos(phi_SE(m)-phi_SE(n))); end f = [f1; f2; f3; f4; f5; f6]; %% Jacobians % g11 - Derivative of V_SE with respect to angles: All Zeros
g11 = zeros(n_v_meas,nbus-1); % g12 - Derivative of V_SE with respect to V_SE g12 = zeros(n_v_meas,nbus); for k = 1:n_v_meas for n = 1:nbus if n == k g12(k,n) = 1; end end end % g21 - Derivative of Real Power Injections with Angles g21 = zeros(n_pi_meas,nbus-1); for i = 1:n_pi_meas m = pi_meas_bus_nr(i); for k = 1:(nbus-1) if k+1 == m for n = 1:nbus g21(i,k) = g21(i,k) + V_SE(m)* V_SE(n)*(-G(m,n)*sin(phi_SE(m)-phi_SE(n)) + B(m,n)*cos(phi_SE(m)-phi_SE(n))); end g21(i,k) = g21(i,k) - V_SE(m)^2*B(m,m); else g21(i,k) = V_SE(m)* V_SE(k+1)*(G(m,k+1)*sin(phi_SE(m)-phi_SE(k+1)) - B(m,k+1)*cos(phi_SE(m)-phi_SE(k+1))); % k+1 end end end % g22 - Derivative of Real Power Injections with V_SE g22 = zeros(n_pi_meas,nbus);

Appendices 107
for i = 1:n_pi_meas m = pi_meas_bus_nr(i); for k = 1:(nbus) if k == m for n = 1:nbus g22(i,k) = g22(i,k) + V_SE(n)*(G(m,n)*cos(phi_SE(m)-phi_SE(n)) + B(m,n)*sin(phi_SE(m)-phi_SE(n))); end g22(i,k) = g22(i,k) + V_SE(m)*G(m,m); else g22(i,k) = V_SE(m)*(G(m,k)*cos(phi_SE(m)-phi_SE(k)) + B(m,k)*sin(phi_SE(m)-phi_SE(k))); end end end % g31 - Derivative of Reactive Power Injections with Angles g31 = zeros(n_qi_meas,nbus-1); for i = 1:n_qi_meas m = qi_meas_bus_nr(i); for k = 1:(nbus-1) if k+1 == m for n = 1:nbus g31(i,k) = g31(i,k) + V_SE(m)* V_SE(n)*(G(m,n)*cos(phi_SE(m)-phi_SE(n)) + B(m,n)*sin(phi_SE(m)-phi_SE(n))); end g31(i,k) = g31(i,k) - V_SE(m)^2*G(m,m); else g31(i,k) = V_SE(m)* V_SE(k+1)*(-G(m,k+1)*cos(phi_SE(m)-phi_SE(k+1)) - B(m,k+1)*sin(phi_SE(m)-phi_SE(k+1))); % k+1 end end end % g32 - Derivative of Reactive Power Injections with V_SE g32 = zeros(n_qi_meas,nbus); for i = 1:n_qi_meas m = qi_meas_bus_nr(i); for k = 1:(nbus) if k == m for n = 1:nbus g32(i,k) = g32(i,k) + V_SE(n)*(G(m,n)*sin(phi_SE(m)-phi_SE(n)) - B(m,n)*cos(phi_SE(m)-phi_SE(n))); end g32(i,k) = g32(i,k) - V_SE(m)*B(m,m); else g32(i,k) = V_SE(m)*(G(m,k)*sin(phi_SE(m)-phi_SE(k)) - B(m,k)*cos(phi_SE(m)-phi_SE(k))); end end end % g41 - Derivative of Real Power Flows with Angles

Appendices 108
g41 = zeros(n_pf_meas,nbus-1); for i = 1:n_pf_meas m = pf_meas_bus_nr(i,1); n = pf_meas_bus_nr(i,2); for k = 1:(nbus-1) if k+1 == m g41(i,k) = -V_SE(m)* V_SE(n)*(G(m,n)*sin(phi_SE(m)-phi_SE(n)) - B(m,n)*cos(phi_SE(m)-phi_SE(n))); else if k+1 == n g41(i,k) = V_SE(m)* V_SE(n)*(G(m,n)*sin(phi_SE(m)-phi_SE(n)) - B(m,n)*cos(phi_SE(m)-phi_SE(n))); else g41(i,k) = 0; end end end end % g42 - Derivative of Real Power Flows with V_SE g42 = zeros(n_pf_meas,nbus); for i = 1:n_pf_meas m = pf_meas_bus_nr(i,1); n = pf_meas_bus_nr(i,2); for k = 1:nbus if k == m g42(i,k) = V_SE(n)*(G(m,n)*cos(phi_SE(m)-phi_SE(n)) + B(m,n)*sin(phi_SE(m)-phi_SE(n))) - 2*G(m,n)*V_SE(m); else if k == n g42(i,k) = V_SE(m)*(G(m,n)*cos(phi_SE(m)-phi_SE(n)) + B(m,n)*sin(phi_SE(m)-phi_SE(n))); else g42(i,k) = 0; end end end end % g51 - Derivative of Reactive Power Flows with Angles g51 = zeros(n_qf_meas,nbus-1); for i = 1:n_qf_meas m = qf_meas_bus_nr(i,1); n = qf_meas_bus_nr(i,2); for k = 1:(nbus-1) if k+1 == m g51(i,k) = V_SE(m)* V_SE(n)*(G(m,n)*cos(phi_SE(m)-phi_SE(n)) + B(m,n)*sin(phi_SE(m)-phi_SE(n))); else if k+1 == n g51(i,k) = - V_SE(m)* V_SE(n)*(G(m,n)*cos(phi_SE(m)-phi_SE(n)) + B(m,n)*sin(phi_SE(m)-phi_SE(n))); else g51(i,k) = 0; end end end end

Appendices 109
% g52 - Derivative of Reactive Power Flows with V_SE g52 = zeros(n_qf_meas,nbus); for i = 1:n_qf_meas m = qf_meas_bus_nr(i,1); n = qf_meas_bus_nr(i,2); for k = 1:nbus if k == m g52(i,k) = V_SE(n)*(G(m,n)*sin(phi_SE(m)-phi_SE(n)) - B(m,n)*cos(phi_SE(m)-phi_SE(n)))... + 2*V_SE(m)*(B(m,n) - bbus(m,n)); else if k == n g52(i,k) = V_SE(m)*(G(m,n)*sin(phi_SE(m)-phi_SE(n)) - B(m,n)*cos(phi_SE(m)-phi_SE(n))); else g52(i,k) = 0; end end end end % g61 - Derivative of PMU Phases with respect to angles g61 = zeros(n_phi_meas,nbus-1); for i = 1:n_phi_meas m = pmu_meas_bus_nr(i,1); % from n = pmu_meas_bus_nr(i,2); % to for k = 1:(nbus-1) if k+1 == m g61(i,k) = 1; end if k+1 == n g61(i,k) = -1; end end end % g62 - Derivative of PMU Phases with respect to V_SE g62 = zeros(n_phi_meas,nbus); %% Measurement Jacobian, g = df / dx g = [g11 g12; g21 g22; g31 g32; g41 g42; g51 g52; g61 g62]; % test if g is full rank [mmm, nnn] = size(g); rk = rank(g); if rk < min(mmm, nnn) error('System is not observable'); end %% Hessian Matrix or Gain Matrix(double derivative), H H = g' * (sigma_square\g); % g'*inv(sigma_square)*g; % <FOR TIME SAVING CALCULATION>

Appendices 110
%% Objective Function, J % J = sum(sigma_square\res.^2); % sum(inv(sigma_square)*res.^2); % <FOR TIME SAVING CALCULATION> %% Residue res = y_perturbed - f; %% State Vector: delta_x = H\(g'*(sigma_square\res)); % inv(H)*(g'*inv(sigma_square)*res) % <FOR TIME SAVING CALCULATION> state = state + delta_x; phi_SE(2:end) = state(1:nbus-1); V_SE = state(nbus:end);
%% check for convergence normF = max(abs(delta_x)); %normF = norm((g'*inv(sigma_square)*res), inf); if normF < tol converged = 1; end % fprintf('WLS iteration # %4d: norm of mismatch: %5.20f\n', iters, normF); end %%%%%%%%%%%%%%%%%%% end of iterations %% THEORY: Variance Covariance matrix of estimates sigma_x sigma_x = diag(inv(g'*(sigma_square\g))); sigma_x_v = sqrt(sigma_x(nbus:end)); sigma_x_phi = [0; sqrt(sigma_x(1:nbus-1))*180/pi];

Appendices 111
Matlab Codes: Building the bus admittance matrix
%% Formulation of Ybus by singular transformation method (With Transformer Tap settings and Shunt Admittances) function [Ybus A] = ybus_incidence(r,x,b) global fb tb nbranch nbus linedatas baseMVA busdatas tap = linedatas(:,6); % Tap setting values (one for the other buses) GS = busdatas(:,11); % shunt conductance (MW at V = 1.0 p.u.) BS = busdatas(:,12); % shunt susceptance (MW at V = 1.0 p.u.) Ysh = ( GS + 1j * BS) / baseMVA; % vector of shunt admittances Z= r + 1i*x; % z matrix... Y = 1./Z; %% Formation of Bus Incidence matrix A (signs: comes in is -1, goes out is +1) A=zeros(nbranch+nbus,nbus); for i=1:nbus % building top I submatrix: for j=1:nbus if(i==j) A(i,i)=1; end end end for i = nbus+1 : nbus+nbranch % building Buttom A_branch submatrix: A( i , fb(i-nbus)) = 1; A( i , tb(i-nbus)) = -1; end %% Calculation of primitive matrix Yprimitive = zeros(nbranch+nbus,1); % For buses: for i=1:nbranch Yprimitive(fb(i)) = Yprimitive(fb(i)) + 1i*b(i)/2 + (1-tap(i)) * Y(i) / tap(i)^2; Yprimitive(tb(i)) = Yprimitive(tb(i)) + 1i*b(i)/2 + (tap(i)-1) * Y(i) / tap(i); end Yprimitive(1:nbus) = Yprimitive(1:nbus) + Ysh; % adding shunt admittances % Branches: for i=1:nbranch Yprimitive(i+nbus) = Y(i) / tap(i); end %% Bus Admittance matrix: Ybus = A' * diag(Yprimitive) * A; %% shunt admittance

Appendices 112
Matlab Codes: Calculation of Power injections and power flows
measurements
%% Calculation of Power Injections (p.u) % V - Voltage Magnitude pu % phi - Voltage Angle in radians function [Pi, Qi] = power_inj(V,phi,Ybus) % function Si = power_inj(V,phi,Ybus) global nbus G = real(Ybus); % Bus Admittance matrix split:
B = imag(Ybus);
%% power injection calculations From WLS Pi = zeros(nbus,1);
Qi = zeros(nbus,1);
for i = 1:nbus for j = 1:nbus Pi(i) = Pi(i) + V(i)*V(j)*(G(i,j)*cos(phi(i)-phi(j)) + B(i,j)*sin(phi(i)-phi(j))); Qi(i) = Qi(i) + V(i)*V(j)*(G(i,j)*sin(phi(i)-phi(j)) - B(i,j)*cos(phi(i)-phi(j))); end end

Appendices 113
%% Calculation of Line Power flows (p.u) % V - Voltage Magnitude pu % phi - Voltage Angle in radians function [Pij, Qij, Pji, Qji] = power_flow(V,phi,Ybus) global fb tb nbus nbranch b_perturbed G = real(Ybus);
B = imag(Ybus);
%% Polar coordination: % Shunt Admittance Matrix Formation: % Off-diagonals are the mutual admittances between the respective nodes bbus_perturbed = zeros(nbus,nbus); for k=1:nbranch bbus_perturbed(fb(k),tb(k)) = b_perturbed(k) ./ 2; bbus_perturbed(tb(k),fb(k)) = bbus_perturbed(fb(k),tb(k)); end % power flows calculation for i = 1:nbranch m = fb(i); n = tb(i); Pij(i) = -V(m)^2*(G(m,n)) + V(m)*V(n)*(G(m,n)*cos(phi(m)-phi(n)) + B(m,n)*sin(phi(m)-phi(n))); Qij(i) = V(m)^2*(B(m,n)- bbus_perturbed(m,n)) + V(m)*V(n)*(G(m,n)*sin(phi(m)-phi(n)) - B(m,n)*cos(phi(m)-phi(n))); Pji(i) = -V(n)^2*(G(n,m)) + V(n)*V(m)*(G(n,m)*cos(phi(n)-phi(m)) + B(n,m)*sin(phi(n)-phi(m))); Qji(i) = V(n)^2*(B(n,m)- bbus_perturbed(n,m)) + V(n)*V(m)*(G(n,m)*sin(phi(n)-phi(m)) - B(n,m)*cos(phi(n)-phi(m))); end

Appendices 114
Matlab Codes: Measurement data calculation
%% Determining the Number of measurements: n_v_meas = length(v_meas_bus_nr); % Number of Voltage measurements n_pi_meas = length(pi_meas_bus_nr); % Number of Real Power Injection measurements n_qi_meas = length(qi_meas_bus_nr); % Number of Reactive Power Injection measurements n_pf_meas = length(pf_meas_bus_nr); % Number of Real Power Flow measurements n_qf_meas = length(qf_meas_bus_nr); % Number of Reactive Power Flow measurements n_phi_meas = length(pmu_meas_bus_nr); % Number of Voltage measurements %% Variance Covariance Matrix(weighting Matrix) construction: sigma_vector = [ sigma_v * ones(n_v_meas,1) sigma_pi * ones(n_pi_meas, 1) sigma_qi * ones(n_qi_meas, 1) sigma_pf * ones(n_pf_meas, 1) sigma_qf * ones(n_qf_meas, 1) sigma_phi* ones(n_phi_meas,1) ]; sigma_square = diag(sigma_vector).^2; % Measurement Variance Covariance matrix %% Voltage Measurements: v_meas = V_nr(v_meas_bus_nr); % set the NR voltages to the measured voltage data. %% PMU Measurements: if pmu_meas_bus_nr phi_meas = phi_nr(pmu_meas_bus_nr(:,1),1) - phi_nr(pmu_meas_bus_nr(:,2),1); % set the NR phases to the measured pmu data. else phi_meas = []; end %% Power Injection Measurements: [Pi_nr Qi_nr] = power_inj(V_nr , phi_nr, Ybus_perturbed); % Bus Power injections calculations pi_meas = Pi_nr(pi_meas_bus_nr); % set the NR active Power Injections to the measured data. qi_meas = Qi_nr(qi_meas_bus_nr); % set the NR reactive Power Injections to the measured data. %% Power Flow Measuremets: [Pij, Qij, Pji, Qji] = power_flow(V_nr , phi_nr, Ybus_perturbed); % Bus Power flows calculations % Active power flow: pf_meas = []; for i = 1:length(pf_meas_bus_nr) m = pf_meas_bus_nr(i,1);

Appendices 115
n = pf_meas_bus_nr(i,2); for p = 1:nbranch if m == fb(p) && n == tb(p) pf_meas(i,1) = Pij(p); elseif m == tb(p) && n == fb(p) pf_meas(i,1) = Pji(p); end end end % ReActive power flow: qf_meas = []; for i = 1:length(qf_meas_bus_nr) m = qf_meas_bus_nr(i,1); n = qf_meas_bus_nr(i,2); for p = 1:nbranch if m == fb(p) && n == tb(p) qf_meas(i,1) = Qij(p); elseif m == tb(p) && n == fb(p) qf_meas(i,1) = Qji(p); end end end %% Measurement Perturbation: v_meas_perturbed = normrnd(v_meas , sigma_v * v_meas); pi_meas_perturbed = normrnd(pi_meas , sigma_pi * abs(pi_meas)); qi_meas_perturbed = normrnd(qi_meas , sigma_qi * abs(qi_meas)); pf_meas_perturbed = normrnd(pf_meas , sigma_pf * abs(pf_meas)); qf_meas_perturbed = normrnd(qf_meas , sigma_qf * abs(qf_meas)); phi_meas_perturbed = normrnd(phi_meas, sigma_phi* abs(phi_meas)); %% Perturbed Measurement Vector composition: y_perturbed = [v_meas_perturbed pi_meas_perturbed qi_meas_perturbed pf_meas_perturbed qf_meas_perturbed phi_meas_perturbed];

Appendices 116
Matlab Codes: Line Data File Structure (linedata.m)
function linedatas = linedata() global test_case switch test_case %% case 4 % | From | To | R | X | B | X'mer | % | Bus | Bus | pu | pu | pu | TAP (a) | linedatas = [1 2 0.02 0.06 0.20 1 1 3 0.02 0.06 0.25 1 2 3 0.05 0.10 0.0 1 2 4 0.0 0.08 0.0 0.98 ]; %% case 6 % | From | To | R | X | B | X'mer | % | Bus | Bus | pu | pu | pu | TAP (a) | linedatas = [1 2 0.1 0.2 0.04 1 1 4 0.05 0.2 0.04 1 1 5 0.08 0.3 0.06 1 2 3 0.05 0.25 0.06 1 2 4 0.05 0.1 0.02 1 2 5 0.1 0.3 0.04 1 2 6 0.07 0.2 0.05 1 3 5 0.12 0.26 0.05 1 3 6 0.02 0.1 0.02 1 4 5 0.2 0.4 0.08 1 5 6 0.1 0.3 0.06 1 ]; %% case 14 % | From | To | R | X | B | X'mer | % | Bus | Bus | pu | pu | pu | TAP (a) | linedatas = [1 2 0.01938 0.05917 0.0528 1 1 5 0.05403 0.22304 0.0492 1 2 3 0.04699 0.19797 0.0438 1 2 4 0.05811 0.17632 0.0374 1 2 5 0.05695 0.17388 0.0340 1 3 4 0.06701 0.17103 0.0346 1 4 5 0.01335 0.04211 0.0128 1 4 7 0.0 0.20912 0.0 0.978 4 9 0.0 0.55618 0.0 0.969 5 6 0.0 0.25202 0.0 0.932 6 11 0.09498 0.19890 0.0 1 6 12 0.12291 0.25581 0.0 1 6 13 0.06615 0.13027 0.0 1 7 8 0.0 0.17615 0.0 1 7 9 0.0 0.11001 0.0 1 9 10 0.03181 0.08450 0.0 1 9 14 0.12711 0.27038 0.0 1 10 11 0.08205 0.19207 0.0 1 12 13 0.22092 0.19988 0.0 1 13 14 0.17093 0.34802 0.0 1 ]; And so on for other cases...

Appendices 117
Matlab Codes: Bus Data File Structure (busdata.m)
% Returns Bus data function busdatas = busdata() global test_case baseMVA V_true Phi_true switch test_case % Bus Types: % 1: Slack Bus: V and thera are known (P and Q must be solved) % 2: PV Bus: P and V_mag are known <generator busses are PV>(Q and theta must solved) % 3: PQ Bus: P and Q are known(V and theta must solved) %% Example of 2.1 in Abur Book: case 4 % |Bus | Type | Vsp*|theta | PGi | QGi | PLi | QLi | Qmin | Qmax | Gs | Bs | busdatas =[1 1 1.0 0 1.9963 .44939 0 0 0 0 0 0; 2 3 1.0 0 0 0 .49944 .30229 0 0 0 0; 3 3 1.0 0 0 0 1.2006 .79897 0 0 0 0.5; 4 3 1.0 0 0 0 .25057 .09907 0 0 0 0; ]; baseMVA = 1; % Base MVA V_true = [1 0.9629 0.9597 0.9742]'; Phi_true = [0 -2.76 -3.58 -3.96]'; %% 6 bus example from pp. 104, 112, 119, 123-124, 549 of "Power Generation, Operation, and Control, 2nd Edition", % by Allen. J. Wood and Bruce F. Wollenberg, John Wiley & Sons, NY, Jan 1996. case 6 % |Bus | Type | Vsp*|theta | PGi | QGi | PLi | QLi | Qmin | Qmax | Gs | Bs | busdatas =[1 1 1.05 0 107.9 16 0 0 0 0 0 0; 2 2 1.05 0 50 74.4 0 0 0 0 0 0; 3 2 1.07 0 60 89.6 0 0 0 0 0 0; 4 3 1.0 0 0 0 70 70 0 0 0 0; 5 3 1.0 0 0 0 70 70 0 0 0 0; 6 3 1.0 0 0 0 70 70 0 0 0 0; ]; baseMVA = 100; % Base MVA V_true = [241.5 241.5 246.1 227.6 226.7 231]'./230; % baseKV is 230 and baseMVA is 100 Phi_true = [0 -3.7 -4.3 -4.2 -5.3 -5.9]'; %% IEEE 14 bus system case 14 busdatas =[1 1 1.060 0 232.4 -16.9 0 0 0 0 0 0; 2 2 1.045 0 40 42.4 21.7 12.7 -40 50 0 0; 3 2 1.010 0 0 23.4 94.2 19.0 0 40 0 0; 4 3 1.0 0 0 0 47.8 -3.9 0 0 0 0; 5 3 1.0 0 0 0 7.6 1.6 0 0 0 0; 6 2 1.070 0 0 12.2 11.2 7.5 -6 24 0 0; 7 3 1.0 0 0 0 0.0 0.0 0 0 0 0; 8 2 1.090 0 0 17.4 0.0 0.0 -6 24 0 0; 9 3 1.0 0 0 0 29.5 16.6 0 0 0 19; 10 3 1.0 0 0 0 9.0 5.8 0 0 0 0; 11 3 1.0 0 0 0 3.5 1.8 0 0 0 0; 12 3 1.0 0 0 0 6.1 1.6 0 0 0 0; 13 3 1.0 0 0 0 13.5 5.8 0 0 0 0; 14 3 1.0 0 0 0 14.9 5.0 0 0 0 0]; baseMVA = 100; % Base MVA V_true = [1.060 1.045 1.010 1.019 1.020 1.070 1.062 1.090 1.056 1.051 1.057 1.055 1.050 1.036]'; Phi_true = [0 -4.98 -12.72 -10.33 -8.78 -14.22 -13.37 -13.36 -14.94 -15.10 -14.79 -15.07 -15.16 -16.04]'; And so on for other cases...

Appendices 118
Matlab Codes: Measurement Data File Structure (measurement14.m)
%% Measurement Data Preparation: %states = 27 %measurements = 1.5 * states = 41 %% The bus numbers that traditional voltage mag. measurement happens: v_meas_bus_nr = [1 2 3 6 8]'; %% The bus numbers that PMU measurement happens: pmu_meas_bus_nr = [ 1 6 1 9 ]; v_meas_bus_nr = unique([pmu_meas_bus_nr(:);v_meas_bus_nr]); %% The bus numbers that active power injection measurement happens: pi_meas_bus_nr = [1 2 6 8 9 10 11 12 14]'; %% The bus numbers that active and reactive power injection measurement happens: qi_meas_bus_nr = pi_meas_bus_nr; %% The bus numbers that active power flow measurement happens: (Power is flowing from the first number to the second) pf_meas_bus_nr = [ 1 2 1 5 2 3 2 4 3 4 4 5 4 7 5 6 6 13 ]; %% The bus numbers that reactive power flow measurement happens: qf_meas_bus_nr = pf_meas_bus_nr;

Appendices 119
Matlab Codes: Implementation of Proposed Algorithm
%% Power System State Estimation Considering Parameters Uncertainty tic global fb tb nbranch nbus linedatas busdatas V_nr phi_nr test_case r_perturbed x_perturbed b_perturbed r_nominal x_nominal b_nominal baseMVA Phi_true V_true %% Initials: test_case = 14; % Run which case data? IEEE 14 or 30 or 57 or 118 bus test system? measurement14; % Measurement Data MC_tests = 1000; % MC test numbers % Power Network Parameters(r, x, b) noise: sigma_params_all = [0 0.05 0.10 0.15 0.20 0.25]; showplots = 1; % set it 1 if you want to see the figures display_SE_results = 1; %% Variance of Voltage magnitude, Active and reactive Power Injections and flows: sigma_v = 0.001; % 1e-20; % sigma_phi = 0.0001; % 1e-20; % sigma_pi = 0.01; % 1e-20; % sigma_qi = 0.01; % 1e-20; % sigma_pf = 0.01; % 1e-20; % sigma_qf = 0.01; % 1e-20; % rho = 0.0; % correlation factor %% Reading Nominal Line Parameters and Ybus arrangement: linedatas = linedata(); % Calling "linedata.m" for Line Data fb = linedatas(:,1); % From bus number tb = linedatas(:,2); % To bus number nbranch = length(fb); % number of branches nbus = test_case; % number of buses negatives = 0; r_nominal = linedatas(:,3); % Resistance, R x_nominal = linedatas(:,4); % Reactance, X b_nominal = linedatas(:,5); % Shunt Admittance busdatas = busdata(); % reading bus data [Ybus_nominal A_incidence Yprimitive_nominal] = ybus_modified(r_nominal,x_nominal,b_nominal); G = real(Ybus_nominal); % Bus Admittance matrix split: B = imag(Ybus_nominal); %% sigma_params loop for sigma_params_idx = 1:length(sigma_params_all) sigma_params = sigma_params_all(sigma_params_idx); V_error_seq = []; phi_error_seq = []; V_SE_seq = []; phi_SE_seq = []; V_nr_seq = []; phi_nr_seq = []; sigma_x_v_seq = []; sigma_x_phi_seq = [];

Appendices 120
%% MC iterations: for MC_test = 1:MC_tests %% Parameters Perturbation: r_perturbed = normrnd(r_nominal, sigma_params .* r_nominal); x_perturbed = normrnd(x_nominal, sigma_params .* x_nominal); b_perturbed = normrnd(b_nominal, sigma_params .* b_nominal); while find(r_perturbed < 0) negatives = negatives + length(find(r_perturbed<0)); fprintf('\nRecalculating r again...'); pause(1); r_perturbed = normrnd(r_nominal, sigma_params .* r_nominal); % Generate and add again random numbers end while find(x_perturbed < 0) negatives = negatives + length(find(x_perturbed<0)); fprintf('\nRecalculating x again...'); pause(1); x_perturbed = normrnd(x_nominal, sigma_params .* x_nominal); % Generate and add again random numbers end while find(b_perturbed < 0) negatives = negatives + length(find(b_perturbed<0)); fprintf('\nRecalculating b again...'); pause(1); b_perturbed = normrnd(b_nominal, sigma_params .* b_nominal); % Generate and add again random numbers end %% Correlating the Resistance parameters: if rho > 0 && sigma_params > 0 r_nominal_nonzeros = nonzeros(r_nominal); sigma_r_corr = zeros(length(r_nominal_nonzeros),1); for i=1:length(r_nominal_nonzeros) % diagonal elements: sigma_r_corr(i,i) = ( sigma_params * r_nominal_nonzeros(i) ) ^ 2; end for i=1:length(r_nominal_nonzeros) % non-diagonal elements: for j=1:length(r_nominal_nonzeros) if i ~= j sigma_r_corr(i,j) = rho * sqrt(sigma_r_corr(i,i)*sigma_r_corr(j,j)); end end end L_sigma_r_corr = chol(sigma_r_corr,'lower'); % Cholesky factorization: produces an upper triangular matrix r_perturbation = normrnd(0,1,length(r_nominal_nonzeros),1); % normrnd(0,sigma_params .* r_nominal,nbranch,1); r_perturbed_nonzeros = L_sigma_r_corr * r_perturbation + r_nominal_nonzeros; r_perturbed = zeros(nbranch,1); r_perturbed(find(r_nominal~=0)) = r_perturbed_nonzeros; % Recalculation in Negative case while find(r_perturbed<0) fprintf('Warning: The number of negative values for r while correlating it in this MC trial: '); fprintf('%2g',

Appendices 121
length(find(r_perturbed<0))); fprintf('\nRecalculating correlated r again...'); pause(1); % r_perturbed(find(r_perturbed<0)) = 0; % Changing negative values to zero. negatives = negatives + length(find(r_perturbed<0)); r_perturbation = normrnd(0,1,length(r_nominal_nonzeros),1); % normrnd(0,sigma_params .* r_nominal,nbranch,1); r_perturbed_nonzeros = L_sigma_r_corr * r_perturbation + r_nominal_nonzeros; r_perturbed = zeros(nbranch,1); r_perturbed(find(r_nominal~=0)) = r_perturbed_nonzeros; end end %% Bus Admittance Formation [Ybus_perturbed A_incidence Yprimitive] = ybus_modified(r_perturbed,x_perturbed,b_perturbed); %% Newton Raphson calculations: [V_nr,phi_nr] = newton(Ybus_perturbed); phi_nr_dg = 180/pi*phi_nr; % Angles in Degree %% WLS State Estimation % Shunt Admittance Matrix Formation: % Off-diagonals are the mutual admittances between the respective nodes bbus = zeros(nbus,nbus); for k=1:nbranch bbus(fb(k),tb(k)) = b_nominal(k) ./ 2; bbus(tb(k),fb(k)) = bbus(fb(k),tb(k)); end meas_calc; % Calculates the measured values according to the perturbed NR states. wls; % WLS State Estimation: phi_SE_dg = 180/pi*phi_SE; % rad to degree %% Collecting V and Phi errors in each iterarion V_error = V_nr - V_SE; phi_error = phi_nr_dg - phi_SE_dg; phi_errors = sqrt(mean(phi_error_seq.^2))'; if abs(V_error) < 10 % to exclude incorrect answers ############# if abs(phi_error) < 20 V_error_seq(end+1, :) = V_error; % each row is a new iteration and columns are buses phi_error_seq(end+1, :) = phi_error; V_SE_seq(end+1, :) = V_SE; phi_SE_seq(end+1, :) = phi_SE_dg; sigma_x_v_seq(end+1, :) = sigma_x_v; sigma_x_phi_seq(end+1, :) = sigma_x_phi; % V_nr_seq(end+1, :) = V_nr; % collecting % phi_nr_seq(end+1, :) = phi_nr_dg; % collecting

Appendices 122
end end %% Display the WLS results if test_case >= 57 || mod(MC_test,20) == 0 clc if display_SE_results disp('_________________State Estimation_________________'); disp('Bus V_SE V_NR V_Er Ph_SE Ph_NR Ph_Er'); for m = 1:nbus fprintf('%3g', m); fprintf('%8.3f', V_SE(m)); fprintf('%7.3f', V_nr(m)); fprintf('%21.16f', V_nr(m)-V_SE(m)); fprintf(' %8.3f', phi_SE_dg(m)); fprintf(' %8.3f', phi_nr_dg(m)); fprintf('%21.16f', phi_nr_dg(m)-phi_SE_dg(m));fprintf('\n'); end disp('__________________________________________________'); end % of display_SE_results fprintf('MC Trial Number: '); fprintf('%g',MC_test); fprintf('\n'); fprintf('Sigma of Parameters: '); fprintf('%g',sigma_params); fprintf('\n'); if iters > 1 fprintf('WLS Iterations = %4d', iters);fprintf('\n'); end end % of display each 10 trial end % of MC % For SE mean_V_SE_all(:,sigma_params_idx) = mean(V_SE_seq)'; mean_V_phi_all(:,sigma_params_idx) = mean(phi_SE_seq)'; std_V_SE_all(:,sigma_params_idx) = std(V_SE_seq)'; std_V_phi_all(:,sigma_params_idx) = std(phi_SE_seq)'; % For SE Errors mean_V_errors_all(:,sigma_params_idx) = mean(V_error_seq)'; mean_phi_errors_all(:,sigma_params_idx) = mean(phi_error_seq)'; std_V_errors_all(:,sigma_params_idx) = std(V_error_seq)'; std_phi_errors_all(:,sigma_params_idx) = std(phi_error_seq)'; % WLS theoritical STD mean_sigma_x_v_all(:,sigma_params_idx) = mean(sigma_x_v_seq)'; mean_sigma_x_phi_all(:,sigma_params_idx) = mean(sigma_x_phi_seq)'; %% Correlation of SE errors % corr_coefs = corrcoef(V_error_seq); % returns a matrix R of correlation coefficients, input matrix rows are observations and whose columns are variables. corr_coefs_upper = nonzeros(triu(corrcoef(V_error_seq),1)); mean_corr_coefs_V_all(sigma_params_idx) = mean(corr_coefs_upper); std_corr_coefs_V_all(sigma_params_idx) = std(corr_coefs_upper); % phi corr_coefs_upper = [];

Appendices 123
corr_coefs_upper = nonzeros(triu(corrcoef(phi_error_seq(:,2:end)),1)); mean_corr_coefs_phi_all(sigma_params_idx) = mean(corr_coefs_upper); std_corr_coefs_phi_all(sigma_params_idx) = std(corr_coefs_upper); end % of parameters loop

Appendices 124
Network Data for IEEE test cases
The network data for the test cases are shown here. In the process of programming, it is
important to have a reliable reference data to confirm the results that are generated by the
test program. For the author it was not easy to find the consistent data for some cases, for
example line Susceptance (B) for IEEE 14-Bus case. In [Christie 1999] some of the
provided data seems not to be consistent and regardless of sending email and asking for
the modifications of their database, they have not yet made the corrections. This is why
the network data are brought here.
IEEE 14-Bus Test Case
Network parameters and Bus data for this test case is shown in Table 5.4and Table 5.5
respectively.
Table 5.4 Branch data for IEEE 14-Bus test case From Bus
To Bus
Resistance R
Reactance X
Susceptance B
Transformer Turns Ratio
1 2 0.01938 0.05917 0.0528 0 1 5 0.05403 0.22304 0.0492 0 2 3 0.04699 0.19797 0.0438 0 2 4 0.05811 0.17632 0.0374 0 2 5 0.05695 0.17388 0.034 0 3 4 0.06701 0.17103 0.0346 0 4 5 0.01335 0.04211 0.0128 0 4 7 0 0.20912 0 0.978 4 9 0 0.55618 0 0.969 5 6 0 0.25202 0 0.932 6 11 0.09498 0.1989 0 0 6 12 0.12291 0.25581 0 0 6 13 0.06615 0.13027 0 0 7 8 0 0.17615 0 0 7 9 0 0.11001 0 0 9 10 0.03181 0.0845 0 0 9 14 0.12711 0.27038 0 0 10 11 0.08205 0.19207 0 0 12 13 0.22092 0.19988 0 0 13 14 0.17093 0.34802 0 0
Table 5.5 Bus data for IEEE 14-Bus test case
Bus #
Bus Type
PV Bus Voltage
P_Gen MW
Q_Gen MVR
P_Load MW
Q_Load MVR
Gs: Shunt Conductance
Bs: Shunt Susceptance
1 1 1.06 232.4 -16.9 0 0 0 0 2 2 1.045 40 42.4 21.7 12.7 0 0 3 2 1.01 0 23.4 94.2 19 0 0 4 3 1 0 0 47.8 -3.9 0 0 5 3 1 0 0 7.6 1.6 0 0 6 2 1.07 0 12.2 11.2 7.5 0 0 7 3 1 0 0 0 0 0 0 8 2 1.09 0 17.4 0 0 0 0 9 3 1 0 0 29.5 16.6 0 19 10 3 1 0 0 9 5.8 0 0

Appendices 125
11 3 1 0 0 3.5 1.8 0 0 12 3 1 0 0 6.1 1.6 0 0 13 3 1 0 0 13.5 5.8 0 0 14 3 1 0 0 14.9 5 0 0
Bus Types: 1 is Slack Bus, 2 is PV Bus and 3 is PQ Bus.
The bus admittance matrix for this test case is shown here. It can be used as a reference
because in this bus admittance matrix, all the transformers and shunt elements are
correctly considered.
The bus admittance matrix is a symmetric matrix and the nonzero elements of this matrix
for IEEE 14-Bus case are shown in Table 5.6.
Table 5.6 Ybus nonzero elements for IEEE 14-Bus test case (1,1) 6.02502905576822 - 19.4470702055144i (2,1) -4.99913160079803 + 15.2630865231796i (5,1) -1.02589745497019 + 4.23498368233483i (1,2) -4.99913160079803 + 15.2630865231796i (2,2) 9.52132361081478 - 30.2707153987791i (3,2) -1.1350191923074 + 4.78186315175772i (4,2) -1.68603315061494 + 5.11583832587208i (5,2) -1.7011396670944 + 5.19392739796971i (2,3) -1.1350191923074 + 4.78186315175772i (3,3) 3.12099490223296 - 9.81148012935164i (4,3) -1.98597570992556 + 5.06881697759392i (2,4) -1.68603315061494 + 5.11583832587208i (3,4) -1.98597570992556 + 5.06881697759392i (4,4) 10.5129895220362 - 38.6351712076078i (5,4) -6.84098066149567 + 21.5785539816916i (7,4) 0 + 4.88951266031734i (9,4) 0 + 1.8554995578159i (1,5) -1.02589745497019 + 4.23498368233483i (2,5) -1.7011396670944 + 5.19392739796971i (4,5) -6.84098066149567 + 21.5785539816916i (5,5) 9.56801778356026 - 35.5275394560448i (6,5) 0 + 4.25744533525338i (5,6) 0 + 4.25744533525338i (6,6) 6.57992340746622 - 17.3407328099191i (11,6) -1.95502856317726 + 4.09407434424044i (12,6) -1.52596744045097 + 3.1759639650294i (13,6) -3.09892740383799 + 6.10275544819312i (4,7) 0 + 4.88951266031734i (7,7) 0 - 19.5490059482647i (8,7) 0 + 5.67697984672154i (9,7) 0 + 9.09008271975275i (7,8) 0 + 5.67697984672154i (8,8) 0 - 5.67697984672154i (4,9) 0 + 1.8554995578159i (7,9) 0 + 9.09008271975275i (9,9) 5.32605503946736 - 24.0925063752679i (10,9) -3.90204955244743 + 10.3653941270609i (14,9) -1.42400548701993 + 3.0290504569306i (9,10) -3.90204955244743 + 10.3653941270609i (10,10) 5.78293430614783 - 14.7683378765214i (11,10) -1.8808847537004 + 4.40294374946052i (6,11) -1.95502856317726 + 4.09407434424044i (10,11) -1.8808847537004 + 4.40294374946052i (11,11) 3.83591331687766 - 8.49701809370096i (6,12) -1.52596744045097 + 3.1759639650294i

Appendices 126
(12,12) 4.01499202727289 - 5.42793859120161i (13,12) -2.48902458682192 + 2.25197462617221i (6,13) -3.09892740383799 + 6.10275544819312i (12,13) -2.48902458682192 + 2.25197462617221i (13,13) 6.72494614846623 - 10.6696935494707i (14,13) -1.13699415780633 + 2.31496347510535i (9,14) -1.42400548701993 + 3.0290504569306i (13,14) -1.13699415780633 + 2.31496347510535i (14,14) 2.56099964482626 - 5.34401393203596i
IEEE 30-Bus Test Case
Network parameters and Bus data for this test case is shown in Table 5.7 and Table 5.8
respectively.
Table 5.7 Branch data for IEEE 30-Bus test case From Bus
To Bus
Resistance R
Reactance X
Susceptance B
Transformer Turns Ratio
1 2 0.0192 0.0575 0.0528 0 1 3 0.0452 0.1652 0.0408 0 2 4 0.057 0.1737 0.0368 0 3 4 0.0132 0.0379 0.0084 0 2 5 0.0472 0.1983 0.0418 0 2 6 0.0581 0.1763 0.0374 0 4 6 0.0119 0.0414 0.009 0 5 7 0.046 0.116 0.0204 0 6 7 0.0267 0.082 0.017 0 6 8 0.012 0.042 0.009 0 6 9 0 0.208 0 0.978 6 10 0 0.556 0 0.969 9 11 0 0.208 0 0 9 10 0 0.11 0 0 4 12 0 0.256 0 0.932 12 13 0 0.14 0 0 12 14 0.1231 0.2559 0 0 12 15 0.0662 0.1304 0 0 12 16 0.0945 0.1987 0 0 14 15 0.221 0.1997 0 0 16 17 0.0524 0.1923 0 0 15 18 0.1073 0.2185 0 0 18 19 0.0639 0.1292 0 0 19 20 0.034 0.068 0 0 10 20 0.0936 0.209 0 0 10 17 0.0324 0.0845 0 0 10 21 0.0348 0.0749 0 0 10 22 0.0727 0.1499 0 0 21 23 0.0116 0.0236 0 0 15 23 0.1 0.202 0 0 22 24 0.115 0.179 0 0 23 24 0.132 0.27 0 0 24 25 0.1885 0.3292 0 0 25 26 0.2544 0.38 0 0 25 27 0.1093 0.2087 0 0 28 27 0 0.396 0 0.968 27 29 0.2198 0.4153 0 0 27 30 0.3202 0.6027 0 0 29 30 0.2399 0.4533 0 0 8 28 0.0636 0.2 0.0428 0 6 28 0.0169 0.0599 0.013 0

Appendices 127
Table 5.8 Bus data for IEEE 30-Bus test case
Bus #
Bus Type
PV Bus Voltage
P_Gen MW
Q_Gen MVR
P_Load MW
Q_Load MVR
Gs: Shunt Conductance
Bs: Shunt Susceptance
1 1 1.06 232.4 -16.9 0 0 0 0 1 1 260.2 -16.1 0 0 0 0 2 2 1.043 40 50 21.7 12.7 0 0 3 3 1 0 0 2.4 1.2 0 0 4 3 1.06 0 0 7.6 1.6 0 0 5 2 1.01 0 37 94.2 19 0 19 6 3 1 0 0 0 0 0 0 7 3 1 0 0 22.8 10.9 0 0 8 2 1.01 0 37.3 30 30 0 0 9 3 1 0 0 0 0 0 0 10 3 1 0 0 5.8 2 0 0 11 2 1.082 0 16.2 0 0 0 0 12 3 1 0 0 11.2 7.5 0 0 13 2 1.071 0 10.6 0 0 0 0 14 3 1 0 0 6.2 1.6 0 0 15 3 1 0 0 8.2 2.5 0 0 16 3 1 0 0 3.5 1.8 0 0 17 3 1 0 0 9 5.8 0 0 18 3 1 0 0 3.2 0.9 0 0 19 3 1 0 0 9.5 3.4 0 0 20 3 1 0 0 2.2 0.7 0 0 21 3 1 0 0 17.5 11.2 0 0 22 3 1 0 0 0 0 0 0 23 3 1 0 0 3.2 1.6 0 0 24 3 1 0 0 8.7 6.7 0 4.3 25 3 1 0 0 0 0 0 0 26 3 1 0 0 3.5 2.3 0 0 27 3 1 0 0 0 0 0 0 28 3 1 0 0 0 0 0 0 29 3 1 0 0 2.4 0.9 0 0 30 3 1 0 0 10.6 1.9 0 0
Bus Types: 1 is Slack Bus, 2 is PV Bus and 3 is PQ Bus.
IEEE 57-Bus Test Case
Network parameters and Bus data for this test case is shown in Table 5.9 and Table 5.10
respectively.
Table 5.9 Branch data for IEEE 57-Bus test case From Bus
To Bus
Resistance R
Reactance X
Susceptance B
Transformer Turns Ratio
1 2 0.0083 0.028 0.129 0 1 15 0.0178 0.091 0.0988 0 1 16 0.0454 0.206 0.0546 0 1 17 0.0238 0.108 0.0286 0 2 3 0.0298 0.085 0.0818 0 3 4 0.0112 0.0366 0.038 0 3 15 0.0162 0.053 0.0544 0 4 5 0.0625 0.132 0.0258 0 4 6 0.043 0.148 0.0348 0 4 18 0 0.43 0 0.978 4 18 0 0.555 0 0.97 5 6 0.0302 0.0641 0.0124 0 6 7 0.02 0.102 0.0276 0 6 8 0.0339 0.173 0.047 0 7 8 0.0139 0.0712 0.0194 0 7 29 0 0.0648 0 0.967 8 9 0.0099 0.0505 0.0548 0 9 10 0.0369 0.1679 0.044 0

Appendices 128
9 11 0.0258 0.0848 0.0218 0 9 12 0.0648 0.295 0.0772 0 9 13 0.0481 0.158 0.0406 0 9 55 0 0.1205 0 0.94 10 12 0.0277 0.1262 0.0328 0 10 51 0 0.0712 0 0.93 11 13 0.0223 0.0732 0.0188 0 11 41 0 0.749 0 0.955 11 43 0 0.153 0 0.958 12 13 0.0178 0.058 0.0604 0 12 16 0.018 0.0813 0.0216 0 12 17 0.0397 0.179 0.0476 0 13 14 0.0132 0.0434 0.011 0 13 15 0.0269 0.0869 0.023 0 13 49 0 0.191 0 0.895 14 15 0.0171 0.0547 0.0148 0 14 46 0 0.0735 0 0.9 15 45 0 0.1042 0 0.955 18 19 0.461 0.685 0 0 19 20 0.283 0.434 0 0 21 20 0 0.7767 0 1.043 21 22 0.0736 0.117 0 0 22 23 0.0099 0.0152 0 0 22 38 0.0192 0.0295 0 0 23 24 0.166 0.256 0.0084 0 24 25 0 1.182 0 0 24 25 0 1.23 0 0 24 26 0 0.0473 0 1.043 25 30 0.135 0.202 0 0 26 27 0.165 0.254 0 0 27 28 0.0618 0.0954 0 0 28 29 0.0418 0.0587 0 0 29 52 0.1442 0.187 0 0 30 31 0.326 0.497 0 0 31 32 0.507 0.755 0 0 32 33 0.0392 0.036 0 0 34 32 0 0.953 0 0.975 34 35 0.052 0.078 0.0032 0 35 36 0.043 0.0537 0.0016 0 36 37 0.029 0.0366 0 0 36 40 0.03 0.0466 0 0 37 38 0.0651 0.1009 0.002 0 37 39 0.0239 0.0379 0 0 38 44 0.0289 0.0585 0.002 0 38 48 0.0312 0.0482 0 0 38 49 0.115 0.177 0.003 0 39 57 0 1.355 0 0.98 40 56 0 1.195 0 0.958 41 42 0.207 0.352 0 0 41 43 0 0.412 0 0 44 45 0.0624 0.1242 0.004 0 46 47 0.023 0.068 0.0032 0 47 48 0.0182 0.0233 0 0 48 49 0.0834 0.129 0.0048 0 49 50 0.0801 0.128 0 0 50 51 0.1386 0.22 0 0 52 53 0.0762 0.0984 0 0 53 54 0.1878 0.232 0 0 54 55 0.1732 0.2265 0 0 56 41 0.553 0.549 0 0 56 42 0.2125 0.354 0 0 57 56 0.174 0.26 0 0
Table 5.10 Bus data for IEEE 57-Bus test case
Bus #
Bus Type
PV Bus Voltage
P_Gen MW
Q_Gen MVR
P_Load MW
Q_Load MVR
Gs: Shunt Conductance
Bs: Shunt Susceptance
1 1 1.04 128.9 -16.1 55 17 0 0 2 2 1.01 0 -0.8 3 88 0 0 3 2 0.985 40 -1 41 21 0 0 4 3 1 0 0 0 0 0 0 5 3 1 0 0 13 4 0 0

Appendices 129
6 2 0.98 0 0.8 75 2 0 0 7 3 1 0 0 0 0 0 0 8 2 1.005 450 62.1 150 22 0 0 9 2 0.98 0 2.2 121 26 0 0 10 3 1 0 0 5 2 0 0 11 3 1 0 0 0 0 0 0 12 2 1.015 310 128.5 377 24 0 0 13 3 1 0 0 18 2.3 0 0 14 3 1 0 0 10.5 5.3 0 0 15 3 1 0 0 22 5 0 0 16 3 1 0 0 43 3 0 0 17 3 1 0 0 42 8 0 0 18 3 1 0 0 27.2 9.8 0 10 19 3 1 0 0 3.3 0.6 0 0 20 3 1 0 0 2.3 1 0 0 21 3 1 0 0 0 0 0 0 22 3 1 0 0 0 0 0 0 23 3 1 0 0 6.3 2.1 0 0 24 3 1 0 0 0 0 0 0 25 3 1 0 0 6.3 3.2 0 5.9 26 3 1 0 0 0 0 0 0 27 3 1 0 0 9.3 0.5 0 0 28 3 1 0 0 4.6 2.3 0 0 29 3 1 0 0 17 2.6 0 0 30 3 1 0 0 3.6 1.8 0 0 31 3 1 0 0 5.8 2.9 0 0 32 3 1 0 0 1.6 0.8 0 0 33 3 1 0 0 3.8 1.9 0 0 34 3 1 0 0 0 0 0 0 35 3 1 0 0 6 3 0 0 36 3 1 0 0 0 0 0 0 37 3 1 0 0 0 0 0 0 38 3 1 0 0 14 7 0 0 39 3 1 0 0 0 0 0 0 40 3 1 0 0 0 0 0 0 41 3 1 0 0 6.3 3 0 0 42 3 1 0 0 7.1 4.4 0 0 43 3 1 0 0 2 1 0 0 44 3 1 0 0 12 1.8 0 0 45 3 1 0 0 0 0 0 0 46 3 1 0 0 0 0 0 0 47 3 1 0 0 29.7 11.6 0 0 48 3 1 0 0 0 0 0 0 49 3 1 0 0 18 8.5 0 0 50 3 1 0 0 21 10.5 0 0 51 3 1 0 0 18 5.3 0 0 52 3 1 0 0 4.9 2.2 0 0 53 3 1 0 0 20 10 0 6.3 54 3 1 0 0 4.1 1.4 0 0 55 3 1 0 0 6.8 3.4 0 0 56 3 1 0 0 7.6 2.2 0 0 57 3 1 0 0 6.7 2 0 0
Bus Types: 1 is Slack Bus, 2 is PV Bus and 3 is PQ Bus.

130
List of Figures
Figure 1.1: Sampling distributions of two different estimators. ............................................................... 5
Figure 2.1: Comparison of Various Methods for Power Flow Solution [Wood 1996]. ............................. 12
Figure 2.2 Illustration of the structure of Bus Incidence Matrix by the two sub-matrices. ...................... 14
Figure 2.3 Equivalent pi-model for a transmission line. .......................................................................... 15
Figure 2.4 Illustration of Shunt conductance and Shunt Susceptance for an instance bus, k. ................. 15
Figure 2.5 One-line diagram of a transmission line with transformer. .................................................... 16
Figure 2.6 Equivalent pi-model for a transmission line with transformer tap parameter. ...................... 16
Figure 2.7 The vector of diagonal elements of 𝒀𝒑𝒓𝒊𝒎𝒊𝒕𝒊𝒗𝒆 . ................................................................ 17
Figure 2.8 Flowchart for implementation of Newton-Raphson Load Flow .... Error! Bookmark not defined.
Figure 3.1 Equivalent pi-model for a branch connecting bus 𝒉 to bus 𝒌. ................................................ 25
Figure 4.1 Flowchart of the Algorithm Implementation ......................................................................... 41
Figure 5.1 IEEE 14-Bus Test Case with Measurement locations .............................................................. 51
Figure 5.2 Mean and Standard Deviation of Voltage Magnitude Errors for IEEE 14-Bus test case........... 52
Figure 5.3 Mean and Standard Deviation of Voltage Angle Errors for IEEE 14-Bus test case. .................. 53
Figure 5.4 Mean and Standard Deviation of Voltage Magnitude Errors for Different Measurement Uncertainties for IEEE 14-Bus test case ................................................................................ 54
Figure 5.5 Mean and Standard Deviation of Voltage Angles Errors for Different Measurement Uncertainties for IEEE 14-Bus test case ................................................................................ 54
Figure 5.6 Ratio of the Mean of voltage magnitude errors by related Standard Deviations for IEEE 14-Bus test case. ...................................................................................................................... 55

131
Figure 5.7 Ratio of the Mean of voltage angle errors by related Standard Deviations for IEEE 14-Bus test case. .................................................................................................................................... 56
Figure 5.8 Correlation of State Estimator’s Errors (Voltage) of IEEE 14-Bus test case. ............................ 57
Figure 5.9 Correlation of State Estimator’s Errors (Phase) of IEEE 14-Bus test case. ............................... 57
Figure 5.10 Ratio of the Mean of voltage magnitudes errors by Standard Deviations with parameters correlation for IEEE 14-Bus test case. .................................................................................. 58
Figure 5.11 Ratio of the Mean of voltage angles errors by Standard Deviations with parameters correlation for IEEE 14-Bus test case. .................................................................................. 59
Figure 5.12 Ratio of the Mean of voltage magnitude errors by related Standard Deviations with the presence of PMU measurements for IEEE 14-Bus test case. ................................................ 60
Figure 5.13 Ratio of the Mean of voltage Angle errors by related Standard Deviations with the presence of PMU measurements for IEEE 14-Bus test case................................................................. 60
Figure 5.14 IEEE 30-Bus Test Case One-Line Diagram ............................................................................. 61
Figure 5.15 Mean and Standard Deviation of Voltage Magnitude Errors for IEEE 30-Bus test case. ........ 62
Figure 5.16 Mean and Standard Deviation of Voltage Angle Errors for IEEE 30-Bus test case. ................ 63
Figure 5.17 Mean and Standard Deviation of Voltage Magnitude Errors for IEEE 30-Bus test case. ........ 64
Figure 5.18 Mean and Standard Deviation of Voltage Angle Errors for IEEE 30-Bus test case. ................ 64
Figure 5.19 Correlation of State Estimator’s Errors (Voltage Magnitude) of IEEE 30-Bus test case. ........ 65
Figure 5.20 Correlation of State Estimator’s Errors (Angles) of IEEE 30-Bus test case. ............................ 66
Figure 5.21 Ratio of the Mean of voltage magnitudes errors by Standard Deviations with parameters correlation for IEEE 30-Bus test case. .................................................................................. 67
Figure 5.22 Ratio of the Mean of voltage angles errors by Standard Deviations with parameters correlation for IEEE 30-Bus test case. .................................................................................. 67
Figure 5.23 Ratio of the Mean of voltage magnitude errors by related Standard Deviations with the presence of PMU measurements for IEEE 30-Bus test case. ................................................ 68
Figure 5.24 Ratio of the Mean of voltage Angle errors by related Standard Deviations with the presence of PMU measurements for IEEE 30-Bus test case................................................................. 69
Figure 5.25 IEEE 57-Bus Test Case One-Line Diagram ............................................................................. 70
Figure 5.26 Mean and Standard Deviation of Voltage Magnitude Errors for IEEE 57-Bus test case. ........ 71
Figure 5.27 Mean and Standard Deviation of Voltage Angle Errors for IEEE 57-Bus test case. ................ 72
Figure 5.28 Mean and Standard Deviation of Voltage Magnitude Errors for IEEE 57-Bus test case. ........ 73
Figure 5.29 Mean and Standard Deviation of Voltage Angle Errors for IEEE 57-Bus test case. ................ 73
Figure 5.30 Correlation of State Estimator’s Errors (Voltage Magnitude) of IEEE 57-Bus test case. ........ 74
Figure 5.31 Correlation of State Estimator’s Errors (Angles) of IEEE 57-Bus test case. ............................ 75

132
Figure 5.32 Ratio of the Mean of voltage magnitudes errors by Standard Deviations with parameters correlation for IEEE 57-Bus test case. .................................................................................. 76
Figure 5.33 Ratio of the Mean of voltage angles errors by Standard Deviations with parameters correlation for IEEE 57-Bus test case. .................................................................................. 76
Figure 5.34 Ratio of the Mean of voltage magnitude errors by related Standard Deviations with the presence of PMU measurements for IEEE 57-Bus test case. ................................................ 78
Figure 5.35 Ratio of the Mean of voltage Angle errors by related Standard Deviations with the presence of PMU measurements for IEEE 57-Bus test case................................................................. 78
Figure 5.36 IEEE 118-Bus Test Case One-Line Diagram ........................................................................... 79
Figure 5.37 Mean and Standard Deviation of Voltage Magnitude Errors for IEEE 118-Bus test case. ...... 81
Figure 5.38 Mean and Standard Deviation of Voltage Angle Errors for IEEE 118-Bus test case. .............. 81
Figure 5.39 Mean and Standard Deviation of Voltage Magnitude Errors for IEEE 118-Bus test case. ...... 82
Figure 5.40 Mean and Standard Deviation of Voltage Angle Errors for IEEE 118-Bus test case. .............. 83
Figure 5.41 Correlation of State Estimator’s Errors (Voltage Magnitude) of IEEE 118-Bus test case. ...... 84
Figure 5.42 Correlation of State Estimator’s Errors (Angles) of IEEE 118-Bus test case. .......................... 84
Figure 5.43 Ratio of the Mean of voltage magnitudes errors by Standard Deviations with parameters correlation for IEEE 118-Bus test case. ................................................................................ 85
Figure 5.44 Ratio of the Mean of voltage angles errors by Standard Deviations with parameters correlation for IEEE 118-Bus test case. ................................................................................ 86
Figure 5.45 Ratio of the Mean of voltage magnitude errors by related Standard Deviations with the presence of PMU measurements for IEEE 118-Bus test case................................................ 87
Figure 5.46 Ratio of the Mean of voltage Angle errors by related Standard Deviations with the presence of PMU measurements for IEEE 118-Bus test case. .............................................................. 88
Figure 5.47 Tree of the connected graph of a sample power network .................................................... 97
Figure 5.48 The Node 3 in the sample power network along with the all branches connected and the illustration of equivalent pi model for each branch ............................................................. 97
Figure 5.49 Sample network with two branches connected to a generator (power injector) along with the illustration of equivalent pi model ................................................................................ 98
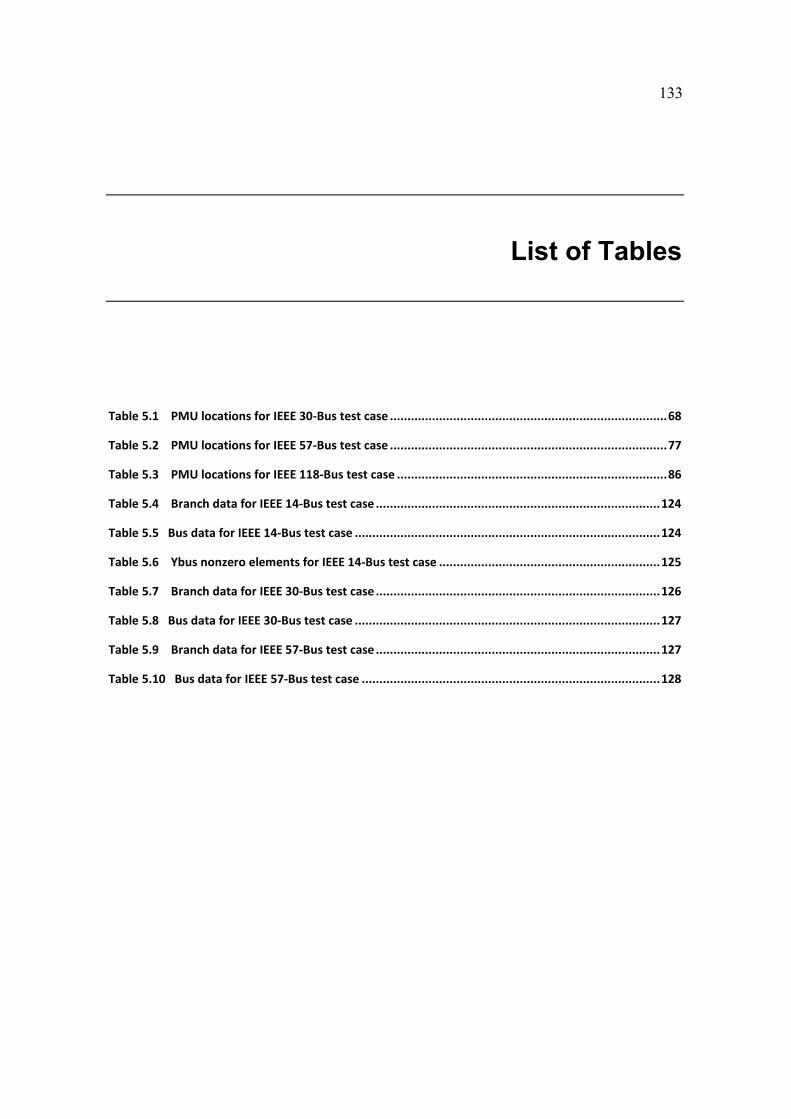
133
List of Tables
Table 5.1 PMU locations for IEEE 30-Bus test case ............................................................................... 68
Table 5.2 PMU locations for IEEE 57-Bus test case ............................................................................... 77
Table 5.3 PMU locations for IEEE 118-Bus test case ............................................................................. 86
Table 5.4 Branch data for IEEE 14-Bus test case ................................................................................. 124
Table 5.5 Bus data for IEEE 14-Bus test case ....................................................................................... 124
Table 5.6 Ybus nonzero elements for IEEE 14-Bus test case ............................................................... 125
Table 5.7 Branch data for IEEE 30-Bus test case ................................................................................. 126
Table 5.8 Bus data for IEEE 30-Bus test case ....................................................................................... 127
Table 5.9 Branch data for IEEE 57-Bus test case ................................................................................. 127
Table 5.10 Bus data for IEEE 57-Bus test case ..................................................................................... 128

134
Index
C
Computational Method ............................................ 92
E
Electric Power ............................................... 91, 92, 93 Electric Power System ......................................... 92, 93 Electrical Engineering ............................... III
J
Jacobian Matrix ................................ 30, 32, 104
L
Least Square........................................................ 7 Linear System ............................................... 8, 93 Load Flow . 3, 10, 11, 23, 24, 43, 101, 104, 114, 116,
117, 118, 119
M
Minimum Variance .............................................. 4 Monte Carlo .................3, 43, 44, 45, 47, 48, 77, 82
O
Objective Function ..................................... 110 Optimal Power Flow ................................................. 93
P
Parameter Uncertainty ............................................. 93 Power Flow ......................... 12, 19, 25, 34, 107, 108 Power Generation .................................................... 94 Power Quality ........................................................... 93 POWER SYSTEM ............................... 1, 46, 91, 92, 93, 94
R
Reactive Power .... 33, 34, 35, 101, 103, 107, 108, 109
S
SENSITIVITY ANALYSIS ............................................. 1 Standard Deviation ... 48, 49, 52, 53, 54, 55, 56,
58, 59, 60, 62, 63, 64, 66, 67, 68, 69, 71, 72, 73, 75, 76, 78, 80, 81, 82, 83, 85, 86, 87, 88, 89
STATE ESTIMATION . 1, 2, 3, 7, 8, 44, 45, 48, 53, 63, 72, 82, 89, 91, 92, 93, 94, 105
T
Taylor Series ........................................21, 31, 38
W
Weighted Least Square ............................ 7, 36