Embed Size (px)
Citation preview

1
© Sembcorp Industries 2012
Vital PartnersEssential Solutions
Sembcorp PUB Public Private Partnership
© Sembcorp Industries 2012
An Introduction To Sembcorp

2
© Sembcorp Industries 2012
100%
Temasek Holdings 49.5%*
Public Shareholders 50.5%
Sembcorp Utilities
Provides energy, water, and onsite services to customers including companies in energy intensive industry clusters as petrochemical and chemical hubs. The Utilities segment also provides solid waste management services
Sembcorp Development
Owns, develops, markets and manages urban developments comprising industrial parks as well as business, commercial and residential space in Vietnam, China and Indonesia
Sembcorp MarineMarket cap** S$10.4 bn
Offers a full spectrum of integrated marine and offshore engineering solutions from ship repair, shipbuilding, ship conversion, rig building & repair to offshore engineering & construction including topsides fabrication
100% 60.6%*
Public Shareholders39.4%
Market cap** S$10.2 bn
* Direct and indirect holdings as at September 30, 2012. The percentage is calculated based on the number of issued shares excluding shares held as treasury shares** Market cap for Sembcorp Industries and Sembcorp Marine as September 30, 2012
Group Structure
3
© Sembcorp Industries 2012
Sustainable Earnings
Net Profit before EI 5-year (2006-2011)CAGR: 16%
8.18.6
9.9 9.68.8 9.0
5.1
FY06 FY07 FY08 FY09 FY10 FY11 1H12
793
1,031
683
809
526 507
FY06 FY07 FY08 FY09 FY10 FY11 1H12
Net Profit = Net profit attributable to shareholders of the CompanyEI = Exceptional itemsCAGR = Compounded annual growth rate
Turnover 5-year (2006-2011)CAGR: 2%
367
4
(S$bn) 06 07 08 09 10 11 1H12
Turnover 8.1 8.6 9.9 9.6 8.8 9.0 5.1
(S$m) 06 07 08 09 10 11 1H12
Net profit before EI 381 557 534 683 761 809 367
EI 650 (31) (27) - 32 - -

3
© Sembcorp Industries 2012
Growing Energy Needs
Global Water Scarcity
Global Urbanisation
Increasing Environmental Awareness
GLOBAL TRENDS OUR BUSINESSES
Energy Marine
Water Urban Development
5
Positioned for the Future
© Sembcorp Industries 2012 6
Our Global Footprint
Global Operations across 16 Countries in Six Continents
Well-Positioned in Fast-Growing Emerging Markets

4
© Sembcorp Industries 2012
Utilities
+ Energy+ Water+ Solid Waste Management
© Sembcorp Industries 2012
Utilities Global Footprint
CHILEAntofagasta
Santiago
PANAMALake Gatun
The CaribbeanAntigua
SOUTH AFRICABallito
Mbombela
(Nelspruit)
UKTeesside
Bournemouth
PHILIPPINESSubic Bay
INDONESIABatam
Talang Kelapa
Nanjing
Zhangjiagang
Qidong
Tianjin
Qinzhou
FushunUAEFujairah
OMANSalalah
VIETNAMBa Ria-
Vung Tau
Shenyang
Xinmin
Qitaihe
Yanjiao
Fuzhou
Yancheng
Zhumadian
AUSTRALIA
SINGAPOREJurong Island
Changi
INDIAAndhra
Pradesh
Energy
WaterOn-site Logistics
Solid Waste Management (multiple locations)
Entrenched Position in Growing Markets
8
Shanghai
Hulunbeier
Huanghua
Yangcheng
8
CHINA
5
© Sembcorp Industries 2012 9
Strong CapabilitiesOur Energy Portfolio
2001 2014 and beyond
2001Singapore
Jurong Island
2003UK
Teesside
2004Vietnam
Ba Ria-Vung Tau
2006UAE
FujairahChina
Shanghai
2014India
Andhra Pradesh
Gross Power Capacity Installed and Under Development of
>5,800 MW
Po
we
r C
ap
acity (
Me
ga
wa
tts)
2012Oman
SalalahChina
HuanghuaHulunbeier
2013Singapore
JurongIsland
© Sembcorp Industries 2012
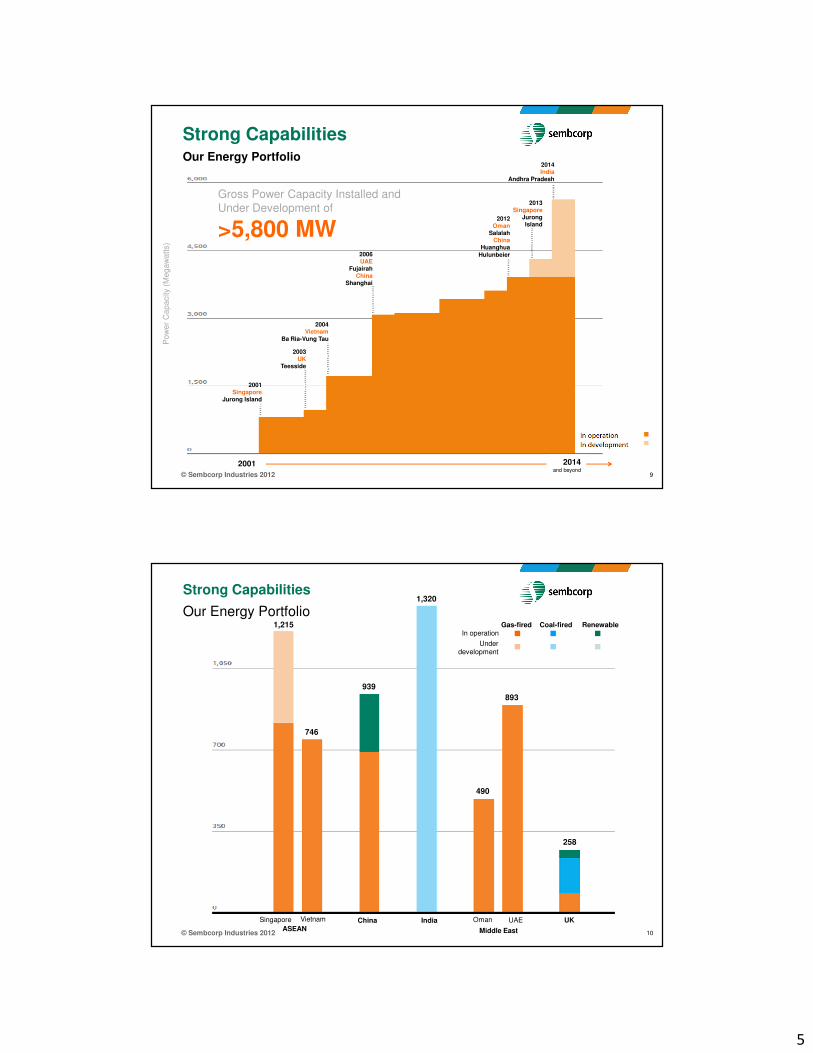
Strong Capabilities
Our Energy Portfolio
ASEAN Middle East
China India UK
10
Singapore Vietnam Oman UAE
Gas-fired Coal-fired RenewableIn operation
Under development
258
893
490
1,320
1,215
939
746

6
© Sembcorp Industries 2012
Growing Renewable Energy Capabilities
Fuel Type Facilities Steam capacity
Powercapacity
BiomassSembcorp Biomass Power Station (UK)
COD: 2007
35 MW
Energy- from-Waste (EfW)
Sembcorp Woodchip Boiler Plant
Phase 1 (Singapore) COD: 2011
20 tph 4 MW (equivalent MW)
Sembcorp Woodchip Boiler Plant
Phase 2 (Singapore) COD: 2013
40 tph 9 MW(equivalent MW)
Energy from Waste Boilers
(Singapore) COD: 2014
140 tph 31 MW(equivalent MW)
Wind
China Wind Power Assets(China)
Acquisition completed in Sep 2012
248 MW
Total 327 MW
11
Targeting a high-efficiency portfolio of thermal and renewable energy assets,
with a growing component of low carbon capacity
From 39 MW to
327MWof renewable energy capabilities
≈5% of power and steam portfolio from renewables
© Sembcorp Industries 2012
Sembcorp’s Energy-from-Waste Value Chain
Growing Renewable Energy Capabilities
12
Tph: tonnes per hour

7
© Sembcorp Industries 2012
A Water Player With A Difference
Winner of 2011 Global Water Intelligence (GWI) Global Water Awards “Water Company of the Year”
Strong Capabilities
Complete range of water products Closed loop approach minimises discharge
Total water & wastewater treatment
solutions for industrial & municipal
sectors:
� Wastewater treatment
� Reclaimed water
� Desalinated water
� Potable water
� Water for industrial use including
demineralised water, industrial water,
raw water, chilled water, cooling
water, seawater cooling and firewater
13
© Sembcorp Industries 2012
1997SingaporeJurong Island
2009Singapore
ChangiChina
Tianjin
2003UK
Teesside
2008China
Shenyang
2005China
NanjingShanghai
ChinaXinminQitaiheYanjiaoFuzhou
YanchengZhumadian
IndonesiaBatamTalangKelapa
PhilippinesSubic Bay
2010South Africa
BallitoMbombela(Nelspruit)
UKBournemouth
ChileAntofagasta
Santiago
PanamaLake Gatun
The CaribbeanAntigua
1997
Developer, Owner and Operator of Water and Wastewater Treatment Facilities with
>7,000,000 m3/day
Wate
r &
waste
wate
r tr
eatm
ent cap
acity
(m3/d
ay)
2006UAE
FujairahChina
Zhangjiagang
14
Strong CapabilitiesOur Water Portfolio
2011China
Qinzhou
2015UAEFujairah
2015 and beyond
2013Singapore
JurongIslandChina
QidongFushun9,000,000
7,000,000
5,000,000
3,000,000
1,000,000
In operation
Under development
2012Oman
SalalahSingapore
JurongIsland

8
© Sembcorp Industries 2012UKMiddle East & Africa The Americas
Serving a Population of Over
5 million Worldwide
In Operation
Municipal
Industrial
InDevelopment
15
Singapore Indonesia Philippines Oman UAE South Africa Chile Panama The Caribbean
ASEANChina
69,00069,000
69,000
69,0004,005,480
69,0001,500,000
69,0001,200,000
69,000900,000
69,000600,000
69,000300,000
69,0000
69,000295,200
69,00092,250
69,0001,327,280
69,000591,800
69,000220,850
69,000444,000
69,000205,624
69,00076,00069,00017,000
Strong CapabilitiesOur Water Portfolio
© Sembcorp Industries 2012
Multi-Customer Business Model
Leveraging Capabilities In Energy And Water
Bundled Offer Approach
Industrial Site Customers
On-site Logistics and Services �Service corridor�Chemical storage and terminalling�Asset protection�Hazardous waste incineration�Industrial gases
Energy�Power generation and retail�Process steam production and supply
�Natural gas import, supply and retail
Water�Wastewater treatment�Reclaimed water�Desalinated water�Potable Water�Water for industrial use, including demineralised water, industrial water, raw water, chilled water, cooling water, seawater cooling and firewater
16

9
© Sembcorp Industries 2012
Wilton International, UK
� 770 ha world class manufacturing site
� Sembcorp owns the site and provides energy, water and on-site logistics and services
� Operational since 1949
� Total project cost: £296 million (US$529 million)
Jurong Island, Singapore
� 3,200 ha world class chemical hub in Singapore
� Sembcorp provides energy, water and on-site logistics and services to over 40 multinationals
� Operational since 1997
� Total project cost: S$2.5 billion (US$1.6 billion)
17
Leveraging Capabilities In Energy And Water
Sembcorp facilities Service corridor (under development)
Existing Service Corridor
© Sembcorp Industries 2012
Solid Waste Management
Capabilities include:
� Collection and treatment of municipal, industrial & commercial, construction & demolition and bio-hazardous waste
� Recycling, resource recovery & composting
� Waste-derived fuel including woodchip production
>1.9 millionhouseholds and establishments served
>3.1 milliontonnes of waste collected per year
>430,000tonnes of recyclables collected per year
>13,000medical customers served
Focused on energy from waste to enhance competitiveness of businesses across the Group
18

10
© Sembcorp Industries 2012
Marine
© Sembcorp Industries 2012
Global Network Of Strategically Located Shipyards
A Global Hub
CHINA(Through COSCO shipyards with
2,045,000 dwt total dock capacity) Dalian, Guangdong, Lianyungang,Nantong, Qidong, Shanghai,Zhoushan
INDONESIA� PT SMOE Indonesia (69 ha)� PT Karimun Sembawang Shipyard (31 ha)
SINGAPORE� Jurong Shipyard (1,100,000 dwt, 68 ha)� Sembawang Shipyard (775,000 dwt, 86 ha)� SMOE* (25 ha)� PPL Shipyard (20 ha)� Jurong SML (62,500 dwt, 12 ha)� New Yard Facility** (3,075,000 dwt, 206 ha)
USA� Sembcorp-Sabine Shipyard (90 ha)
Brazil� Estaleiro Jurong Aracruz (82.5 ha)
dwt: deadweight tonnes; ha: hectares* SMOE’s facilities are located on the same plot of land
as Sembawang Shipyard
India� Sembmarine Kakinada (31 acres)
20

11
© Sembcorp Industries 2012
Growing And Expanding Our Business
|1963-1969| |1970-1975| |1976-1994| |1995-2000| |2001-2005| |2006-2012|
Ship repair (1963)
Shipbuilding (1970)
Ship conversion and offshore (1976)
Offshore engineering (1995)
Rig building (2001)
Offshore production fixed & floating facilities (2006)
21|2012 & beyond|
Drillships (2012)
© Sembcorp Industries 2012
Urban Development

12
© Sembcorp Industries 2012
Our Regional Presence
China
� Wuxi-Singapore Industrial Park
� Sino-Singapore Nanjing Eco Hi-tech Island
� Singapore-Sichuan Hi-tech Innovation Park
� China-Singapore Suzhou Industrial Park*
Indonesia
� Gallant Venture (listed on SGX)
– Batamindo Industrial Park
– Bintan Industrial Estate
� Kendal Regency Industrial Park
� Karimun Marine & Industrial Complex*
Vietnam
�Vietnam Singapore Industrial Park (VSIP)
�VSIP Binh Duong Integrated Township & Industrial Park
�VSIP Bac Ninh Integrated Township & Industrial Park
�VSIP Hai Phong Integrated Township & Industrial Park
�VSIP Quang Ngai Integrated Township & Industrial Park
*Projects not managed by SCD
23
© Sembcorp Industries 2012 24
Sharpen Competitive EdgeBusiness Model
1990 2007 Future potential
Valu
e C
reation
Industrial Park Model
Utilities
Facilities Management
Urban Development Model
Utilities
Facilities Management
Land Developer• Industrial land sales
Real Estate Developer• Ready-built factories (RBF)• Built-to-suit factories
Land Developer• Industrial land sales• Commercial & Residential land
sales
Real Estate Developer• Ready-built factories (RBF)• Built-to-suit factories• Commercial & Residential
- Within the Parks- Around the Parks

13
© Sembcorp Industries 2012
Why PPP?
© Sembcorp Industries 2012
� Strategic Fit
� Complement our global total water
solutions footprint
� Showcase our leadership in operational
and integrated water solution provider
expertise
Why PPP?
� Opportunity for future collaborations across entire supply chain to reap technology and
optimization benefits
� Diversity in different business models in different sectors increases Sembcorp Group
experience and provides opportunities for continuous improvements through sharing via
our global best practices network
� Enhances international and global organizational skills within the Group

14
© Sembcorp Industries 2012
Sembcorp PUB PPP Commercial Structure
© Sembcorp Industries 2012
Contracts Structure
Sembcorp NEWaterSembcorp NEWater
EPC contract with
Sembcorp Utilities
Power supply
Contract with
Sembcorp Power
Water Supply Agreement with PUB
O&M Contract
with Sembcorp
Industries
Turnkey project
• Notice to Proceed: Feb 2008
• Initial Completion: 31 Jul 09 (15 MiGD)
• Final Completion: 31 May 10 (50 MiGD)
O&M services contract
• Sembcorp Industries
• O&M of NEWater plant (25 years)
• Sembcorp NEWater wholesales NEWater to
PUB for Island wide distribution and sales.
• PUB Changi WRP provides feedwater to
Sembcorp NEWater
• Applicable tariff will be paid by PUB based
on actual NEWater quantity supplied
• Technical requirements specified in Water
Supply Agreement
Power supply contract
• Sembcorp Power
• 25 years supplies from final
completion

15
© Sembcorp Industries 2012
Facilities Description
© Sembcorp Industries 2012
Production of NEWater

16
© Sembcorp Industries 2012
Equalization Tank32,000 m3
Effluent Transfer Pumps
CWRP
Liquid
Treatment
Module 1
300µm MF Feed Auto-strainers
MF Feed Pumps
Sodium HypochloriteAmmonium Sulfate*
Micro Filtration13,000 m3/h, 93% recovery(7 trains x 8 blocks x 120
modules)ReverseOsmosis
Feed Tanks
RO Feed Pumps
8” RO 9,500 m3/h, 80% recovery
(10 trains x 135+63 vessels x 7 elements)
RO Anti-scalantSodium Bisulfite
Low-Pressure UV(6 units x 30 lamps)
NEWater Storage Tanks(5 x 17,100 m3)
So
diu
m H
yd
roxid
eS
od
ium
Hyp
och
lorite
NEWater Pumps3,150 m3/h @ 72m
each
Sodium HypochloriteSulfuric Acid*
* Dosed when necessary
Ø900 mm to Bedok NF
NIP Ø2,200 mm to Mandai Hill Service
Reservoir
Qu
ality
An
aly
zers
Flo
wm
ete
rs
PUB
Sembcorp
Process Flow DiagramProcess Flow DiagramProcess Flow DiagramProcess Flow Diagram
© Sembcorp Industries 2012
Plant Layout - Architecture
32

17
© Sembcorp Industries 2012
Plant Layout
33
NEWater Process Area
MF / RO / UV
NEWater Storage Area
Equilization Tank
MF Feedwater Pumping
NEWater Pumping Station & Valve Vault
© Sembcorp Industries 2012
Feedwater Tank Inlet
34
Feedwater Source: ~300K M3/D
Secondary treated effluent from
PUB Changi Water Reclamation Plant

18
© Sembcorp Industries 2012
Equalization and Diversion Tanks L85m x W32m x H11m – 32K M3
35
© Sembcorp Industries 2012
Micro Filtration Feed Pump System~ 4K M3/H, 450KW, Variable Speed Drive
36

19
© Sembcorp Industries 2012
Auto Strainer SystemAmiad 20” Dia, 300 microns
37
© Sembcorp Industries 2012
Micro Filtration TrainsSiemens Memcor, 7 trains x 8 Blocks x 120 modules13K M3/H, 93% Recovery
38

20
© Sembcorp Industries 2012
Reverse Osmosis TrainsToray, 9.5K M3/H, 80% recovery10 trains x 135 vessels x 7 elements
39
© Sembcorp Industries 2012
Ultra-violet Disinfecting System6 units
40

21
© Sembcorp Industries 2012
NEWater Storage TanksDia 40M x H14.3M, 5 x 17K M3
41
© Sembcorp Industries 2012
NEWater Pumping Station5 x ~3K M3/H
42

22
© Sembcorp Industries 2012
Process Plant Area
43
Clean in Place Facilities
Chemical Dosing Facilities
UV / RO / MFProcess Units
© Sembcorp Industries 2012
PPP Critical Success Factors

23
© Sembcorp Industries 2012
PPP – Critical Success Factors
45
• Long term contract with outputs defined
• Clear sharing and allocation of risks
• Performance based payment mechanism
• Rewards and costs sharing for continuous improvements
• Services Delivery Management not construction nor goods supply contract management
• Proactive and transparent plant information monitoring and sharing – collaboration attitude
• Relationship = Partnership (mentality must be actively cultivated with Senior Management sponsorship)
© Sembcorp Industries 2012
Examples on Critical Success Factors

24
© Sembcorp Industries 2012
Some Examples of CSFs
47
� Long term contract with output defined� Sembcorp will provide innovative,
essential and cost effective solutions (see our tag line)
� Clear sharing and allocation of risks� Each party assumes risks they are in
best position to manage
� Rewards and costs sharing� Sembcorp will optimize but some
technology needs piloting
� Services Delivery Management� Feedwater quality wide fluctuation
task force� Proactive and open communication
can be a very effective low costs solution too
© Sembcorp Industries 2012
Some Examples of CSFs
48
� Relationship management
� Proactively seek to improve on relationship
� Assign the right people (flexible mentality)
� Senior Management sponsorship (commit the resources)
� Take the opportunity to Celebrate every success regardless of size
� Proactively champion plant performance continuous improvements (seek common goals)

25
© Sembcorp Industries 2012
Moving On – Next 20 Years
© Sembcorp Industries 2012
Relationship Management is Key
50
• PPP is interdependent and long term in nature
• Step – in rights is good on paper and is lose – lose
• Build up partnership based on common ground – mutual benefits• Flexibility• Behaviors to support mutual respect and understanding• Transparent and open communications• Seek common goals
Coming together is a beginning; keeping together is progress;working together is success.
- Henry Ford