Embed Size (px)
Citation preview
Self-regulation during pre-service primary school teachers’
mathematical problem solving
Iuliana Zsoldos-MarchisBabes-Bolyai University,Cluj-Napoca, Romania
This research was funded by Babes-Bolyai University, contract number
GTC_34070/2013
Self-regulated learning
• Self-regulated learning (SRL) is an academically effective form of learning, through which the learner set goals and make plans before starting to learn; monitor and regulate his/her cognition, motivation and behavior during the learning process; and reflect on his/her learning process.
• Self-regulated learning skills are important for a successful mathematical problem solving.
Research design
• Goal: to study pre-service primary school teachers’ attitude towards Mathematics and their self-regulation during Mathematical problem solving.
• Sample: 202 Preschool and Primary School Pedagogy specialization students from Babes-Bolyai University: – 196 (97,03%) female, 7 (2,97%) male students; – 91 (45,05%) 1st year, 67 (33,17%) 2nd year, 44
(21,78%) 3rd year students.
Research design
• Instrument: questionnaire – Containing:
• two demographical questions regarding the participants’ sex and year of study;
• 28 items related with the research topic, which are formulated as affirmations measured on a 4 point Likert scale.
– Cronbach’s alpha reliability for the questionnaire is 0.83.
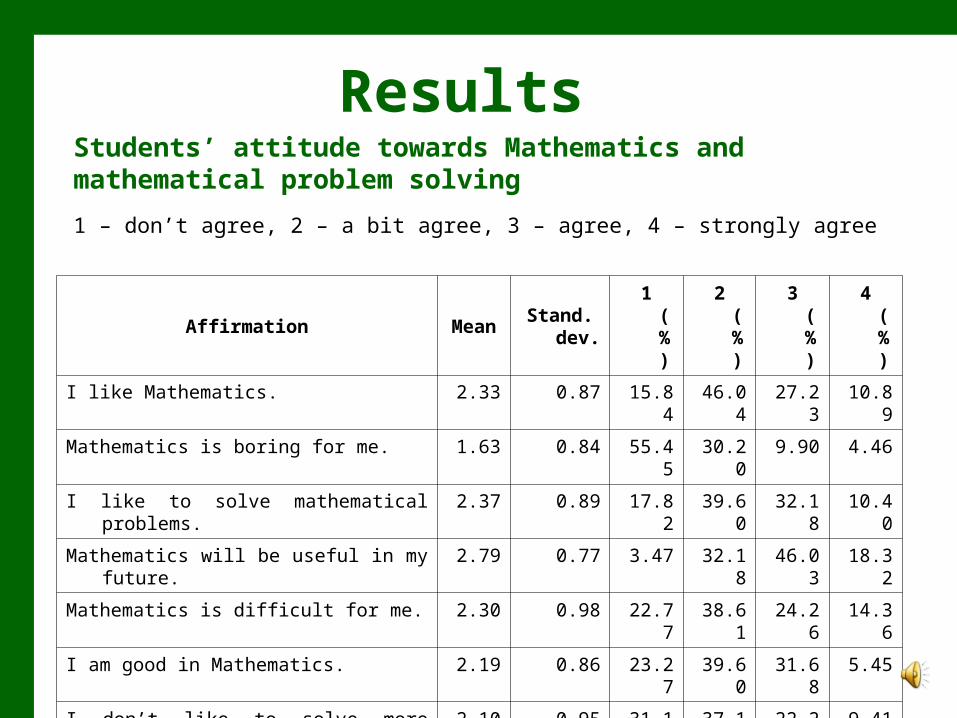
Results
Affirmation MeanStand.
dev.1 (%) 2 (%) 3 (%) 4 (%)
I like Mathematics. 2.33 0.87 15.84 46.04 27.23 10.89
Mathematics is boring for me. 1.63 0.84 55.45 30.20 9.90 4.46
I like to solve mathematical problems. 2.37 0.89 17.82 39.60 32.18 10.40
Mathematics will be useful in my future. 2.79 0.77 3.47 32.18 46.03 18.32
Mathematics is difficult for me. 2.30 0.98 22.77 38.61 24.26 14.36
I am good in Mathematics. 2.19 0.86 23.27 39.60 31.68 5.45
I don’t like to solve more problems of the same type.
2.10 0.95 31.19 37.13 22.28 9.41
After I understand a method, I like to solve more problems of the same type.
2.30 0.89 4.46 26.24 34.65 34.65
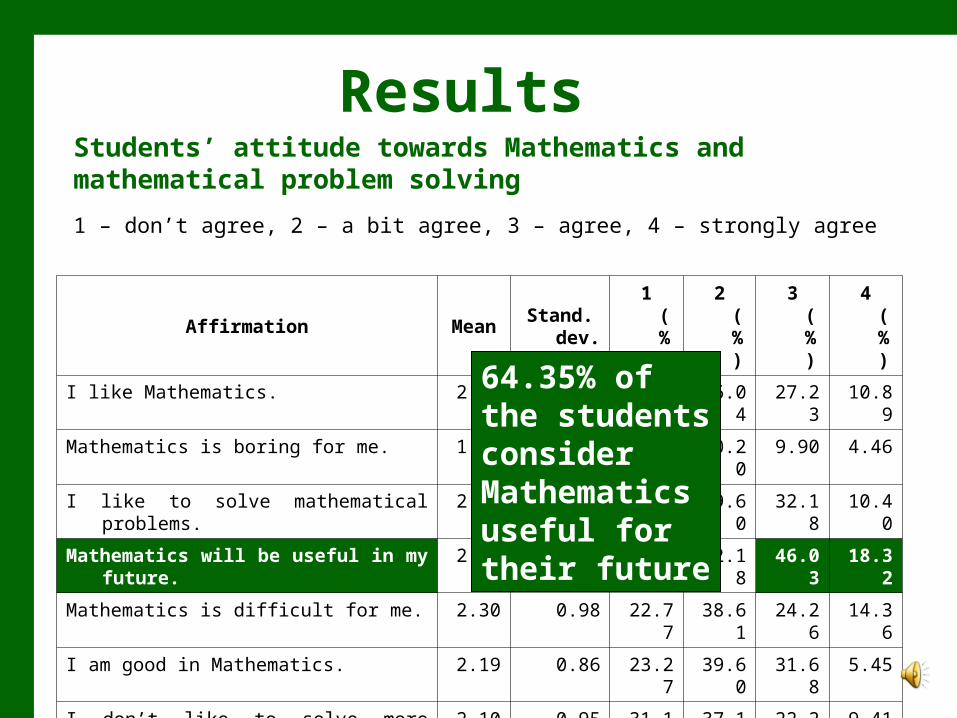
Students’ attitude towards Mathematics and mathematical problem solving
1 – don’t agree, 2 – a bit agree, 3 – agree, 4 – strongly agree
Results
Affirmation MeanStand.
dev.1 (%) 2 (%) 3 (%) 4 (%)
I like Mathematics. 2.33 0.87 15.84 46.04 27.23 10.89
Mathematics is boring for me. 1.63 0.84 55.45 30.20 9.90 4.46
I like to solve mathematical problems. 2.37 0.89 17.82 39.60 32.18 10.40
Mathematics will be useful in my future. 2.79 0.77 3.47 32.18 46.03 18.32
Mathematics is difficult for me. 2.30 0.98 22.77 38.61 24.26 14.36
I am good in Mathematics. 2.19 0.86 23.27 39.60 31.68 5.45
I don’t like to solve more problems of the same type.
2.10 0.95 31.19 37.13 22.28 9.41
After I understand a method, I like to solve more problems of the same type.
2.30 0.89 4.46 26.24 34.65 34.65
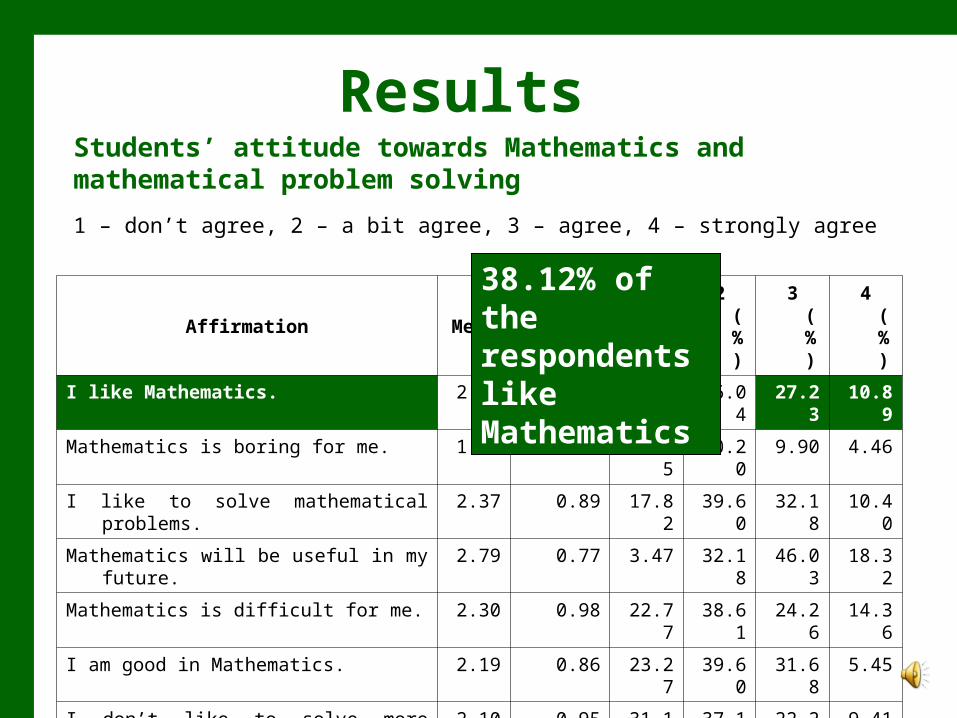
Students’ attitude towards Mathematics and mathematical problem solving
1 – don’t agree, 2 – a bit agree, 3 – agree, 4 – strongly agree
64.35% of the students consider Mathematics useful for their future
Results
Affirmation MeanStand.
dev.1 (%) 2 (%) 3 (%) 4 (%)
I like Mathematics. 2.33 0.87 15.84 46.04 27.23 10.89
Mathematics is boring for me. 1.63 0.84 55.45 30.20 9.90 4.46
I like to solve mathematical problems. 2.37 0.89 17.82 39.60 32.18 10.40
Mathematics will be useful in my future. 2.79 0.77 3.47 32.18 46.03 18.32
Mathematics is difficult for me. 2.30 0.98 22.77 38.61 24.26 14.36
I am good in Mathematics. 2.19 0.86 23.27 39.60 31.68 5.45
I don’t like to solve more problems of the same type.
2.10 0.95 31.19 37.13 22.28 9.41
After I understand a method, I like to solve more problems of the same type.
2.30 0.89 4.46 26.24 34.65 34.65
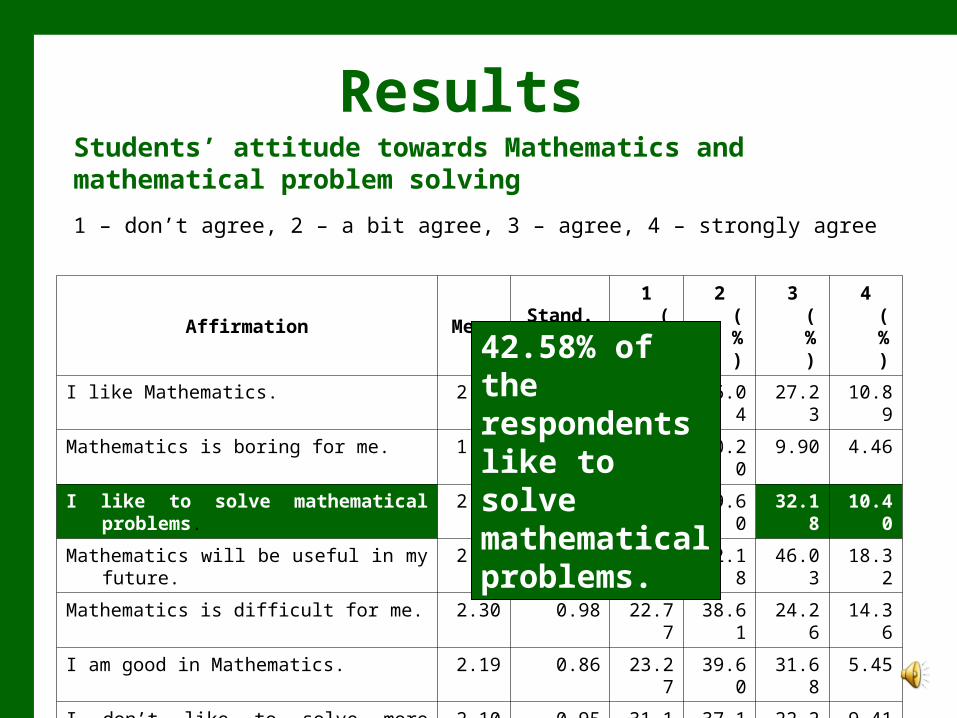
Students’ attitude towards Mathematics and mathematical problem solving
1 – don’t agree, 2 – a bit agree, 3 – agree, 4 – strongly agree
38.12% of the respondents like Mathematics
Results
Affirmation MeanStand.
dev.1 (%) 2 (%) 3 (%) 4 (%)
I like Mathematics. 2.33 0.87 15.84 46.04 27.23 10.89
Mathematics is boring for me. 1.63 0.84 55.45 30.20 9.90 4.46
I like to solve mathematical problems. 2.37 0.89 17.82 39.60 32.18 10.40
Mathematics will be useful in my future. 2.79 0.77 3.47 32.18 46.03 18.32
Mathematics is difficult for me. 2.30 0.98 22.77 38.61 24.26 14.36
I am good in Mathematics. 2.19 0.86 23.27 39.60 31.68 5.45
I don’t like to solve more problems of the same type.
2.10 0.95 31.19 37.13 22.28 9.41
After I understand a method, I like to solve more problems of the same type.
2.30 0.89 4.46 26.24 34.65 34.65
Students’ attitude towards Mathematics and mathematical problem solving
1 – don’t agree, 2 – a bit agree, 3 – agree, 4 – strongly agree
42.58% of the respondents like to solve mathematical problems.
Results
Affirmation MeanStand.
dev.1 (%) 2 (%) 3 (%) 4 (%)
I like Mathematics. 2.33 0.87 15.84 46.04 27.23 10.89
Mathematics is boring for me. 1.63 0.84 55.45 30.20 9.90 4.46
I like to solve mathematical problems. 2.37 0.89 17.82 39.60 32.18 10.40
Mathematics will be useful in my future. 2.79 0.77 3.47 32.18 46.03 18.32
Mathematics is difficult for me. 2.30 0.98 22.77 38.61 24.26 14.36
I am good in Mathematics. 2.19 0.86 23.27 39.60 31.68 5.45
I don’t like to solve more problems of the same type.
2.10 0.95 31.19 37.13 22.28 9.41
After I understand a method, I like to solve more problems of the same type.
2.30 0.89 4.46 26.24 34.65 34.65
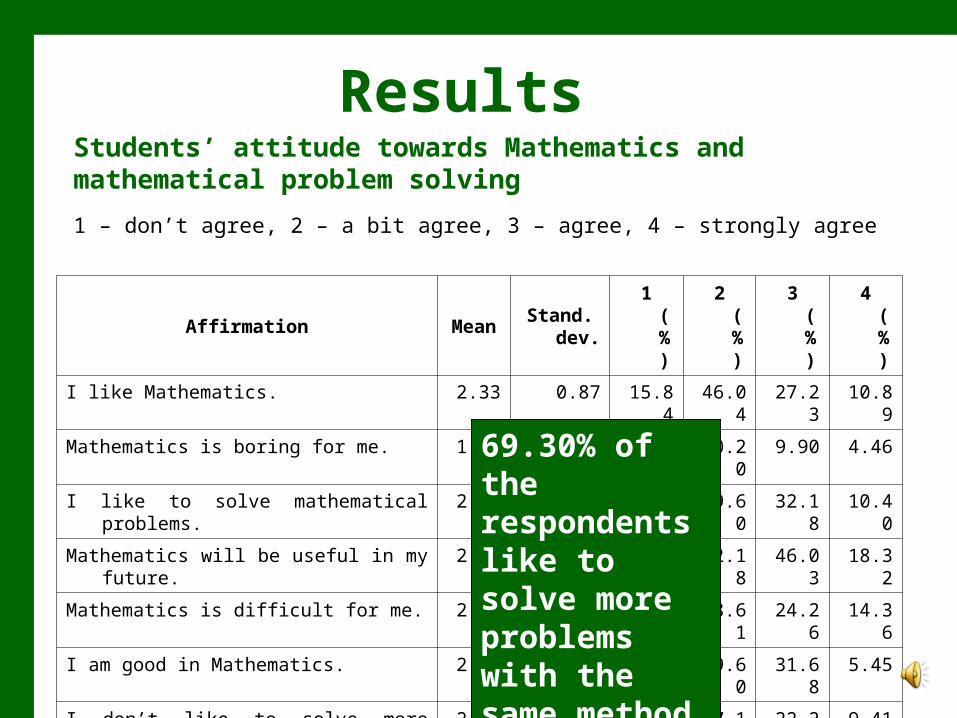
Students’ attitude towards Mathematics and mathematical problem solving
1 – don’t agree, 2 – a bit agree, 3 – agree, 4 – strongly agree
69.30% of the respondents like to solve more problems with the same method.
Results
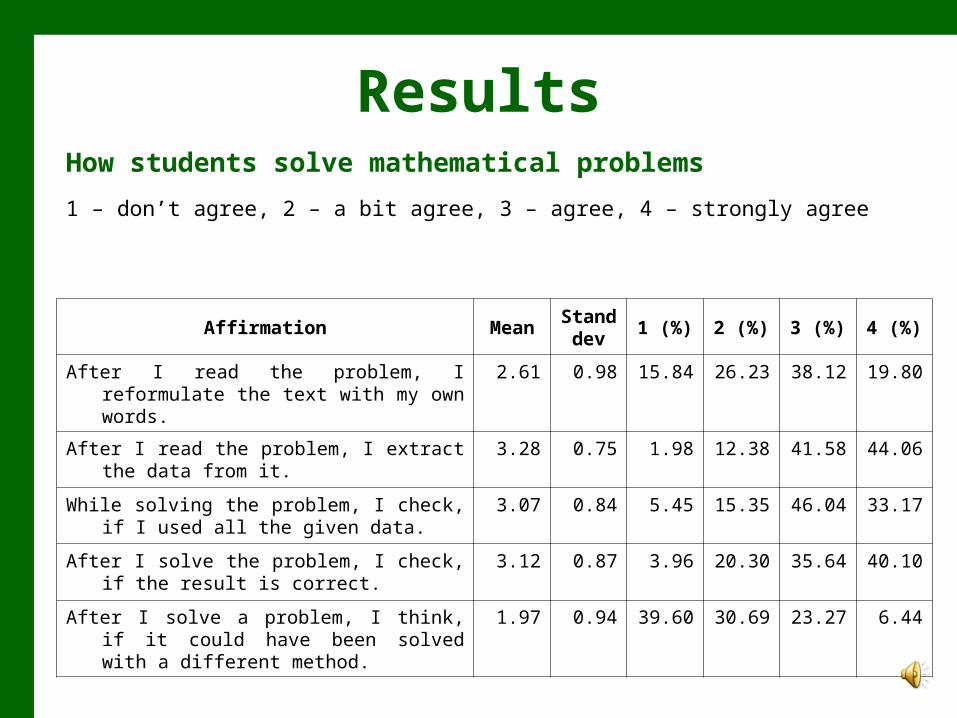
Affirmation MeanStand dev
1 (%) 2 (%) 3 (%) 4 (%)
After I read the problem, I reformulate the text with my own words.
2.61 0.98 15.84 26.23 38.12 19.80
After I read the problem, I extract the data from it.
3.28 0.75 1.98 12.38 41.58 44.06
While solving the problem, I check, if I used all the given data.
3.07 0.84 5.45 15.35 46.04 33.17
After I solve the problem, I check, if the result is correct.
3.12 0.87 3.96 20.30 35.64 40.10
After I solve a problem, I think, if it could have been solved with a different method.
1.97 0.94 39.60 30.69 23.27 6.44
How students solve mathematical problems
1 – don’t agree, 2 – a bit agree, 3 – agree, 4 – strongly agree
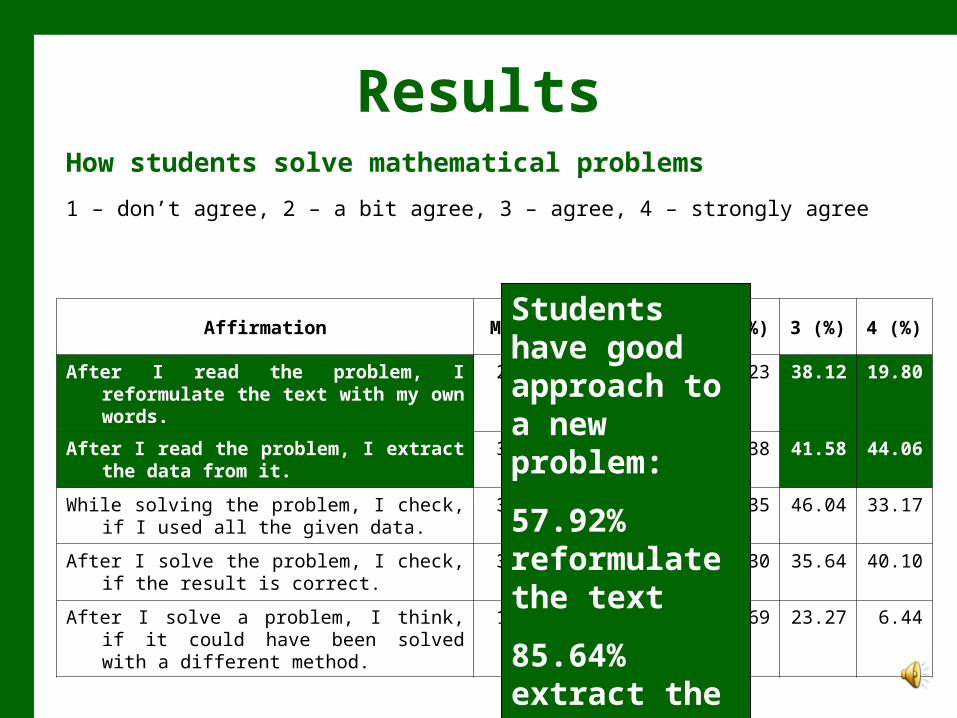
Results
Affirmation MeanStand dev
1 (%) 2 (%) 3 (%) 4 (%)
After I read the problem, I reformulate the text with my own words.
2.61 0.98 15.84 26.23 38.12 19.80
After I read the problem, I extract the data from it.
3.28 0.75 1.98 12.38 41.58 44.06
While solving the problem, I check, if I used all the given data.
3.07 0.84 5.45 15.35 46.04 33.17
After I solve the problem, I check, if the result is correct.
3.12 0.87 3.96 20.30 35.64 40.10
After I solve a problem, I think, if it could have been solved with a different method.
1.97 0.94 39.60 30.69 23.27 6.44
How students solve mathematical problems
1 – don’t agree, 2 – a bit agree, 3 – agree, 4 – strongly agree
Students have good approach to a new problem:
57.92% reformulate the text
85.64% extract the data
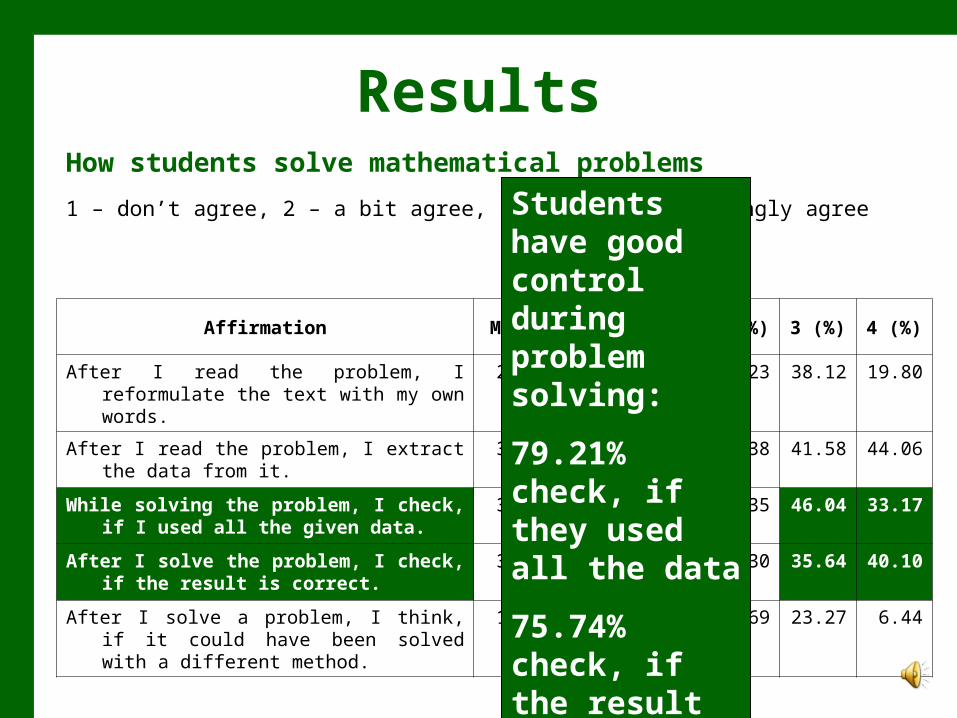
Results
Affirmation MeanStand dev
1 (%) 2 (%) 3 (%) 4 (%)
After I read the problem, I reformulate the text with my own words.
2.61 0.98 15.84 26.23 38.12 19.80
After I read the problem, I extract the data from it.
3.28 0.75 1.98 12.38 41.58 44.06
While solving the problem, I check, if I used all the given data.
3.07 0.84 5.45 15.35 46.04 33.17
After I solve the problem, I check, if the result is correct.
3.12 0.87 3.96 20.30 35.64 40.10
After I solve a problem, I think, if it could have been solved with a different method.
1.97 0.94 39.60 30.69 23.27 6.44
How students solve mathematical problems
1 – don’t agree, 2 – a bit agree, 3 – agree, 4 – strongly agree Students have good control during problem solving:
79.21% check, if they used all the data
75.74% check, if the result is correct
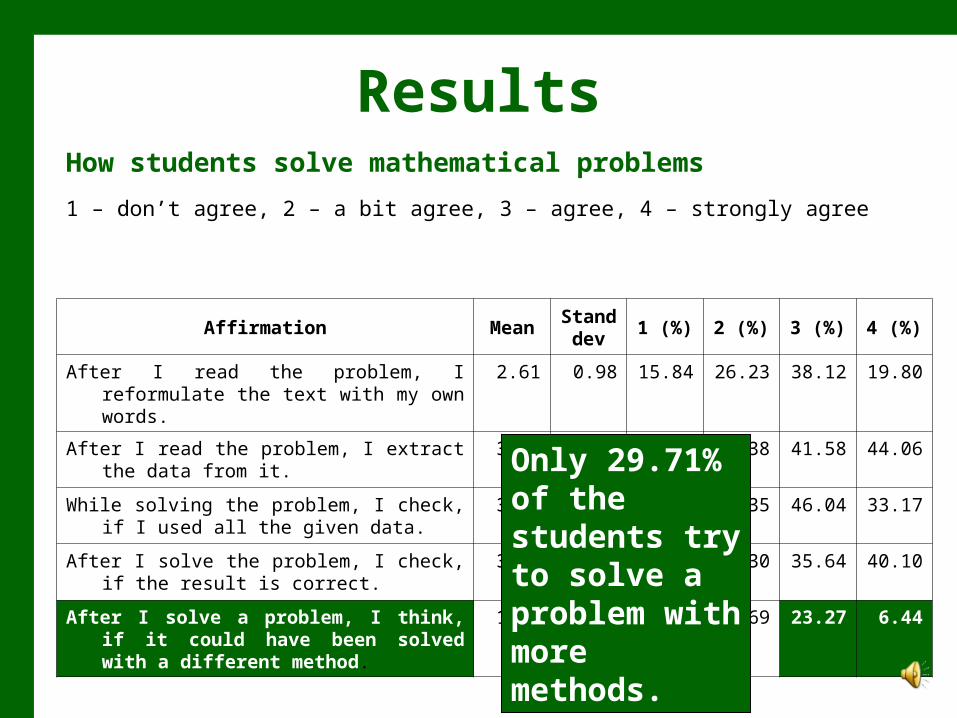
Results
Affirmation MeanStand dev
1 (%) 2 (%) 3 (%) 4 (%)
After I read the problem, I reformulate the text with my own words.
2.61 0.98 15.84 26.23 38.12 19.80
After I read the problem, I extract the data from it.
3.28 0.75 1.98 12.38 41.58 44.06
While solving the problem, I check, if I used all the given data.
3.07 0.84 5.45 15.35 46.04 33.17
After I solve the problem, I check, if the result is correct.
3.12 0.87 3.96 20.30 35.64 40.10
After I solve a problem, I think, if it could have been solved with a different method.
1.97 0.94 39.60 30.69 23.27 6.44
How students solve mathematical problems
1 – don’t agree, 2 – a bit agree, 3 – agree, 4 – strongly agree
Only 29.71% of the students try to solve a problem with more methods.
Results
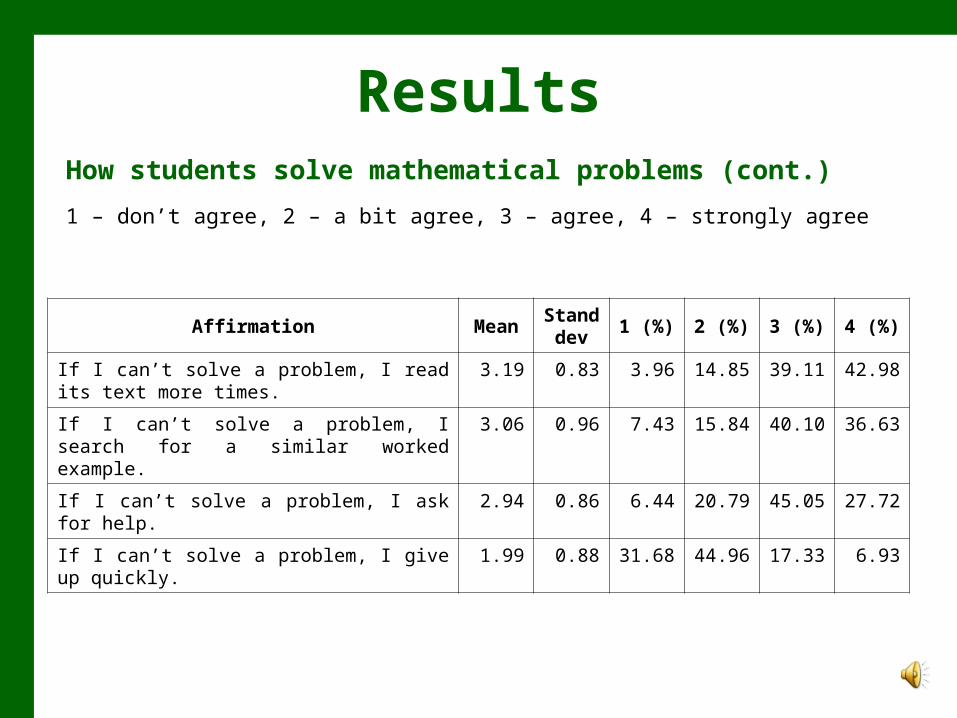
Affirmation MeanStand dev
1 (%) 2 (%) 3 (%) 4 (%)
If I can’t solve a problem, I read its text more times.
3.19 0.83 3.96 14.85 39.11 42.98
If I can’t solve a problem, I search for a similar worked example.
3.06 0.96 7.43 15.84 40.10 36.63
If I can’t solve a problem, I ask for help. 2.94 0.86 6.44 20.79 45.05 27.72
If I can’t solve a problem, I give up quickly. 1.99 0.88 31.68 44.96 17.33 6.93
How students solve mathematical problems (cont.)
1 – don’t agree, 2 – a bit agree, 3 – agree, 4 – strongly agree
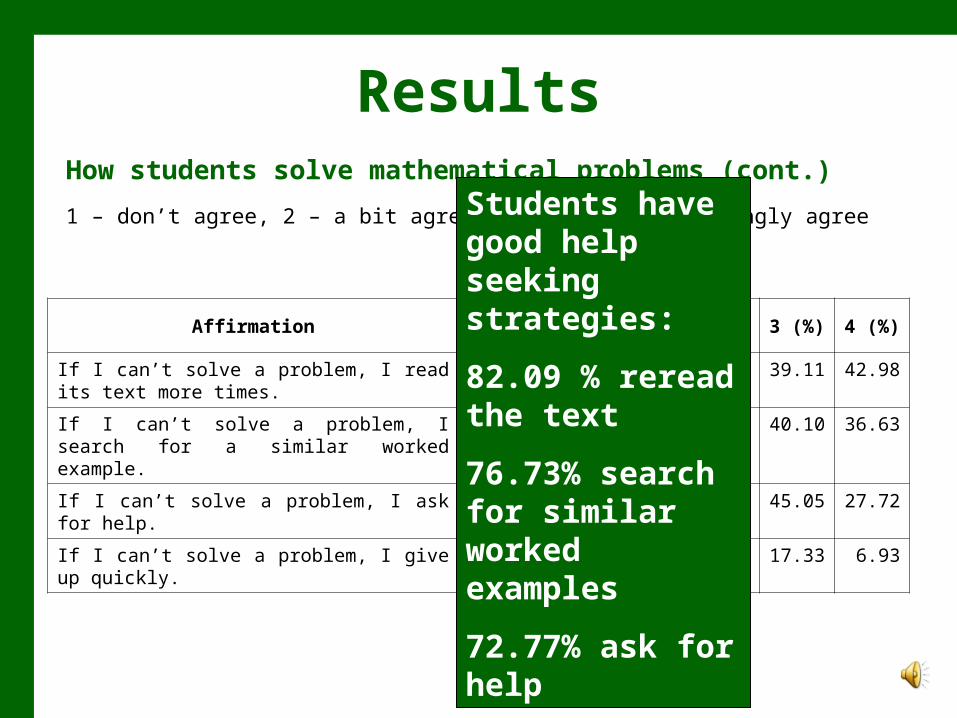
Results
Affirmation MeanStand dev
1 (%) 2 (%) 3 (%) 4 (%)
If I can’t solve a problem, I read its text more times.
3.19 0.83 3.96 14.85 39.11 42.98
If I can’t solve a problem, I search for a similar worked example.
3.06 0.96 7.43 15.84 40.10 36.63
If I can’t solve a problem, I ask for help. 2.94 0.86 6.44 20.79 45.05 27.72
If I can’t solve a problem, I give up quickly. 1.99 0.88 31.68 44.96 17.33 6.93
How students solve mathematical problems (cont.)
1 – don’t agree, 2 – a bit agree, 3 – agree, 4 – strongly agree Students have good help seeking strategies:
82.09 % reread the text
76.73% search for similar worked examples
72.77% ask for help
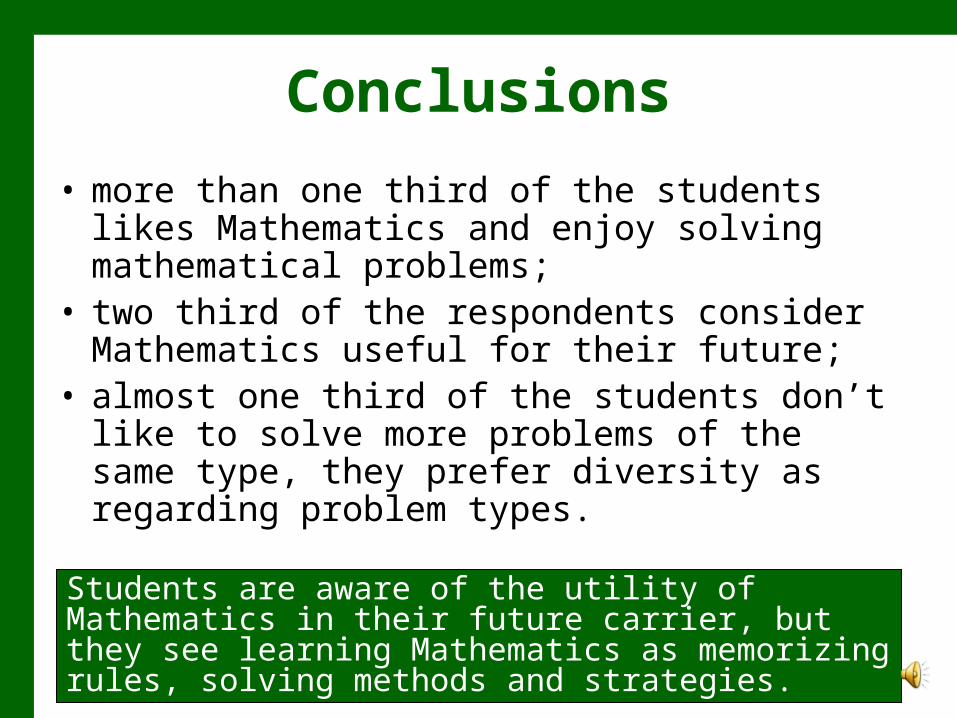
Conclusions
• more than one third of the students likes Mathematics and enjoy solving mathematical problems;
• two third of the respondents consider Mathematics useful for their future;
• almost one third of the students don’t like to solve more problems of the same type, they prefer diversity as regarding problem types.
Students are aware of the utility of Mathematics in their future carrier, but they see learning Mathematics as memorizing rules, solving methods and strategies.
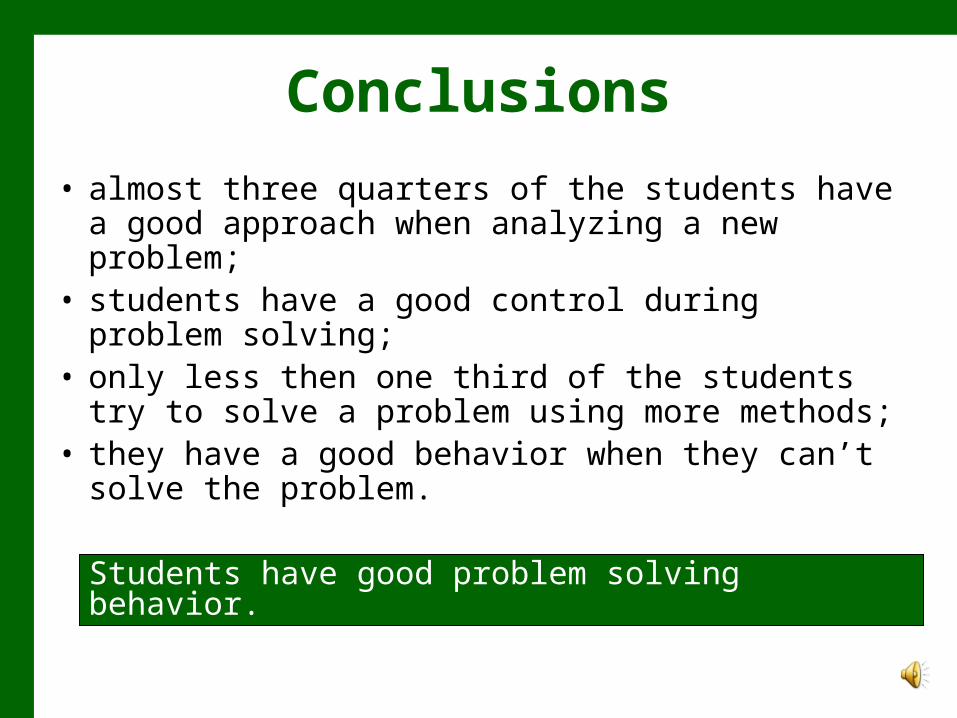
Conclusions
• almost three quarters of the students have a good approach when analyzing a new problem;
• students have a good control during problem solving;
• only less then one third of the students try to solve a problem using more methods;
• they have a good behavior when they can’t solve the problem.
Students have good problem solving behavior.
Thank your for your attention!