Embed Size (px)
Citation preview

Journal of Volcanology and Geothermal Research 260 (2013) 27–42
Contents lists available at SciVerse ScienceDirect
Journal of Volcanology and Geothermal Research
j ourna l homepage: www.e lsev ie r .com/ locate / jvo lgeores
Seismic Vp and Vp/Vs structure of the geothermal area around Tarutung(North Sumatra, Indonesia) derived from local earthquake tomography
Umar Muksin a,b,⁎, Klaus Bauer a, Christian Haberland a
a German Research Centre for Geosciences GFZ, Potsdam, Germanyb Department of Physics, Syiah Kuala University, Banda Aceh, Indonesia
⁎ Corresponding author at: German Research CentreGermany.
E-mail address: [email protected] (U. M
0377-0273 © 2013 The Authors. Published by Elsevierhttp://dx.doi.org/10.1016/j.jvolgeores.2013.04.012
a b s t r a c t
a r t i c l e i n f oArticle history:Received 16 September 2012Accepted 18 April 2013Available online 2 May 2013
Keywords:Sumatran faultLocal seismicityP and S velocity structureGeothermal exploration
A passive seismic experiment with 42 short-period stations was setup for 10 months fromMay 2011 within a20–30 km radius covering the Tarutung basin and the northern part of the Sarulla graben along the seismi-cally active Sumatran fault (North Sumatra, Indonesia). The objective of the project is to investigate the geo-thermal setting based on the Vp and Vp/Vs structures and the distribution of seismicity. We recorded 2856local earthquakes by at least 8 stations which were reduced to 809 events having gap angle less than 180°.The initial earthquake locations were determined using simultaneous inversion for hypocenters and 1D ve-locity structure followed by 3D tomographic inversion. The resulting seismicity distribution, Vp and Vp/Vsstructure reveal systematic differences between the Tarutung basin and the Sarulla graben. The Tarutungpull-apart basin is characterized by a complex structure reflected by a broader distribution of seismicity com-pared with the very narrow, rather vertical hypocenter distribution in the Sarulla graben, which was formedby fault-perpendicular extension and not by pull-apart tectonics. High Vp/Vs values near to the surface areimaged within the Sarulla graben and northeast of the Tarutung basin. These features are interpreted asfluid bearing sediments with fracturing indicating potentially favorable conditions for geothermal exploita-tion. The localized fluid flow northeast of Tarutung could be explained by the releasing step-over structureof the pull-apart basin and resulting dilatational stress regime in this part of the basin. Heat sources are as-sumed to be located at greater depth in association with magmatic activities accompanying the subductionprocess, and the heat is transported along the Sumatran fault to shallow depth.
© 2013 The Authors. Published by Elsevier B.V. Open access under CC BY-NC-ND license.
1. Introduction
As Indonesia is one of the countries with the largest geothermalpotential, the Indonesian government together with contracted com-panies developed power plants using geothermal energy in Sibayakand Sarulla (Sumatra), Wayang Windu, Kamojang and Dieng (Java),and Lahendong (Sulawesi), among others. The Center for GeologicalResources, the Indonesian governmental agency for geothermal ex-ploration, proposes Tarutung (Fig. 1) as one of several potential targetregions for the future extension of geothermal exploration and ex-ploitation. Tarutung is located in northern Sumatra and is character-ized by a pull-apart basin structure formed along the Sumatran fault(Bellier and Sébrier, 1994). Geothermal potential is expected at thissite because of geotectonic similarities with the already productive
for Geosciences GFZ, Potsdam,
uksin).
B.V. Open access under CC BY-NC-ND
area around the Sarulla basin located approximately 30 km south ofTarutung. Initial exploration activities were undertaken under theguidance of Badan Geologi including magnetotelluric (MT) measure-ments and geological analysis covering mainly the northern part ofthe Tarutung basin (e.g. Niasari et al., 2012).
Since Tarutung and Sarulla are seismically active regions, we makeuse of these local earthquake sources and apply seismological methodsto investigate the geological structure in the geothermal area as havebeen recently used by some authors (e.g. Foulger, 1982; Chatterjee etal., 1985; Walck, 1988; Toomey and Foulger, 1989; Jousset et al.,2011). Passive seismic methods provide the Vp and Vp/Vs structure(Poisson's ratio) which is related to lithology and to the characteristicsof reservoirs. Seismic properties (Vp and Vp/Vs) of a study area couldreflect the properties of rocks, fluid and gas content, and lithology al-though they are influenced by variations of pressure, temperature, sat-uration, fluid type, porosity, and pore type in a complex way. Someauthors, e. g. Haberland and Rietbrock (2001) and Zucca et al. (1994),applied attenuation tomography for compressional and shear wavesto understand water saturation, pressure, temperature, characteristicof gas, and partial melting. The result of a passive seismic experimentfor geothermal exploration could also be used as the base-line for mon-itoring of the production process.
license.

98.7˚ 98.8˚ 98.9˚ 99˚ 99.1˚ 99.2˚ 99.3˚
1.6˚
1.7˚
1.8˚
1.9˚
2˚
2.1˚
2.2˚
2.3˚98.7˚
1.6˚
1.7˚
1.8˚
1.9˚
2˚
2.1˚
2.2˚
2.3˚
Siborongborong
Sarulla
Tarutung
Hopong C
aldera
Nam
ora L.
0 10
km
Stations Hot springs Volcanoes
Sumatran Fault
Martimbang V.
Imun V.
PgSi
Ht
~22 mm
/yr
0 500 1000 1500 2000 2500Elev. (m)
Sumatra
TarutungToba
Fig. 1. Tarutung area located in the south of Lake Toba characterized by the presence Tarutung pull-apart basin, Sarulla graben, Hopong caldera, Namora Langit field domeMartimbang and Imun volcano, and also geothermal manifestations (hot springs). Three big manifestations (indicated by the bigger red stars) called Panabungan (Pg), Sipoholon(Si), and Hutabarat (Ht). The seismic instruments (blue triangles) were deployed covering the area of Tarutung and Sarulla. The white triangle indicates the reference station usedfor inversion.
28 U. Muksin et al. / Journal of Volcanology and Geothermal Research 260 (2013) 27–42
In this paper, we describe a new passive seismic experiment in theTarutung area (northern Sumatra, Indonesia) and derive the Vp andVp/Vs structure and the seismicity distribution using high qualitylocal earthquake data. We investigate the lithology in relation to theseismic properties and compare the results with the previous geo-physical studies. A pattern recognition analysis (Bauer et al., 2012)is performed to classify dominant features found within the Vp andVp/Vs tomography images and to characterize these clusters bytheir dominant physical properties. Integration of different resultssuch as Vp, Vp/Vs and seismicity distribution finally allows us to de-velop conceptual models for the Tarutung and Sarulla regions.
2. Geological, tectonic and geophysical setting
Tarutung and Sarulla are part of the North Tapanuli district whichis located along the Sumatran fault further south of the Lake Toba(Fig. 1). The 1900 km long dextral slip Sumatran fault accommodatesa significant amount of the trench-parallel component of the obliqueconvergence between the Indo-Australian and Eurasian plates(Bellier and Sébrier, 1994; Sieh and Natawidjaja, 2000; McCaffrey,2009). The change of rate and direction of the Indo-Australian platemotion causes the right step-over segmentation of the Sumatranfault (Sieh and Natawidjaja, 2000) which is responsible for the pres-ence of the Tarutung pull-apart basin. In more detail, Bellier andSébrier (1994) suggested that the Tarutung basin was formed whena new branch of the Sumatra fault was developing at the westernflank of the Toba caldera as a consequence of a larger step-over ofthe previous fault system and subsequent formation of the great
Toba caldera within this older step-over region. The Sarulla graben lo-cated south of Tarutung, on the other hand, is not a typical pull-apartbasin, which was formed in a more complex setting. FollowingHickman et al. (2004) the asymmetrical architecture of the Sarullabasin is related to the normal extension of the strands along thestrike–slip zone. Analyzing local seismicity, Weller et al. (2012) no-ticed the formation of strike–slip duplexes along the Sumatra Fault.
Another main feature of the Sumatran Fault System is the colloca-tion with the volcanic arc including calderas in direct proximity to thefault. In general, the position of the volcanic arcs correlates with thegeometry of the subduction zone (e.g. Tatsumi, 1989). In subductionzones with oblique convergence, prominent trench-parallel strike–slip fault systems often develop within the magmatic arc. This is forexample the case in the South-Chilean subduction zone, where theLiquene–Ofqui Fault Zone accommodates the northward motion of acontinental forearc sliver relative to the South-American continent(Cembrano et al., 1996; Lange et al., 2008), or at the western marginof North America, where the San Andreas Fault System takes up mostof the shear component (Teyssier et al., 1995). In Sumatra, thetrench-parallel Sumatra fault is also collocated with arc volcanic cen-ters, however, this might be pure coincidence (Sieh and Natawidjaja,2000). Regardless of the causal dependencies of volcanism and faultdevelopment it appears reasonable that interrelations between mag-matic processes and the tectonic behavior of the fault exist, and theyare important for the understanding of the geothermal system. Bellierand Sébrier (1994) argued in the mechanical weak area there isa close relation between the quaternary volcanic center and theSumatran fault. Along the Tarutung area, there are three volcanoes

29U. Muksin et al. / Journal of Volcanology and Geothermal Research 260 (2013) 27–42
located close to the fault line which are Imun, Helatoba, and DolokMartimbang volcanoes as indicated by the red triangles in Fig. 1.Along the Sarulla region, some volcanic related activity is observedsuch as the Namora-I-Langit dome field (northern of Sarulla) andthe 9 km-diameter Hopong caldera located on the eastern side ofSarulla graben (Hickman et al., 2004). Along the Sumatran fault, onehalf of the hot fluid discharges is associated with the pull-apart basinsand the other half is associated with the volcanic activity (Muraoka etal., 2010). Since there are many volcanoes and calderas close to thepull-apart basins and the graben, both, the basins and the volcanic ac-tivity together could play important roles in controlling the geother-mal system.
Some previous seismological investigations were conducted innorthern Sumatra including also the Tarutung area but the focus ofthese studies was on the larger-scale crustal structure of the Toba re-gion (e. g. Koulakov et al., 2009; Stankiewicz et al., 2010a, 2010b) andon the crustal and lithospheric structure of the subducted InvestigatorFracture Zone (e.g. Lange et al., 2010). Seismicity recorded by regionalstations is shown in Fig. 1, where earthquakes at depths shallowerthan 30 km with magnitudes of up to Mb 6.6 (USGS NationalEarthquake Information Center, 2012) are plotted as red circles.Using local travel time tomography, Koulakov et al. (2009) foundlow and high Vp/Vs anomalies along the Tarutung and Sarulla basins.However, for the geothermal exploration purposes, this model wasrelatively coarsely parameterized both in horizontal and vertical di-rection and included only three stations around the Tarutung andSarulla basins. Ambient noise tomography of the Toba region(Stankiewicz et al., 2010a, 2010b) provided surface wave velocity im-ages derived for distinct periods and corresponding pseudo-depthranges. Following this investigation the Lake Toba is underlain bylow surface wave velocity material most likely associated withremnants of magmatic bodies of the great Toba eruption 75 ka(e.g. Rose and Chesner, 1987), in agreement with the body wavetomography results of Koulakov et al. (2009). While Tarutung waspartly covered by the network used by Stankiewicz et al. (2010a,2010b), the station distribution and ray coverage were not denseenough to resolve local features within our study area. Our new mi-croseismic study with a dense network installed over a comparablysmall area provides structural images of seismic properties and theseismicity distribution, both improving the understanding of the tec-tonic setting and the geothermal system.
3. Experiment and data
The temporary network consisted of 42 short period seismic in-struments deployed in the Tarutung and Sarulla region from mid ofMay 2011 to mid of February 2012 (Fig. 1). We used 40 three compo-nent short period (1 Hz) sensors and recorded the signals using thePR6-24 Earth Data Logger (EDL) sampling at 200 sps. After twomonths we added two more stations equipped with 3 component4.5 Hz geophones and DSS CUBE data logger (Omnirecs) recordingdata with 200 sps to improve the coverage south of Tarutung whereearthquakes occur frequently in the southernmost part of the Sarullabasin. The network covered the entire district of North Tapanuli alongthe mega fault between 1.71 N and 2.21 N and 98.79 E to 99.22 E withan average station spacing of around 5 km.
The arrival times of direct P and Swaveswere detected using the op-timized automatic picking routine of Nippress et al. (2010) to speed upthe data pre-processing. We then manually revised the picking of thehigh quality waveforms (waveforms have a clear onset), excludedpoor quality data and initially localized the events using HYPO71 (Leeand Valdes, 1985) based on a layered 1D velocity model modifiedfrom IASP91 (Kennett and Engdahl, 1991). The uncertainty of theP- and the S-arrivals are defined by the weighting factors of 0, 1,and 2 corresponding to the estimated picking uncertainty of 0.01 s,0.05 s, and 0.1 s, respectively.
We recorded 2586 events (Fig. 2a) along the Tarutung and Sarullabasins. However since the southernmost station did not work properlyat all times, we had to exclude some more events with azimuthal gapangles larger than 180°, and which occurred at depths greater than40 km. Another restriction is that we only used the events recordedby at least 8 stations which seems to be a good compromise betweena high data quantity (for reasonable model resolution) and requireddata quality. These constraints reduced the number of data to 809events (Fig. 2b) containing 13,184 observed P and 5922 Swave arrivals.This forms the catalog of initial hypocenters which is then successivelyused in the calculation of the minimum 1Dmodel and the relocation ofthese hypocenters (see below).
4. Methods of velocity modeling
The P and S wave travel time data were used to develop Vp andVp/Vs velocity models and to determine the seismicity distributionof local earthquakes. The work flow included (1) the inversion forthe so-called minimum-1D-velocity model (Vp and Vp/Vs) and therelocation of hypocenters using the program code velest (Kisslinget al., 1994), and (2) the simultaneous inversion for the 3D tomo-graphic velocity structure (Vp and Vp/Vs) and the earthquake hypo-center using the program code SIMUL2000 (Thurber, 1983; Eberhart-Phillips, 1990; Evans et al., 1994; Eberhart-Phillips and Michael,1998). The quality and uncertainty of the final results are investigatedand discussed in the subsequent section.
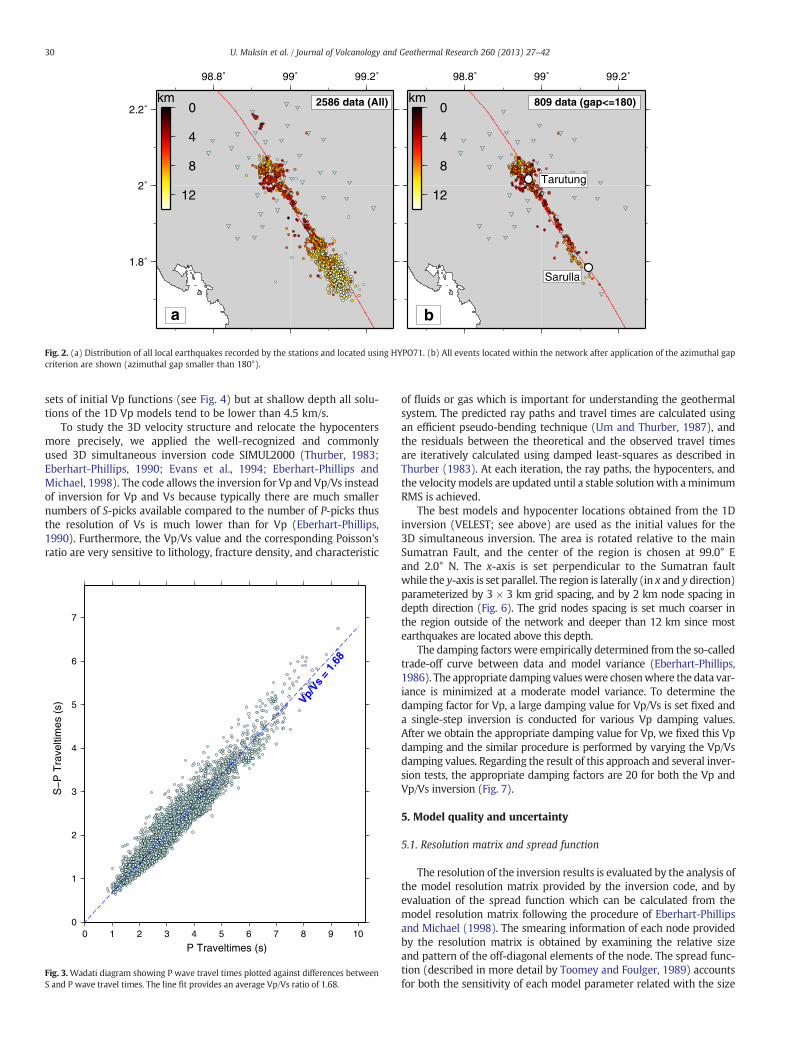
The hypocenter locations from HYPO71 served as starting valuesfor VELEST (Kissling et al., 1994), which was applied to relocate thehypocenters and simultaneously determine the 1D velocity modeland the station corrections. For the inversion, we defined stationX27 as the reference station (indicated by white triangle in Fig. 1)as it was located in the middle of the network and recorded the larg-est number of P and S arrivals. Ray tracing is performed to obtain thepredicted travel times based on the initial velocity model. The inver-sion is then applied to adjust the 1D model, the hypocenter locations,and the station corrections. The forward calculation is re-appliedusing the new (inverted) velocity model and the new hypocenters,and the calculated and observed travel times are compared to calculatethe RMS (root-mean-squared) misfit. This procedure is re-iterated byconsidering any possible combination of hypocenters, velocity models,and station corrections until the minimum RMS misfit of the solutionis achieved. A Vp/Vs ratio of 1.68 used as initial value in the inversionwas estimated from a modified Wadati diagram (Fig. 3). This value issmaller than the value of 1.77 determined by Weller et al. (2012) forthe region South of our study area. On the other hand, Koulakov et al.(2009) obtained Vp/Vs values of 1.62 at 5 km depth for the Toba regionincluding also parts our study area in a coarser model.
We imposed 45 initial 1D Vp models defined at depth nodes in2 km intervals and determined the velocity for the S-wave using theaverage Vp/Vs value from the Wadati diagram analysis (see above).After the inversion, all inverted models from various initial modelsconverge to the best global solution indicated by red lines in Fig. 4a,b, and c for Vp, Vs, and Vp/Vs, respectively. The data variance andthe RMS residuals decrease from 0.1548 s2 and 0.358 s, initially to0.00644 s2 and 0.0729 s finally showing the reliability of the solution.The models are best resolved at 4–12 km depth which is consistentwith the hypocenter distribution as shown in Fig. 4d. The P-wave sta-tion corrections (Fig. 5a) show negative values (red circles) along theSarulla and Tarutung basins which means that the stations along thebasins mostly recorded delayed arrivals relative to the reference sta-tion X27. The negative values of the P-wave station corrections indi-cate the sediment coverage along the basins. Fig. 5b shows that theS-wave station correction is relatively balanced and stations alongthe Sarulla basin and in the northeast of Tarutung recorded S-wavearrivals later. We have experimented with some various possible
98.8˚ 99˚ 99.2˚ 98.8˚ 99˚ 99.2˚
1.8˚
2˚
2.2˚2586 data (All)
a
0
4
8
12
km 809 data (gap<=180)
b
Tarutung
Sarulla
0
4
8
12
km
Fig. 2. (a) Distribution of all local earthquakes recorded by the stations and located using HYPO71. (b) All events located within the network after application of the azimuthal gapcriterion are shown (azimuthal gap smaller than 180°).
30 U. Muksin et al. / Journal of Volcanology and Geothermal Research 260 (2013) 27–42
sets of initial Vp functions (see Fig. 4) but at shallow depth all solu-tions of the 1D Vp models tend to be lower than 4.5 km/s.
To study the 3D velocity structure and relocate the hypocentersmore precisely, we applied the well-recognized and commonlyused 3D simultaneous inversion code SIMUL2000 (Thurber, 1983;Eberhart-Phillips, 1990; Evans et al., 1994; Eberhart-Phillips andMichael, 1998). The code allows the inversion for Vp and Vp/Vs insteadof inversion for Vp and Vs because typically there are much smallernumbers of S-picks available compared to the number of P-picks thusthe resolution of Vs is much lower than for Vp (Eberhart-Phillips,1990). Furthermore, the Vp/Vs value and the corresponding Poisson'sratio are very sensitive to lithology, fracture density, and characteristic
0
1
2
3
4
5
6
7
S−
P T
rave
ltim
es (
s)
0 1 2 3 4 5 6 7 8 9 10
P Traveltimes (s)
Vp/Vs
= 1.
68
Fig. 3.Wadati diagram showing P wave travel times plotted against differences betweenS and P wave travel times. The line fit provides an average Vp/Vs ratio of 1.68.
of fluids or gas which is important for understanding the geothermalsystem. The predicted ray paths and travel times are calculated usingan efficient pseudo-bending technique (Um and Thurber, 1987), andthe residuals between the theoretical and the observed travel timesare iteratively calculated using damped least-squares as described inThurber (1983). At each iteration, the ray paths, the hypocenters, andthe velocitymodels are updated until a stable solutionwith aminimumRMS is achieved.
The best models and hypocenter locations obtained from the 1Dinversion (VELEST; see above) are used as the initial values for the3D simultaneous inversion. The area is rotated relative to the mainSumatran Fault, and the center of the region is chosen at 99.0° Eand 2.0° N. The x-axis is set perpendicular to the Sumatran faultwhile the y-axis is set parallel. The region is laterally (in x and y direction)parameterized by 3 × 3 km grid spacing, and by 2 km node spacing indepth direction (Fig. 6). The grid nodes spacing is set much coarser inthe region outside of the network and deeper than 12 km since mostearthquakes are located above this depth.
The damping factors were empirically determined from the so-calledtrade-off curve between data and model variance (Eberhart-Phillips,1986). The appropriate damping valueswere chosenwhere the data var-iance is minimized at a moderate model variance. To determine thedamping factor for Vp, a large damping value for Vp/Vs is set fixed anda single-step inversion is conducted for various Vp damping values.After we obtain the appropriate damping value for Vp, we fixed this Vpdamping and the similar procedure is performed by varying the Vp/Vsdamping values. Regarding the result of this approach and several inver-sion tests, the appropriate damping factors are 20 for both the Vp andVp/Vs inversion (Fig. 7).
5. Model quality and uncertainty
5.1. Resolution matrix and spread function
The resolution of the inversion results is evaluated by the analysis ofthe model resolution matrix provided by the inversion code, and byevaluation of the spread function which can be calculated from themodel resolution matrix following the procedure of Eberhart-Phillipsand Michael (1998). The smearing information of each node providedby the resolution matrix is obtained by examining the relative sizeand pattern of the off-diagonal elements of the node. The spread func-tion (described in more detail by Toomey and Foulger, 1989) accountsfor both the sensitivity of each model parameter related with the size

vp [km/s] vs [km/s] vp/vs
a b c
0
2
4
6
8
10
12
14
16
18
20
22
24
dept
h [k
m]
2 4 6 8 1 2 3 4 5 1.50 1.75 2.00 0 50 100
Number of events
d
Fig. 4. Results of 1D inversion using the VELEST software, showing (a) P velocity, (b) S velocity, and (c) Vp/Vs ratios as a function of depth. (d) Distribution of the hypocenters afterthe 1D inversion.
31U. Muksin et al. / Journal of Volcanology and Geothermal Research 260 (2013) 27–42
of the corresponding diagonal elementwithin themodel resolutionma-trix, and also for the dependency with neighboring model parametersrepresented by the pattern of the off-diagonal elements.
Fig. 8 shows the spread values and the 70% model resolution ma-trix (indicated by the white contour lines) for horizontal layers ofboth the Vp (Fig. 8a–c) and the Vp/Vs models (Fig. 8d–f) at variousdepth. The spread values of the Vp and the Vp/Vs models are compa-rable but the Vp model seems to be slightly better resolved and lesssmeared as indicated by the smaller spread values of Vp and more fo-cused contour lines. At 0 km depth (Fig. 8a), the spread function is
98.8˚ 99˚ 99.2˚
1.6˚
1.8˚
2˚
2.2˚
P−wave
Ref
−0.1−0.2−0.3−0.4 0.0 0.1 0.2 0.3 0.4
station corrections (sec)
(a)
Fig. 5. Station corrections (a) for P-waves and (b) for S-waves. The blue and the red circles rewith the magnitude of the correction. The white dot indicates the reference station.
found patchy and smaller at the nodes close to stations because therays tend to concentrate there. We found the horizontal smearing isrelatively small compared to the vertical ones. At 2 km depth anddeeper (Fig. 8b–c), the model is resolved better but further south(Sarulla region) the model is resolved mainly along the fault whichis in accordance with the distribution of stations and the events.Around Tarutung, the model is good resolved within 12 km distancesto the left and to the right from the Sumatran fault line.
Fig. 9 shows the vertical spread values of Vp and Vp/Vs including themodel resolution matrix along various cross-sections perpendicular to
98.8˚ 99˚ 99.2˚
S−wave
Ref
−0.2−0.3−0.5−0.7 0.0 0.2 0.3 0.5 0.7
station corrections (sec)
(b)
present positive and negative station corrections, respectively. The circle size correlates

Station
Earthquakes
98.8°
2.2°
2.1°
2°
1.9°
1.8°
1.7°
98.9° 99° 99.1° 99.2°
a
b
0
4
8
Dep
th (
km)
Distance (km)
12
16-24 -20 -16 -12 -8 -4 0 4 8 12 16 20
Fig. 6. (a) The 3 × 3 km horizontal and (b) the 2 km vertical grid design used in theinversion. The stations (blue triangles) are connected to the hypocenters (whitecircles) by the gray ray paths.
0.021
0.022
0.023
0.024
0.025
0.026
0.027
0.028
0.029
0.030
data
var
ianc
e (s
2 )da
ta v
aria
nce
(s2 )
Trade−off curvefor Vp
a251020
3550
70
100
200
300
700
20
0.020
0.022
0.024
0.026
0.028
0.030
0.032
0.034
0.002 0.004 0.006 0.008
0.00000 0.00025 0.00050 0.00075
model variance (km2/s2)
model variance (km2/s2)
Trade−off curvefor Vp/Vs
b0520
5070
100
200
500
5000
20
Fig. 7. Trade off curve for (a) Vp and (b) Vp/Vs to determine optimal damping values.The damping values are chosen with 20 for both Vp and Vp/Vs as indicated by boldcharacter.
32 U. Muksin et al. / Journal of Volcanology and Geothermal Research 260 (2013) 27–42
the fault as indicated in Fig. 8. The model is resolved at depths between0 km and 10 km,wheremore smearing occurs in the Vp/Vsmodel thanin the Vpmodel, especially in regions far from the fault line. The verticalspread values are generally below 3.0 and correlate with the high den-sity of the rays. Due to the localization of the events and the stationsalong the Sarulla graben, above 3 km depth the model is only resolvedalong the fault as imaged along the cross-section D (Fig. 9d). In theTarutung region, the model is well resolved around 12 km to the leftor to the right of the fault and from 1 to 12 km in depth as indicated bythe small spread values and small smearing effect along the cross-sections A, B, and C (Fig. 9a–c).
5.2. Recovery tests
In order to investigatewhich kind of anomalies could be reconstructedwith our network geometry we carried out recovery tests for two differ-ent types of models: (1) checkerboard anomaly patterns and (2) modelswith characteristic features abstracted from our inversion results. For thefirst class of tests, the backgroundmodel is perturbed by anomalies alter-natingwith±15% against the backgroundVp andVp/Vs, respectively. Forthe synthetic tests, we also re-determined the damping values for Vp andVp/Vs and obtained almost identical values of damping to the real inver-sion. The perturbations of ±15% are in agreement with our case study,
where at shallow depth our Vp model range is 3.00–4.03 km/s whileour Vp/Vs model range is 1.43–1.93. We produced two different typesof checkerboards which contains 12 nodes and 8 nodes in each positiveand negative anomaly. Positive and negative anomalies are indicated byred and blue colors, respectively. Fig. 10 shows the horizontal view ofthe checkerboard of the Vp and Vp/Vs models at 2 km depth. The Vpand Vp/Vs models for the checkerboard containing 12 nodes in oneanomaly are shown in Fig. 10a and b while Fig. 10c and d shows thosefor the checkerboard containing 8 nodes in a checker block.
Gaussian noise is added to the calculated travel times of P and S–Pwith the standard deviation of ±0.1 s in accordance with the uncer-tainty of our manual picking. The inversion is then conducted for boththe Vp and the Vp/Vs with damping factors of 20 for both Vp and Vp/Vs as obtained from the trade-off curve analysis (Fig. 7) and as alsoused for the real inversion. In the area containing sufficient crossingrays, the checkerboard is well resolved both for Vp (Fig. 10a andc) and for Vp/Vs (Fig. 10b and d). The deeper part of the checkerboardpattern is better resolved but at shallow depth, the checkerboard isreproduced well in the area close to the Sumatran fault since the

98.8˚ 98.9˚ 99˚ 99.1˚ 99.2˚
1.7˚
1.8˚
1.9˚
2˚
2.1˚
2.2˚0.0 km
A
B
C
D
0 1 2 3 4 5Spread of Vp
98.8˚ 98.9˚ 99˚ 99.1˚ 99.2˚
1.7˚
1.8˚
1.9˚
2˚
2.1˚
2.2˚2.0 km
A
B
C
D
0 1 2 3 4 5Spread of Vp
98.8˚ 98.9˚ 99˚ 99.1˚ 99.2˚
1.7˚
1.8˚
1.9˚
2˚
2.1˚
2.2˚4.0 km
A
B
C
D
0 1 2 3 4 5Spread of Vp
98.8˚ 98.9˚ 99˚ 99.1˚ 99.2˚
1.7˚
1.8˚
1.9˚
2˚
2.1˚
2.2˚0.0 km
A
B
C
D
0 1 2 3 4 5Spread of Vp/Vs
98.8˚ 98.9˚ 99˚ 99.1˚ 99.2˚
1.7˚
1.8˚
1.9˚
2˚
2.1˚
2.2˚2.0 km
A
B
C
D
0 1 2 3 4 5Spread of Vp/Vs
98.8˚ 98.9˚ 99˚ 99.1˚ 99.2˚
1.7˚
1.8˚
1.9˚
2˚
2.1˚
2.2˚4.0 km
A
B
C
D
0 1 2 3 4 5Spread of Vp/Vs
a b c
d e f
Fig. 8. The horizontal layers of the spread values of themodel at depth of 0, 2, and 6 km for Vp in (a), (b), and (c) and for Vp/Vs in (d), (e), and (f). The triangles represent the stations. Thecross-sections A–D are related to the vertical spread values shown in Fig. 9. The red contour lines represent model resolution matrix.
33U. Muksin et al. / Journal of Volcanology and Geothermal Research 260 (2013) 27–42
earthquakes are concentrated along the fault particularly in theSarulla region.
The checkerboard is also well reproduced in the vertical directionfor both the Vp and Vp/Vs models as shown in Fig. 11. For the largerchecker blocks, the vertical structure along the cross-sections A1and B1 for Vp models are shown in Fig. 11a–b and for Vp/Vs modelsare shown in Fig. 11c–d. The vertical recovery of the checkerboardfor smaller size of anomalies are shown in Fig. 11e–f for Vp, and inFig. 11g–h for Vp/Vs. The vertical structure of the Vp model isreproduced slightly better than the Vp/Vs as the spread values of Vpis smaller than those of Vp/Vs. The anomalies for both the Vp andVp/Vs model are resolved at depths above 10 km. In Tarutung,along the cross-section A1 (Fig. 11a, b, e, f) the checkerboards arereproduced well for both the Vp and Vp/Vs for the larger and smallerblocks due to the concentration of the rays within the area. Along thecross-sections A1 (Fig. 11a,b,e,f), the shallow part of the checkerboardis resolved around 10 km to the left and to the right of the fault linewhich is consistent with the spread values. In the Sarulla region, thecheckerboard above 4 km depth is recovered along the Sumatranfault as represented by the structure along the cross-section B1(Fig. 11c, d, g, and h).
The Vp checkerboard anomalies along the fault in Tarutung alongthe cross-sections A1 (Fig. 11a and e) at depth between 2 and 8 kmcould be recovered with errors of +−5%. Recovery errors at
shallower depth are within the range of +−15%. At greater distancesfrom the fault, recovery errors are in the range of +−7% for Vp. TheVp/Vs checkerboard anomalies could be recovered with errors of upto +−10%.
We also designed a synthetic model abstracted from the results ofthe real data inversion as shown in Fig. 12 (lateral structure) andFig. 13 (vertical structure). Anomalies of ±15% against the back-ground Vp and Vp/Vs model were incorporated similar in shape tothe real data inversion results. We assumed a low Vp structurealong the Sumatran fault (Fig. 13a–c) associated with the grabenand basins filled by unconsolidated material. We also included ananomaly with reduced velocities in the northeast of Tarutung alongthe cross-section A and in the southwest of Tarutung along thecross-section B (Fig. 13a–c). Positive anomalies in Vp/Vs valueswere assumed in the northeast of Tarutung and along the Sarullabasin (Fig. 13d–f) based on the real data inversion results.
The inversion of the abstracted model was carried out identical tothe checkerboard test and the real data. In general, all anomalies arereproduced well both in horizontal and vertical directions. The anom-alies are recovered by the average of 96% in the Tarutung area and93% in the Sarulla area. The low Vp structure along the fault(Fig. 12a–c) is recovered within the network region which meansthe low Vp structure might be longer further northwest and south-east but could not be imaged due to the lack of the ray paths. The

0
4
8
12
Dep
th (
km)
−18 −15 −12 −9 −6 −3 0 3 6 9 12 15 18
Distance (km)
a
A
0 1 2 3 4 5Spread of Vp
0
4
8
12
Dep
th (
km)
−18 −15 −12 −9 −6 −3 0 3 6 9 12 15 18
Distance (km)
e
A
0 1 2 3 4 5Spread of Vp/Vs
0
4
8
12
Dep
th (
km)
−18 −15 −12 −9 −6 −3 0 3 6 9 12 15 18
Distance (km)
b
B
0 1 2 3 4 5Spread of Vp
0
4
8
12
Dep
th (
km)
−18 −15 −12 −9 −6 −3 0 3 6 9 12 15 18
Distance (km)
f
B
0 1 2 3 4 5Spread of Vp/Vs
0
4
8
12
Dep
th (
km)
−18 −15 −12 −9 −6 −3 0 3 6 9 12 15 18
Distance (km)
c
C
0 1 2 3 4 5Spread of Vp
0
4
8
12
Dep
th (
km)
−18 −15 −12 −9 −6 −3 0 3 6 9 12 15 18
Distance (km)
g
C
0 1 2 3 4 5Spread of Vp/Vs
0
4
8
12
Dep
th (
km)
−18 −15 −12 −9 −6 −3 0 3 6 9 12 15 18
Distance (km)
d
D
0 1 2 3 4 5Spread of Vp
0
4
8
12
Dep
th (
km)
−18 −15 −12 −9 −6 −3 0 3 6 9 12 15 18
Distance (km)
h
D
0 1 2 3 4 5Spread of Vp/Vs
Fig. 9. Vertical spread values for the Vp model along the cross-sections A–D in (a)–(d), and for the Vp/Vs model along the cross-sections A–D in (e)–(h). The cross-sections are takenperpendicular to the Sumatran fault shown in Fig. 8. The red contour lines represent model resolution matrix.
34 U. Muksin et al. / Journal of Volcanology and Geothermal Research 260 (2013) 27–42
shallow part of the northeastern structure along the cross-section Aappears patchy both in Vp and Vp/Vs because of the moderate spreadvalues near 99.2° E, 2.1° N. The high Vp/Vs anomaly in the northeastof Tarutung is resolved with moderate smearing. The high Vp/Vsanomaly in the Sarulla region is well resolved, with some degradationin recovery quality at shallow depth.
Comparison of the regions of good recovery of the synthetic struc-tures and the distribution of the spread value suggests that nodeswith spread values larger than 2 can be considered as well resolved,
and spread values between 2.0 and 3.0 are considered to be resolvedbut with moderate smearing. Well resolved regions include: (1) InTarutung from cross-sections A to C around 10 km to the left and tothe right of the Sumatran fault. However, moderate smearing is pres-ent at shallow depth (0 km), (2) Along the Sarulla basin at depthfrom 2 km. In our anomalies presentation, we only show the well re-solved regions with spread values below 3 areas while the areas withless resolution are excluded (clipped). Regions with larger spreadvalues are clipped. In conclusion, we think that in the well resolved

98.8˚ 98.9˚ 99˚ 99.1˚ 99.2˚
1.7˚
1.8˚
1.9˚
2˚
2.1˚
2.2˚2.0 km
a
−0.14 −0.07 0.00 0.07 0.14Δvp(%)
A1
B1
98.8˚ 98.9˚ 99˚ 99.1˚ 99.2˚
1.7˚
1.8˚
1.9˚
2˚
2.1˚
2.2˚2.0 km
b
−0.14 −0.07 0.00 0.07 0.14Δvp/vs (%)
A1
B1
98.8˚ 98.9˚ 99˚ 99.1˚ 99.2˚
1.7˚
1.8˚
1.9˚
2˚
2.1˚
2.2˚2.0 km
c
−0.14 −0.07 0.00 0.07 0.14Δvp(%)
A2
B2
98.8˚ 98.9˚ 99˚ 99.1˚ 99.2˚
1.7˚
1.8˚
1.9˚
2˚
2.1˚
2.2˚2.0 km
d
−0.14 −0.07 0.00 0.07 0.14Δvp/vs (%)
A2
B2
Fig. 10. The map view of the checkerboard recovery at depth of 2 km for the model containing 12 nodes in each anomaly for (a) Vp and (b) Vp/Vs. The recovery of the checkerboardcontaining 8 nodes in an anomaly for (c) Vp and (d) Vp/Vs. The cross-sections A1 and B1 are related to the vertical model sections described in Fig. 11a–d and the cross-sections A2and B2 are related to Fig. 11e–h. The red and blue contour lines represent the high and low velocity anomalies.
35U. Muksin et al. / Journal of Volcanology and Geothermal Research 260 (2013) 27–42
regions (as defined above) the uncertainty of the absolute velocities isin the order of +−7% for Vp and better than +−10% for Vp/Vs.
6. Results and discussion
The resulting Vp and Vp/Vs models together with the distributionof local earthquakes provide detailed insights into the structure of theSumatran fault system, the geometry of the sedimentary basinsevolving in the study area along the fault, and the interplay betweenthe geological structure and the geothermal system to be explored. Wediscuss the results from the perspective of each parameter (seismicity,Vp and Vp/Vs), followed by an integration of the different resultssummarized in a conceptual model for the study area.
6.1. Seismicity distribution
The distribution of the local earthquakes is in accordance with thegeometry of the Sumatran fault as shown in Fig. 6 and is concentrated
in the range between 2 km and 11 km depth. The broader distribu-tion of earthquakes around Tarutung indicates the complexity of thefault system within the Tarutung pull-apart basin (see also Fig. 15a).To the south, the seismicity is strongly focused on the resemblingshape of the Sumatran fault. Along the Sarulla region (the southern-most region), the earthquake distribution is an indication for a nar-row and very steep fault (almost vertical, Fig. 15d and h) suggestingthat there is no vertical segmentation of the fault in this region. Sim-ilar results with a narrow steep fault around Sarulla were obtained byWeller et al. (2012). A recent large earthquake occurred within thisfault segment. Noteworthy we excluded a large number of events inthe Sarulla region because of a gap angle larger than 180° in orderto keep the high accuracy of the hypocenters.
6.2. Vp structure
The new results are in agreement with previous tomographic in-vestigations (Koulakov et al., 2009) but provide more detailed

0
4
8
12
Dep
th (
km)
−16 −12 −8 −4 0 4 8 12 16Distance (km)
A1
a
−0.14 −0.07 0.00 0.07 0.14Δvp(%)
0
4
8
12
Dep
th (
km)
−16 −12 −8 −4 0 4 8 12 16Distance (km)
B1
b
−0.14 −0.07 0.00 0.07 0.14Δvp(%)
0
4
8
12
Dep
th (
km)
−16 −12 −8 −4 0 4 8 12 16Distance (km)
A1
c
−0.14 −0.07 0.00 0.07 0.14Δvp/vs (%)
0
4
8
12
Dep
th (
km)
−16 −12 −8 −4 0 4 8 12 16Distance (km)
B1
d
−0.14 −0.07 0.00 0.07 0.14Δvp/vs (%)
0
4
8
12
Dep
th (
km)
−16 −12 −8 −4 0 4 8 12 16Distance (km)
A2
e
−0.14 −0.07 0.00 0.07 0.14Δvp(%)
0
4
8
12
Dep
th (
km)
−16 −12 −8 −4 0 4 8 12 16Distance (km)
B2
f
−0.14 −0.07 0.00 0.07 0.14Δvp(%)
0
4
8
12
Dep
th (
km)
−16 −12 −8 −4 0 4 8 12 16Distance (km)
A2
g
−0.14 −0.07 0.00 0.07 0.14Δvp/vs (%)
0
4
8
12
Dep
th (
km)
−16 −12 −8 −4 0 4 8 12 16Distance (km)
B2
h
−0.14 −0.07 0.00 0.07 0.14Δvp/vs (%)
Fig. 11. Cross-sections of recovered checkerboard models using different pattern size. Model with 12 nodes per anomaly recovered along (a,c) transect A1, and along (b,d) transectB1. Model with 8 nodes per anomaly recovered along (e,g) transect A2, and along (f,h) transect B2. The cross-sections are taken perpendicular to the Sumatran fault as shown inFig. 10. The red and blue contour lines represent the high and low velocity anomalies.
36 U. Muksin et al. / Journal of Volcanology and Geothermal Research 260 (2013) 27–42
insights into the local Vp structure based on the denser network usedin our recent study. Comparing the larger scale features of our studywith the Vp images of Koulakov et al. (2009), both investigations re-veal low velocity regions at shallow depth along the Sumatran fault.
In more detail, we found relatively low Vp values (around 3 km/s)at shallow regions above 2 km depth (Figs. 15 and 16). This low Vp atshallow depth reflects the presence of quaternary and Holocene sed-iments covering the Tarutung and the Sarulla region as also found inother regions along the Sumatran fault (McCarthy and Elders, 1997).More prominent low Vp zones are found along the Sumatran fault as-sociated with the least consolidated sediment fillings within theTarutung and the Sarulla basins. At depth of 2 km, the pattern of
the low velocity zone (Fig. 15a) coincides with the shape of theTarutung and the Sarulla basins. The synthetic tests have shownthat the given low Vp zone along the fault in the area between thecross-sections B and C is well resolved (Fig. 12b). Therefore, we con-clude that the basin along the fault narrows or even vanishes in thearea between 1.93° N, 99.1° E to 1.98° N, 98.99° E (Fig. 14b) indicatingthat the Tarutung and the Sarulla basins are not connected and havedifferent settings.
The depth of both, the Tarutung and the Sarulla basins is expectedat around 2 km as shown by the contour lines of the low Vp of thevertical structure below the fault line along the cross-sections A–Din Fig. 15a–d. An abrupt change in the Vp structure (~4 km/s) at

98.8˚ 98.9˚ 99˚ 99.1˚ 99.2˚
1.7˚
1.8˚
1.9˚
2˚
2.1˚
2.2˚0.0 km
a
−0.14 −0.07 0.00 0.07 0.14Δvp(%)
A
B
C
D
98.8˚ 98.9˚ 99˚ 99.1˚ 99.2˚
1.7˚
1.8˚
1.9˚
2˚
2.1˚
2.2˚2.0 km
b
−0.14 −0.07 0.00 0.07 0.14Δvp(%)
A
B
C
D
98.8˚ 98.9˚ 99˚ 99.1˚ 99.2˚
1.7˚
1.8˚
1.9˚
2˚
2.1˚
2.2˚4.0 km
c
−0.14 −0.07 0.00 0.07 0.14Δvp(%)
A
B
C
D
98.8˚ 98.9˚ 99˚ 99.1˚ 99.2˚
1.7˚
1.8˚
1.9˚
2˚
2.1˚
2.2˚0.0 km
d
−0.14 −0.07 0.00 0.07 0.14Δvp/vs(%)
A
B
C
D
98.8˚ 98.9˚ 99˚ 99.1˚ 99.2˚
1.7˚
1.8˚
1.9˚
2˚
2.1˚
2.2˚2.0 km
e
−0.14 −0.07 0.00 0.07 0.14Δvp/vs(%)
A
B
C
D
98.8˚ 98.9˚ 99˚ 99.1˚ 99.2˚
1.7˚
1.8˚
1.9˚
2˚
2.1˚
2.2˚4.0 km
f
−0.14 −0.07 0.00 0.07 0.14Δvp/vs(%)
A
B
C
D
Fig. 12. Horizontal slices of the recovered synthetic models at 0, 2, and 6 km depth for Vp in (a), (b), and (c), and for Vp/Vs in (d), (e), and (f). The cross-sections A–D are related tothe vertical model described in Fig. 13. The red and blue contour lines represent the high and low velocity anomalies of the studied synthetic model.
37U. Muksin et al. / Journal of Volcanology and Geothermal Research 260 (2013) 27–42
around 4 km depth (Fig. 14c) represents the discontinuity of theuppermost layer of the structure as also indicated by the images ofthe vertical structure in Fig. 15.
6.3. Vp/Vs structure
The basins imaged by low Vp values (around 3 km/s) show dis-tinct characteristics in the Vp/Vs model. While the northern part ofthe Sarulla graben exhibits high Vp/Vs values (~1.8), the Tarutungbasin is characterized by relatively lower Vp/Vs values (1.6). Thiskind of distinguishing is not only seen in the tomographic inversionresults but also in the input travel time data. In order to test the ro-bustness of this feature, we analyzed P and S–P travel times of sta-tions and local events selected separately from the Tarutung andSarulla basins which confirmed the difference of both basins asshown by the Vp/Vs average values in the Wadati diagram in Fig. 16.Typically, porous sedimentary rocks are characterized by higher Vp/Vsvalues. The increase ofVp/Vswith increasingfluid content is in agreementwith the Gassmann theory developed for porous media (Gassmann,1951). If such behavior can be taken as a general rule for sediments, wehave to assume special geological conditions within the Tarutung basinwhich are responsible for the lower Vp/Vs values in this region.
Apart from the Tarutung basin and the Sarulla graben, we observedominantly low Vp/Vs values (~1.6) west and both high and low Vp/Vsvalues east of the Sumatran fault. The lower Vp/Vs values (~1.6) in the
western region could be associated with higher contents of quartz in gra-nitic or andesitic rocks, because quartz is characterized by very lowVp/Vsvalues (Christensen, 1996). Indeed geological maps indicate the occur-rence of granitic rocks in this area (Nukman and Moeck, submitted forpublication). On the eastern side of the main fault the Vp/Vs distributionappears more complex. As a first order feature, however, higher Vp/Vsvalues (1.75–1.8) are found in the northwestern region close to theTarutung basin where also lower Vp values (3 km/s) were imaged. Thiscould be an indication for sedimentary rocks influenced by the presenceof fluids. Our results are in agreement with Koulakov et al. (2009) whoimaged within their coarser tomographic grid a similar high Vp/Vsanomaly at shallow depth east of the Sumatran fault within theTarutung region.
6.4. Joint interpretation of Vp and Vp/Vs for Tarutung and Sarulla
Motivated by the previously mentioned arguments rising from thejoint consideration of Vp and Vp/Vs we applied quantitative joint inter-pretation techniques to study the Vp and Vp/Vs signatures of theTarutung and the Sarulla basins. The combined consideration of Vp andVp/Vs in corresponding cross-plots is a well-established approach forthe lithological interpretation of seismic velocity models (e.g. Holbrooket al., 1992). Distinct rock types can be identified in such cross-plots byapplication of statistical cluster analysis techniques (e.g. Bauer et al.,2003; Stankiewicz et al., 2010a, 2010b; Ryberg et al., 2012). Here we

0
4
8
12
Dep
th (
km)
−16 −12 −8 −4 0 4 8 12 16Distance (km)
−0.14 −0.07 0.00 0.07 0.14Δvp(%)
A
a
0
4
8
12
Dep
th (
km)
−16 −12 −8 −4 0 4 8 12 16Distance (km)
−0.14 −0.07 0.00 0.07 0.14Δvp/vs(%)
A
e
0
4
8
12
Dep
th (
km)
−16 −12 −8 −4 0 4 8 12 16Distance (km)
−0.14 −0.07 0.00 0.07 0.14Δvp(%)
B
b
0
4
8
12
Dep
th (
km)
−16 −12 −8 −4 0 4 8 12 16Distance (km)
−0.14 −0.07 0.00 0.07 0.14Δvp/vs(%)
B
f
0
4
8
12
Dep
th (
km)
−16 −12 −8 −4 0 4 8 12 16Distance (km)
−0.14 −0.07 0.00 0.07 0.14Δvp(%)
C
c
0
4
8
12
Dep
th (
km)
−16 −12 −8 −4 0 4 8 12 16Distance (km)
−0.14 −0.07 0.00 0.07 0.14Δvp/vs(%)
C
g
0
4
8
12
Dep
th (
km)
−16 −12 −8 −4 0 4 8 12 16Distance (km)
−0.14 −0.07 0.00 0.07 0.14Δvp(%)
D
d
0
4
8
12
Dep
th (
km)
−16 −12 −8 −4 0 4 8 12 16Distance (km)
−0.14 −0.07 0.00 0.07 0.14Δvp/vs(%)
D
h
Fig. 13. The vertical resolved synthetic model of the Vp along the cross-sections A–D in (a)–(d) and of the Vp/Vs along the cross-sections A–D in (e)–(h). The cross-sections aretaken perpendicular to the Sumatran fault shown in Fig. 12. The red and blue contour lines represent the high and low velocity anomalies.
38 U. Muksin et al. / Journal of Volcanology and Geothermal Research 260 (2013) 27–42
make use of alternative clustering techniques which belong to the neu-ral network pattern recognition and classification methods, called self-organizing maps (Kohonen, 2001). We applied a self-organizing mapwork flow developed by Bauer et al. (2008, 2012) which includes prep-aration and normalization of data vectors, unsupervised learning, iden-tification of clusters by usage of image processing techniques, andapplication of the learned knowledge to classify rock types.More detailsof this method can be found in Bauer et al. (2012).
We applied the neural network clustering to the tomographic Vp andVp/Vs images with particular focus on the regions with relatively low Pvelocities in order to highlight the characteristics of the Tarutung andSarulla basins (Fig. 17). Two clusters were found which show a similarVp range but differences in Vp/Vs (Fig. 17a). Plotting the members ofeach cluster with regard to the geographic coordinates reveals that the
cluster with lower Vp/Vs (brown colors in Fig. 17) corresponds to theTarutung basin, and the cluster with higher Vp/Vs (pink colors inFig. 17) is imaged within the Sarulla graben and northeast of theTarutung basin. In our interpretation we assume that dry sedimentswithin the Tarutung basin are responsible for the lower Vp/Vs clusterwhile the higher Vp/Vs cluster is associated with the presence of fluidsand fracturing both reducing Vs stronger than Vp and, hence, increasingVp/Vs. In order to explain theses systematic differences we suggest con-ceptual models for Tarutung and Sarulla as described in the following.
6.5. Conceptual models for Tarutung and Sarulla
Based on differences in the seismicity distribution, the Vp and Vp/Vsstructure, and geological and tectonic information known from Tarutung

3.2
3.2
3.4
3.4
3.4
98.8˚ 98.9˚ 99˚ 99.1˚ 99.2˚
1.7˚
1.8˚
1.9˚
2˚
2.1˚
2.2˚
0.0 km
stationshotsprings
Vp (km/s)
Martimbang V.
Imun V.
PgSi
Ht
Pg=PanabunganSi=SipoholonHt=Hutabarat
3.0 3.5 4.0 4.5 5.0 5.5 6.0 6.5
A
B
C
D
3
3.2
3.2
3.2
3.4
3.4
3.6
3.6
3.6
3.63.8
98.8˚ 98.9˚ 99˚ 99.1˚ 99.2˚
1.7˚
1.8˚
1.9˚
2˚
2.1˚
2.2˚
2.0 km
stationshotsprings
Vp (km/s)
Martimbang V.
Imun V.
PgSi
Ht
Pg=PanabunganSi=SipoholonHt=Hutabarat
3.0 3.5 4.0 4.5 5.0 5.5 6.0 6.5
A
B
C
D
4.4
4.4
4.6
4.6
4.6
4.6
4.8
4.8
5
5
5
5
5
5
5
5.2
5.2
5.2
5.2
5.4
5.6
5.6
5.8
5.8
98.8˚ 98.9˚ 99˚ 99.1˚ 99.2˚
1.7˚
1.8˚
1.9˚
2˚
2.1˚
2.2˚
4.0 km
stationshotsprings
Vp (km/s)
Martimbang V.
Imun V.
PgSi
Ht
Pg=PanabunganSi=SipoholonHt=Hutabarat
3.0 3.5 4.0 4.5 5.0 5.5 6.0 6.5
A
B
C
D
1.6
1.6
1.6 1.6
98.8˚ 98.9˚ 99˚ 99.1˚ 99.2˚
1.7˚
1.8˚
1.9˚
2˚
2.1˚
2.2˚
0.0 km
stationshotsprings
Vp/Vs
Martimbang V.
Imun V.
PgSi
Ht
Pg=PanabunganSi=SipoholonHt=Hutabarat
1.47 1.54 1.61 1.68 1.75 1.82 1.89
A
B
C
D
1.61.
6
1.6
1.71.7
1.8
98.8˚ 98.9˚ 99˚ 99.1˚ 99.2˚
1.7˚
1.8˚
1.9˚
2˚
2.1˚
2.2˚
2.0 km
stationshotsprings
Vp/Vs
Martimbang V.
Imun V.
PgSi
Ht
Pg=PanabunganSi=SipoholonHt=Hutabarat
1.47 1.54 1.61 1.68 1.75 1.82 1.89
A
B
C
D
1.6
1.6
1.6
1.7
1.7
1.7
1.7
1.8
98.8˚ 98.9˚ 99˚ 99.1˚ 99.2˚
1.7˚
1.8˚
1.9˚
2˚
2.1˚
2.2˚
4.0 km
stationshotsprings
Vp/Vs
Martimbang V.
Imun V.
PgSi
Ht
Pg=PanabunganSi=SipoholonHt=Hutabarat
1.47 1.54 1.61 1.68 1.75 1.82 1.89
A
B
C
D
Fig. 14. Horizontal slices of the models at depth of 0, 2, and 6 km for Vp in (a), (b), and (c), and for Vp/Vs in (d), (e), and (f). The cross-sections A–D are related to the vertical modeldescribed in Fig. 15.
39U. Muksin et al. / Journal of Volcanology and Geothermal Research 260 (2013) 27–42
and Sarulla, we developed conceptual models for both regions with geo-thermal potential as shown in Figs. 18 and 19, respectively.
The model for Tarutung covers the upper 12 km and consists ofthree layers interrupted by the Tarutung basin in the center of themodel (Fig. 18). The subdivision into three layers is mainly based onthe Vp structure (Fig. 15a–d), with P velocities of 3–4 km/s in theupper layer, 4–5 km/s in the middle layer, and 5–6 km/s in the lowerlayer. We assume that this increase of P velocity with increasingdepth is related with the reduction of porosity and also with petrologicdifferentiation of mainly volcanic rocks. The Tarutung basin in the cen-tral part of themodel is characterized by the lowest P velocities indicat-ing unconsolidated sedimentary rocks and young Toba tuff (Hickman etal., 2004) depositedwithin the pull-apart basin. To explain the lowVp/Vsvalues within the basin we suggest that these sediments are lackingsignificant amounts of fluids within the pore space. Such an interpreta-tion is also supported by the modeling of low Vp and low Vp/Vs anom-alies in porous volcanic rocks described by Husen et al. (2004). Instead,we assume that hot fluids are transported from greater depth along thedeeper Sumatran fault zone into the shallow regions just northeastof the Tarutung basin using more permeable fluid pathways, also inagreement with the higher Vp/Vs values imaged within this part ofthe model. A possible tectonic explanation for such a fluid flow modelcould be that releasing right step-overs along right-lateral fault systems,as the Tarutung pull-apart basin, are relatedwith extensional quadrants(Bellier and Sébrier, 1994), in our case northeast of the Tarutung basin.
This is exactly the region where we observe the cluster of high Vp/Vs(pink colors in Fig. 17b), which we interpret as fluid bearing sedimentswith fracturing. Dilatational elements were also found by the struc-tural geology investigations of Nukman and Moeck (submitted forpublication) in this region. This interpretation is also supported bythe occurrence of the big hot springs of Panabungan, Hutabarat,and Siriaria located northeast of the Tarutung basin.
The model along the Sarulla basin also consists of three mainlayers forming the background structure for the shallow graben locat-ed in the center (Fig. 19). Again we assume porosity changes and pet-rologic differentiation of mainly abundant volcanic rocks responsiblefor the vertical structuring of the background model. The Sarulla gra-ben appears to reflect a simpler fault structure compared with themore complex Tarutung pull-apart basin. The Sarulla graben hasbeen formed by the extension nearly perpendicular to the strike ofthe weak wrench fault (Hickman et al., 2004). A shallow zone oflow Vp is directly linked with the rather narrow, vertically orienteddistribution of earthquakes at greater depth, also in agreement withseismicity investigations of Weller et al. (2012). High Vp/Vs valuesare imaged both at the shallow parts of the graben and at greaterseismogenic depths. We conclude that fluid flow occurs along theentire fault system transporting heat from greater depth to the surface.This interpretation is also expressed in the description of the pinkcolored cluster in Fig. 17a as fluid bearing sediments with fracturingimaged along the Sarulla graben in Fig. 17b.

3.25
3.5
3.754
4.254.5
4.755
5.255.5
5.75
6
6
6.25
6.25
0
3
6
9
12
−18 −12 −6 0 6 12 18
Distance (km)
A
a
Vp (km/s)
3.2 4.0 4.8 5.6 6.4Basin bound. Seismicity
1.65 1.65
1.7
1.75
1.75
1.8
0
3
6
9
12
−18 −12 −6 0 6 12 18
Distance (km)
A
e
Vp/Vs
1.5 1.6 1.7 1.8 1.9Basin bound. Seismicity
3.25
3.754
4.254.54.75
55.25
5.5
5.5
5.75
6
6.25
6.25
0
3
6
9
12
−18 −12 −6 0 6 12 18
Distance (km)
B
b
Vp (km/s)
3.2 4.0 4.8 5.6 6.4Basin bound. Seismicity
1.55
1.6
1.6
1.65
1.65
1.7
1.7
0
3
6
9
12
−18 −12 −6 0 6 12 18
Distance (km)
B
f
Vp/Vs
1.5 1.6 1.7 1.8 1.9Basin bound. Seismicity
3.5
3.7544.254.54.755
5.255.55.75
6
6.25
0
3
6
9
12
−18 −12 −6 0 6 12 18
Distance (km)
C
c
Vp (km/s)
3.2 4.0 4.8 5.6 6.4Basin bound. Seismicity
1.55
1.6
1.6
1.65 1.65
1.65
1.7
1.75
0
3
6
9
12
−18 −12 −6 0 6 12 18
Distance (km)
C
g
Vp/Vs
1.5 1.6 1.7 1.8 1.9Basin bound. Seismicity
4.254.54.75
55.255.5
5.75
0
3
6
9
12
−18 −12 −6 0 6 12 18
Distance (km)
D
d
Vp (km/s)
3.2 4.0 4.8 5.6 6.4Basin bound. Seismicity
1.65 1.65
1.65
1.8
0
3
6
9
12
−18 −12 −6 0 6 12 18
Distance (km)
D
h
Vp/Vs
1.5 1.6 1.7 1.8 1.9Basin bound. Seismicity
Fig. 15. The vertical seismic structure for Vp along the cross-sections A–D in (a)–(d) and of for Vp/Vs along the cross-sections A–D in (e)–(h). The cross-sections are taken perpendicular tothe Sumatran fault shown in Fig. 14.
40 U. Muksin et al. / Journal of Volcanology and Geothermal Research 260 (2013) 27–42
For both models (Figs. 18 and 19) the heat source is assumed to belocated at much greater depth related with magmatic activities trig-gered by the subduction process, and the heat is transported alongthe permeable Sumatran fault to the shallow regions of the Tarutungand Sarulla basins. We assume that the high permeability is relatedwith a wider damage zone and fractured regions developing duringstrike slip tectonics around a temporary impermeable gauge zone.
7. Conclusions
Seismological measurements for tomographic investigations using adense network were conducted for geothermal exploration at a scalebetween micro and local seismicity which is new for Indonesia to ourknowledge. High quality data could be collected and allowed us to re-solve detailed features of Vp and Vp/Vs around the Tarutung basin
and Sarulla graben. We found systematic differences between both ba-sins evolving along the Sumatran fault. Tarutung is a pull-apart basinformed by a releasing step-over (Bellier and Sébrier, 1994). As a conse-quence, the region northeast of Tarutung is influenced by a dominantlydilatational stress regime (Nukman and Moeck, submitted forpublication) which in our interpretation supports focussing of fluidtransport from greater depth into this area. High fluid content and frac-turing in this part of the Tarutung region is reflected by high Vp/Vsvalues in the tomography model. Along the Sarulla graben we imageda less complex fault structure which shows high Vp/Vs values within anarrow fault zone both at greater depth and also in the shallow partabove the near-vertical seismogenic region. We infer that fluids andheat are transported along the permeable Sumatran fault within thisnarrow structure directly to the surface. Similar observations of local-ized high Vp/Vs anomalies and their interpretation as fluid-rich regions

0.0
0.4
0.8
1.2
1.6
2.0
2.4
2.8S
−P
Tra
velti
mes
(s)
0.0 0.8 1.6 2.4 3.2
P Traveltimes (s)
Vp/Vs S
arulla
= 1.
84
Vp/Vs T
arutu
ng = 1.
64
Fig. 16. The Wadati diagrams derived from data recorded by the stations along theSarulla basin (Vp/Vs = 1.84, red line and dots) and by the stations along the Tarutungbasin (Vp/Vs = 1.64, blue line and dots).
Fig. 18. Conceptual model for the Tarutung basin based on the seismicity distribution,Vp and Vp/Vs structure derived by the tomography analysis containing three mainlayers. The hot fluid originated from below the fault and transported to the northeastaround the three big hotsprings.
41U. Muksin et al. / Journal of Volcanology and Geothermal Research 260 (2013) 27–42
were also reported from the San Andreas fault system (e.g. Thurber et al.(1997). As a main result of our study we conclude that high Vp/Vs re-gions can be imaged at high resolution and that they potentially indicateregions of high fluid content and fracturing as one possible explanation.In combination with other methods, such as magnetotellurics and struc-tural geology, this canbe used to constrain potential areas for geothermalexploitation.
Future steps to be applied to our high quality data set will includehigh resolution studies of seismicity including fault plane solution, at-tenuation tomography, and ambient noise analysis. The results will
Fig. 17. Results of a cluster analysis of Vp and Vp/Vs values derived for the sedimentary partwith characteristic Vp and Vp/Vs were identified. (b) Geographic distribution of the cluster
then allow us to further constrain the conceptual models developedin this paper.
Acknowledgments
First of all we wish to thank all participants of the seismological fieldexperiment who helped during deployment, service trips, and re-collection of instruments. The equipment and related software were pro-vided by the Geophysical Instrument Pool Potsdam (GIPP). Thisworkwascarried out under the umbrella of the project “Sustainability concepts forexploitation of geothermal reservoirs in Indonesia” funded by the FederalMinistry of Education and Research (BMBF) in Germany.We are thankfulto theMinistry of Research and Technology, the Centre for Geological Re-sources of Indonesia, and the Tarutung local government for the collabo-ration and helpful support during the field experiment. The authorswish to thank Prof. Dr. Inga Moeck andMochamad Nukman the fruitfuldiscussions on the geological setting of the study area based on theirfield observations. We wish to thank the reviewers for suggestionsand helpful comments on the manuscript.
s (low Vp regions) of the tomographic model. (a) Two clusters (brown and pink colors)members in relation with the Tarutung basin and Sarulla graben.

Fig. 19. Conceptual model for the Sarulla graben based on the seismicity distribution, Vpand Vp/Vs structure derived by the tomography analysis. The hot fluid from below thefault is transported directly to the surface along the weak fault.
42 U. Muksin et al. / Journal of Volcanology and Geothermal Research 260 (2013) 27–42
References
Bauer, K., Schulze, A., Ryberg, T., Sobolev, S.V., Weber, M.H., 2003. Classification of li-thology from seismic tomography: a case study from the Messum igneous com-plex, Namibia. Journal of Geophysical Research 108 (B3), 2152. http://dx.doi.org/10.1029/2001JB001073.
Bauer, K., Pratt, R.G., Haberland, C., Weber, M., 2008. Neural network analysis ofcrosshole tomographic images: the seismic signature of gas hydrate bearing sedi-ments in the Mackenzie Delta (NW Canada). Geophysical Research Letters 35,L19306. http://dx.doi.org/10.1029/2008GL035263.
Bauer, K., Muñoz, G., Moeck, I., 2012. Pattern recognition and lithological interpretationof collocated seismic and magnetotelluric models using self-organizing maps. Geo-physical Journal International 189 (2), 984–998. http://dx.doi.org/10.1111/j.1365-246X.2012.05402x.
Bellier, O., Sébrier, M., 1994. Relationship between tectonism and volcanism along theGreat Sumatran Fault Zone deduced by spot image analyses. Tectonophysics 233(3–4), 215–231.
Cembrano, J., Hervé, F., Lavenu, A., 1996. The Liquiñe Ofqui fault zone: a long-livedintra-arc fault system in southern Chile. Tectonophysics 259, 55–66.
Chatterjee, S.N., Pitt, A.M., Iyer, H.M., 1985. Vp/Vs ratios in the Yellowstone NationalPark region, Wyoming. Journal of Volcanology and Geothermal Research 26(3–4), 213–230.
Christensen, N.I., 1996. Poisson's ratio and crustal seismology. Journal of GeophysicalResearch 101 (B2), 3139–3156.
Eberhart-Phillips, D., 1986. Three-dimensional velocity structure in Northern CaliforniaCoast Ranges from inversion of local earthquake arrival times. Bulletin of the Seis-mological Society of America 76 (4), 1025–1052.
Eberhart-Phillips, D., 1990. Three-dimensional P and S velocity structure in the CoalingaRegion, California. Journal of Geophysical Research 95 (B10), 15343–15363.
Eberhart-Phillips, D., Michael, A.J., 1998. Seismotectonics of the Loma Prieta, California,region determined from three-dimensional Vp, Vp/Vs, and seismicity. Journal ofGeophysical Research 103 (B9), 21099–21120.
Evans, J.R., Eberhart-Phillips, D., Thurber, C.H., 1994. User's Manual for Simulps12 forImaging Vp and Vp/Vs: A Derivative of the “Thurber” Tomographic InversionSimul3 for Local Earthquakes and Explosions. U. S.Geological Survey 94–431.
Foulger, G., 1982. Geothermal exploration and reservoir monitoring using earthquakesand the passive seismic method. Geothermics 11 (4), 259–268.
Gassmann, F., 1951. Ueber die Elastizitaet poroeser Medien. Vier. Der Natur. Ges.Zuerich, 96 1–23.
Haberland, C., Rietbrock, A., 2001. Attenuation tomography in the western centralAndes: a detailed insight into the structure of a magmatic arc. Journal of Geophys-ical Research 106 (B6), 11151–11167.
Hickman, R.G., Dobson, P.F., Gerven, M.v, Sagala, B.D., Gunderson, R.P., 2004. Tectonicand stratigraphic evolution of the Sarulla graben geothermal area, North Sumatra,Indonesia. Journal of Asian Earth Sciences 23 (3), 435–448.
Holbrook, W.S., Mooney, W.D., Christensen, N.I., 1992. The seismic velocity structure ofthe deep continental crust. In: Fountain, D.M., Arculus, R., Kay, R.W. (Eds.), Conti-nental Lower Crust. : Dev. Geotectonics, 23. Elsevier Sci, New York, pp. 257–270.
Husen, S., Smith, R.B., Waite, G.P., 2004. Evidence for gas and magmatic sources beneath theYellowstone volcanic field from seismic tomographic imaging. Journal of Volcanologyand Geothermal Research 131 (3–4), 397–410.
Jousset, P., Haberland, C., Bauer, K., Arnason, K., 2011. Hengill geothermal volcaniccomplex (Iceland) characterized by integrated geophysical observations. Geothermics40 (1), 1–24.
Kennett, B.L.N., Engdahl, E.R., 1991. Travel times for global earthquake location andphase association. Geophysical Journal International 105, 429–465.
Kissling, E., Ellsworth, W.L., Eberhart-Phillips, D., Kradolfer, U., 1994. Initial referencemodels in local earthquake tomography. Journal of Geophysical Research 99(B10), 19635–19646.
Kohonen, T., 2001. Self-Organizing Maps, Information Sciences3rd ed. , vol. 30. Springer,Berlin (501 pp.).
Koulakov, I., Yudistira, T., Luehr, B.-G., Wandono, 2009. P, S velocity and Vp/Vs ratiobeneath the Toba caldera complex (northern Sumatra) from local earthquaketomography. Geophysical Journal International 177 (3), 1121–1139.
Lange, J. Cembrano, Rietbrock, A., Haberland, C., Dahm, T., Bataille, K., 2008. Firstseismic record for intra-arc strike–slip tectonics along the Liquiñe-Ofqui fault zoneat the obliquely convergent plate margin of the southern Andes. Tectonophysics455 (1–4), 14–24.
Lange, D., Tilmann, F., Rietbrock, A., Collings, R., Natawidjaja, D.H., Suwargadi, B.W.,Barton, P., Henstock, T., Ryberg, T., 2010. The fine structure of the subducted inves-tigator fracture zone in Western Sumatra as seen by local seismicity. Earth andPlanetary Science Letters 298 (1–2), 47–56.
Lee, W.H.K., Valdes, C.M., 1985. HYPO71PC: A Personal Computer Version of theHYPO71 Earthquake Location Program: U.S. Geol. Surv., Open-File Rept. 85–749(43 pp.).
McCaffrey, R., 2009. The tectonic framework of the Sumatran subduction zone. AnnualReview of Earth and Planetary Sciences 37 (1), 345–366.
McCarthy, A.J., Elders, C.F., 1997. Cenozoic deformation in Sumatra; oblique subductionand the development of the Sumatran fault system. Geological Society - SpecialPublications 126, 355–363.
Muraoka, H., Takahashi, M., Sundhoro, H., Dwipa, S., Soeda, Y., Momita, M., Shimada3,K., 2010. Geothermal Systems Constrained by the Sumatran Fault and Its Pull-Apart Basins in Sumatra, Western Indonesia. World Geothermal Congress, Bali,Indonesia.
Niasari, S.W., Munoz, G., Kholid, M., Suhanto, E., Ritter, O., 2012. Magnetotelluric explora-tion of the Sipoholon geothermal field, Indonesia. Geophysical Research Abstracts 14(EGU2012-9405-1).
Nippress, S.E.J., Rietbrock, A., Heath, A.E., 2010. Optimized automatic pickers: applicationto the ANCORP data set. Geophysical Journal International 181 (2), 911–925.
Nukman, M., Moeck, I., 2013. Structural controls on a geothermal system in theTarutung Basin, north central Sumatra. Journal of Asian Earth Sciences (submittedfor publication).
Rose, W.I., Chesner, C.A., 1987. Dispersal of ash in the great Toba eruption, 75 ka. Geology15, 913–917.
Ryberg, T., Hole, J.A., Fuis, G.S., Rymer, M.J., Bleibinhaus, F., Stromeyer, D., Bauer, K., 2012.Tomographic Vp and Vs structure of the California Central Coast Range, in the vicinityof SAFOD, from controlled-source seismic data. Geophysical Journal International190, 1341–1360. http://dx.doi.org/10.1111/j.1365-246X.2012.005585.x.
Sieh, K., Natawidjaja, D., 2000. Neotectonics of the Sumatran fault, Indonesia. Journal ofGeophysical Research 105 (B12), 28295–28326.
Stankiewicz, J., Ryberg, T., Haberland, C., Fauzi, Natawidjaja, D., 2010a. Lake Toba volca-no magma chamber imaged by ambient seismic noise tomography. GeophysicalResearch Letters 37 (17), L17306.
Stankiewicz, J., Bauer, K., Ryberg, T., 2010b. Lithology classification from seismictomography: additional constraints from surface waves. Journal of African EarthSciences 58, 547–552. http://dx.doi.org/10.1016/j.jafrearsci.2010.05.012.
Tatsumi, Y., 1989. Migration of fluid phases and genesis of basalt magmas in subduc-tion zones. Journal of Geophysical Research 94, 4697–4704.
Teyssier, C., Tikoff, B., Markley, M., 1995. Oblique plate motion and continental tecton-ics. Geology 23 (5), 447–450.
Thurber, C.H., 1983. Earthquake locations and three-dimensional crustal structure inthe Coyote Lake Area, Central California. Journal of Geophysical Research 88(B10), 8226–8236.
Thurber, C., Roecker, S., Ellsworth, W., Chen, Y., Lutter, W., Sessions, R., 1997. Two-dimensional seismic image of the San Andreas Fault in the Northern GabilanRange, central California: evidence for fluids in the fault zone. Geophysical ResearchLetters 24 (13), 1591–1594.
Toomey, D.R., Foulger, G.R., 1989. Tomographic inversion of local earthquake data fromthe Hengill–Grensdalur Central Volcano Complex, Iceland. Journal of GeophysicalResearch 94 (B12), 17497–17510.
Um, J., Thurber, C., 1987. A fast algorithm for two-point seismic ray tracing. Bulletin ofthe Seismological Society of America 77, 972–986.
USGS National Earthquake Information Center, 2012. (Available on) http://earthquake.usgs.gov (accessed on 10 June 2013).
Walck, M.C., 1988. Three-dimensional Vp/Vs variations for the Coso Region, California.Journal of Geophysical Research 93 (B3), 2047–2052.
Weller, O., Lange, D., Tilmann, F., Natawidjaja, D., Rietbrock, A., Collings, R., Gregory, L.,2012. The structure of the Sumatran Fault revealed by local seismicity. GeophysicalResearch Letters 39 (1), L01306.
Zucca, J.J., Hutchings, L.J., Kasameyer, P.W., 1994. Seismic velocity and attenuationstructure of the Geysers geothermal field, California. Geothermics 23 (2), 111–126.