Embed Size (px)
Citation preview

65
AMSE JOURNALS-2016-Series: Modelling C; Vol. 77; N°1; pp 65-85
Submitted July 2016; Revised Oct. 15, 2016, Accepted Dec. 10, 2016
Seismic Liquefaction Study of Sandy Soil and its Application Research
ZHANG Weiping 1, SUN Jiawen2, SUN Zhaochen3*
(1, 3. State Key Laboratory of Coastal and Offshore Engineering, Dalian University of Technology,
Dalian 116024, China (e-mail: [email protected])
2. The National Marine Environmental Monitoring Center, Dalian 116023, China
Abstract
As one of the most common particulate materials, sandy soil is widely distributed in natural
geological environment. Compared with typical clayey soil, which has different mechanical
properties and more tends to liquefy. In order to investigate the distinct mechanical properties, as
well as the liquefaction resistance of sandy soil, with the introducing of subloading surface concept,
the subloading surface Cam-clay model was introduced based on the classical Cam-clay model.
Through precisely simulates the distinct evolution of OCR, which provides a practical method to
simulate different type soils in a unified theoretic framework. And based on the parametric studies
of mechanical properties and seismic liquefaction of clayey and sandy soils, two seismic simulation
examples are carried out, owing to the faster rising of excess pore water pressure in sandy soil
foundation, especially under the coupled interaction between structure and foundation soil, which
leads to more significant strength degradation of foundation soil, results in larger seismic response
and more severe force condition of structure under earthquake incident.
Key words
sandy soil; earthquake; seismic liquefaction; OCR; subloading surface Cam-clay model
1. Introduction
Among the major concerns in civil engineering, the seismic response of structure under
earthquake incident was recognized as one of the most important issues in the design of civil

66
engineering structures (Rovithis, Pitilakis et al. 2009, Tang, Ling et al. 2010). Especially in coastal
and offshore area or other saturated geological environment with sandy soil, owing to the strength
degradation of foundation along with the rapid rising of excess pore water pressure under
earthquake incident, which could leads to severe damage and even sudden collapse to civil
engineering structures, such as tall buildings, bridges, wharfs and ocean platforms (Lu and Jeng
2010, Pan, Chen et al. 2011, Memarpour, Kimiaei et al. 2012). In the seismically induced
liquefaction cases that occurred in the past few decades, it was found responsible for the damage
and destruction of civil engineering facilities that happened in Japan's Niigata earthquake (1964),
Loma Prieta earthquake (1989), Kobe earthquake (1995). And recently, the damages occurred in
2010 Canterbury earthquake and more extensively again that followed in 2011 were founded related
with seismic induced liquefaction (Bardet and Kapuskar 1993, Fukusumi, Ozaki et al. 2002,
Maurer, Green et al. 2015). Meanwhile, many similar observations derived from laboratory
experiments also had been reported (Zhou, Chen et al. 2009, Gao, Ling et al. 2011). These reported
failures and laboratory experimental observations induced by seismic liquefaction suggest that a
more comprehensive understanding of the mechanism of seismic liquefaction, as well as the distinct
liquefaction resistance of different soils is required to ensure the foundation able to resist the
possible liquefaction and has enough bearing capacity to support the upper structure.
For seismic liquefaction of saturated soil as a result of the coupled interaction between soil
skeleton and fluid pore water, when the excess pore water pressures rise to an extent exceed the
contact stress between the grains of soil that keep them in contact with each other, which may
results in a complete loss of soil strength (Matasovic and Vucetic 1995, Wang and Lou 2000), and
which can be happed in sudden and catastrophic. And particularly, which is more likely to occur in
sandy soil foundation (Sassa and Sekiguchi 2001, Xia, Ye et al. 2010). And in practical civil
engineering, according to the different physical and mechanical properties, most soils were
categorized into clayey or sandy soil, and simulated with different models, which brings lots of
inconvenience to civil engineering practices, therefore, a concise and generalized constitutive model
is required.
Among the various elastoplastic constitutive models of soil, the classic Cam-clay model was
undoubtedly well known as the first practical constitutive model which could be able to provide an
accurate description of clayey soil under normally consolidated state (Roscoe, Schofield et al. 1958,
Zhang 2007). However, when confront with overconsolidated soil, or typical sandy soil material,
which no longer be able to provide a satisfactory description (Zhang 2007, Vithana, Nakamura et al.
2012). Based on the Cam-clay model, subloading surface Cam-clay model was proposed with the
67
introducing of subloading surface concept (Asaoka, Nakano et al. 2006, Yamakawa, Hashiguchi et
al. 2010). In this constitutive model, through precisely simulate the distinct evolution process of
overconsolidation ratio (OCR) in different type soils, both clayey and sandy soils all can be
modeled by this unified theoretical framework (Nakai and Hinokio 2004, Choo and Burns 2014).
Considering the great influence of seismic liquefaction in the design of important civil
engineering infrastructures, at the same time, considering the distinct liquefaction resistance of
different type soils, in order to study the mechanism of seismic liquefaction and the corresponding
influence on the dynamic response of structure, based on the comparative studies of clay and sandy
soils, then with the development of subloading surface Cam-clay model, a unified 3D nonlinear
dynamic FEM program based on ADINA81 was established, under this FEM framework, two
seismic simulation examples of a free field and a pier structure are conducted in this paper.
2. Subloading surface Cam-clay model
In the development history of soil constitutive model, the well-known Cam-clay model was
one of the most widely used elastoplastic model applied in civil engineering (Zhang 2007). As
developed from the laboratory experiment on remold clay, which could precisely simulate the yield
process of normally consolidated clayey soil, while confronted with overconsolidated soil or typical
sandy soil, which cannot be able to provide a satisfactory description anymore.
As a reflection of stress history, the overconsolidation factor plays a very important role in the
mechanical properties of soil, based on Cam-clay model, with the proposed concept of subloading
yield surface, the subloading surface Cam-clay model provides a practical method to simulate the
mechanical properties of soil in a wider application scope by taking overconsolidation factor into
consideration. In the determination of the governing equation of subloading yield surface, assuming
the subloading yield surface and normally consolidated surface are geometric similar (Fig.1),
thenthe governing equations for both normally consolidated yield surface and the subloading yield
surface can be written as (Zhang 2007):
*
0
ln =0p
pC
pf D (1)
*
1
ln 0s P
N
p qf C D
p p (2)
Where 0
1P
kC
e
, *
*
PC
DM
, *M is the critical shear stress ratio, p and q are the mean effective
stress and shear stress,parameter /q p is shear stress ratio, 0e is the porosity ratio of soil
68
under reference pressure 0p (98kPa), 0.434 cC , 0.434 sC , in which
cC and sC are the
volumetric compressibility and expansion coefficient, respectively.
ln p
e
0e
1
1 ( , )P p q
p
q
0p N1epN1p
Subloading yield surfaceNormally consolidatedyield surface
Fig.1 Yield surfaces of soil under different overconsolidated state
According to the relationship between stresses,the governing equation of subloading yield
surface through stress point ( , )P p q could be written as:
*1 1
0 0 1
ln (ln ln ) 0N e N es P
N
p pp qf C D
p p p p
(3)
In the loading process from 0p to
1N ep (Fig.1b), the plastic volume strain under isotropic
compression could be derived through equation 1
0
lnp N eV P
pC
p . Then through the relationship of
stress and over consolidation parameter of R (1/ OCR , 1
1
N e
N
pOCR
p ), the governing equation of
sub loading yield surface could be rewritten as:
*p
V* * *
0 p
1 1ln ln 0s
p qf R
p M p C (4)
Convert the governing equation from ( , )p q stress space into general stress space 2( , )m J ,
then a more practical equation of sub loading yield surface in general stress space could be derived
as:
2
* *
0 p
3 1ln ln 0pm
s V
m m
Jf R
M C
(5)
Where 3
iim
, 2
1
2ij ijJ s s , = -ij ij ms .
With taking the influence of over consolidation factor into consideration, the sub loading surface

69
Cam-clay model provides a practical method to describe the mechanical properties of soil under
overconsolidated state. While for the evolution of parameter R, as it closely related with plastic
strain, by Nakai et al’s advices (Nakai and Hinokio 2004, Asaoka, Nakano et al. 2006), assumes that
d d p
dR U , and in which *
p
lnR
MU m R
C , where
Rm is the material parameter which controlled
the evolution rate of OCR. The evolution equation defined the derivative of R as a positive scalar
function in terms of plastic stretching, as long as soil under plastic loading, which will always
towards the direction of normally consolidated state. From the definition functions, it’s clear to see
that the larger value of parameter Rm means the quicker evolution rate of over consolidation in
soil. And in typical clayey soil, there is a more rapid loss of over consolidation. Conversely, in
sandy soil, the loss of over consolidation is assumed to occur slowly (Asaoka, Nakano et al. 2006).
Based on the governing equation of sub loading surface Cam-clay model, along with the
evolution of OCR, then we could obtain the elastoplastic constitutive equation though coordination
equation combined with Hooke's law:
d d (d d )
d
e p
ij ijkl kl ijkl kl kl
ijkl kl ijkl
kl
E E
fE E
(6)
Where
dijkl kl
ij
p
ijkl
ij kl
fE
f fh E
, p
ln1 1R
m m
p
m
m Rf
Rh
C
, ijklE is the stiffness tensor, kl , e
kl and p
kl are
the total strain tensor, elastic strain tensor and plastic strain tensor, respectively.
Through the established constitutive equation, the corresponding elastoplastic loading criteria
could subsequently be obtained as below:
Loading: d 0p
ij
0 , d d 0ij
ij
ff
Hardening
0 , d d 0ij
ij
ff
Softening (
(7)
Unloading: d 0p
ij , 0
3. Model verification and parametric analysis
With taking the influence of over consolidation into consideration, sub loading surface Cam-clay
model provides a unified framework for extensive study of different type soils in wider application
scope. In this part, the validity and reliability of sub loading surface Cam-clay model is verified
firstly, and then through monotonic and cyclic loading tests, comparative studies are carried out on

70
both clayey and sandy soils under the unified theoretic framework.
3.1 Model verification and parametric study of mR
Firstly, in order to verify the validity and reliability of sub loading surface Cam-clay model in the
simulation of clayey and sandy soils, triaxial compression tests with constant mean principal stress
(p=196kPa) are carried out on Fujinomori clay and Toyoura sand (Table.1) (Asaoka, Nakano et al.
2006) .
Table 1 Material parameters of soil samples
Item Fujinomori clay Toyoura sand
Compression index ( ) 0.09 0.07
Swelling index ( ) 0.02 0.005
Critical shear stress ratio ( *M ) 1.36 1.5
Parameter of OCR (Rm ) 2.1 0.2
Void ratio at 98kPa (0e ) 0.83 1.1
Poisson’s ratio ( ) 0.2 0.2
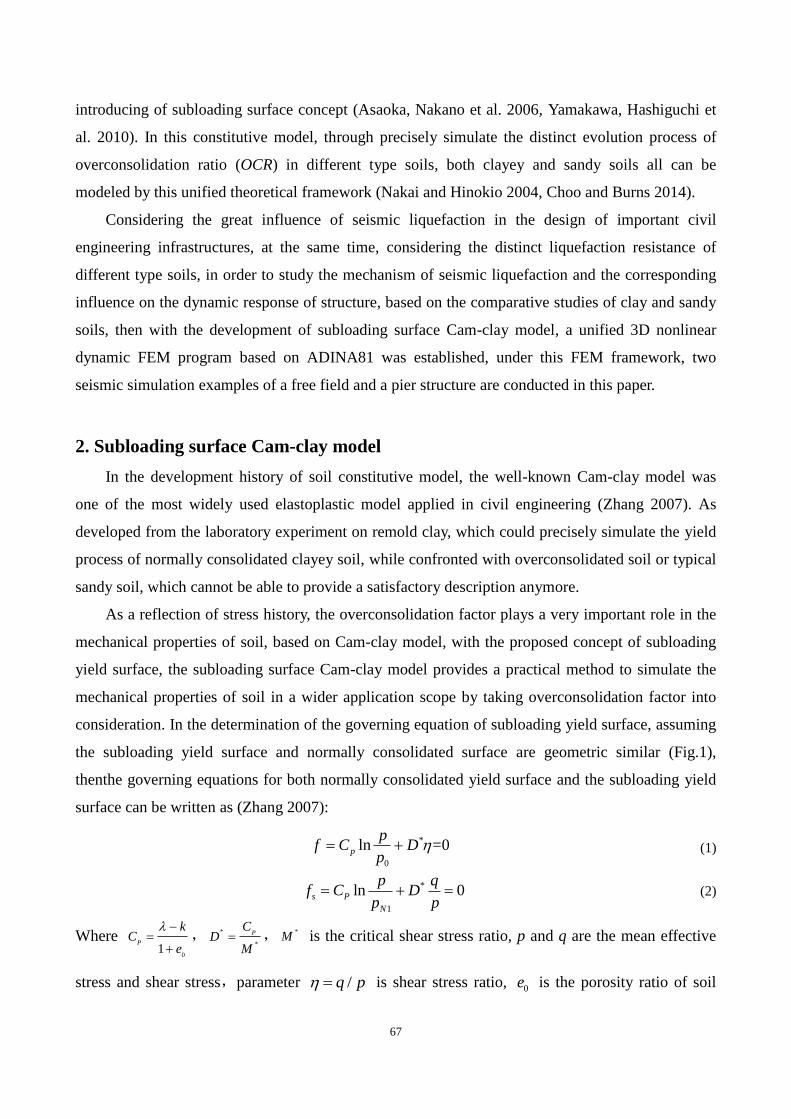
In the loading test of Fujinomori clay, four soil samples with one normally consolidated soil
sample (OCR=1) and three overconsolidated soil samples (OCR=2, 4, 8) are used. The comparison
of laboratory observed results and numerical predictions by sub loading surface Cam-clay model
are shown in Fig.2. From the loading responses it can be seen that the laboratory test observations
and numerical predicted results are in good agreement, the strength softening and volume dilatancy
phenomenon of overconsolidated soil are well simulated with good precision. As it can be seen
from the response of stress-strain relationship curves (Fig.2a), compared with the normally
consolidated soil sample, the overconsolidated soil samples all experiences a notable strength
hardening process with higher yield strength (q/p=1.36, 1.53, 1.72, 1.92), and once the stress-strain
curves reaches the apex point, along with the decay of OCR in the plastic loading process, the yield
strength decreases accordingly, and the ultimate yield strength all approaches to the same stress
level that performed in normally consolidated soil sample.
Fig.2b shows the corresponding volume compression during the loading process. As it can be
seen from the comparison curves, the normally consolidated soil sample shows the highest
compressibility ( -3.4%e ), while for the overconsolidated soil samples, which all experienced an
obvious reversion in the compression process, the void ratio was compressed at the first loading
stage, while with the loading keeps continuing, especially with larger initial OCR, which began to
increase and displays obvious volume dilatancy in the end ( e 1.19%, 2.41%, 3.21%). Through
the comparative loading tests, it could be derived that the predicted strength degradation and
dilatancy phenomenon along with the stress-strain response well proved the reliability and accuracy
71
of sub loading surface Cam-clay model, with taking over conslidation factor into consideration,
which provides a practical method to simulate the loading response of soil under overconsolidated
state.
Fig.3 shows the test results of Toyoura sand, as it can be seen from the loading responses, both
stress-strain response and dilatancy phenomenon of loose sand and dense sandy soil samples are
well simulated by sub loading surface Cam-clay model, and the dense sand shows much higher
yield strength (q/p=1.74, 1.45) and demonstrates larger dilatancy in the yielding process. Through
verification and parametric study on both clayey and sandy soil samples, it can be concluded that
through choses proper material parameter of OCR ( Rm ), the sub loadng surface Cam-clay model
provides a practical and precise model to simulate the distinct mechanical properties of sandy soil in
a unified theoretic framework.
0.00 0.02 0.04 0.06 0.08 0.10 0.12 0.14
0.0
0.5
1.0
1.5
2.0
2.5
d
q/p
OCR=1.0
OCR=2.0
OCR=4.0
OCR=8.0
OCR=1.0
OCR=2.0
OCR=4.0
OCR=8.0
0.00 0.02 0.04 0.06 0.08 0.10 0.12 0.14
-6
-4
-2
0
2
4
6
d
OCR=1.0
OCR=2.0
OCR=4.0
OCR=8.0
OCR=1.0
OCR=2.0
OCR=4.0
OCR=8.0
△ε
/%
0.00 0.02 0.04 0.06 0.08 0.10 0.12 0.14 0.16 0.18
0.0
0.5
1.0
1.5
2.0
2.5
q/p
d
Observed (dense, e=0.67)
Observed (loose, e=0.85)
Predicted (dense, e=0.67)
Predicted (loose, e=0.85)
0.00 0.02 0.04 0.06 0.08 0.10 0.12 0.14 0.16 0.18
-0.5
0.0
0.5
1.0
1.5
2.0
△e
/%
d
Observed (dense, e=0.67)
Observed (loose, e=0.85)
Predicted (dense, e=0.67)
Predicted (loose, e=0.85)
a /d
q p b d
e a /d
q p b d
e
Fig.2 Triaxial test of Fujinomori clay Fig.3 Triaxial test of Toyoura sand
Considering the loading responses of both clayey and sandy soils are well simulated by sub
loading surface Cam-clay model through taking the effect of over consolidation factor into
consideration, in this part, through choses appropriate parameter Rm
(Table 2), both drained and
undrained triaxial loading tests are conducted on three different type soil samples (from typical
clayey soil to sandy soil) under the unified theoretic framework of sub loading surface Cam-clay
model. And the mechanical parameters all share the same value as that of Fujinomori clay except
Rm , and the initial OCR are set to 4.0 (R=0.25) to simulate the initial overconsolidated state.
Table 2 State variable parameter of soil samples
Soil samples Rm
Clay
↓
Sand
sample 1 2.0
sample 2 0.5
sample 3 0.1
The drained loading test results are shown in Fig.4. In the loading response of q/p- d (Fig.4a), it
can be seen that all the soil samples experience a notable strength softening process, and which
displays more obviously and reaches higher shear stress ratio in the clayey soil sample (Sample 1,

72
d =0.020, q/p=1.76) than that demonstrated in the sandy soil sample (Sample 3, d =0.096,
q/p=1.52). Apart from the stress-strain response, the development of void ratio and the
corresponding evolution of OCR are also derived along with the loading process. From the
compression curves in Fig.4b, it can be seen that at the first loading stage, all soil samples
experience an obvious volume shrinkage process under shear stress loading ( *( ) /e k M ),
while with the loading keeps proceeding, the volume expansion due to the decay of OCR gradually
dominates the compressibility characteristics of soil ( 0(1 )lnPe C e OCR ), and then the
compression response of overconsolidated soil is a combination of the volume shrinkage part due to
shear loading and the expansion part due to the decay of OCR. At the same time, owing to the
distinct evolution rate of OCR in different soil samples (Fig.4c), the volume compression curves
follow distinct development paths. However, all soil samples reach the same void ratio and
normally consolidated state after yield.
The undrained loading test results are shown in Fig.5. As the buildup of excess pore water
pressure is closely related with the compression of soil skeleton, then the buildup curves of excess
pore water pressure also experiences a notable reversion in the yield process, and displays negative
pressure in the end. And owing to distinct compressibility of clayey and sandy soils, the maximum
excess pore water pressure reached 9.3kPa and 43.0kPa in the two soil samples. At the same time,
owing to the influence of excess pore water pressure, which significantly accelerates the decay of
OCR and displays smaller shear strength (Sample 1, d =0.015, q/p=1.67; Sample 3, d =0.035,
q/p=1.44).
0.00 0.05 0.10 0.15 0.20 0.25 0.30
0.0
0.5
1.0
1.5
2.0
2.5
d
q/p
sample 1
sample 2
sample 3
0.00 0.05 0.10 0.15 0.20 0.25 0.30
-4
-2
0
2
4
△e/
%
d
sample 1
sample 2
sample 3
0.00 0.05 0.10 0.15 0.20 0.25 0.30
0.25
0.50
0.75
1.00
1.25
d
R(
1/O
CR)
sample 1
sample 2
sample 3
a /d
q p b d
e c d R
Fig.4 Drained triaxial test with constant mean principal stress

73
0.00 0.02 0.04 0.06 0.08 0.10 0.12 0.14 0.16
0.0
0.5
1.0
1.5
2.0
2.5
sample 1
sample 2
sample 3
q/p
d0.00 0.02 0.04 0.06 0.08 0.10 0.12 0.14 0.16
-60
-40
-20
0
20
40
60
sample 1
sample 2
sample 3
P/k
Pa
d0.00 0.02 0.04 0.06 0.08 0.10 0.12 0.14 0.16
0.25
0.50
0.75
1.00
1.25
sample 1
sample 2
sample 3
R (
1/O
CR
)
d
a /d
q p b d
P c d R
Fig.5 Undrained triaxial test with constant mean principal stress
3.2 Cyclic loading response and seismic liquefaction study of clayey and sandy soils
Considering the dangerous destructive power of seismic liquefaction, as well as the distinct
liquefaction resistance of clayey and sandy soils, therefore, correct estimation of foundation’s
bearing capacity under earthquake incident is necessary for the seismic design of important soil
structures in liquefiable geological environments. In this part, both drained and undrained cyclic
loading tests are conducted on both typical clayey and sandy soil samples (Sample 1 and Sample 3,
Table.2) with specific OCR value (OCR=1, 2, 4). In the loading tests, total 3000 steps with
incremental strain step 0.002d and loading stress amplitude ( 1 3- ) of 20kPa are carried out.
Firstly, the drained cyclic loading test is conducted and the test results of both clayey and sandy
soils are presented in Fig.6 and Fig.7, respectively. From the stress-strain response curves in Fig.6a
and Fig.7a, it can be seen that with the increases of OCR, the soil samples demonstrate much better
mechanical performance and smaller compressibility under the cyclic loading test. At the same time,
from the comparison between clayey and sandy soil samples, it also can be found that the sandy soil
samples shown stronger nonlinearity characteristics and larger compressibility ( =e 0.40, 0.32 and
0.23) than clayey soil ( =e 0.24, 0.16 and 0.08), the typical sandy soils can be compressed to
higher density under cyclic loading. Meanwhile, as the evolution of OCR is closely related with the
development of soil density, Fig.6d and Fig.7d present the corresponding evolution of OCR in the
cyclic loading test. Owing to the different evolution rate between clayey and sandy soils, in the
sandy soil samples, the OCR reaches the stable state just after a few loading cycles, and the soil
samples are compressed to more density state (e=0.44, 0.47, 0.51), while the evolution of OCR in
clayey soil samples displays a more gradual evolution process and then the soil samples reaches a
relative higher void ratio state after the loading test (e=0.60, 0.63, 0.66).

74
0.00 0.02 0.04 0.06 0.08 0.10 0.12
-1.5
-1.0
-0.5
0.0
0.5
1.0
1.5 OCR=1.0
OCR=2.0
OCR=4.0
q/p
d
0.00 0.02 0.04 0.06 0.08 0.10 0.12
0.55
0.60
0.65
0.70
0.75
0.80
0.85
0.90
OCR=1.0
OCR=2.0
OCR=4.0
e
d0 500 1000 1500 2000 2500 3000
0.0
0.2
0.4
0.6
0.8
1.0
OCR=1.0
OCR=2.0
OCR=4.0
R (
1/O
CR
)
Loading steps
a /d
q p b de c R
Fig.6 Drained triaxial test of soil under cyclic loading (Clayey soil)
0.00 0.02 0.04 0.06 0.08 0.10 0.12 0.14
-1.5
-1.0
-0.5
0.0
0.5
1.0
1.5 OCR=1.0
OCR=2.0
OCR=4.0
q/p
d0.00 0.02 0.04 0.06 0.08 0.10 0.12 0.14
0.4
0.5
0.6
0.7
0.8
0.9
OCR=1.0
OCR=2.0
OCR=4.0
e
d0 500 1000 1500 2000 2500 3000
0.0
0.2
0.4
0.6
0.8
1.0 OCR=1.0
OCR=2.0
OCR=4.0
R (
1/O
CR
)Loading steps
a /d
q p b de c R
Fig.7 Drained triaxial test of soil under cyclic loading (Sandy soil)
Secondly, since the distinct mechanical properties of clayey and sandy soils are found in drained
loading tests, meanwhile, considering the buildup of excess pore water pressure as a result of
dynamic coupled interaction between soil skeleton and fluid pore water, in order to further
investigate the liquefaction mechanism and the distinct liquefaction resistance of different type soils,
the undrained cyclic loading tests are conducted on both clayey and sandy soils and the comparative
test results are presented in Fig.8 and Fig.9, respectively.
Unlike in the drained tests that all soil samples reached their respective stable state after several
loading cycles, in the undrained loading test, along with the compression of soil skeleton, the
loading pressure transferred to the fluid pore water, and then followed by the rising of excess pore
water pressure (Fig.8b and Fig.9b), accordingly. With the decreases of soil effective stress, which
accelerates the strength degradation of soil, until completely lost bearing capacity when reaches the
critical state of liquefaction. Especially, owing to the larger compressibility, the normally
consolidated soil samples reach the critical state of liquefaction more quickly. As well as the
influence of OCR, the distinct mechanical properties between clayey and sandy soils are also
reflected in the buildup of excess pore water pressure, the sandy soil samples almost liquefied just
after few loading cycles (Fig.9b), while in the clayey soil samples, owing to the better mechanical

75
performance and lower compressibility, which enables the clayey soil samples maintained at a
relative stable state after dozens of loading cycles (Fig.8a).
In order to further investigate the evolution of OCR under the influence of excess pore water
pressure, the corresponding evolution curves of OCR are derived and presented in Fig.8c and Fig.9c,
respectively. As it can be seen from the evolution curves, unlike in the drained test that OCR all
reaches their final higher OCR state, in the undrained cyclic laoding test, at the first loading stage ,
with the quite small excess pore water pressure level, which has limited influence on soil’s
mechanical properties, as well as the evolution of OCR, while with the rapid rising of excess pore
water pressure, which began to show significant influence on the evolution of OCR, particularly
when approaches the critical liquefaction state, the develop of OCR reverses rapidly and
degenerates into normally consolidated state, and which more likely to happen in sandy soil
samples for the quicker rising of excess pore water pressure.
Through the comparative studies of the cyclic loading response of clayey and sandy soils, it can
be concluded that through precisely simulates the evolution of OCR, the subloading surface
Cam-clay model provides a practical unified theoretic framework to simulate the distinct
mechanical properties and liquefaction resistance of different type soils. Compared with clayey soil,
owing to the quicker rising of excess pore water pressure under cyclic loading, sandy soil responded
with much more progressive degradation of soil strength until lost the whole strength when reaches
the critical state of liquefaction.
-0.04 -0.02 0.00 0.02 0.04
-2.5
-2.0
-1.5
-1.0
-0.5
0.0
0.5
1.0
1.5
2.0
2.5
OCR=1.0
OCR=2.0
OCR=4.0
q/p
d0 500 1000 1500 2000 2500 3000
0
20
40
60
80
OCR=1.0
OCR=2.0
OCR=4.0
P/k
Pa
Loading steps
0 500 1000 1500 2000 2500 3000
0.0
0.2
0.4
0.6
0.8
1.0 OCR=1.0
OCR=2.0
OCR=4.0
R (
1/O
CR
)
Loading steps
a /d
q p b P c R
Fig.8 Undrained test of soil under cyclic loading (Clayey soil)
-0.08 -0.06 -0.04 -0.02 0.00 0.02 0.04 0.06 0.08 0.10
-2.0
-1.5
-1.0
-0.5
0.0
0.5
1.0
1.5
2.0
OCR=1.0
OCR=2.0
OCR=4.0
q/p
d
0 500 1000 1500 2000 2500 3000
0
20
40
60
80
100
OCR=1.0
OCR=2.0
OCR=4.0
P/k
Pa
Loading steps
0 500 1000 1500 2000 2500 3000
0.0
0.1
0.2
0.3
0.4
0.5
0.6
0.7
0.8
0.9
1.0
OCR=1.0
OCR=2.0
OCR=4.0
R (
1/O
CR
)
Loading steps

76
a /d
q p b P c R
Fig.9 Undrained test of soil under cyclic loading (Sandy soil)
4. Seismic simulation examples and discussions
Considering the great dangers of seismic liquefaction and the distinct liquefaction resistance of
clayey sand sandy soils, then for the structures constructed in saturated foundation, particularly in
sandy soil foundation, when subjected to earthquake incident, a flow failure may occur along with
the rapid risingof excess pore water pressure in a short period of time. In this paper, with the
development of subloading surface Cam-clay model, a 3D dynamic nonlinear FEM program based
on open-source ADINA81 program is developed, which provides a unified framework for seismic
study of structure in different type soil foundations. And then two seismic simulation examples of a
free field and a pier structure are carried out on both clayey soil and sandy soil foundations (Sample
1 and Sample 3 in Table.2).
4.1 Example 1: Seismic analysis of free field
In this seismic simulation example, a homogeneous free field foundation with 30m depth is
presented. In order to simulate the seismic wave propagation in half-space free field, viscoelastic
artificial boundaries are added to the truncated cross sections. In the numerical model, a
computational domain of 50m×20m×30m area with 960 8-node isoparametric elements is used
(Fig.10). And in the seismic simulation, scaled Loma wave (San Francisco Bay Area of California,
1989, 0.11g, Fig.11) with peak acceleration value of 0.2g is used to simulate the incident earthquake
wave.
X Y
Z
X/m
Z/m
-20 -10 0 10 200
10
20
30
40
Fig.10 Mesh for finite element analysis

77
0 5 10 15 20 25 30 35 40
-0.10
-0.05
0.00
0.05
0.10
Acc
/g
T/s
Fig.11 Time-history of input seismic acceleration
Fig.12 shows the seismic responses at ground surface derived from both clayey (Free field 1) and
sandy soil foundations (Free field 2). As the two foundation soils used the same material parameters
except Rm , in the early stage of earthquake incident, the seismic responses in the two fields are
very close, while influenced by the distinct strength degradation along with the rising of excess pore
water pressure, the sandy field foundation shows much stronger nonlinearity with the decreases of
model’s stiffness, and which significantly affects the dynamic characteristics of field foundation, the
maximum acceleration reaches 4.09m/s2 and 3.14m/s2, and the corresponding maximum
displacement reaches 0.11m and 0.07m, respectively in the two field foundations. As well as
seismic response, the plastic deformations reached 0.01m and 0.03m after earthquake incident in the
two field foundations, which almost tripled in the foundation case with sandy soil.
Fig.13 presents the distribution of excess pore water pressure ratio along field depth after
earthquake incident, from the distribution curves it can be seen that the upper soil reaches higher
excess pore water pressure, and with depth goes deeper, the distribution curves show exponential
attenuation pattern from ground surface. Meanwhile, owing to the distinct liquefaction resistance
between clay and sandy soils, which is directly reflected in the distribution curves of excess pore
water pressure, especially in the upper zone near ground surface, the sandy soil free field almost
liquefied near ground surface, while the difference of excess pore water pressure between the two
fields decreases along with the increase of field depth.
Considering the significant difference of seismic response and liquefaction resistance between
clayey and sandy soil foundations, in order to get a more comprehensive understanding of the
buildup of excess pore water pressure and stress-strain response in different soil fields, the
stress-strain relationship curves and the buildup curve of excess pore water pressure derived from
5m, 10m, 20m depth are presented in Fig.14, respectively. As it displayed in the figures, as the two
field foundations used the same mechanical parameters, at the early stage of earthquake incident,
the excess pore water pressure curves and stress-strain response are very close, while owing to the
distinct liquefaction resistance of sandy soils, which directly reflected in the buildup of excess pore

78
water pressure, and significantly accelerates the strength degradation process of soil and influences
the dynamic characteristics of field foundation under earthquake incident, accordingly.
0 5 10 15 20 25 30 35 40 45 50
-4
-3
-2
-1
0
1
2
3
Acc/m
·s-2
T/s
Free field 1
Free field 2
0 5 10 15 20 25 30 35 40 45 50 55 60
-0.10
-0.05
0.00
0.05
0.10
0.15
T/s
Dis
p/m
Free field 1
Free field 2
a Acceleration b Displacement
Fig.12 Dynamic response of ground surface
0.2 0.3 0.4 0.5 0.6 0.7 0.8 0.9 1.0 1.1
30
25
20
15
10
5
0
Free field 1
Free field 2
De
pth
/m
Excess pore water pressure ratio
Fig.13 Distribution of excess pore water pressure
-0.04 -0.02 0.00 0.02 0.04
-40
-20
0
20
40
60
80
Free field 1
Free field 2
xz
τxz/kPa
0 10 20 30 40 50 60
0.0
0.2
0.4
0.6
0.8
1.0
Free field 1
Free field 2
Rp
T/s-0.04 -0.02 0.00 0.02 0.04
-60
-40
-20
0
20
40
60
80
100
Free field 1
Free field 2
xz
τxz/kPa
0 10 20 30 40 50 60
0.0
0.2
0.4
0.6
0.8
1.0
Free field 1
Free field 2
Rp
T/s a Depth=5m b Depth=10m
-0.04 -0.02 0.00 0.02 0.04
-100
-50
0
50
100
150
Free field 1
Free field 2
xz
τxz/kPa
0 10 20 30 40 50 60
0.0
0.2
0.4
0.6
0.8
1.0
Free field 1
Free field 2
Rp
T/s c Depth=20m
Fig.14 Seismic response of foundation soil

79
4.2 Example 2: Seismic analysis of pier structure
In this numerical example of a simplified offshore pier structure, the supporting piles are driven
to 20m deep below ground surface, and the layout of piles was set to 18m×12m arrangement, the
piles were made of steel pipe with diameter of 2.8m and thickness of 32mm, the Yong’s modulus is
210GPa, the simplified upper structure weights 2000KN. In the simulation of seismic motion in
half-space soil foundation, a 100m×40m×30m calculation domain with viscoelastic artificial
boundaries is used. And considering the symmetry of calculation model, just one-half domain of the
numerical model is taken for FEM calculation, and then the numerical model was discretised into
3888 nonlinear 8-node isoparametric elements for soil foundation, and 584 elastic elements for
simplified pier structure (Fig.15). In this seismic simulation, the scaled Loma wave with peak
acceleration of 0.2g is also used as incident earthquake wave.
Y
X
Z
X/m
Z/m
-50 -40 -30 -20 -10 0 10 20 30 40 500
10
20
30
40
50
60
70
80
90
a FEM Model of a simplified pier b Cross-section of the pier model
Fig.15 Mesh for finite element analysis of the pier model
Firstly, the cloud contour maps of excess pore water pressure ratio derived from clayey soil
foundation is illustrated in Fig.16, which provides an overall comprehension of the coupled pile-soil
interaction in saturated foundation. As it displays in the contour maps, besides the attenuation of
excess pore water pressure from ground surface, under the dynamic coupled interaction between
piles and foundation soil, there shows obvious concentration of excess pore water pressure in the
near field of structure.
Secondly, a more precise figure of excess pore water pressure ratio distribution curves derived
from both clayey and sandy soil foundations is presented in Fig.17. Through the comparison of
excess pore water pressure ratio derived from far field and near field, it can be seen that the coupled
pile-soil interaction had significantly accelerates the buildup of excess pore water pressure,
particularly in the sandy soil foundation, which had liquefied in the upper 2.5m near ground surface.
With the depth goes deeper, as the motion of foundation soil and structure piles tend to synchronize,
the corresponding influence of the coupled pile-soil interaction decreases accordingly, while it also
should be noted that in the area of pile toe, the excess pore water pressure curve displays an obvious

80
vertex due to the stress concentration in the interface area of piles and foundation soil.
X/m
Z/m
-50 -40 -30 -20 -10 0 10 20 30 40 500
10
20
30
40
50
60
70
P
1
0.9
0.8
0.7
0.6
0.5
0.4
0.3
0.2
0.1
0
Fig.16 Excess pore water pressure ratio (t=60.0s)
0.2 0.3 0.4 0.5 0.6 0.7 0.8 0.9 1.0 1.1
30
25
20
15
10
5
0
Excess pore water pressure ratio
De
pth
/m
far field(Clayey soil foundation)
far field(Sandy soil foundation)
along with pile(Clayey soil foundation)
along with pile(Sandy soil foundation)
Fig.17 Distribution of excess pore water pressure ratio
Fig.18 shows the seismic response of structure’s top node, in the comparative study, apart from
the simulated results derived from clayey and sandy soil foundations, an ideal linear elastic soil
foundation is also presented as a background reference (Young’s modulus E is expressed in terms of
the swelling index and Poisson’s ratio as 03(1 2 )(1 )e p
E
). In the seismic response
curves, the maximum acceleration reaches 18.36m/s2, 14.34m/s2 and 11.23m/s2, and the
corresponding maximum displacement reaches 0.29m, 0.34m and 0.46m, respectively derived from
elastic, clayey and sandy soil foundations. As well as seismic response, the horizontal plastic
deformation reaches 0.04m and 0.08m in the clayey and sandy soil foundations. Compared with the
ideal elastic foundation, particularly with sandy soil foundation, owing to the degradation of soil
strength along with the rapid rising of excess pore water pressure, the distinct degradation of
foundation’s bearing capacity leads to more significant decreases of structure stiffness and
subsequently affects the seismic response of the pier structure.

81
0 10 20 30 40 50 60
-20
-15
-10
-5
0
5
10
15
20
Elastic foundation
Clayey soil foundation
Sandy soil foundation
T/s
Acc/m
·s-2
a Acceleration b Displacement
Fig.18 Dynamic response of the structure's top node
In view of the distinct seismic responses in clayey and sandy soil foundations, in order to further
investigate the deflection and force condition of structure under earthquake incident, the maximum
horizontal deflection and bending moment envelop of pile are derived in Fig.19. The pile reaches
the maximum deflection of 0.29m, 0.34m and 0.46m at pile’s top node in the three soil foundations,
and the deflection curves show obvious inflection near ground surface (Fig.19a). Meanwhile,
through stress integration in pile’s cross section, similar comparative results of bending moment
envelope are derived in Fig.19b. Aims to make the comparison be more comprehensible, the
bending moment envelops are given in relative value, and the maximum bending moment derived
from elastic foundation model (M0) is used as background reference. From the figure it can be seen
that the envelope curves all demonstrate two distinct peaks along pile length, and owing to the
distinct degradation of foundation’s bearing capacity, the pile reaches the maximum bending
moment of 1.20 and 1.37 near ground surface in the clayey and sandy soil foundations, respectively.
Therefore, in the geological environment with saturated sandy soil foundation, which should be
paid more attention in the seismic design of structures to resist the possible seismic liquefaction and
ensure the safety of structure.
-0.2 -0.1 0.0 0.1 0.2 0.3 0.4 0.5 0.6
10
20
30
40
50
60
70
Elastic foundation
Clayey soil foundation
Sandy soil foundation
De
pth
/m
Displacement/m
0.0 0.2 0.4 0.6 0.8 1.0 1.2 1.4 1.6 1.8
10
20
30
40
50
60
70
Elastic foundation
Clayey soil foundation
Sandy soil foundation
De
pth
/m
Bending moment /(M/M0) a Horizontal deflection b Moment envelope
Fig.19 Horizontal deflection and bending moment along with pile

82
5. Discussion
With considering the influence of over consolidation factor, as well as the distinct evolution ratio
of OCR in different type soils, the predicted results by sub loading surface Cam-clay model are
compared favourably with the experimental results of both clayey and sandy soils. Our results
confirmed the feasibility of study the seismic liquefaction of clayey and sandy soils in a unified
theoretic framework.
Considering the super loading surface Cam-clay model able to provide a unified model for both
clayey and sandy soils by choosing proper evolution ratio of over consolidation, meanwhile, as the
parameter of mR is obtained through curve fitting on the loading response of soil, which cannot be
directly derived through conventional laboratory experiment or other common parameters, therefore,
a more practical method to determine the precise value of parameter mR will be an important
research issue in the future research.
Considering the seismic liquefaction of soil is a complex phenomenon of the coupled interaction
between soil skeleton and fluid pore water, for the transient problem such as earthquake incidence,
the undrained simplification of foundation soil without considering the pore flow in soil porosity is
acceptable. While for the structures subjected to long period loads, such as wave, sea current flow
as well as the long time dynamic working loads, the influence of pore flow, as well as the
permeability of soil couldn’t be neglected anymore. Under these circumstances, the problem is
neither transient nor steady-state process, then the simulation of these problems will be very time
consuming, how to simplify this problem will be the direction of future research.
6. Conclusions
With considering the effect of over consolidation as well as the distinct evolution ratio of OCR in
different type soils, the sub loading surface Cam-clay model provides an available unified theoretic
framework for the simulation of different soils in wider application scope. Based on the
comprehensive studies of clayey and sandy soils, seismic simulation examples of a free field and a
simplified pier structure are conducted, and the following conclusions are derived:
Through precisely simulates the influence and evolution of OCR, the sub loading surface
Cam-clay model well revealed the mechanism of strength degradation and volume dilatancy
phenomenon of overconsolidated soil, and with the increase of OCR, overconsolidated soil shows
better mechanical performance and liquefaction resistance. Compared with clayey soil, sandy soil
shows much stronger nonlinear characteristics, higher compressibility, and more tends to liquefy
under cyclic loading.

83
In the seismic simulation examples of free field and pier structure, along with the faster rising of
excess pore water pressure in sandy soil field foundation, especially under the coupled interaction
between structure and foundation soil, the rapid rising of excess pore water pressure leads to more
significant strength degradation of foundation soil and the decreases of structure’s stiffness, which
results in larger seismic response and more severe force condition of structure under earthquake
incident.
Through the comprehensive investigation on clayey and sandy soils, as well as the seismic
liquefaction study of soil foundation, it could be concluded that the sub loading surface Cam-clay
model provides a practical method for extensive study of seismic liquefaction of different type soils
in a unified framework. The conclusions derived from the comparative studies could provide some
useful insights and references for the seismic design of civil engineering structures in liquefiable
sandy soil foundation.
Acknowledgment
Project supported by the Foundation for Innovative Research Groups of the National Natural
Science Foundation of China (Grant No. 51221961) and State Key Development Program of Basic
Research of China (No. 2011CB013701).
References
1. Asaoka, A., M. Nakano and T. Noda (2006). "A Super/Subloading Yield Surface Approach to
Compaction/Liquefaction of Sand and Secondary Consolidation of Clay[C]." Geomechanics
II-Testing, Modeling and Simulation, Proceedings of the Second GI-JGS workshop, Osaka,
ASCE Geotechnical Special Publication: 201-218.
2. Bardet, J. and M. Kapuskar (1993). "Liquefaction sand boils in San Francisco during 1989
Loma Prieta Earthquake." Journal of Geotechnical Engineering 119(3): 543-562.
3. Choo, H. and S. Burns (2014). "Effect of overconsolidation ratio on dynamic properties of
binary mixtures of silica particles." Soil Dynamics and Earthquake Engineering 60: 44-50.
4. Fukusumi, T., H. Ozaki and M. Kobac (2002). "Influence of the ground profile on the reduction
of earthquake motion at the filled man-made islands in the Kobe harbor during the 1995
Hyogoken Nambu earthquake." Journal of Soil Dynamics and Earthquake Engineering
22(893-899).

84
5. Gao, X., X. Ling, L. Tang and P. Xu (2011). "Soil-pile-bridge structure interaction in liquefying
ground using shake table testing." Soil Dynamics and Earthquake Engineering 31(7):
1009-1017.
6. Lu, J. and D. Jeng (2010). "Dynamic response of an offshore pile to pseudo-Stoneley waves
along the interface between a poroelastic seabed and sea water." Soil Dynamics and Earthquake
Engineering 30(4): 184-201.
7. Matasovic, N. and M. Vucetic (1995). "Generalized cyclic-degradation-pore-pressure generation
model for clays." Journal of Geotechnical Engineering 121(1): 33-42.
8. Maurer, B., R. Green, M. Cubrinovski and B. Bradley (2015). "Fines-content effects on
liquefaction hazard evaluation for infrastructure in Christchurch, New Zealand." Soil Dynamics
and Earthquake Engineering 76: 58-68.
9. Memarpour, M., M. Kimiaei, M. Shayanfar and M. Khanzadi (2012). "Cyclic lateral response of
pile foundations in offshore platforms." Computers and Geotechnics 42: 180-192.
10. Nakai, T. and M. Hinokio (2004). "A simple elastoplastic model for normally and over
consolidated soils with unified material parameters." Soils and Foundations 44(2): 53-70.
11. Pan, H., G. Chen and H. Liu (2011). "Behavior of large post-liquefaction deformation in
saturated Nanjing fine sand." Earthquake Engineering and Engineering Vibration 10(2):
187-193.
12. Roscoe, K., A. Schofield and C. Wroth (1958). "On yielding of soils." Geotechnique 8(1):
22-53.
13. Rovithis, E., K. Pitilakis and G. Mylonakis (2009). "Seismic analysis of coupled
soil-pile-structure systems leading to the definition of a pseudo-natural SSI frequency." Soil
Dynamics and Earthquake Engineering 29(6): 1005-1015.
14. Sassa, S. and H. Sekiguchi (2001). "Analysis of wave-induced liquefaction of sand beds."
Geotechnique 51(2): 115-126.
15. Tang, L., X. Ling and P. Xu (2010). "Shake table test of soil-pile groups-bridge structure
interaction in liquefiable ground." Earthquake Engineering and Engineering Vibration 9(1):
39-50.
16. Vithana, S., S. Nakamura, S. Kimura and S. Gibo (2012). "Effects of overconsolidation ratios
on the shear strength of remoulded slip surface soils in ring shear." Engineering Geology
131-132(29): 29-36.
17. Wang, S. and Z. Lou (2000). "Degradation of undrained shear strength of marine silty clay after
undrained cyclic loading." Ocean Engineering 18(1): 38-43. (in Chinese)

85
18. Xia, Z., G. Ye and J. Wang (2010). "Numerical Analysis on the Influence of Thickness of
Liquefiable Soil on Seismic Response of Underground Structure." Journal of Shanghai Jiaotong
University. (Sci.) 15(3): 279-284.
19. Yamakawa, Y., K. Hashiguchi and K. Ikeda (2010). "Implicit stress-update algorithm for
isotropic Cam-clay model based on the subloading surface concept at finite strains."
International Journal of Plasticity 26(5): 634-658.
20. Zhang, F. (2007). "Computational Soil Mechanics [M]." Beijing: China Communications Press.
(in Chinese)
21. Zhou, Y., Y. Chen, Y. Shamto and H. Hotta (2009). "Centrifuge model test on
earthquake-induced differential settlement of foundation on cohesive ground." Science in China
Series E: Technological Sciences 52(7): 2138-2146.


![[Seid] Seismic Liquefaction](https://img.dokumen.tips/doc/110x75/547adedbb4795977098b4ba3/seid-seismic-liquefaction.jpg)