Embed Size (px)
Citation preview

6th International Conference on Earthquake Geotechnical Engineering 1-4 November 2015 Christchurch, New Zealand
Liquefaction Assessment by Seismic Dilatometer Test (SDMT)
after 2010-2011 Canterbury Earthquakes (New Zealand)
S. Amoroso1, P. Monaco2, K.M. Rollins3, M. Holtrigter4, A. Thorp5
ABSTRACT The 2010-2011 Canterbury earthquakes (New Zealand) provided many case histories of
liquefaction and lateral spreading. In the aftermath several seismic dilatometer (SDMT) tests were performed in Christchurch within the scope of the Ground Improvement Trials Report for the Earthquake Commission (EQC). SDMT-based liquefaction analyses were conducted to validate the use of existing correlations for deriving the cyclic resistance ratio CRR from the horizontal stress index KD and to increase the CRR-KD case history database. The results obtained at different sites show a variable trend and point out the need for further investigation on the influence of factors, such as the fines content, not taken into account by current CRR-KD correlations.
Introduction
The seismic dilatometer (SDMT) provides two parallel independent estimates of the liquefaction resistance (cyclic resistance ratio CRR), one from the shear wave velocity VS and the other from the DMT horizontal stress index KD. The use of VS for evaluating CRR is well known. CRR-KD correlations have been developed in the last two decades, stimulated by the recognized sensitivity of KD to a number of factors which are known to influence liquefaction resistance and are difficult to sense by other tests. These include stress history, prestraining/aging, structure (though it is not possible to separate the individual contribution of each factor), and by its correlation with the state parameter (see Monaco et al. 2005). The paper illustrates and comments on the liquefaction assessment by SDMT test based on results obtained in Christchurch, New Zealand, in combination with the other available investigation data. The site campaigns were conducted within the scope of the Ground Improvement Trials Project (EQC 2013) for EQC, MBIE, NEES, and U.S. NSF. The study was commissioned in response to the need for ground improvement following the 2010-2011 earthquakes.
Site investigations by SDMT In December 2013 SDMTs were carried out at 16 different trial test sites. The test locations are plotted in Figure 1, superimposed on a map that identifies liquefaction and lateral spreading.
1Researcher, Istituto Nazionale di Geofisica e Vulcanologia, L'Aquila, Italy, [email protected] 2Assistant Professor, Dept. Civil, Arch. Env. Engineering, University of L'Aquila, Italy, [email protected] 3Full Professor, Dept. Civil Env. Engineering, Brigham Young University, Provo, Utah, USA, [email protected] 4Director, Ground Investigation Ltd, Aukland, New Zealand, [email protected] 5Technical Manager, Ground Investigation Ltd, Aukland, New Zealand, [email protected]

Figure 1. “Liquefaction and Lateral Spreading Observations” following the 22nd February 2011 earthquake (Canterbury Geotechnical Database - CGD 2013) with location of SDMT test sites.
This paper is focused on site investigations and liquefaction analyses performed at Site 3 (Wainoni) and Site 7 (Waireka Lane). Both sites are close to the Avon River and composed of sands and silty sands that liquefied during the 2010-2011 earthquake sequence. Site 3 was classified as affected by "No lateral spreading but minor to moderate quantities of ejected material" in the 4th September 2010 earthquake and by "Moderate to major lateral spreading; ejected material often observed" in the 22nd February 2011 earthquake. Site 7 is described as affected by "Severe lateral spreading; ejected material often observed" in both earthquakes. Stretching and cracking due to lateral spreading could create pathways for the liquefied material to eject through to the ground surface. Therefore the prediction of vulnerability to the liquefaction hazard by simplified procedures could be misleading, since it does not include the damage caused by the lateral spreading hazard. It is debatable whether or not lateral spreading case histories should be included in a liquefaction triggering database (Green et al. 2014). The limited case history database of current DMT-based methods may possibly include cases where liquefaction manifested in the form of lateral spreading; therefore such methods were applied at all sites investigated by SDMT in the Christchurch area. Site 3 and Site 7 were selected because of the difference in the profiles of KD, which influences the liquefaction response. It is expected that the values of KD obtained in the SDMT soundings were not significantly influenced by lateral spreading for Site 3. The location of site investigations at Site 3 and Site 7 is shown in Figures 2a and 2b. The results of piezocone (CPTu) and cross hole (CH) tests, as well as borehole logs (BH) and grain size distribution curves, were downloaded from the CGD (2015). The results obtained from CPTu and SDMT are summarized in Figures 3 and 4, which show the borehole logs with the values of fines content (FC), and the profiles with depth of: the corrected cone resistance qt and the soil behavior type index Ic obtained from CPTu; the material index ID, the horizontal stress index KD and the constrained modulus MDMT (Marchetti 1980); the lateral
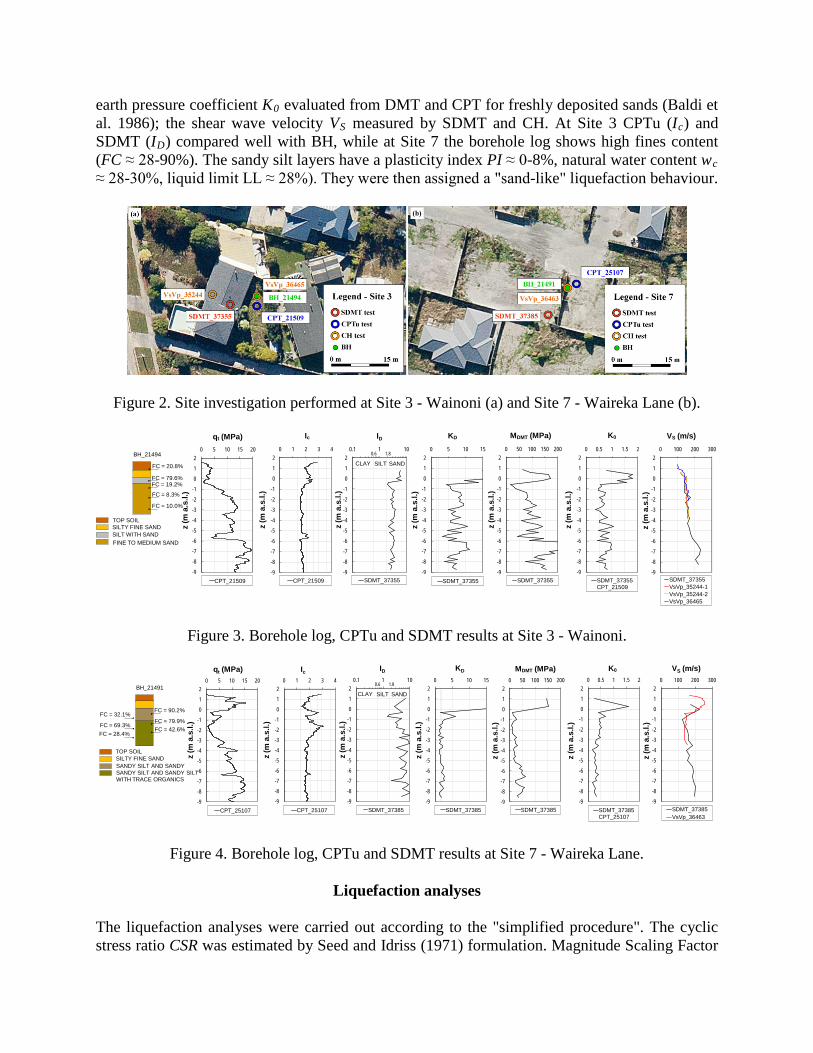
earth pressure coefficient K0 evaluated from DMT and CPT for freshly deposited sands (Baldi et al. 1986); the shear wave velocity VS measured by SDMT and CH. At Site 3 CPTu (Ic) and SDMT (ID) compared well with BH, while at Site 7 the borehole log shows high fines content (FC ≈ 28-90%). The sandy silt layers have a plasticity index PI ≈ 0-8%, natural water content wc ≈ 28-30%, liquid limit LL ≈ 28%). They were then assigned a "sand-like" liquefaction behaviour.
Figure 2. Site investigation performed at Site 3 - Wainoni (a) and Site 7 - Waireka Lane (b).
-9
-8
-7
-6
-5
-4
-3
-2
-1
0
1
20 5 10 15 20
z (m
a.s
.l.)
qt (MPa)
CPT_21509-9
-8
-7
-6
-5
-4
-3
-2
-1
0
1
20 1 2 3 4
z (m
a.s
.l.)
Ic
CPT_21509-9
-8
-7
-6
-5
-4
-3
-2
-1
0
1
20 5 10 15
z (m
a.s
.l.)
KD
SDMT_37355-9
-8
-7
-6
-5
-4
-3
-2
-1
0
1
20 50 100 150 200
z (m
a.s
.l.)
MDMT (MPa)
SDMT_37355-9
-8
-7
-6
-5
-4
-3
-2
-1
0
1
20 0.5 1 1.5 2
z (m
a.s
.l.)
K0
SDMT_37355 CPT_21509
-9
-8
-7
-6
-5
-4
-3
-2
-1
0
1
20 100 200 300
z (m
a.s
.l.)
VS (m/s)
SDMT_37355VsVp_35244-1VsVp_35244-2VsVp_36465
0.6 1.8
-9
-8
-7
-6
-5
-4
-3
-2
-1
0
1
20.1 1 10
z (m
a.s
.l.)
ID
SDMT_37355
CLAY SILT SANDBH_21494
FC = 20.8%
FC = 79.6%FC = 19.2%
FC = 8.3%
FC = 10.0%
TOP SOILSILTY FINE SANDSILT WITH SAND FINE TO MEDIUM SAND
Figure 3. Borehole log, CPTu and SDMT results at Site 3 - Wainoni.
-9
-8
-7
-6
-5
-4
-3
-2
-1
0
1
20 5 10 15 20
z (m
a.s
.l.)
qt (MPa)
CPT_25107-9
-8
-7
-6
-5
-4
-3
-2
-1
0
1
20 1 2 3 4
z (m
a.s
.l.)
Ic
CPT_25107
0.6 1.8
-9
-8
-7
-6
-5
-4
-3
-2
-1
0
1
20.1 1 10
z (m
a.s
.l.)
ID
SDMT_37385
CLAY SILT SAND
-9
-8
-7
-6
-5
-4
-3
-2
-1
0
1
20 5 10 15
z (m
a.s
.l.)
KD
SDMT_37385-9
-8
-7
-6
-5
-4
-3
-2
-1
0
1
20 50 100 150 200
z (m
a.s
.l.)
MDMT (MPa)
SDMT_37385-9
-8
-7
-6
-5
-4
-3
-2
-1
0
1
20 0.5 1 1.5 2
z (m
a.s
.l.)
K0
SDMT_37385 CPT_25107
-9
-8
-7
-6
-5
-4
-3
-2
-1
0
1
20 100 200 300
z (m
a.s
.l.)
VS (m/s)
SDMT_37385VsVp_36463
BH_21491
SANDY SILT AND SANDY
TOP SOILSILTY FINE SAND
SANDY SILT AND SANDY SILT WITH TRACE ORGANICS
FC = 32.1%
FC = 69.3%
FC = 90.2%
FC = 79.9%FC = 42.6%
FC = 28.4%
Figure 4. Borehole log, CPTu and SDMT results at Site 7 - Waireka Lane.
Liquefaction analyses The liquefaction analyses were carried out according to the "simplified procedure". The cyclic stress ratio CSR was estimated by Seed and Idriss (1971) formulation. Magnitude Scaling Factor

(MSF) and shear stress reduction coefficient (rd) were evaluated according to Idriss and Boulanger (2008) for CPTu and DMT data, and according to procedures proposed by Andrus and Stokoe (2000) and Kayen et al. (2013) for VS measurements. The peak horizontal acceleration amax was defined for the 4th September 2010 and the 22nd February 2011 earthquakes (Bradley and Hughes 2012a, 2012b). Table 1 summarizes the parameters that identify the two main shocks at Site 3 and Site 7, including the moment magnitude Mw. The groundwater table levels (GWT) in Table 1 were provided by Tonkin and Taylor Ltd (2013) and CGD (2014).
Table 1. Seismic actions and groundwater table levels at Site 3 and Site 7.
Site 3 - SDMT_37355 (1.22 m asl) Site 7 - SDMT_37385 (1.45 m asl)
Earthquake 04/09/2010 22/02/2011 04/09/2010 22/02/2011
Mw 7.1 6.2 7.1 6.2
amax (g) 0.19 0.41 0.19 0.57
GWT (m asl) 0.32 0.42 0.29 0.45 The cyclic resistance ratio CRR was derived from CPTu and SDMT results, using correlation with the normalized cone tip resistance qc1N (Idriss and Boulanger 2008), the horizontal stress index KD (Monaco et al. 2005, Tsai et al. 2009, Robertson 2012) and the overburden stress corrected shear wave velocity VS1 (Andrus and Stokoe 2000, Kayen et al. 2013), introducing the fines content FC obtained from sieve analyses, in combination with FC estimated from CPT. The CRR-qc1N, CRR-KD and CRR-VS1 correlations were corrected introducing a partial saturation factor (PSF), inferred from compression wave velocity VP (Tsukamoto et al. 2002). VP measurements from CH tests are available on the CGD (2015), and PSF values were evaluated by the Ground Improvement Trials Project (EQC 2013). The influence of the PSF on the results was found to be negligible at Site 3 and very small at Site 7, where the increase in CRR in the topmost 4.50 m was 11 to 26%. Results of the liquefaction analyses for the 22nd February 2011 earthquake are illustrated in Figures 5 and 6. Each diagram shows the profiles with the absolute elevation (z) of: the soil behavior type index Ic or the material index ID; the parameter used in each case for evaluating CRR: qc1N, VS1 or KD; CSR, divided by MSF, compared to CRR; the liquefaction safety factor FL = CRR / (CSR / MSF). The comparison of the results obtained at Site 3 (Figure 5) indicate disagreement between the three methods. qc1N indicates liquefaction at depths from 1 to -1 m and in thin layers from -3.5 to -4 m and -5 to -6 m; VS1 predicts liquefaction from -2 to -6 m and in a thin layer at about -1 m. The CRR-KD correlations by Tsai et al. (2009) and Robertson (2012) predict liquefaction only in a few thin isolated layers at various depths, while the Monaco et al. (2005) correlation appears to overpredict CRR. On the other hand, at Site 7 (Figure 6) all methods based on KD indicate extended liquefaction from -1 to -8 m, in broad agreement with qc1N, while VS1 suggests that much of this layer is not liquefiable. A possible reason for the higher KD (and K0) found at Site 3, is that these sand layers could have become denser due to settlement as a result of repeated liquefaction events, but not dense enough to prevent liquefaction occurrence in a subsequent strong earthquake. Such increase in relative density DR and K0 may have affected KD more than qc1N or VS, in agreement with the available experience (see e.g. Marchetti et al. 2001). Another factor to analyze is the influence of fines content, not taken into account by current CRR-KD correlations, based on clean
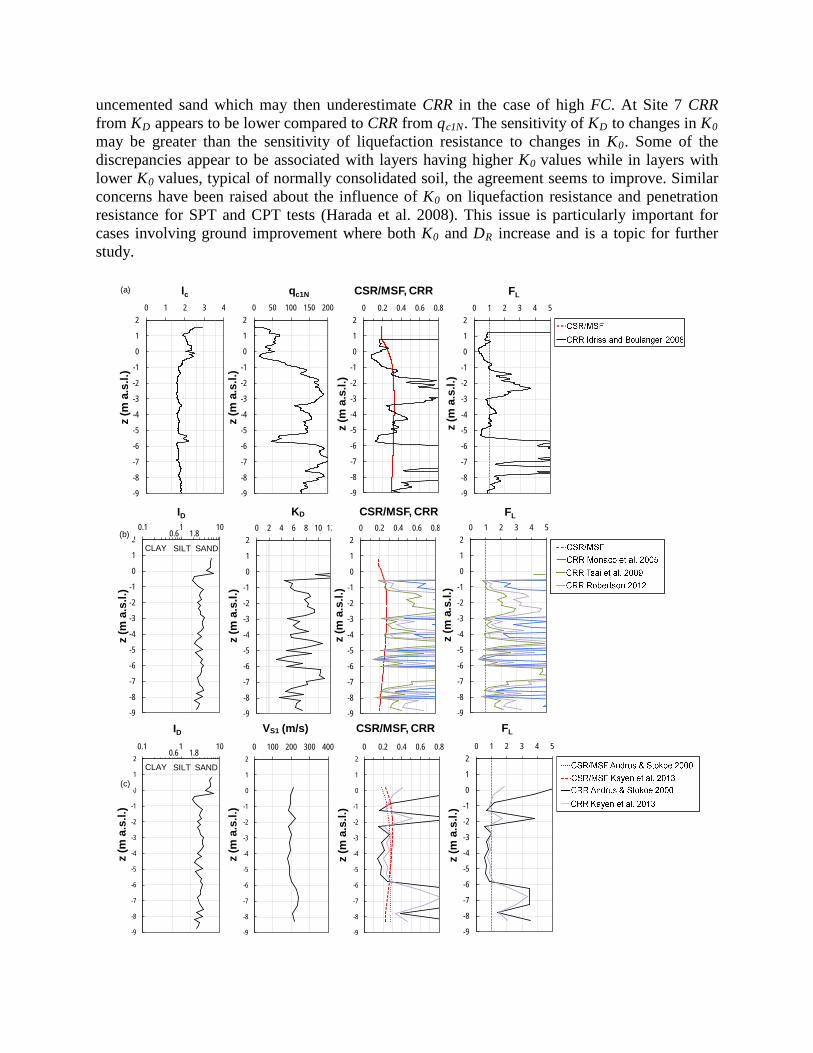
uncemented sand which may then underestimate CRR in the case of high FC. At Site 7 CRR from KD appears to be lower compared to CRR from qc1N. The sensitivity of KD to changes in K0 may be greater than the sensitivity of liquefaction resistance to changes in K0. Some of the discrepancies appear to be associated with layers having higher K0 values while in layers with lower K0 values, typical of normally consolidated soil, the agreement seems to improve. Similar concerns have been raised about the influence of K0 on liquefaction resistance and penetration resistance for SPT and CPT tests (Harada et al. 2008). This issue is particularly important for cases involving ground improvement where both K0 and DR increase and is a topic for further study.
-9
-8
-7
-6
-5
-4
-3
-2
-1
0
1
20 1 2 3 4
z (m
a.s
.l.)
Ic
-9
-8
-7
-6
-5
-4
-3
-2
-1
0
1
20 50 100 150 200
z (m
a.s
.l.)
qc1N
-9
-8
-7
-6
-5
-4
-3
-2
-1
0
1
20 0.2 0.4 0.6 0.8
z (m
a.s
.l.)
CSR/MSF, CRR
-9
-8
-7
-6
-5
-4
-3
-2
-1
0
1
20 1 2 3 4 5
z (m
a.s
.l.)
FL(a)
0.6 1.8
-9
-8
-7
-6
-5
-4
-3
-2
-1
0
1
20.1 1 10
z (m
a.s
.l.)
ID
CLAY SILT SAND
-9
-8
-7
-6
-5
-4
-3
-2
-1
0
1
20 2 4 6 8 10 12
z (m
a.s
.l.)
KD
-9
-8
-7
-6
-5
-4
-3
-2
-1
0
1
20 0.2 0.4 0.6 0.8
z (m
a.s
.l.)
CSR/MSF, CRR
-9
-8
-7
-6
-5
-4
-3
-2
-1
0
1
20 1 2 3 4 5
z (m
a.s
.l.)
FL
(b)
-9
-8
-7
-6
-5
-4
-3
-2
-1
0
1
20 100 200 300 400
z (m
a.s
.l.)
VS1 (m/s)
-9
-8
-7
-6
-5
-4
-3
-2
-1
0
1
20 0.2 0.4 0.6 0.8
z (m
a.s
.l.)
CSR/MSF, CRR
-9
-8
-7
-6
-5
-4
-3
-2
-1
0
1
20 1 2 3 4 5
z (m
a.s
.l.)
FL
0.6 1.8
-9
-8
-7
-6
-5
-4
-3
-2
-1
0
1
20.1 1 10
z (m
a.s
.l.)
ID
CLAY SILT SAND
(c)
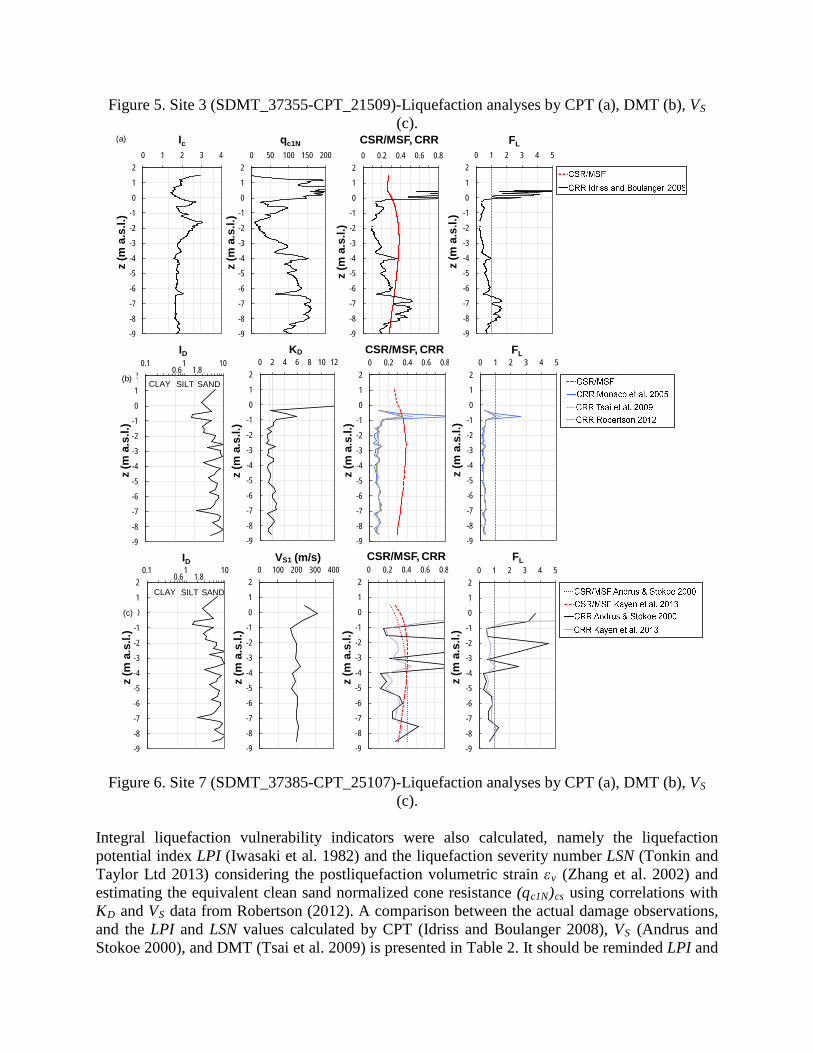
Figure 5. Site 3 (SDMT_37355-CPT_21509)-Liquefaction analyses by CPT (a), DMT (b), VS (c).
-9
-8
-7
-6
-5
-4
-3
-2
-1
0
1
20 1 2 3 4
z (m
a.s
.l.)
Ic
-9
-8
-7
-6
-5
-4
-3
-2
-1
0
1
20 50 100 150 200
z (m
a.s
.l.)
qc1N
-9
-8
-7
-6
-5
-4
-3
-2
-1
0
1
20 0.2 0.4 0.6 0.8
z (m
a.s
.l.)
CSR/MSF, CRR
-9
-8
-7
-6
-5
-4
-3
-2
-1
0
1
20 1 2 3 4 5
z (m
a.s
.l.)
FL
0.6 1.8
-9
-8
-7
-6
-5
-4
-3
-2
-1
0
1
20.1 1 10
z (m
a.s
.l.)
ID
CLAY SILT SAND
-9
-8
-7
-6
-5
-4
-3
-2
-1
0
1
20 2 4 6 8 10 12
z (m
a.s
.l.)
KD
-9
-8
-7
-6
-5
-4
-3
-2
-1
0
1
20 0.2 0.4 0.6 0.8
z (m
a.s
.l.)
CSR/MSF, CRR
-9
-8
-7
-6
-5
-4
-3
-2
-1
0
1
20 1 2 3 4 5
z (m
a.s
.l.)
FL
-9
-8
-7
-6
-5
-4
-3
-2
-1
0
1
20 100 200 300 400
z (m
a.s
.l.)
VS1 (m/s)
-9
-8
-7
-6
-5
-4
-3
-2
-1
0
1
20 0.2 0.4 0.6 0.8
z (m
a.s
.l.)
CSR/MSF, CRR
-9
-8
-7
-6
-5
-4
-3
-2
-1
0
1
20 1 2 3 4 5
z (m
a.s
.l.)
FL
0.6 1.8
-9
-8
-7
-6
-5
-4
-3
-2
-1
0
1
20.1 1 10
z (m
a.s
.l.)
ID
CLAY SILT SAND
(a)
(b)
(c)
Figure 6. Site 7 (SDMT_37385-CPT_25107)-Liquefaction analyses by CPT (a), DMT (b), VS (c).
Integral liquefaction vulnerability indicators were also calculated, namely the liquefaction potential index LPI (Iwasaki et al. 1982) and the liquefaction severity number LSN (Tonkin and Taylor Ltd 2013) considering the postliquefaction volumetric strain εv (Zhang et al. 2002) and estimating the equivalent clean sand normalized cone resistance (qc1N)cs using correlations with KD and VS data from Robertson (2012). A comparison between the actual damage observations, and the LPI and LSN values calculated by CPT (Idriss and Boulanger 2008), VS (Andrus and Stokoe 2000), and DMT (Tsai et al. 2009) is presented in Table 2. It should be reminded LPI and

LSN are not intended to be reliable indicators of vulnerability in case of significant lateral spreading, where alternate measures that include consideration of lateral spreading are required to make an appropriate assessment of liquefaction land damage (van Ballegooy et al. 2014).
Table 2. Comparison of LPI and LSN and actual liquefaction damage observations. The colour scale fits for the observed damage: blue is underpredict, red is over predict, green is reasonable.
Site 3 Site 7
Earthquake 04/09/2010 22/02/2011 04/09/2010 22/02/2011
Observed damage No lateral spreading but
minor to moderate
quantities of ejected material
Moderate to major lateral spreading;
ejected material often observed
Severe lateral spreading;
ejected material often observed
Severe lateral spreading;
ejected material often observed
Predicting damage using CPT data
LPI = 2.98 LPI = 9.94 LPI = 5.99 LPI = 11.29
LSN = 66.88 LSN = 105.76 LSN = 66.40 LSN = 81.79
Predicting damage using VS data
LPI = 1.69 LPI = 10.29 LPI = 2.48 LPI = 17.46
LSN = 13.15 LSN = 20.91 LSN = 11.26 LSN = 29.27
Predicting damage using DMT data
LPI = 0.08 LPI = 2.51 LPI = 20.26 LPI = 44.19
LSN = 1.60 LSN = 9.03 LSN = 89.63 LSN = 94.27
Conclusions The results provided by current SDMT-based simplified procedures at different sites in Christchurch show a variable trend, which depicts the need for further investigation on possible influencing factors (e.g. fines content, cementation, mineralogy, grain shape etc.), as well as on the influence of lateral spreading. The Canterbury earthquakes liquefaction case history database offers a valuable opportunity to enlarge the data set used to develop the existing CRR-KD correlations. It appears that no current method can accurately predict liquefaction at every site. It is suggested that an approach involving various investigation methods is used for higher risk projects. Further research is required to understand better the influence of K0.
Acknowledgments Special thanks to Dr. van Ballegooy and Tonkin and Taylor Ltd, and to Prof. Cubrinovski (University of Canterbury), for allowing this research and making it possible. The reviewers are also greatfully acknowledged for providing valuable comments and suggestions. This study was funded by US NSF grant no. CMMI-1408892 to Brigham Young University, and Ground Investigation Ltd. The results do not necessarily reflect the views and opinions of the sponsors.
References

Andrus RD, Stokoe KH II. Liquefaction resistance of soils from shear-wave velocity. J. Geotech. Geoenviron. Eng., ASCE 2000; 126(11): 1015-1025.
Baldi G, Bellotti R, Ghionna V, Jamiolkowski M, Marchetti, Pasqualini E. Flat Dilatometer Tests in Calibration Chambers. Proc. In Situ '86, ASCE Spec. Conf. on Use of In Situ Tests in Geotechn. Engineering, Virginia Tech, Blacksburg, VA, June, ASCE Geotechn. Special Publ. 1986; 6: 431-446.
Bradley BA, Hughes M. Conditional Peak Ground Accelerations in the Canterbury Earthquakes for Conventional Liquefaction Assessment, Technical Report for the MBIE, April 2012 2012a; 22p.
Bradley BA, Hughes M. Conditional Peak Ground Accelerations in the Canterbury Earthquakes for Conventional Liquefaction Assessment: Part 2, Technical Report for the MBIE, December 2012 2012b; 19p.
Canterbury Geotechnical Database - CDG. CPT and CH data taken from the CDG. https://canterburygeotechnicaldatabase.projectorbit.com/ 2015.
Canterbury Geotechnical Database - CDG. Event Specific Groundwater Surface Elevations. Map Layer CGD0800 - 10 June 2014, retrieved [date] from https://canterburygeotechnicaldatabase.projectorbit.com/ 2014.
Canterbury Geotechnical Database - CDG. Liquefaction and Lateral Spreading Observations. Map Layer CGD0300-11 Feb 2013, retrieved [date] from https://canterburygeotechnicaldatabase.projectorbit.com/ 2013.
EQC. Ground Improvement Trials Project, Draft Project Resources 2013 (under preparation).
Green RA, Cubrinovski M, Cox B, Wood C, Wotherspoon L, Bradley B, Maurer B. Select Liquefaction Case Histories from the 2010-2011 Canterbury Earthquake Sequence. Earthquake Spectra 2014; 30(1), 131-153.
Harada K, Ishihara K, Orense RP, Mukai J. Relations between penetration resistance and cyclic strength to liquefaction as affected by Kc-conditions. Proc. Geotech. Earth. Engrg. and Soil Dynamics IV 2008; 12 pp.
Idriss IM, Boulanger RW. Soil liquefaction during earthquakes. EERI Report, Publ. No. MNO-12, Earthquake Engineering Research Institute 2008.
Iwasaki T, Tokida K, Tatsuoka F, Watanabe S, Yasuda S, Sato H. Microzonation for soil liquefaction potential using simplified methods. Proc. 3rd Int. Conf. on Microzonation, Seattle 1982; 3, 1319-1330.
Kayen R, Moss R, Thompson E, Seed R, Cetin K, Kiureghian A, Tanaka Y, Tokimatsu K. Shear-Wave Velocity-Based Probabilistic and Deterministic Assessment of Seismic Soil Liquefaction Potential. J. Geotech. Geoenviron. Eng., ASCE 2013; 139(3), 407-419.
Marchetti S, Monaco P, Totani G, Calabrese M. The Flat Dilatometer Test (DMT) in Soil Investigations – A Report by the ISSMGE Committee TC16. Proc. Int. Conf. on Insitu Meas. Soil Prop. and Case Hist., Bali 2001; 41 pp.
Marchetti S. In Situ Tests by Flat Dilatometer. J. Geotech. Engrg. Div., ASCE 1980; 106 (GT3): 299-321.
Monaco P, Marchetti S, Totani G, Calabrese M. Sand liquefiability assessment by Flat Dilatometer Test (DMT). Proc. XVI ICSMGE, Osaka 2005; 4: 2693-2697.
Robertson PK. The James K. Mitchell Lecture: Interpretation of in-situ tests – some insights. Proc. 4th Int. Conf. on Geotechnical and Geophysical Site Characterization – ISC'4, Porto de Galinhas, Brazil 2012; 1: 3-24.
Seed HB, Idriss IM. Simplified procedure for evaluating soil liquefaction potential. J. Geotech. Engrg. Div., ASCE 1971; 97(9), 1249–1273.
Tonkin and Taylor Ltd. Liquefaction Vulnerability Study. Report to Earthquake Commission, Tand T ref. 52020.0200/v1.0, prepared by S. van Ballegooy and P. Malan, available at https://canterburygeotechnicaldatabase.projectorbit.com 2013.
Tsai P, Lee D, Kung GT, Juang CH. Simplified DMT-based methods for evaluating liquefaction resistance of soils. Engineering Geology 2009; 103: 13-22.
Tsukamoto Y, Ishihara K, Nakazawa H, Kamada K, Huang Y. Resistance of partly saturated sand to liquefaction with reference to longitudinal and shear wave velocities. Soils and foundations 2002; 6(2): 93-104.
van Ballegooy S, Malan P, Lacrosse V, Jacka ME, Cubrinovski M, Bray JD, O’Rourke TD, Crawford SA, Cowane H. Assessment of Liquefaction-Induced Land Damage for Residential Christchurch. Earthquake Spectra 2014;

30(1), 31-55.
Zhang G, Robertson PK, Brachman, RWI. Estimating liquefaction induced ground settlements from CPT for level ground. Canadian Geotechnical Journal 2002: 39(5): 1168-1180.