Embed Size (px)
Citation preview

SEISMIC INVESTIGATION, KINOYA SEWER OUTFALL LAUCALA BAY, FIJI
Robert Smith SOPAC Technical Secretariat
September 1998 SOPAC Technical Report 267

[2]
[TR267 — Smith]
[3]
[TR267 — Smith]
TABLE OF CONTENTS
Page
SUMMARY...................................................................................................................... 5 INTRODUCTION AND OBJECTIVE ............................................................................... 6 Geology..................................................................................................................... 7 Previous Work ......................................................................................................... 7 EQUIPMENT & METHODS............................................................................................. 7 Navigation Control .................................................................................................... 7 Bathymetry................................................................................................................ 8 Geophysical Profiling ................................................................................................ 8 RESULTS........................................................................................................................ 8 Navigation and base map compilation ...................................................................... 8 Bathymetry.............................................................................................................. 11 Seismic Interpretation ............................................................................................ 11 CONCLUSION .............................................................................................................. 15 RECOMMENDATIONS ................................................................................................. 16 REFERENCES.............................................................................................................. 17

[4]
[TR267 — Smith]
LIST OF FIGURES
Figure 1 Location map of the area surveyed .................................................................... 6 2 Seismic and bathymetric profiles ........................................................................ 9 3 Bathymetry of surveyed area ........................................................................... 10 4 Seismic profile of Suva Marl in cross section ................................................... 12 5 Seismic interpretation depth to bedrock ........................................................... 14

[5]
[TR267 — Smith]
SUMMARY
This report describes results of a field survey primarily to assess depth to bedrock in the vicinity of the Kinoya sewer outfall located in Laucala Bay. The survey involving the acquisition of geophysical data was conducted by the South Pacific Applied Geoscience Commission (SOPAC) on the 13th of August 1998. The main conclusions of the field study are as follows:
• In seismic-reflection data, the Suva Marl’s acoustic signature is one of high
amplitude, having excellent continuity forming bands of equally spaced parallel reflections that are representative of the bedding which can been seen in many road cuttings throughout Suva.
• In the seismic profiles, zones of gas in the shallow muds smear or blank out data below where the gas occurs, and as a result the top of the Suva Marl cannot be easily defined or identified.
• In a line paralleling the pipeline but displaced 134 m to the west, the top of the Suva Marl is clearly defined.
• In the area surveyed 100 m seaward of the shoreline the top of the Suva Marl occurs within 26 m of the sea-bed, dipping to about 52 m at 1.2 km offshore.
• The gas blanking seen in the seismic data is often associated with shallow marine muds and sands that are found in the nearshore and is a result of decaying organic material trapped during deposition.
• Although gas blanking was considered to be a problem, results from this survey indicate that the gas areas are localised and do not blanket the whole area.
The major recommendations include the following: • The seismic interpretation of depth to the top of bedrock is based on an assumed
velocity for the subsurface sediment and therefore requires validation with borehole data.
• The interpretation of seismic data is an excellent prerequisite for developing a borehole program to delineate the top of the marl, hence a more-detailed seismic- reflection program for the area should be considered.

[6]
[TR267 — Smith]
INTRODUCTION AND OBJECTIVE Feasibility studies on alternatives for the existing Kinoya sewer outfall, here and later, Figure1, in Laucala Bay for the City of Suva are currently being investigated. As part of this study the Public Works Department requested a reconnaissance seismic-reflection survey to delineate if at all possible the top of Suva Marl within the sedimentary sequence in the nearshore of Laucala Bay. This report provides an account of the activities and the results of a field survey undertaken. The primary objective of the survey using continuous seismic-reflection techniques was to locate depth to “bedrock equivalent” in the vicinity of the Kinoya sewer outfall.
Figure 1. Location map of the area
[7]
[TR267 — Smith]
Geology From the 1:50 000 geological mapping (Ibbotson 1960) it is shown that the Suva Marl, a geological unit, is considered bedrock in the Suva region forming the bulk of Suva peninsula. The Nakasi beds, not as of yet formally defined, overlies the Suva Marl disconformably along the Waimanu River and borders the Rewa Delta as far south as Nakasi The sequence is mainly a sandstone, commonly fined grained, usually not well-bedded except near the base. The depositional environment for the Nakasi beds was a shallow shelf similar to that seen existing today in the Rewa Roads. Typical water depth of deposition was in the order of 10 to 50 m. The Nakasi beds are abundant in fossils, mollusca predominating, but clasts of colonial corals, solitary corals, algae, otoliths, and benthic and sparse planktonic foraminifera also occur. In an exposure at Waila, folded and faulted Nakasi beds are evident, indicating that tectonism has affected the unit (Rodda 1993). The Nakasi beds during the last sea-level low were subaerially exposed, eroded and deeply incised by river channels, resulting in a highly irregular erosion surface. This is can be seen in seismic records from Laucala Bay (Smith 1984). Previous Work Apart from seismic studies completed in the mid 1980s (Smith 1984), little is known about the subsurface structure of bedrock in the area adjacent to the Kinoya outfall. In seismic-reflection data typically the Suva Marl is easily recognised by the its distinct parallel, often highly continuous reflectors. This same effect can be clearly seen in numerous cross-section cuts inland around the Suva peninsula.
EQUIPMENT & METHODS Navigation Control Navigation control was accomplished with a Del Norte 1009+ microwave/DGPS digital distance measuring unit. Calibration for microwave navigation was calculated over a known range and the calibration factors recorded and checked on both days of the course of the survey. Positions were annotated on both graphic recorders and the digital position and depth logged by the Del Norte 1009+. A position interval fix of 10 seconds was used for the duration of the survey. Real-time differentially corrected GPS positions

[8]
[TR267 — Smith]
accurate to less than 1 sigma indicate a positional error of ±1 m. Map coordinates are based on WGS 1972 spheriod, FMG (Fiji Map Grid) a UTM projection with false coordinates of 2, 000, 000 m E and 4, 000, 000 m N for an origin at 178° 45 E and 17° S. The reference station for real time DGPS was set on an established position located on the roof of the Maritime school in Laucala Bay. Bathymetry An Odom echotrac precision echo sounder provided both analogue and digital records of bathymetric information within the area of investigation. Digital bathymetric data were logged and processed with the Del Norte 1009 microwave/DGPS digital distance-measuring unit. A digibar was used to calibrate the echo sounder. A sound velocity in water of 1495 m s-1 was used. All bathymetric data acquired during the survey are reduced to chart datum based on tidal predictions found in the 1998 Fiji Nautical Almanac . Geophysical Profiling Continuous seismic-reflection profiling was carried out concurrently with the bathymetric profiling. An advantage of seismic reflection is that it provides a continuous cross-section of the river bed and the sub-bottom geology. The unit used was a Datasonics bubble- pulse SPR 1200 profiling unit with a peak frequency centred around 400 Hz. A filter window of 50–1000 Hz was used to permit deeper penetration and resolution of the geometry of the subsurface, in particular strata that could be interpreted to be bedrock or a bedrock equivalent. The bubble-pulse profiling unit is able to achieve deeper penetration, in particular through gravel and sands of a sedimentary sequence, at the expense of not acquiring data of a higher bed resolution at shallower depths. Analogue data representing the geological cross-sections of the seismic profiles were recorded on a three-channel EPC 4800 graphic recorder.
RESULTS
Navigation and base map compilation Computed positional data were plotted in Autocad R14 on a FMG base map of Suva Peninsula and surrounding environment. The processed data file is available as an ASCII txt file tab delimited. Contouring of datasets was with Quicksurf, a third party

[9]
[TR267 — Smith]
software running inside Autocad. Resulting digital maps drawn can be provided as a DWG or DXF or files. Actual track profile locations are illustrated in Figure 2.
Figure 2:Seismic and bathymetry profiles location map. Each dot represents a geographical position fix with x,y, z and time variables.
[10]
[TR267 — Smith]
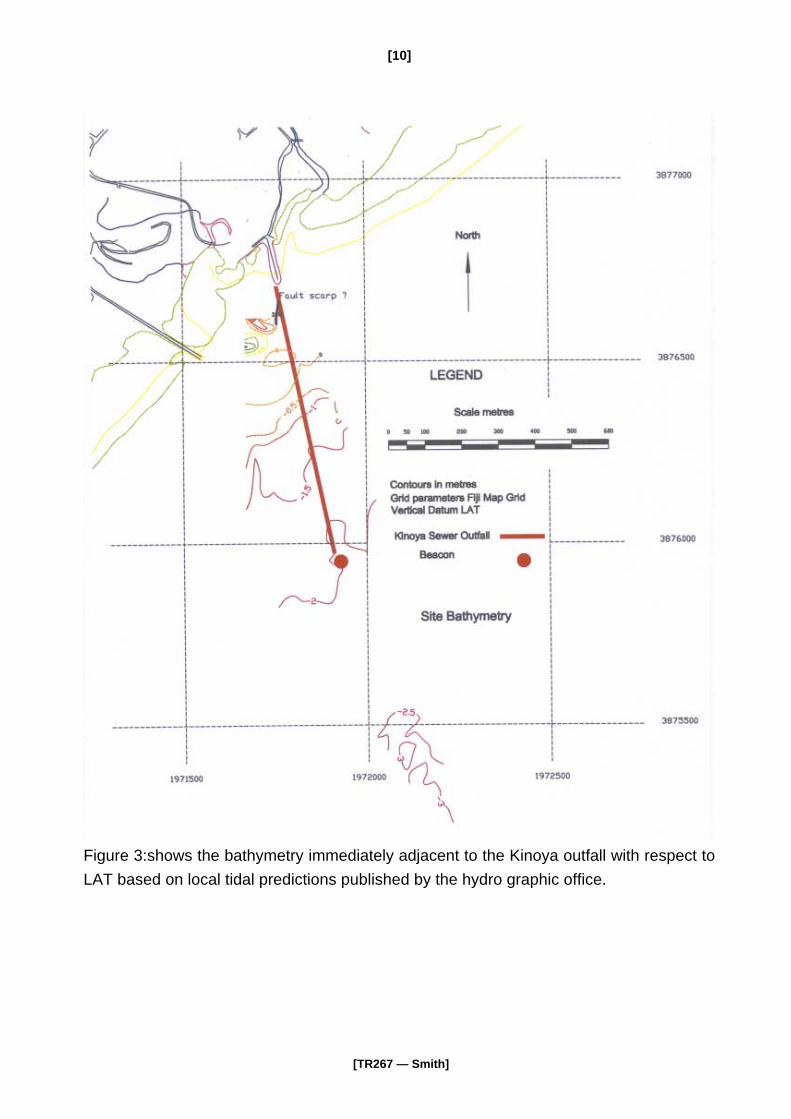
Figure 3:shows the bathymetry immediately adjacent to the Kinoya outfall with respect to LAT based on local tidal predictions published by the hydro graphic office.

[11]
[TR267 — Smith]
Bathymetry The bathymetry of the survey area is shown in figure 3. All data have been reduced to Chart Datum, 0.97 m below MSL. The inshore area dries at low tide, which required the survey to be completed at high tide to achieve the necessary coverage. Water depth ranged from a high of 0.74 m above datum to –3.4 m below datum for an average depth of 2.9 m. Seismic Interpretation Four lines parallel to the outfall and one cross-track line were surveyed. The locations of the seismic profiles are shown in figure 2. In the compilation of the track plot as shown in figure 2 the numbers correspond to a fix, or event mark, which are annotated on the seismic analogue and bathymetry records at a time the position is recorded digitally. The actual seismic data in cross-section are recorded as a function of two-way travel time, and conversion to depth is by assuming a sediment velocity and multiplying one-way time by this factor. In this instance a sediment velocity of 1500 m s-1 was used. Interpretation of geology from the seismic records follows, with mapping of a particular horizon which can be traced throughout the profiles, with the position or time elevation of the mapped horizon cross checked at line intersections where one seismic line crosses another. On completion of the interpretation, for each fix position, a measurement of time with respect to “0”, time to the traced line of the interpreted horizon is converted to a depth in metres based on the assumed sediment velocity. These values are then plotted for contouring. In cross-section the seismic-reflection profiles under ideal conditions reflect subsurface geology in the form of continuous, or semi-continuous bands of reflectors representing strata that are interpreted geologically. This is due to the fact that each geological horizon or unit will often display a reflection characteristic determined by the make up of the unit. Experience gained from numerous seismic surveys in Suva Harbour and Laucala Bay Smith (1984), Armstrong (1993), has shown that Suva Marl’s acoustic signature is one of high amplitude, having excellent continuity forming bands of equally spaced parallel reflections that are representative of the bedding. Classic examples of this bedding can be seen in many road cuts around Suva. An example of the marls’ acoustic signature is shown in Figure 4.

[12]
[TR267 — Smith]
Figure 4:is a profile section from the seismic – reflection data between fix positions 264 and 281 shown in the track plot in figure 2.Depth below seabed is calculated from two way travel time based on a two way travel velocity of 1500m/sec. Suva Marl’s acoustic signature is one of high amplitude, having excellent continuity forming bands of equally spaced parallel reflections that are representative of the bedding that can be seen in many road cuttings throughout Suva. Lying disconformally on the marl is the Nakasi beds a sequence of mainly sandstones, commonly fined grained, usually not well-bedded except near the base. Prograding deltaic muds and clays are also evident also in the upper left of the section. Holocene deposits of parallel bedded fine sand and mud complete the sequence to the seabed.

[13]
[TR267 — Smith]
Internal deformation, folding and faulting in the bedding of the Suva Marl is also often recognised . In contrast, the acoustic signature of the Nakasi beds is one of variable amplitude, bedding appears as semi – continuous reflectors, and the top horizon of the unit often exhibits a highly irregular surface due to subaeriel erosion following the Late Pleistocene low sea-level stand. From the five seismic profiles, mapping of the interpreted horizon for the top of the bedrock the subsurface is shown in figure 5. Interpreted from the contours for the top of bedrock, the Suva Marl (figure 5) in the nearshore is some 26 m below the sea-bed 100 m from the shoreline and at the seaward end of the survey the marl is some 70 m below sea-bed. Folding and faulting and some evidence of subaerial erosion are evident in parts of the seismic profile data. In figure 4 the presence of weak to faint parallel bedding in a sequence immediately above the marl in the seismic section shown in figure 4 may be the Nakasi beds. In a number of areas, interpretation of the seismic data is complicated by the presence of gas within the sediments, that either smears or totally blanks data on what lies beneath the gas areas. The gas is generated from decaying organic material trapped in the sediment during deposition. However indications are that from this survey the gas areas are localised and do not blanket the whole area, therefore do not pose a problem for the acquisition of interpretable data. Faulting is inferred in one location at shot point 237, the location of which is shown in figure 5. Other evidence in the seismic data to show that bedrock has been structurally altered can be seen by the apparent folding and radical dip changes in the internal reflection patterns of the bedding of the Suva Marl. Also noted but not mapped in the profiles were buried patch reef structures.

[14]
[TR267 — Smith]
Figure 5:shows the interpretation of depth to bedrock, that is top of the Suva Marl based on the seismic reflection data.
[15]
[TR267 — Smith]
CONCLUSION
• In the seismic-reflection data, the Suva Marl’s acoustic signature is one of high
amplitude, having excellent continuity forming bands of equally spaced parallel reflections that are representative of the bedding.
• In the seismic profiles, zones of gas in the shallow muds smear or blank out data below where the gas occurs, and as a result the top of the Suva Marl cannot be easily defined or identified.
• A second line paralleling the pipeline but displaced 134 m to the west, defines the top of the Suva Marl well. At the shore end of this profile the top of the Suva Marl occurs within 26 m of the sea-bed. Seaward of this the top of the marl is as deep as 52 m
• The gas blanking seen in the seismic data is often associated with shallow marine muds and sands that are found in the nearshore and is produced by decaying organic material trapped during deposition.
• Although gas blanking was considered to be a problem, results from this survey indicate that the gas areas are localised and do not blanket the whole area.
• The seismic unit with bedding of variable amplitude, semi-continuous to continuous parallel reflectors, above the marl in the seismic section shown in figure 4, may be interpreted as the Nakasi beds.
[16]
[TR267 — Smith]
RECOMMENDATIONS
• The seismic interpretation for depth to the top of bedrock is based on an assumed
velocity for the sediment and requires validation with borehole data. • The interpretation of seismic data is an excellent prerequisite for developing a
borehole program to delineate the top of the marl, hence a more-detailed seismic-reflection program for the area should be considered.

[17]
[TR267 — Smith]
REFERENCES
Armstrong, J. 1993. Seismic stratigraphy, sedimentology and Holocene evolution of the Rewa Estuary, Fiji. Queensland University of Technology Thesis. Fiji nautical Almanac, 1998. Published By The Hydrographic Office, Marine department Suva, Government of Fiji. Ibbotson, P. 1960. Geology of the Suva area, Viti Levu. Fiji Geological Survey Bulletin, 3(47) 7 plates, 4 figures plus separate multicoloured geological map, scale 1:50 000. Rodda, P. Notes for Geological excursion of the Suva area for the STAR/SOPAC meeting 1993, MRD BP Note BP1/106. Smith R., 1984, (unpublished) Interpretation of reflection seismic form Nasese channel and Laucala Bay. MRD BP Note 35/5).