Embed Size (px)
Citation preview

SECED 2015 Conference: Earthquake Risk and Engineering towards a Resilient World 9-10 July 2015, Cambridge UK
1 Research Scholar, Indian Institute of Technology Roorkee, Roorkee, India, [email protected] 2 Professor, Indian Institute of Technology Roorkee, Roorkee, India, [email protected] 3 Senior Advisor, NORSAR, Kjeller, Norway, [email protected]
SEISMIC FRAGILITY ANALYSIS OF HILL-BUILDINGS IN INDIAN HIMALAYAS
Mitesh Surana1, Yogendra Singh2 and Dominik H Lang3
Abstract: During extensive field surveys in the state of Uttarakhand (India) the most prevalent configurations of buildings on slopes have been identified, which can be broadly identified as step-back, and step- and set-back configurations. In addition, for buildings on steep rock slopes, foundations resting at two different levels can often be observed. The present study focuses on the seismic fragility analysis of step-back hill buildings, which is the most commonly found configuration in the Indian Himalayas. The Incremental Dynamic Analysis procedure is used for obtaining dynamic capacity curves, which are used for fragility analysis. A set of 30 ground motion time histories has been selected and scaled using the intensity measure Sa (T1, 5%). It is observed that the hill buildings designed as per the existing code provisions for buildings on flat topography exhibit a very high probability of incipient collapse for the DBE and MCE levels of seismic demand. The performance can be significantly improved by making minor changes in the structural configuration. 1. Introduction
The Indian Himalayas have mountain ranges from Jammu and Kashmir in north to the Arunachal Pradesh in north-east covering the states of Himachal Pradesh, Uttarakhand, Meghalaya, Manipur, Nagaland, Mizoram, Tripura, Sikkim, Assam and West Bengal. These regions have faced several disastrous earthquakes in the past century i.e. Kangra earthquake (1905); Bihar and Nepal earthquake (1934); Assam earthquake (1950); Bihar and Nepal earthquake (1988); Uttarkashi earthquake (1991); Chamoli earthquake (2005) and Sikkim earthquake (2011). The Sikkim earthquake (2011) has exposed the seismic vulnerability of multi-storey buildings in Indian Himalayas. It has been reported (Sharma et al., 2011) that during Sikkim earthquake (2011) (Moment Magnitude, Mw = 6.9 and Peak Ground Acceleration, PGA = 0.18g) many buildings suffered severe damage and a few buildings collapsed. The Sikkim state is situated in Zone-IV as per seismic zoning map of India, which has expected EPGA (Zone Factor) of 0.24g but the damage observed at 0.18g PGA was much higher than expected, which may be attributed to the irregular configurations of the these buildings.
During extensive field surveys in the Indian Himalayas, the most prevalent configurations of buildings on slopes were identified, which can be broadly identified as step-back, and step- and set-back configurations. In addition, for buildings on steep slopes, foundations resting at two largely different levels can be often observed. These buildings have large differences in the location of centre of mass and centre of stiffness which also change along the height of the building; resulting in a complex response under seismic excitation. Birajdar and Nalawade (2004); Pandey et al., (2011); Halkude et al., (2013); Patro et al., (2013) and Sreerama and Ramancharla (2013) have studied different hill building configurations using response spectrum analysis and non-linear static analysis. They suggested that in hill buildings, the ground supported columns are prone to shear failure due to very high rigidity of the columns. Further, the step- and set-back building configuration is the most suitable configuration in hilly areas since it is subjected to minimal torsional effects. Singh et al., (2012) have studied the dynamic response of hill buildings compared with that of regular buildings in terms of period of vibration, pattern of inter-storey drift, column shear and pattern of yielding using linear and non-linear dynamic analyses. They concluded that the hill buildings are subjected to significant torsion in cross-slope direction, while in along slope
M Surana1, Y Singh2 and D H Lang3
2
direction, the varying height of columns causes stiffness irregularity. They have also concluded that for the excitation along the slope, almost total storey shear is resisted by short columns. Rao et al., (2013) studied step-back configuration of hill buildings designed for gravity loading and special moment resisting frame. They concluded that the collapse in hill buildings occurs mostly due to shear failure of short columns. Further, in the step-back configuration subjected to bidirectional ground motions, the maximum inter-story drift is not necessarily in the direction of the application of the major component.
The present study focuses on the seismic design and fragility analysis of step-back configuration, which is the most commonly found building configuration in Indian Himalayas. Three different building models have been considered which include gravity load designed buildings (GLD) with short columns, special moment resisting frame (SMRF) buildings with short columns and special moment resisting frame (SMRF) buildings with normal height columns. Further, for the Indian seismic design code capping on the design period is a crucial issue (Khose et al., 2012) governing the seismic performance of buildings designed for Indian codes. However, empirical expressions for estimation of fundamental period used for capping are not available for hill building configurations. In the present study, a methodology for capping on the design period has been developed and used for design of hill buildings. The bidirectional Incremental Dynamic Analysis (IDA) procedure has been used in order to develop dynamic capacity curves and fragility functions for incipient collapse.
2. Incremental dynamic analysis Seismic response of an inelastic structure can be most reliably estimated using non-
linear time-history (dynamic) analysis (NLTHA) procedure. To estimate the seismic capacity of a structure, NLTHA is performed with gradually increasing the intensity of the input excitation until the structure finally collapses. The procedure is called Incremental Dynamic Analysis (IDA) and is considered a very powerful tool for fragility analysis, as it enables direct estimation of the record-to-record (inter-event) variability in structural response. In the past decade, various groups (Vamvatsikos and Cornell, 2002; and Shakib and Pirizadeh, 2014) have performed IDA for buildings of both regular and irregular configurations. They have used suites of ground motion records, each scaled to a certain level of seismic intensity in order to cover the full range of structural behaviour from elastic to inelastic and finally to global dynamic instability (Vamvatsikos and Cornell, 2002). For each ground motion record, the output of the IDA can be expressed in the form of a dynamic capacity curve, representing the variation of the chosen Intensity measure (IM) (e.g. spectral acceleration, Sa, peak ground acceleration, PGA, base shear, Vb etc.) with the engineering demand parameter (EDP) (e.g. spectral displacement, Sd, roof displacement, Δroof , maximum inter-storey drift, θMax, etc.).
2.1 Selection of Ground Motion Records
The selection of ground motion records plays an important role in order to achieve reasonably accurate results with a limited number of analyses. In general, IDA capacity curves exhibit large record-to-record variability; hence a suite of records is utilized in order to get reasonable estimation of seismic response. The ground-motion records are selected on the basis of three main parameters, i.e. earthquake magnitude (Mw), source-to-site distance (R), and number of records (N) applied as presented in Table 1.
TABLE 1 Earthquake ground motion selection criteria.
Group Magnitude (Mw)
Source-to-site distance (R)
Number of records (N)
Shome et al. [1998] 6.5 - 6.9 - 20 Maniyar and Khare [2011] 5.4 - 6.9 0 – 90 km 20 Vamvatsikos and Cornell [2002] 6.5 - 6.9 Moderate distances 20 Shakib and Pirizadeh [2013] 6.0 - 7.4 Moderate distances 20 FEMA P695 [2009] >6.5 > 10 km -

M Surana1, Y Singh2 and D H Lang3
3
In the present study, thirty records have been selected from the PEER database (PEER, 2010) for earthquakes with magnitude Mw >6.5 and source-to-site distances R>10 km (Table 2).
TABLE 2 The suite of ground motion records with major and minor component used herein. (Records have been selected from the PEER database [PEER, 2010].)
No. Event Station Vs,301
(m/s) NEHRP
site class
Mw2 Rjb
3
(km) PGA Major
(g)
PGA Minor
(g)
1 Imperial Valley-06, 1979 Calipatria Fire Station 205.3 D 6.5 23.2 0.133 0.077 2 Imperial Valley-06, 1979 Compuertas 274.5 D 6.5 13.5 0.194 0.124 3 Superstition Hills-02, 1987 Plaster City 345.4 D 6.5 22.2 0.193 0.125 4 Superstition Hills-02, 1987 Wildlife Liquef. Array 207.5 D 6.5 23.9 0.207 0.185 5 San Fernando, 1971 Fairmont Dam 684.9 C 6.6 25.6 0.114 0.055 6 San Fernando, 1971 Lake Hughes #12 602.1 C 6.6 14.0 0.365 0.280 7 Northridge-01,1994 Burbank Howard Rd. 821.7 B 6.7 15.9 0.143 0.119 8 Northridge-01,1994 LA - Griffith Park 1015.9 B 6.7 21.2 0.252 0.216 9 Spitak- Armenia, 1988 Gukasian 274.5 D 6.8 24.0 0.222 0.189 10 Irpinia- Italy-01, 1980 Bisaccia 1000 B 6.9 17.5 0.122 0.062 11 Irpinia- Italy-01, 1980 Calitri 600 C 6.9 13.3 0.186 0.139 12 Kobe- Japan, 1995 Kakogawa 312 D 6.9 22.5 0.356 0.175 13 Kobe- Japan, 1995 Shin-Osaka 256 D 6.9 19.1 0.271 0.187 14 Loma Prieta, 1989 Gilroy Array #6 663.3 C 6.9 17.9 0.180 0.163 15 Loma Prieta, 1989 UCSC 714 C 6.9 12.2 0.374 0.311 16 Cape Mendocino, 1992 Fortuna - Fortuna Blvd 457.1 C 7.0 16.0 0.125 0.117 17 Cape Mendocino, 1992 Shelter Cove Airport 513.7 C 7.0 26.5 0.238 0.177 18 Hector Mine, 1999 Hector 684.9 C 7.1 10.3 0.336 0.305 19 Duzce- Turkey, 1999 Lamont 1061 481 C 7.1 11.5 0.126 0.112 20 Duzce- Turkey, 1999 Bolu 326 D 7.1 12.0 0.785 0.775 21 Landers, 1992 Joshua Tree 379.3 C 7.3 11.0 0.288 0.268 22 Landers, 1992 Yermo Fire Station 353.6 D 7.3 23.6 0.223 0.222 23 Kocaeli- Turkey, 1999 Arcelik 523 C 7.5 10.6 0.217 0.152 24 Kocaeli- Turkey, 1999 Duzce 276 D 7.5 13.6 0.375 0.283 25 Chi-Chi- Taiwan, 1999 CHY025 277.5 D 7.6 19.1 0.160 0.153 26 Chi-Chi- Taiwan, 1999 CHY035 555.2 C 7.6 12.6 0.278 0.261 27 Friuli- Italy-01, 1976 Tolmezzo 424.8 C 6.5 15.0 0.386 0.318 28 San Fernando, 1971 Lake Hughes #4 821.7 B 6.6 19.4 0.192 0.154 29 Loma Prieta, 1989 Coyote Lake Dam 295 D 6.9 20.4 0.185 0.160 30 Northridge-01, 1994 Beverly Hills -12520 545.7 C 6.7 12.4 0.594 0.467
1 Average shear wave velocity of the upper 30m of soil 2 Moment Magnitude Mw 3 Joyner-Boore horizontal distance to the surface projection of the rupture
2.2 Scaling of Ground Motion Records
The actual ground motions which are recorded at different sites have different characteristics in terms of peak ground acceleration (PGA), frequency content and duration. The time domain scaling of ground-motion records alters their PGA while the duration and frequency content remains unaltered. The ground-motions are either scaled up or down depending on the structure’s capacity to the intensity level which causes the dynamic instability. FEMA P695 (2009) states that scaling with respect to peak ground velocity (PGV)

M Surana1, Y Singh2 and D H Lang3
4
is a simple way to remove unwarranted variability between records due to inherent differences in event magnitude, source-to-site distance, source type and site condition. It recommends a two-step methodology for scaling of ground motions. The individual records are first normalized by their respective peak ground velocity, which is the geometric mean of the two horizontal components. In the second step, the median of the normalized record set is scaled upward or downward with respect to Sa (T1, 5%). The scaling methodologies are summarized in Table 3.
In the present study, Sa (T1, 5%) has been used as scaling parameter. The minor component has been scaled with the same factor as major component in order to maintain the ratio of the two components.
TABLE 3 Scaling of earthquake ground motion records
Group Scaling methodology
Vamvatsikos and Cornell [2002] With respect to spectral acceleration at fundamental period T1 i.e. Sa (T1, 5%).
Shakib and Pirizadeh [2013] With respect to geometric mean of spectral acceleration for a period range of 0.5T1 - 1.5T1, i.e. Sa,GM (0.5T1-1.5T1, 5%).
FEMA P695 [2009] Normalization of records with respect to peak ground velocity and scaling of median of normalized record.
2.3 Engineering Demand Parameters
The structure’s estimated performance (or damage pattern), corresponding to a given intensity of ground motion, is represented by the engineering demand parameters (EDP). Vamvatsikos and Cornell (2002) suggested that the selection of EDP depends on the fact whether structural or non-structural performance is to be evaluated. Maximum inter-storey drift ratio (θMax), roof drift ratio (θRDR), and roof displacement (Δroof) are some of the parameters that are well correlated with structural performance and global dynamic instability.
The objective of the present study is to estimate collapse probability, for considered building models. Therefore, Sa (T1, 5%), defined as spectral acceleration corresponding to fundamental period in the direction of application of major component, and (θMax) defined as the maximum inter-story drift ratio, have been chosen as intensity measure (IM) and engineering demand parameter (EDP), respectively.
3. Fragility Analysis Wen et al. (2004) have developed a methodology for determining probabilities of different
damage states for reinforced-concrete buildings through IDA. In this methodology, two parameter power law has been fitted on the median EDP for a given IM. This power law represents a straight line in log-log space and can be expressed as:
max 1 2ln ln aC S Cθ = ⋅ + (1)
where, θMax is the EDP for a given IM Sa; and C1 and C2 are constants which are determined from regression analysis.
The fragility function for incipient collapse, using IDA can be expressed as (Wen et al., 2004):
!!
"
#
$$
%
&
''
(
)
**
+
,
++
−Φ−=
2/1222/
/
)(1]/[
MCaSD
aSDcaSICP
βββ
λλ (2)
M Surana1, Y Singh2 and D H Lang3
5
where, P[IC/Sa] is the probability of incipient collapse for a given spectral acceleration Sa, λc is the natural logarithm of median inter-story drift capacity at incipient collapse, λD/Sa is the natural logarithm of median inter-story drift demand for a given spectral acceleration.
βD/Sa and βC, are the variability parameters associated with demand and capacity, respectively, and are given as:
βD/Sa=2/12 )1ln( s+ (3)
s2= standard error = [ ]2
)ln()ln( 2
−
∑ −
NYY pi (4)
βc =2/12 )1ln( COV+ (5)
where,Yi and Yp are the observed and power law predicted median inter-story drift rotation values, respectively, for a given spectral acceleration Sa, N is the number of sample demand data points, and COV is the coefficient of variation of estimated inter-story drift capacity.
βM is the modelling uncertainty which is generally assumed equal to 0.40 based on previous studies.
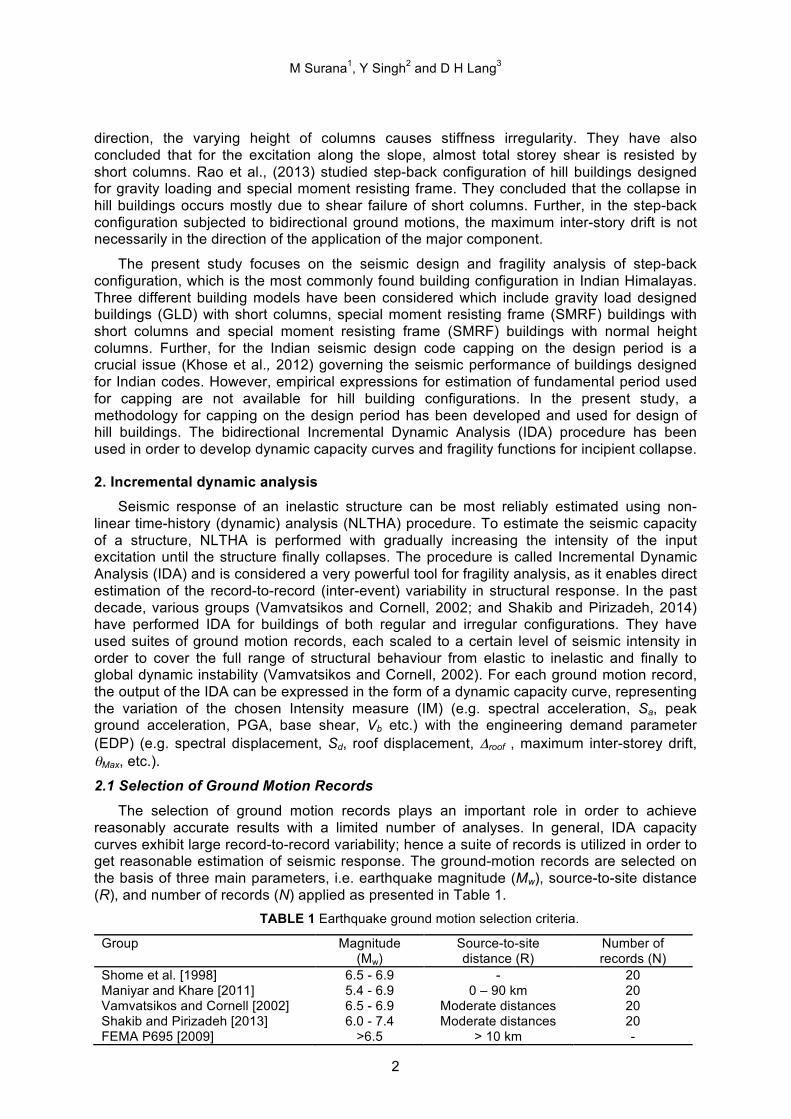
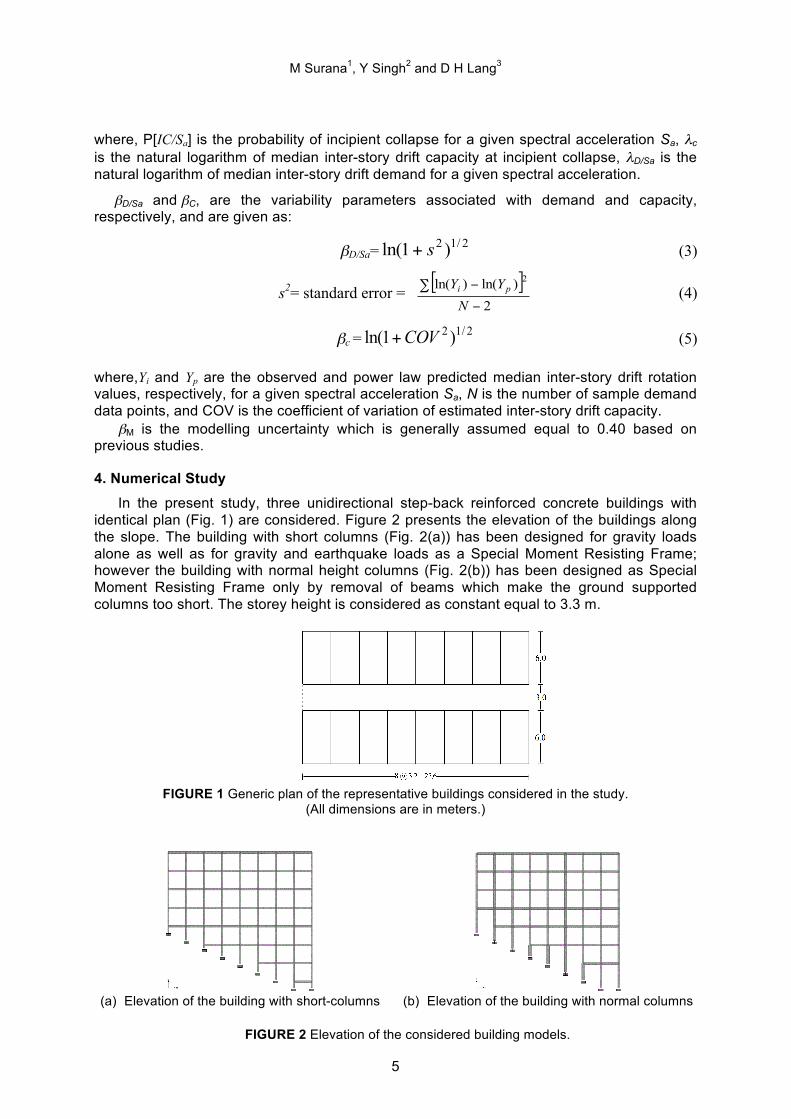
4. Numerical Study In the present study, three unidirectional step-back reinforced concrete buildings with
identical plan (Fig. 1) are considered. Figure 2 presents the elevation of the buildings along the slope. The building with short columns (Fig. 2(a)) has been designed for gravity loads alone as well as for gravity and earthquake loads as a Special Moment Resisting Frame; however the building with normal height columns (Fig. 2(b)) has been designed as Special Moment Resisting Frame only by removal of beams which make the ground supported columns too short. The storey height is considered as constant equal to 3.3 m.
FIGURE 1 Generic plan of the representative buildings considered in the study.
(All dimensions are in meters.)
(a) Elevation of the building with short-columns (b) Elevation of the building with normal columns
FIGURE 2 Elevation of the considered building models.

M Surana1, Y Singh2 and D H Lang3
6
The building models are created in the proprietary finite element code SAP 2000 v 14.2.4 (CSI, 2010). Beams and columns are modeled using 3-D frame elements and the slabs have been modelled as rigid diaphragms. The cracked section properties of RC beams and columns are estimated following ASCE/SEI 41-06 (2013) guidelines. Dead loads and live loads on the buildings have been assigned according to IS 875 Part 1 (1987a) and IS 875 Part 2 (1987b), respectively. The buildings are analyzed and designed as per Indian standards IS 456 (2000) and IS 1893 Part 1 (2002) for Seismic Zone V on soil type I (rock and hard soil). The 30% contribution of the orthogonal component has been used to account for the bi-directional effect of earthquake excitation. The capping on base shear has been applied as per the code provision considering the number of stories above ground level. P-delta effect has also been considered in the analysis and design. Table 4 presents typical member sizes which are used in the present study.
TABLE 4 Member sizes for the considered building models (All dimensions are in mm).
Building Model Short Columns Columns Beams GLD-Short column 300 x 300 300 x 300 230 x 350
SMRF-Short column 900 x 900 / 600 x 600 350 x 350 230 x 400 SMRF-Normal column 600 x 600 400 x 400 230 x 400
For nonlinear analysis, lumped plasticity models representing the potential failure modes in the considered buildings are developed. Uniaxial moment plastic hinges and P-M-M interaction hinges have been assigned at both ends of beams and columns, respectively. The idealized force-deformation curve of ASCE/SEI 41-06 (2007) shown in Fig. 3(a) has been assigned to each deformation controlled plastic hinge. The shear failure has been modelled for ground supported columns as force controlled action (Fig. 3(b)) as per ASCE/SEI 41-06 (2007). The shear capacity has been evaluated as per IS 456 (2000). The incipient collapse has been defined as the point where a small increment in IM, causes very large increase in EDP.
(a) Deformation controlled action (b) Force controlled action
FIGURE 3 Idealized force deformation curve for RC beams and columns under flexure and shear.
5. Results and discussion Table 5 presents the dynamic characteristics of the considered building models. The
coupling of modes has been observed in cross-slope direction; however no such coupling has been observed in along-slope direction.
TABLE 5 Dynamic characteristics of the considered building models.
Building Model Period of vibration (sec) Modal mass participation (%) T1 T2 T3 α1 α2 α3
GLD-Short column 2.82 2.13 1.91 59.28 03.44 60.10 SMRF-Short column 1.92 1.54 1.37 52.29 00.68 53.32 SMRF-Normal column 2.20 1.59 1.42 64.64 04.90 69.52
GLD-Gravity load designed; SMRF-Special moment resisting frame

M Surana1, Y Singh2 and D H Lang3
7
The results are presented in the form of dynamic capacity curves as median, 16 percentile and 84 percentile IDA curves. Fig. 4 presents the dynamic capacity curves for the considered building models. It has been observed that the GLD building with short columns has very low resistance to the earthquake excitation and collapse occurs at a very low intensity of excitation. The damage pattern for the GLD building indicates that the failure initiates from short columns and collapse occurs due to failure of a large number of beams and columns (Fig. 5(a)). The SMRF building with short columns designed considering capping on design period has some degree of resistance to earthquake excitation. The failure in this type of building takes place due to shear failure of short columns only (Fig. 5(b)). The SMRF building with normal height columns has better resistance as compared to the buildings with short columns, and the failure of the building involves collapse of a larger number of beams and columns, as compared to the SMRF building with short-columns (Fig. 5(c)) leading to higher ductility capacity of the building. Further, in all the cases, the capacity across the slope is lower than the corresponding capacities along the slope.
(a) GLD-short column, along slope! (b) GLD-short column, across slope!
(c) SMRF-short column, along slope (d) SMRF-short column, across slope
(e) SMRF-normal column, along slope (f) SMRF-normal column, across slope
FIGURE 4 Dynamic capacity curves for the considered building models.

M Surana1, Y Singh2 and D H Lang3
8
(a) Failure pattern for GLD building with short columns
(b) Failure pattern for SMRF building with short columns
(c) Failure pattern for SMRF building with normal columns
FIGURE 5 Failure pattern for the considered building models.
Table 6 presents the obtained fragility curve parameters. It has been observed that demand and capacity uncertainties are on higher side for the GLD buildings as compared to the SMRF buildings. Further the median drift capacity at which collapse occurs (~0.8%) has been found out to be very small for GLD buildings as compared to SMRF building with short columns (~1.2%) and SMRF building with normal height column (~2.3%).

M Surana1, Y Singh2 and D H Lang3
9
TABLE 6 Fragility curve parameters obtained from IDA
Building Model Direction of Excitation βC βD/Sa βM λc C1 C2 R2 GLD-Short column
Along slope 0.49 0.57 0.40 -4.85 1.09 -0.09 0.99 Across slope 0.52 0.48 0.40 -4.85 1.23 1.21 0.99
SMRF-Short column Along slope 0.40 0.33 0.40 -4.41 1.15 -1.70 0.96 Across slope 0.38 0.33 0.40 -4.47 1.02 -1.68 0.99
SMRF-Normal column Along slope 0.24 0.24 0.40 -3.87 1.06 -2.00 0.99 Across slope 0.32 0.34 0.40 -3.81 1.04 -1.30 0.99
R2-Represents goodness of fit on median power law
Figure 6 presents the fragility curves for the considered building models. Table 7 presents the obtained collapse probabilities for different levels of seismic hazard. It has been observed that the GLD building with short columns has nearly 100% probability of collapse even for the DBE level of seismic demand since the columns have very low shear capacity. The SMRF building with short columns designed as per current code provisions for the buildings resting on flat topography also has very high probability of collapse for DBE and MCE levels of seismic demand, since short columns being very rigid attract almost whole of the storey shear and fail under shear much before yielding of the other members.
(a) GLD-short column, along slope (b) GLD-short column, across slope
(c) SMRF-short column, along slope (d) SMRF-short column, across slope
(e) SMRF-normal column, along slope (f) SMRF-normal column, across slope
FIGURE 6 Fragility curves for the considered building models (The two vertical lines represent the seismic demand corresponding to DBE and MCE hazards).

M Surana1, Y Singh2 and D H Lang3
10
TABLE 7 Collapse probabilities for different hazard levels.
Building Model Direction of Excitation DBE MCE GLD-Short column
Along slope 99 100 Across slope 99 100
SMRF-Short column Along slope 70 96 Across slope 73 96
SMRF-Normal column Along slope 28 78 Across slope 43 84
The SMRF building with normal height columns has lower probability of collapse as compared to SMRF building with short columns, as storey shear has been better shared by all the columns and shear failure in columns takes place after yielding of other members, resulting in higher ductility.
6. Conclusions The seismic fragility of step-back hill building configurations designed for gravity load
alone and for combined action of gravity and earthquake loads using the current Indian codes (detailed as SMRF), has been assessed. Two different models have been considered for SMRF buildings i.e. with short columns and with normal height columns. It has been observed that the building designed for gravity load alone, has very small lateral load capacity and fails at very low spectral accelerations. The SMRF building with short columns has relatively higher resistance to seismic excitation, but the short columns attract almost whole of the story shear and fail under shear, whereas other members remain well within the elastic limit. This is due to the lower over-strength in shear failure, as compared to flexure. The seismic performance of the SMRF building with normal height columns is much better as compared to all other considered building models. The failure in this type of building takes place due to combination of shear and flexural failure in beams and columns across several storeys.
The dynamic capacity curves for the considered buildings indicate that the building designed for gravity load alone fails at a maximum inter-story drift ratio around 0.8%; the SMRF building with short columns fails at the maximum inter-story drift ratio around 1.2%; whereas SMRF building with normal height columns fails at maximum inter-story drift ratio around 2.3%. It can be observed these drifts are much lower than the typical values for normal buildings, located on flat land. Further, the collapse probability obtained for the building designed for gravity load is 99% even for mild earthquakes of EPGA equal to 0.18 g. As many buildings on Indian hills are not designed for earthquake forces, this explains the unexpectedly severe damage during Sikkim earthquake of 2011. In case of the SMRF building with short columns, the collapse probability reduces slightly as compared to the building designed for gravity load alone. The SMRF building with normal height columns has the lowest collapse probability but it is also unacceptably high. This indicates that the provisions of the current seismic design codes in India (and also in other parts of the world), which are developed for buildings on flat lands are not adequate for buildings on hill slopes. Further, slight changes in the structural configurations in terms of more regular distribution of stiffness and strength can result in improved performance.
REFERENCES
ASCE/SEI 41-13 (2013) Seismic Evaluation and Retrofit of Existing Buildings, ASCE Standard, American Society of Civil Engineers, Reston, Virginia, United Sates
ASCE/SEI 41-06 (2007) Seismic Rehabilitation of Existing Buildings, ASCE Standard, American Society of Civil Engineers, Reston, Virginia, United States

M Surana1, Y Singh2 and D H Lang3
11
Birajdar BG and Nalawade SS (2004) Seismic Analysis of Buildings Resting on Sloping Ground, The 13th World Conference on Earthquake Engineering, Vancouver, Canada
CSI (2010) Integrated Software for Structural Analysis & Design SAP2000, Version 14.2.4, Analysis Reference Manual, Computers and Structures, Inc., Berkeley, United States
FEMA P695 (2009) Quantification of Building Seismic Performance Factors, Federal Emergency Management Agency, Washington, D.C., United States
Halkude SA, Kalyanshetti MG, Ingle VD (2013) Seismic Analysis of Buildings Resting on Sloping Ground with Varying Number of Bays and Hill Slopes, International Journal of Engineering Research and Technology, 2(12): 3632-3640
IS: 875 Part 1 (1987a) Indian Standard Code of Practice for design Loads (Other than Earthquake) for Buildings and Structures, Part 1: Dead Loads- Unit Weights of Building materials and Stored Materials (Second Revision), Bureau of Indian Standards, New Delhi
IS: 875 Part 2 (1987b) Indian Standard Code of Practice for design Loads (Other than Earthquake) for Buildings and Structures, Part 2: Imposed Loads (Second Revision), Bureau of Indian Standards, New Delhi
IS 456 (2000) Indian Standard –Plain and Reinforced Concrete, Code of Practice,” Bureau of Indian Standards, New Delhi
IS: 1893 Part 1 (2002) Indian Standard Criteria for Earthquake Resistant Design of Structures, Part 1: General Provisions and Buildings (Fifth Revision), Bureau of Indian Standards, New Delhi
Khose VN, Singh Y, Lang DH (2012) A Comparative Study of Design Base Shear for RC Buildings in Selected Seismic Design Codes, Earthquake Spectra, 28(3):1047-1070
Maniyar MM and Khare RK (2011) Selection of Ground Motions for Performing Incremental Dynamic Analysis of Existing Reinforced Concrete Buildings in India, Research Article, 100(5):701-713
Pandey AD, Kumar P, Sharma S (2011) Seismic Soil-Structure Interaction of Buildings on Hill Slopes, International Journal of Civil and Structural Engineering, 2(2): 544-555
Patro SK, Banerjee S, Jena D, Das SK (2013) A Review of Seismic Analysis of a Building on Sloping Ground, International Journal of Engineering Research and Technology, 2(10): 3632-3640
PEER (2010) PEER NGA Database, Pacific Earthquake Engineering Research Center, University of California, Berkeley, California, Available at http://peer.berkeley.edu/nga/
Rao VY (2013) Seismic Vulnerability of Hill Buildings, M.Tech. Dissertation, Indian Institute of Technology Roorkee, India
Shakib H and Pirizadeh M (2014) Probabilistic Seismic Performance Assessment of Setback Buildings under Bidirectional Excitation, Journal of Structural Engineering, ASCE, 140(2), 1736-1745
Sharma ML, Sinhval A, Singh Y, Maheshwari BK (2011) A Damage Survey Report on Sikkim Earthquake of September 18, 2011, Department of Earthquake Engineering, IIT Roorkee, Roorkee
Shome N, Cornell CA, Bazzurro P, Carballo JE (1998) Earthquakes, Records and Nonlinear Responses, Earthquake Spectra, 14:469-500
Singh Y, Gade P, Lang DH, Erduran E (2012) Seismic Behaviour of Buildings Located on Slopes- An Analytical Study and Some Observations from Sikkim Earthquake of 18th September 2011, The 15th World Conference on Earthquake Engineering, Lisbon, Portugal
Sreerama AK and Ramancharla PK (2013) Earthquake Behaviour of Reinforced Concrete Framed Buildings on Hill Slopes, Centre for Earthquake Engineering, IIIT, Hyderabad
Vamvatsikos D and Cornell CA (2002) Incremental Dynamic Analysis, Earthquake Engineering and Structural Dynamics. 31:491-514
Wen YK, Ellingwood BR, Bracci J (2004) Vulnerability Function Framework for Consequence-based Engineering, Vol. DS-4, MAE Center Project DS-4 Report