Embed Size (px)
Citation preview
Draft
Seismic Fragility Curves for Reinforced Concrete Frame
Buildings in Canada Designed After 1985
Journal: Canadian Journal of Civil Engineering
Manuscript ID cjce-2016-0388.R1
Manuscript Type: Article
Date Submitted by the Author: 16-Dec-2016
Complete List of Authors: Al Mamun, Abdullah; University of Ottawa, Civil Engineering Saatcioglu, Murat; Dept. of Civil Engineering,
Is the invited manuscript for consideration in a Special
Issue? : N/A
Keyword: Fragility analysis, Incremental dynamic analysis, Performance-based
evaluation, Reinforced concrete frame buildings, Vulnerability analysis
https://mc06.manuscriptcentral.com/cjce-pubs
Canadian Journal of Civil Engineering

Draft
Seismic Fragility Curves for Reinforced Concrete Frame
Buildings in Canada Designed After 1985
Abdullah Al Mamun, and Murat Saatcioglu
Abdullah Al Mamun, and Murat Saatcioglu. Department of Civil Engineering, University of
Ottawa, 161 Louis Pasteur, Ottawa, ON K1N6N5
Corresponding Author: Murat Saatcioglu (e-mail:[email protected]), Department
of Civil Engineering, University of Ottawa, 161 Louis Pasteur, Ottawa, ON K1N6N5. Office:
613 562-5800 ext. 6129.
Word Count: 9361
Page 1 of 39
https://mc06.manuscriptcentral.com/cjce-pubs
Canadian Journal of Civil Engineering
Draft
Abstract: Performance of reinforced concrete frame buildings depends on seismic hazard of
the region and vulnerability of the structure. Performance-based evaluation of buildings may be
conducted through fragility curves developed for different levels of performance. Reinforced
concrete frame buildings with 2, 5 and 10-stories, designed as moderately ductile buildings for
Ottawa in Eastern Canada and fully ductile buildings for Vancouver in Western Canada were
used to generate seismic fragility curves. The buildings were analyzed using PERFORM-3D
software to assess seismic vulnerabilities. Incremental Dynamic Analysis was employed to
generate fragility curves. Two sets of earthquake records compatible with Uniform Hazard
Spectra of 2010 NBCC were selected, where each set contained 20 records for each city. The
fragility curves depict probabilities of exceedances for different damage states, and can be used
for seismic vulnerability assessment of reinforced concrete frame buildings in Canada designed
and built after 1985.
Keywords: Fragility analysis; incremental dynamic analysis; performance-based evaluation;
reinforced concrete frame buildings; seismic assessment; seismic damage estimation;
vulnerability analysis.
Page 2 of 39
https://mc06.manuscriptcentral.com/cjce-pubs
Canadian Journal of Civil Engineering
Draft
1. Introduction
Earthquakes occur frequently in Canada with historic damage. The seismic hazard in Canada
can be characterized by the seismicity of two distinct regions; eastern Canada and western
Canada; with a relatively stable continental shelf between the two. Significant seismic activities
occur in western Canada because of the presences of active faults along the Pacific Rim.
Geological Survey of Canada records more than 1000 earthquakes in western Canada with more
than 100 earthquakes of magnitude 5 or greater. Seismic activity in eastern Canada occurs with
reduced frequency of approximately 500 earthquakes per year, with about three magnitude 5
earthquakes taking place in each decade (GSC 2016). Eastern Canada does not have active faults.
The earthquakes in this region are believed to be related to the regional stress fields with
earthquakes concentrated in regions of crustal weakness. Stronger earthquakes are expected in
the west, though damaging earthquakes have also occurred in the east. Eastern earthquakes tend
to be less frequent and of moderate magnitude (GSC 2016). This difference in seismic regions is
reflected in building design practices that follow the requirements of the National Building Code
of Canada (NBCC).
It is preferable to conduct seismic vulnerability assessment of buildings through dynamic
inelastic response history analysis. However, this may not be feasible for the majority of
buildings. An alternative is to conduct fragility analysis using fragility curves that incorporate
design characteristics of the building being assessed. Fragility analysis provides a probabilistic
methodology for assessing seismic vulnerability of existing buildings. It can be conducted using
fragility curves that provide probability of exceeding pre-determined performance levels as a
function of earthquake intensity for a given region and for a building type with certain
characteristics (Vamvatsikos and Cornell 2002). It is best suited to earthquake investigations,
with capabilities for providing support to decision makers.
Page 3 of 39
https://mc06.manuscriptcentral.com/cjce-pubs
Canadian Journal of Civil Engineering
Draft
The objective of this paper is to present seismic fragility curves for reinforced concrete frame
buildings in Canada. It forms part of a comprehensive research program currently underway at
the University of Ottawa involving reinforced concrete frame and shear wall buildings, as well as
masonry buildings, with or without irregularities, designed during different periods of building
code development.
The building inventory in Canada can be viewed in two broad groups; those designed prior to
the enactment of modern seismic codes, and those designed using the more recent seismic hazard
values and building design and detailing practices. The design base shear equation in NBCC has
changed since the inception of seismic provisions in 1941 (1941 NBCC). Earlier equations
defined seismic base shear as a percentage of seismic weight of building as seismic coefficient.
In the 1953 NBCC, the building height was introduced as a design parameter, crudely reflecting
the effect of building period on seismic coefficient. The hazard values were introduced in 1953
through seismic maps with seismic zones for different regions. In the 1965 NBCC, the
differences in construction type and associated level of ductility was introduced through
coefficient C, reducing base shear for reinforced concrete frame and shear wall buildings with
detailing for ductile response, while increasing the base shear for other non-ductile buildings. In
the 1970 NBCC the hazard values were revised. The effect of construction type was treated more
extensively through coefficient K, reflecting the associated level of ductility. Empirical
expressions were also introduced for the computation of fundamental period. This was followed
by the 1975 NBCC Commentary with ductility factors for different building types for use in
dynamic analysis. The requirements remained essentially the same in the 1980 NBCC with
refinements made to seismic response coefficient S as affected by fundamental period. New
seismic zoning maps were introduced in the 1985 NBCC with seismic velocity and acceleration
ratios specified for each zone, refining hazard values significantly based on 10% probability of
exceedance in 50 years. Further refinements were introduced to the seismic response coefficient
Page 4 of 39
https://mc06.manuscriptcentral.com/cjce-pubs
Canadian Journal of Civil Engineering
Draft
S with a new empirical period equation provided for shear wall buildings. The ductility related
construction type factor K was replaced by force modification factor R in 1990 (1990 NBCC),
with a calibration factor U, which introduced a reduction in base shear to account for structural
over-strength and to bring the force level to the same level of safety implied in earlier codes. The
same base shear expression remained essentially the same until 2005 with a revised empirical
equation introduced for fundamental period of shear wall buildings. Significant changes were
introduced in 2005 (2005 NBCC) with new site specific uniform hazard spectra having 2% in 50
year probability of exceedance. The approach was kept the same in the 2010 NBCC with new
hazard values introduced in the 2015 NBCC. The hazard values in the 2015 NBCC are 17% to
28% higher for Vancouver and 24% to 15% lower for Ottawa relative to those in the 2010
NBCC within the 0.5 sec to 1.0 sec building period range.
The design and detailing requirements for reinforcement concrete buildings in CSA A23.3
went through a similar evolution. There were no seismic design requirements prior to CSA
A23.3-1973 (CSA 1973), which was referenced in the 1975 NBCC. Ductile design and detailing
requirements for seismic resistance were introduced for the first time in 1973, which remained
the same until 1984. Significant improvements were made to the standard in 1984 (CSA 1984)
with the introduction of capacity design requirements, protecting critical elements and preventing
non-ductile failures. Three levels of seismic detailing were specified for the first time for: i)
ductile response, ii) moderately ductile response, and iii) frame members that are not part of the
seismic resisting system but “go for the ride” during seismic response. Critical elements in
ductile buildings were protected and non-ductile failure modes were prevented by increasing
design to levels that are associated with the development of probable moment resistances in
plastic hinges at 125% of the steel yield strength. The same capacity design concept was
implemented in nominally ductile buildings using nominal capacities. The stringency of design
depended on the design ductility demand selected in the 1985 NBCC, which made reference to
Page 5 of 39
https://mc06.manuscriptcentral.com/cjce-pubs
Canadian Journal of Civil Engineering
Draft
CSA A23.3-1984. Hence, 1985 was taken as the “benchmark” year for significant improvements
in seismic design of reinforced concrete buildings in Canada. The same year was adopted as the
bench mark year in the Canadian Seismic Screening Manual (NRC 1992).
An extensive comparison of seismic demands and capacities of reinforced concrete frame
buildings was performed as part of the current investigation to assess the significance of
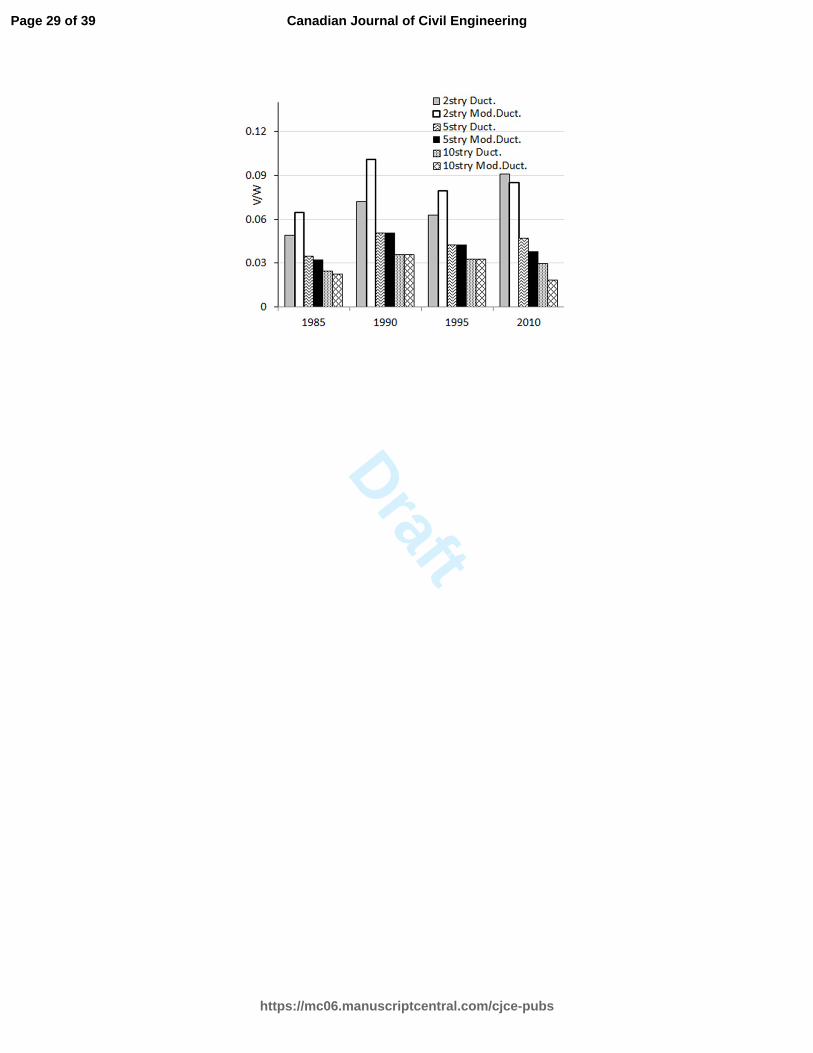
variations in building designs between 1985 and 2010. Static seismic base shears for the 2, 5 and
10-storey buildings used in the current investigation were calculated using Equivalent Static
Force Procedure (ESFP). Figure 1 shows the evolution of seismic design base shear ratio (design
base shear V / building weight used for base shear calculations W) assuming buildings in
Vancouver have full ductility and those in Ottawa have moderate ductility. It was observed that
the change in equivalent seismic base shear (based on the empirical code period) between 1985
and 2010 varied between 0.8 and 1.3 of the 1985 values for 10-storey and 2-storey moderately
ductile buildings in Ottawa, respectively. The range was 1.2 and 1.8 of the 1985 values for 10-
storey and 2-storey ductile buildings in Vancouver. However, this change in seismic shear
demand did not translate into equivalent levels of change in member capacities in final building
designs. The seismic load combinations changed from 1.25D+0.7(1.5L+1.5E) in 1985 to
1D+0.5L+1E starting in 1990, implying that the contribution of gravity loads to member design
would be higher in 1985 and lower in the post 1990 codes. The changes in load factors may
offset the effects of changes in seismic base shear on final designs. Where they don’t, as in the
case of the 10-storey building in Ottawa, they create higher design capacity with reduced seismic
vulnerability. Furthermore, the concrete resistance factor, ɸc was 0.6 in CSA A23.3-1984,
whereas it was increased to 0.65 in CSA A23.3-2004 (CSA 2004). This results in a nominal
capacity that is closer to design resistance in newer buildings. The comparison implies that there
is more reserve capacity in older buildings, even though the seismic design force levels at the
time were generally lower. Therefore, the final structural designs of the three buildings
Page 6 of 39
https://mc06.manuscriptcentral.com/cjce-pubs
Canadian Journal of Civil Engineering
Draft
considered are not expected to show significant variations between 1985 and 2010. Hence,
reinforced concrete frame buildings designed between 1985 and 2010 can be grouped together
for the purpose of seismic vulnerability assessment within the ductility ranges considered in
design.
2. Selection and Design of Buildings
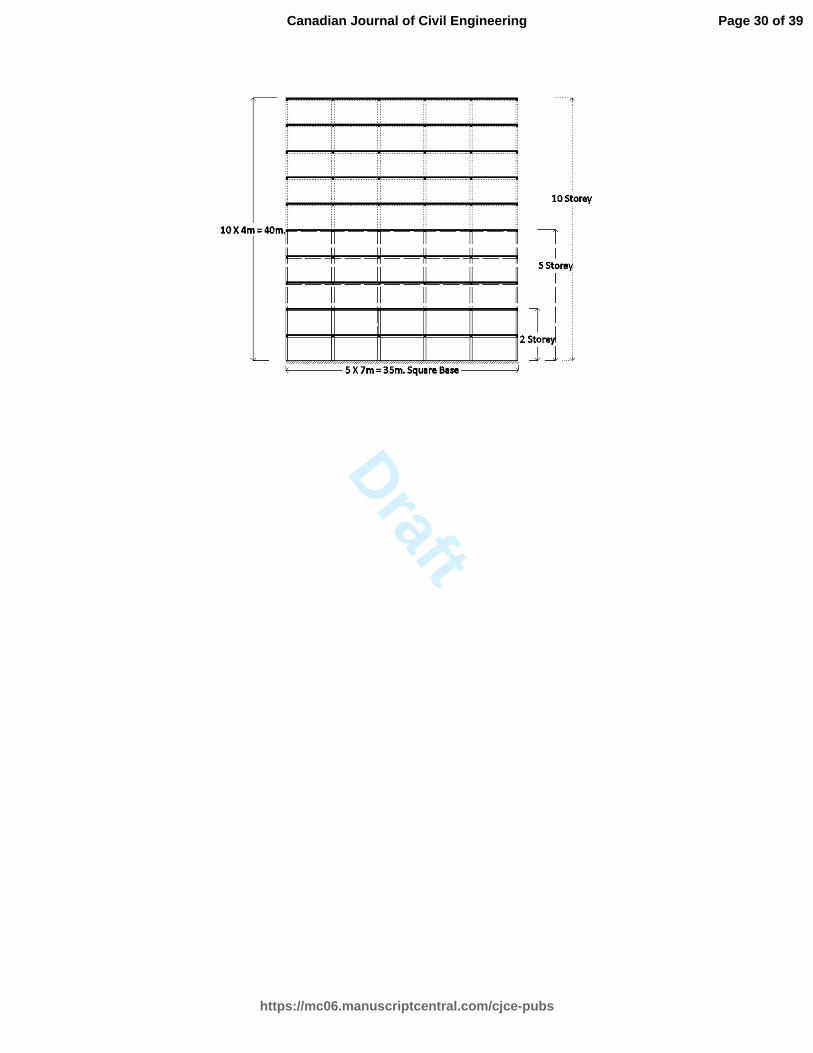
Three regular frame buildings with 2-storey, 5-storey and 10-storey heights were selected for
Ottawa, representing eastern Canadian seismicity, and for Vancouver, representing western
Canadian seismicity. All the buildings consisted of moment resisting frames in both orthogonal
directions with 5 bays in each direction, having a 7.0 m span length, resulting in a 35m by 35m
square floor plan. Typical floor height of 4.0 m was used for each floor including the ground
level. Figure 2 shows elevation view of the buildings. The design dead load included a
superimposed dead load of 1.33 kPa consisting of floor finish, partition walls and
mechanical/electrical fixtures, in addition to member self-weight. The live load was 2.4 kPa.
The buildings were designed based on the 2010 NBCC seismic requirements with the
accompanying CSA Standard A23.3-04 “Design of Concrete Structures” used for proportioning
and detailing of members. The equivalent static load approach was used to compute elastic
seismic base shear (Ve). The buildings were designed for residential occupancy with an
importance factor of I =1.0, on firm soil (Soil Class C). The fundamental period was computed
by performing Eigen Value analysis through the use of SAP 2000 (CSI 2013a.) software with
reduced section properties according to CSA A23.3-04. These dynamic fundamental periods
were longer than those computed by the code-recommended empirical values by more than
150%. Therefore, the period values were taken as 1.5 times the values computed based on the
empirical code equations for design. Uniform Hazard Spectra (UHS) values were used for design
as prescribed in the 2010 NBCC. These corresponded to spectral accelerations (Sa) of 0.298g,
Page 7 of 39
https://mc06.manuscriptcentral.com/cjce-pubs
Canadian Journal of Civil Engineering
Draft
0.134g and 0.066g for 2-storey, 5-storey and 10-storey building in Ottawa and 0.618g, 0.320g
and 0.204g for the buildings in Vancouver, respectively. The buildings in Ottawa consisted of
moderately ductile frames designed with ductility related force modification factor Rd and over-
strength related force modification factor Ro as 2.5 and 1.4, respectively. The buildings in
Vancouver consisted of fully ductile frames, designed with Rd = 4.0 and Ro = 1.7. Concrete
compressive strength,f��, was taken as 40 MPa for 2-storey and 10-storey buildings and 30 MPa
for 5-storey building. Rebar with 400 MPa yield strength was used as reinforcement for all
members. The buildings were analysed and designed by using software ETABS (CSI 2008) with
the load cases defined in NBCC (2010). Reinforcement obtained from the software was used
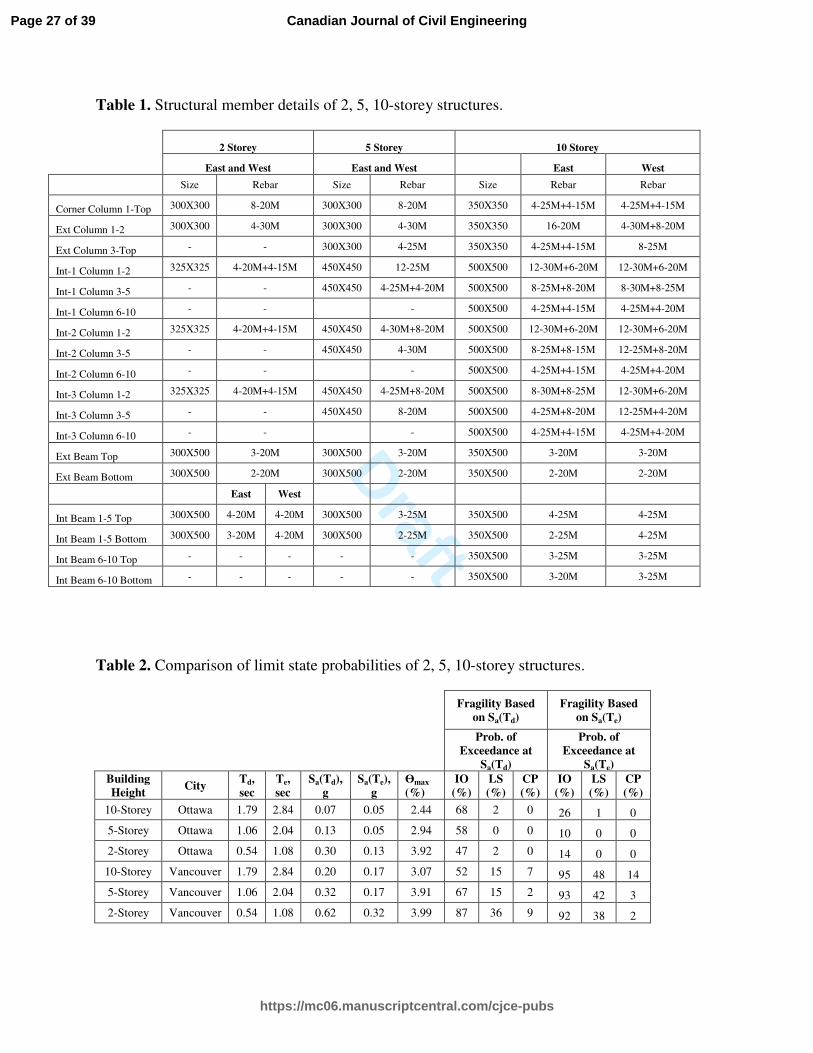
along with seismic detailing implemented manually for complete member design. Table 1
provides the design details for each member. The buildings in Vancouver and Ottawa had the
same member dimensions because of similar ratios of seismic demand to inelastic capacity in
each city. This resulted in the same fundamental period for the same height buildings.
Accordingly, the design fundamental periods for the two, five and ten-storey buildings were
computed to be 0.54 sec, 1.06 sec and 1.79 sec, respectively. The effective fundamental periods
computed using the Eigen Value solution were 1.08 sec, 2.04 sec, and 2,84 sec for the two, five
and ten storey buildings, respectively.
3. Incremental dynamic analysis (IDA)
The present study focuses on developing fragility response of reinforced concrete frame
structures in Canada with regular structural layout through incremental dynamic analysis (IDA).
A set of 20 earthquake records were selected and IDA was employed to generate fragility curves.
IDA was conducted for each seismic record with incrementally varying intensity levels, resulting
in an IDA curve providing a relationship between earthquake intensity and a structural
deformation quantity. In the current investigation the maximum inter-storey drift ratio, Ɵmax , was
Page 8 of 39
https://mc06.manuscriptcentral.com/cjce-pubs
Canadian Journal of Civil Engineering
Draft
used as a damage measure (DM) and 5% damped spectral acceleration was used as an intensity
measure (IM) either at design period Td or at effective period Te obtained from dynamic analysis.
Each earthquake record was scaled in such a way that the successive run would always be within
10% of the previous IM level. Hunt and fill algorithm was used to limit the number of runs while
covering the entire range of structural performance (Vamvatsikos and Cornell 2004).
Accordingly, the dynamic analysis was first conducted under a reduced earthquake intensity to
correspond to a relatively low spectral acceleration of 0.005g to ensure elastic response. In the
second analysis, when the spectral accelerations corresponded to Te, the seismic record was
amplified such that the increase in spectral increment was 0.05g with a step increment of 0.025g
up to failure. The same approach was used for the IDA when seismic records were amplified
based on Sa(Td), except for the increase in increments, which was twice the incremental increase
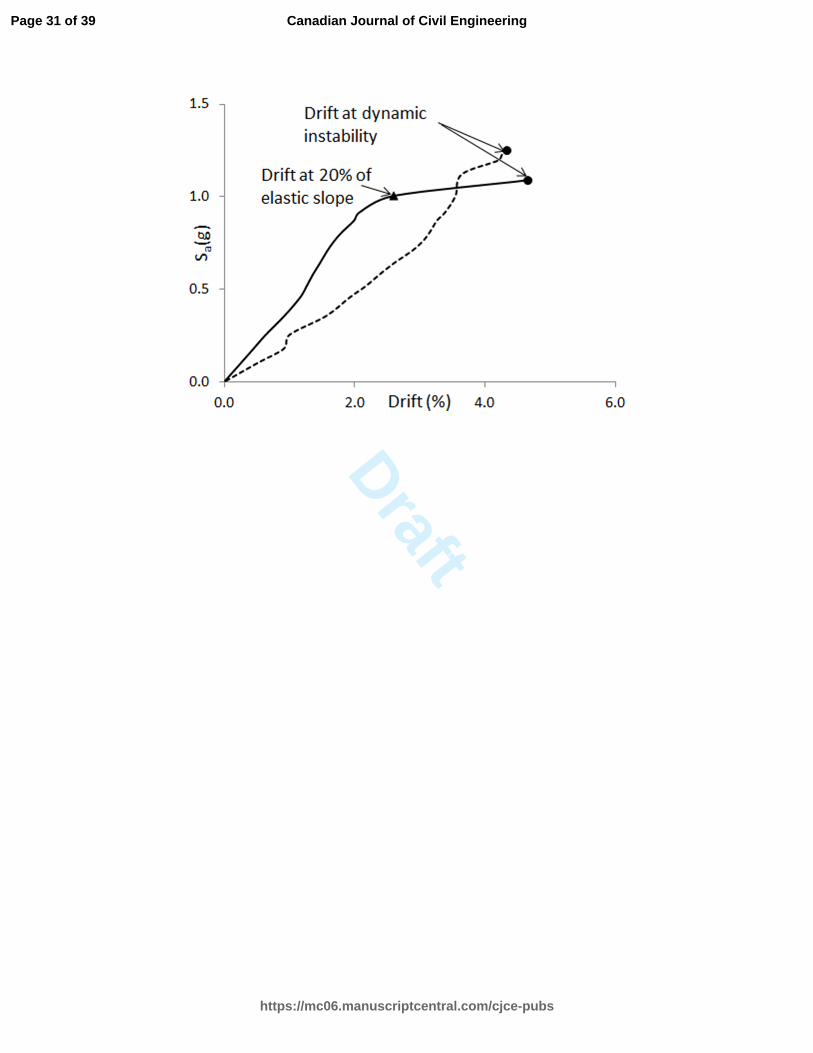
used earlier for Sa(Te). The structural failure was defined either by side-sway collapse (structural
instability) or when the rate of change in deformations (the slope of the IDA curve) reached 20%
of the initial effective elastic slope as also defined in FEMA 350 (FEMA 2000a). Side-sway
collapse was defined as the point of dynamic instability when inter-storey drift increased without
bound (Goulet et al. 2007). Figure 3 illustrates the definition of maximum drift capacity used in
the current study. IDA was used to develop fragility response for different performance levels
with associated limit states.
4. Modelling for Dynamic Analysis
IDA was conducted using software PERFORM-3D (CSI 2013) to perform nonlinear dynamic
analysis and evaluate the inelastic performance of structural components. PERFORM-3D is
specialized software for damage assessment, and is used by other researchers (Reyes and Chopra
2012; Ghodsi and Ruiz 2010; Zeynep Tuna 2012; Wen-Cheng Liao 2010; Michael W. Hopper
2009). Three-dimensional analytical models of the bare frame structures designed earlier were
Page 9 of 39
https://mc06.manuscriptcentral.com/cjce-pubs
Canadian Journal of Civil Engineering
Draft
developed for dynamic analysis. The frame elements (beam and columns) were modeled to
deform in double curvature with two symmetrical segments. Each segment consisted of an elastic
beam element and a plastic hinge. Chord rotations were used to define the member end rotations.
All beam and column elements had stiff end zones at the joints that represented the end portions
built integrally with the adjoining members. The stiffness of these end zones was assigned a
value equal to 10 times the member stiffness.
Element stiffness was specified as per the requirements of CSA A23.3-04. Both beam and
column rigidities were reduced to account for concrete cracking; and effective inertia, Ie, were
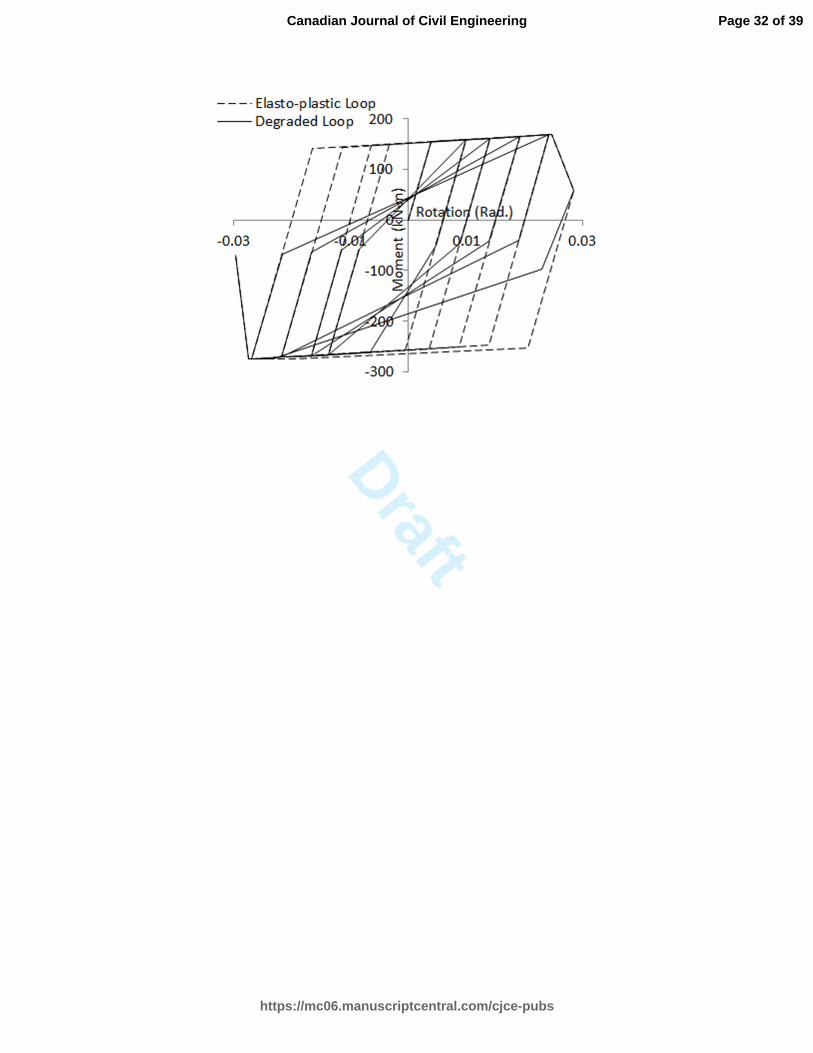
assigned to the members. Hysteretic behaviour of potential plastic hinge regions was modelled
by assigning a stiffness degrading model in PERFORM-3D. The software uses perfectly elasto-
plastic hysteretic relations, modified for stiffness and strength degradation under reversed cyclic
loading as illustrated in Fig. 4. The stiffness degradation is introduced through the “energy
degradation factor (EDF),” which is the ratio of the area under an elasto-plastic to stiffness
degrading hysteresis loops. In the current investigation, EDF was computed from experimental
observations. Tests of reinforced concrete elements conducted by Ozcebec and Saatcioglu (1987)
were used for this purpose. It was found that well confined flexure-controlled elements showed
behaviour that could be modelled with the use of EDF = 0.62 up to the yield point, and 0.56
thereafter. The same EDF values were used for both moderately ductile and fully ductile
elements. The sensitivity analysis conducted by authors indicated that minor variations in EDF
did not result in significant changes in dynamic response (Al Mamun and Saatcioglu 2016)1.
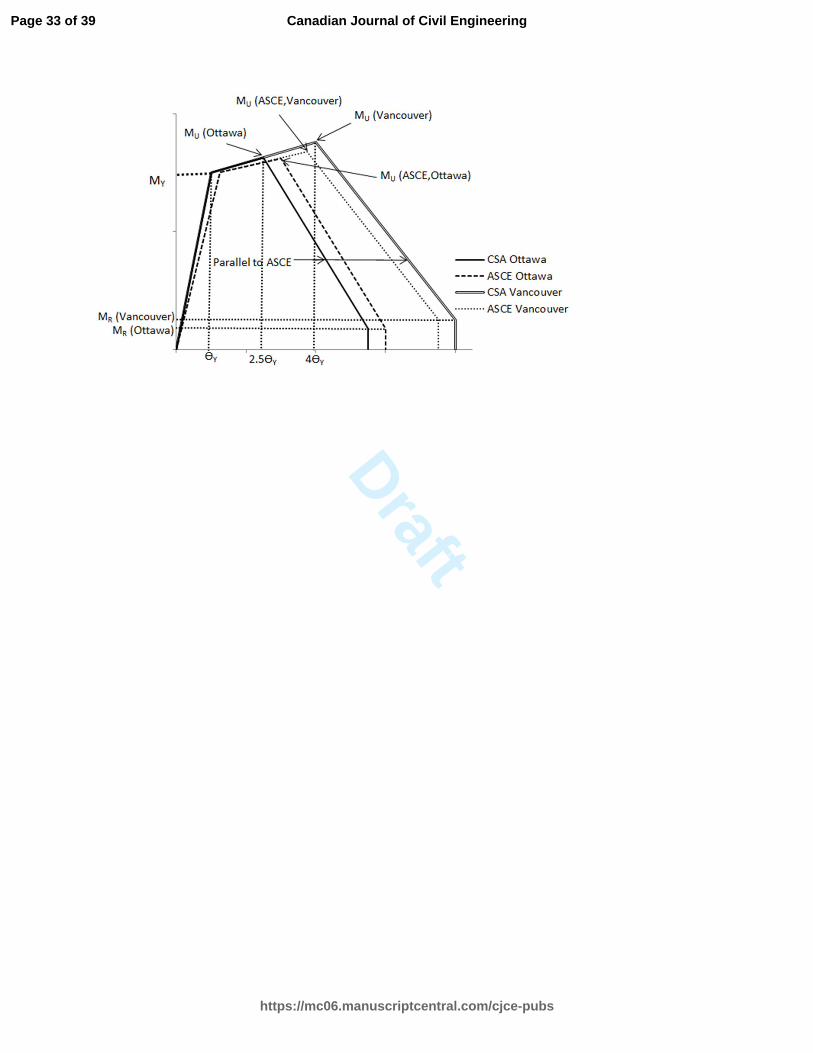
The envelope curves for the hysteretic models were defined in terms of nominal moment
resistances and corresponding chord rotations. This was done according to the ASCE 41-13
(ASCE 2014) guidelines. The yield moment (MY) and chord rotation at yield (ƟY) were
1 Al Mamun and Saatcioglu. 2016. Seismic performance evaluation of RC frame structures using PERFORM-3D.
Submitted for publication in Earthquake Spectra, the Journal of EERI.
Page 10 of 39
https://mc06.manuscriptcentral.com/cjce-pubs
Canadian Journal of Civil Engineering
Draft
calculated for each element from sectional analysis. The post yield stiffness was defined as strain
hardening stiffness with 3% and 4% of the effective elastic stiffness for beam and column
elements, respectively up to ultimate capacity (MU). The ultimate capacity depended on the
ductility ratios adopted for moderately ductile and fully ductile structures. The ductility related
force modification factor (Rd) values, specified in the 2010 NBCC were used as 2.5 and 4.0 for
moderately ductile and fully ductile buildings. These ductility ratios were also reported to have
been observed during previous column tests (Park et al. 1982; Beng Ghee et al. 1981; Zahn et al.
1986; Saatcioglu and Ozcebec 1989), though some researchers showed that well confined
concrete column could achieve ductility ratios higher than 4.0 irrespective of the level of axial
compression. The ultimate rotational capacity (ƟU) was defined in the current investigation as
2.5 and 4.0 times the yield rotation (ƟY) for nominally and fully ductile elements as the onset of
strength decay points. The degradation slope of moment-rotation envelope was computed to be
the same as that recommended by ASCE 41-13. The ASCE 41-13 ultimate plastic chord rotation
(ƟU) and the residual moment capacity (MR) depend on the level of axial compression and the
confinement steel area ratio. The linear descending branch of the envelop curve continued until
the residual moment capacity (MR) as defined in ASCE41-13 as a ratio of the ultimate moment
capacity (MU). This ratio for the beams was 0.2 and varied for columns between 0.2 and 0 as a
function of axial load. Fig. 5 shows the details of moment-rotation envelope for members having
the yield capacity, but different levels of ductility. Further details of analytical modelling
techniques employed are reported elsewhere (Al Mamun and Saatcioglu 2016).
The members were modelled to behave elastically in shear. This is consistent with CSA
A23.3-04, which requires higher shear capacity than that corresponding to flexural capacity to
prevent brittle shear failure while promoting ductile flexural response. This is a preferred
performance observed by researchers (Priestley et al. 1994). Ozcebec and Saatcioglu (1989)
experimentally observed that deflections due to shear in flexure-dominant members accounted
Page 11 of 39
https://mc06.manuscriptcentral.com/cjce-pubs
Canadian Journal of Civil Engineering
Draft
for 22% of the total deflection, even though local shear deformations within the plastic hinge
could be as high as 83% of the hinging region deformations. The contribution of shear to total
member deflection was observed to decrease (forming 8% of total deflection in one column test)
as inelastic deformations increased in flexure (Saatcioglu and Ozcebec 1989). Linear elastic
shear properties of structural elements were also used by previous researches (Borzi et al. 2008;
Inel and Ozmen 2006; Liel et al. 2011).
5. Selection of Earthquake Records
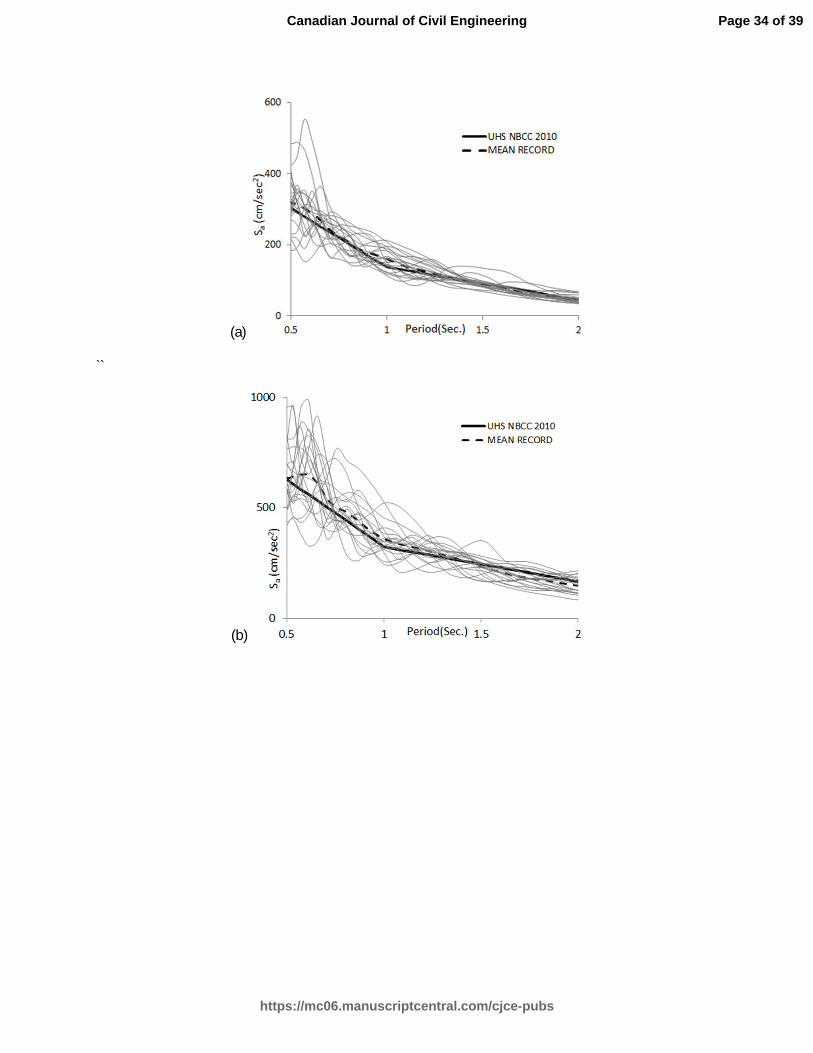
Synthetic earthquake records, developed for Ottawa and Vancouver, with 2% probability of
exceedance in 50 years were selected for the development of the fragility curves. These records
were compatible with the Uniform Hazard Spectra (UHS) specified in NBCC (2010), and were
developed by Atkinson (2009). The records were modified as suggested by Atkinson (2009) to
match the UHS for the period range of interest. The design period of the buildings considered in
the current investigation varied between 0.5 and 2.0 seconds, and this range was used to modify
the records. A set of twenty records was selected for buildings in Ottawa, and another set of
twenty records was selected for buildings in Vancouver. Each set of records reflected two
different magnitudes and two different distances, resulting in four different magnitude-distance
combinations. Five records were selected from each magnitude level and distance category. For
Ottawa, M6 earthquakes were selected with epicentral distances of 10-15 km and 20-30 km; and
M7 earthquakes were selected with epicentral distances of 15-25km and 50-100 km. The
duration of records were 5, 7, 17 and 20 seconds, respectively. For Vancouver, M6.5 earthquake
was selected with epicentral distances of 10-15 km and 20-30 km; and M7.5 earthquake was
selected with epicentral distances of 15-25 km and 50-100 km. The duration of records was 10,
15, 65 and 57 seconds, respectively. Acceleration response spectra were generated for 5% of
Page 12 of 39
https://mc06.manuscriptcentral.com/cjce-pubs
Canadian Journal of Civil Engineering
Draft
critical damping, and for Soil Type C. Figure 6 shows the comparison of response spectra for
mean seismic records with the UHS of NBCC (2010) for Ottawa and Vancouver.
Fragility analysis requires IDA under different intensity of earthquakes. This necessitates the
amplification of seismic records. Though it is common to amplify seismic records based on the
spectral acceleration at fundamental period (Vamvatsikos and Cornell 2002), researchers used
several different approaches to amplify seismic records. Jeong et al. (2012) used effective
fundamental period based on pushover analysis. Kircil and Polat (2006) used elastic fundamental
period as the reference point. In the present study seismic records were scaled to match the target
spectral values obtained by the hunt and fill algorithm discussed earlier to represent different
earthquake intensities. This scaling was done using two spectral values as the basis, first using
the spectral acceleration that corresponded to the code defined design period (Td), and secondly
using the value corresponded to the effective period computed by dynamic analysis using
cracked (effective) moment of inertia, Te. The use of two sets of scaling resulted in two sets of
fragility curves as discussed in the following paragraphs.
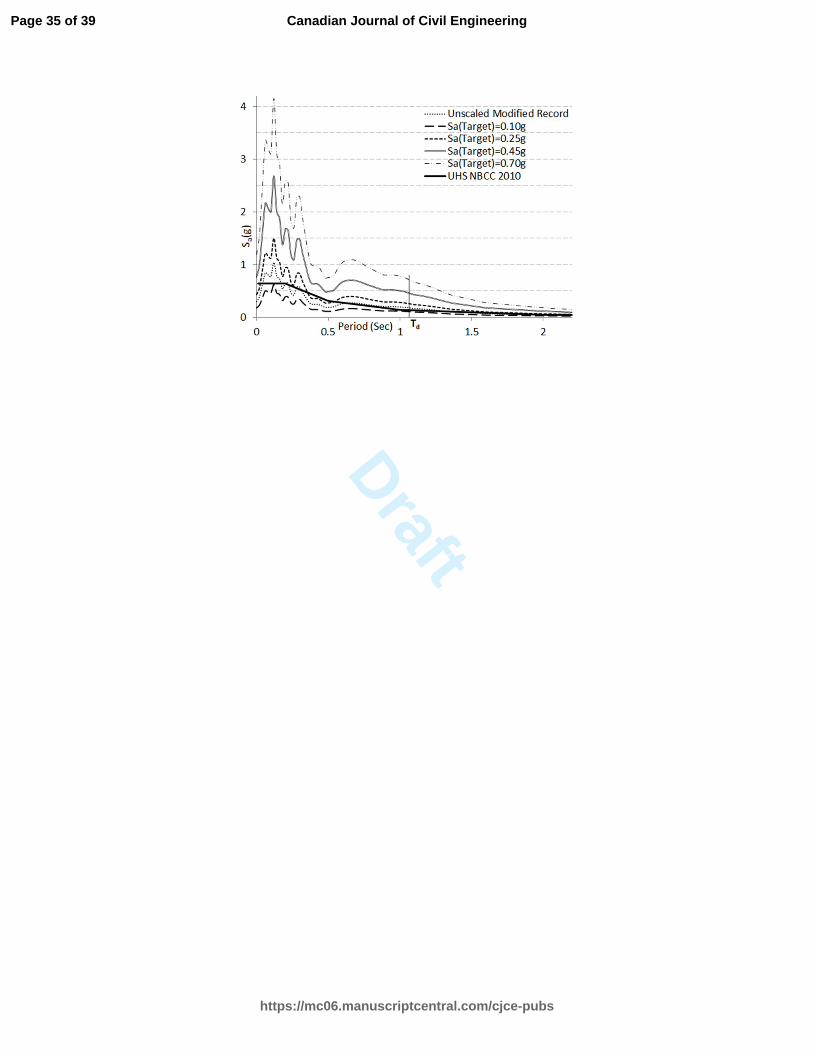
For each target spectral acceleration, seismic record was multiplied by a factor equal to
Sa,Target/Sa(Td) or Sa,Target/Sa(Te), where Sa,Target is the target spectral acceleration, Sa(Td) is spectral
acceleration at design period (Td) and Sa(Te) is the spectral acceleration at effective period (Te).
The amplification procedure was validated against the spectra of scaled records where the
spectra were computed using software PRISM (2011). In all cases the amplified record was able
to generate spectral values that matched Sa,Target. This is shown Fig. 7. The scaled records were
then used to perform incremental dynamic analysis (IDA).
6. Limit States
Page 13 of 39
https://mc06.manuscriptcentral.com/cjce-pubs
Canadian Journal of Civil Engineering
Draft
The fragility curves were developed for different levels of performance. Commonly accepted
performance levels were selected (ASCE 41 2013; FEMA 356 2000b; ACI 374.2R-13 2013).
They consisted of; i) Immediate Occupancy (IO), ii) Life Safety (LS), and iii) Collapse
Prevention (CP). Inter-storey drift ratio was used as a damage indicator, defining the limit state
for each performance level. The inter-storey drift limits were adopted from previous
standards/recommendations as 1% and 2% for IO and LS performance levels (ASCE 41-13,
FEMA 356, ACI 374.2R-13). The CP performance limit state depended on the onset of strength
decay, which in turn depended on the ductility capacity of structural elements. Jeong et al. (2012)
used FEMA 356 limit of 4% inter-storey drift, Akkar et al. (2005) used 75% of the median of
maximum inter-storey drifts from the records considered, Erberik (2008) used 75% of the mean
of maximum inter-storey drifts, Kircil and Polat (2006) used 5% probability of attaining collapse
with 95% confidence level, and Ellingwood et al. (2007) used the median of maximum inter-
storey drift ratio. In the current investigation CP limit state was defined as the median of the
maximum inter-storey drift ratio attained on the IDA curve.
The IO limit represents very limited structural damage, where the force resisting system
nearly retains the pre-earthquake strength and stiffness. Since the risk of fatal injury is very low,
the building can be reoccupied immediately. Various approaches were used by researchers to
identify the IO limit state drift. Jeong et al (2012) used the inter-storey drift corresponding to the
first yield of a structural member, Akkar et al. (2005) used the global yield drift ratio, and Kircil
and Polat (2006) used the maximum inter-storey drift ratio at 5% probability of yielding with
95% confidence level. Erberik (2008) used softening index (SI) proposed by DiPasquale and
Cakmak (1987) as serviceability limit state, analogous to IO. SI was defined as:
(1) SI = 1 − ��
Page 14 of 39
https://mc06.manuscriptcentral.com/cjce-pubs
Canadian Journal of Civil Engineering
Draft
where Tj is the effective period at intermediate spectral acceleration. SI = 0.20 was attained at IO
limit state when Tj = 1.25 Te. This measure of performance was believed to be more reliable than
using 1% drift, since SI provided inter-storey drift ratio for the IO performance level
corresponding to seismic records.
7. Development of Fragility Relationships
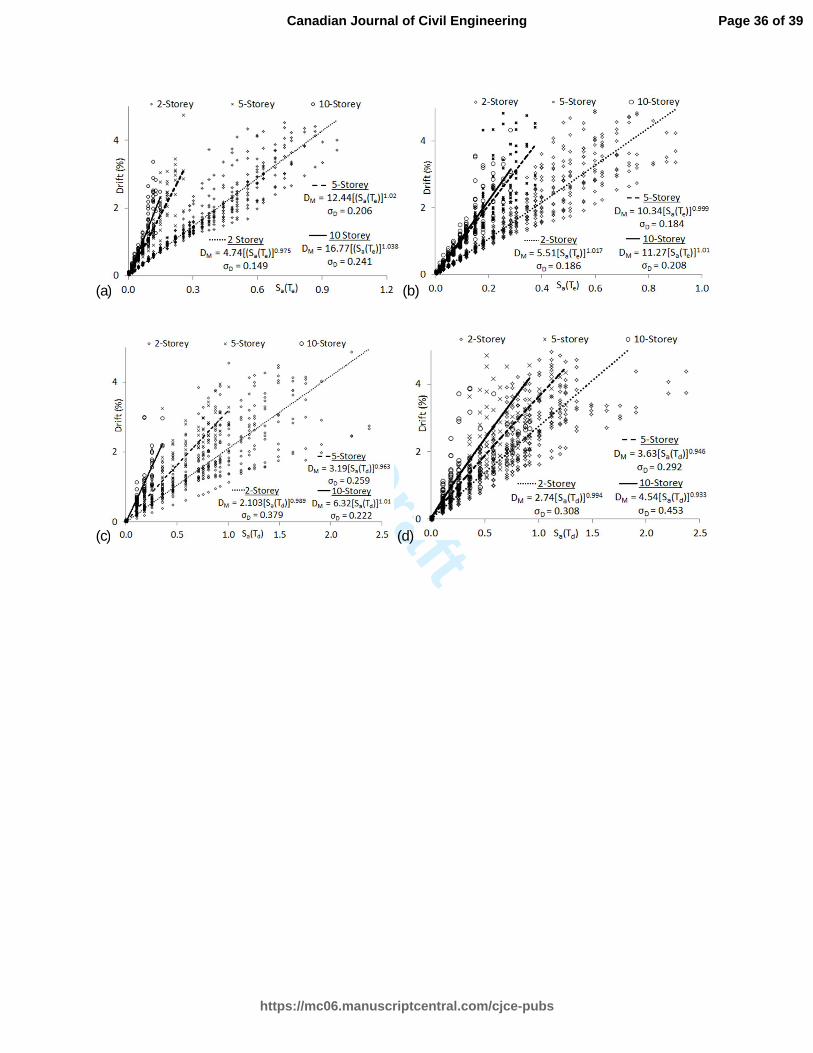
The probability of drift demand (D) at a given Intensity, Sa(Te) or Sa(Td), was calculated with
the method adopted by Cornell et al. (2002). The conditional median of drift demand, DM, was
expressed as a power function, DM = a[Sa(Te)]bε or DM = a[Sa(Td)]
bε; where a and b were
regression coefficients and ε was lognormal random variable (Ramamoorthy et al. 2006). It was
assumed that the demand had lognormal probability distribution at a given spectral acceleration
with the median lognormal random variable equal to unity (ε = 1). Logarithmic standard
deviation of lognormal random variable (σlnε) was equal to the standard deviation of log of
demand (σD) (Jeong et al. 2012). The regression coefficient of the power function was calculated
by linear regression in logarithmic space of the ‘cloud’ response using least square method. The
standard deviation of log of demand (σD) was assumed constant with variation of spectral
acceleration, Sa(Te) or Sa(Td). The value of regression coefficients a and b and standard deviation
of log of demand (σD) are shown in Fig. 8 for Ottawa and Vancouver buildings for which the
analyses were performed with scaled seismic records based on Sa(Te) or Sa(Td). The dispersion
for all limit states (σLS) was considered as 0.3 (Jeong and Elnashai 2007) and the uncertainty in
analytical modeling (σM) was taken as 0.2 with 90% confidence that the analytical model
findings were within 30% of actual value (Ellingwood et al. 2007). The effects of aleatoric and
epistemic uncertainty were calculated according to the equation suggested by Zareian and
Krawinkler (2007), as shown below:
Page 15 of 39
https://mc06.manuscriptcentral.com/cjce-pubs
Canadian Journal of Civil Engineering
Draft
(2) σ��� = �σ��� +σ��
where, � is the uncertainty component associated with aleatoric and epistemic effect in
demand estimation, which was found to be 0.36 in this study. The total uncertainty in finding the
probability of collapse, � , was:
(3) σ��� = �σ���� +σ��
The above computed parameters are then substituted into the equation shown below to find
the conditional probability of exceeding a limit state at a given intensity, Sa(Te) or Sa(Td).
(4) PLS = 1- ɸ (���� ���!"#$# )
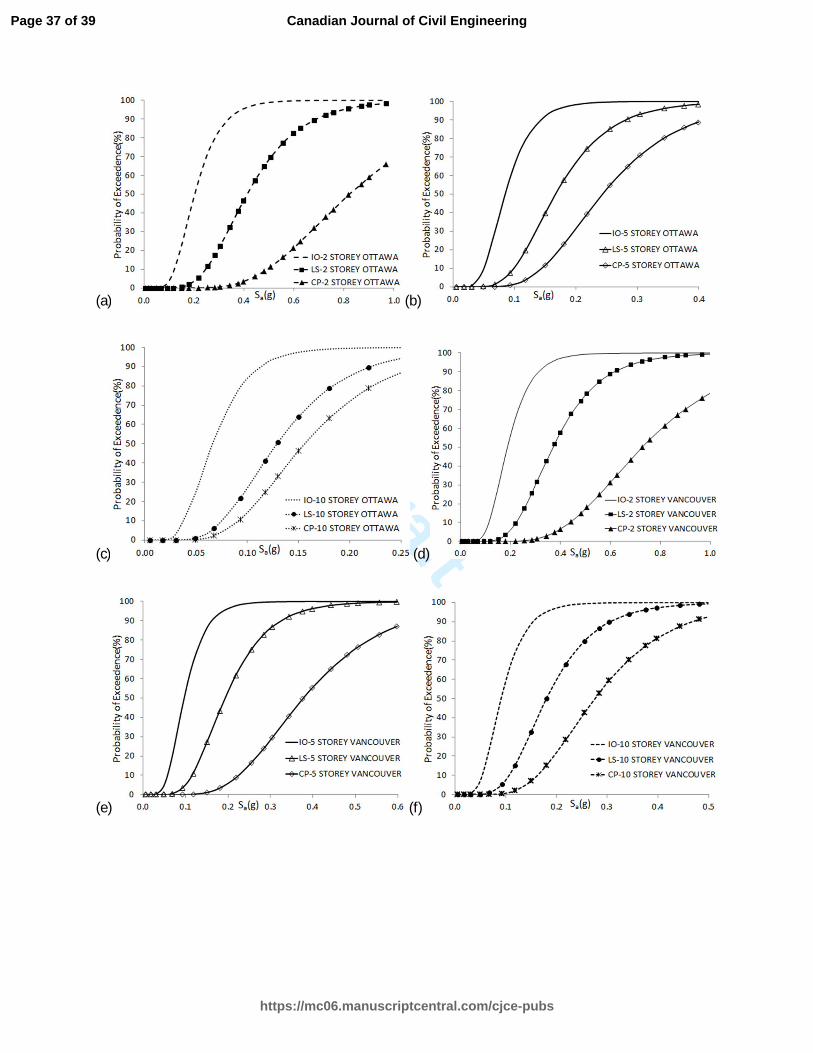
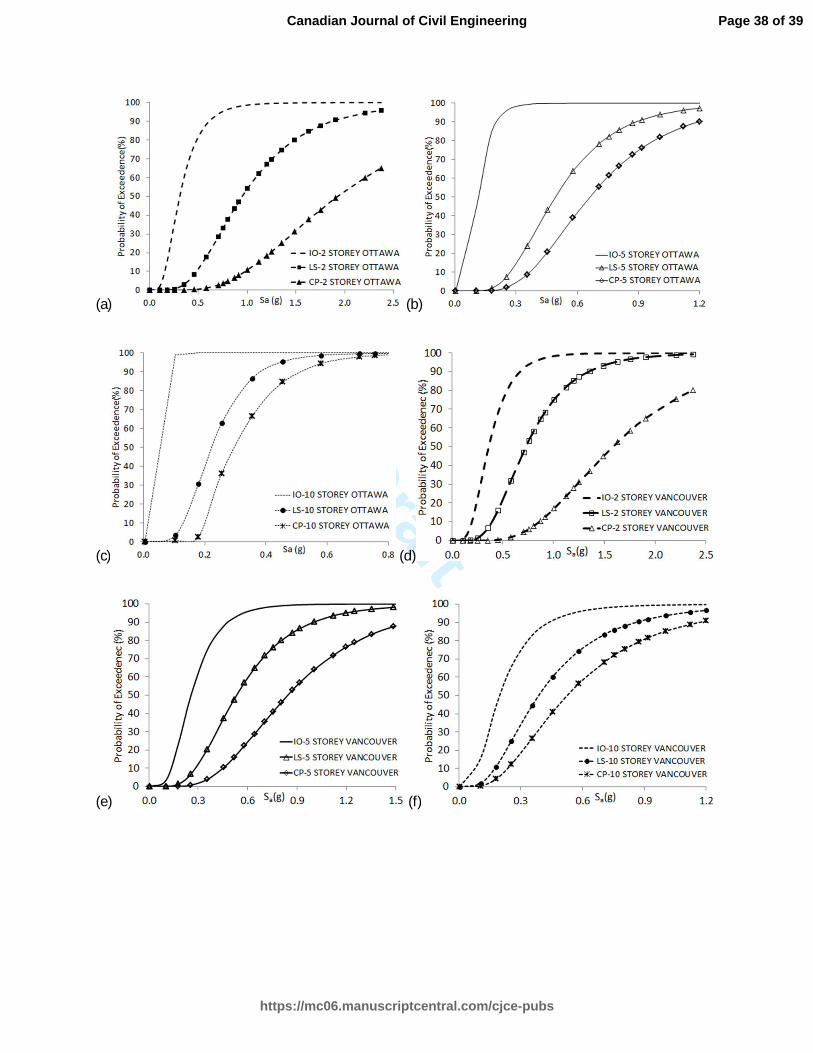
where, DC is median drift capacity specified for a limit state. The fragility curves are then
presented as plots of PLS versus Sa(Te) or Sa(Td). They are shown in Fig. 9 and Fig. 10 for 2, 5,
and 10-storey frame buildings located in Ottawa and Vancouver.
8. Seismic Performance Evaluation
The results of the IDA analysis indicated different levels of inelasticity and sequence of
hinging among frame members at different performance levels. The yielding of beams was
observed prior to developing the IO performance level. The beam yielding occurred at lower
floors first, followed by the yielding of the first-storey columns. Upon the yielding of the
columns, inter-storey drift levels increased considerably as buildings approached the LS
performance level. At LS performance level, more hinging was observed in buildings located in
Ottawa than those in Vancouver. Almost all the first-storey columns hinged at LS level, with
increased plastic hinging in beams at upper floors.
Page 16 of 39
https://mc06.manuscriptcentral.com/cjce-pubs
Canadian Journal of Civil Engineering
Draft
The CP performance level was associated with significant plastification of members, followed
by the failure of individual elements. In the 2-storey buildings, initial hinges formed in the 2nd
storey beams, followed by the 1st storey columns. The structure reached collapse due to the
failure of the 2nd
storey beams, all in the direction of seismic loading, followed by the 1st storey
columns. In the 5-storey buildings, hinges formed in the exterior and interior beams at the 3rd
storey level, which extended to the 4th
, 5th
and 2nd
floors. Column hinging occurred at the 1st
storey level, followed by the columns at the 3rd
floor. Because the columns of the first 2 floors
had higher capacities, the 2nd
floor column hinging followed the hinging of columns at the 3rd
to
4th
floors. The structure reached collapse level performance due to the failure of the first-storey
columns at the base, following the failures of beams at the 3rd
, 4th
, 5th
and 2nd
floor levels. In the
10-storey buildings, the hinges formed in the 2nd
floor interior beams, and extended to the 8th
floor interior beams, followed by the exterior beams. Subsequently, the 1st storey columns hinged
at their base, followed by the hinging of the columns at the 3rd
floor. The same building under
high intensity earthquakes showed failure of both interior and exterior beams between the 2nd
and
7th
floors, followed by the failure of the 3rd
storey columns.
The yield rotations (ƟY) in members were computed to be similar for the same height
buildings in Ottawa and Vancouver. However, the member ductility was different depending on
design ductility demands. The buildings in Ottawa were designed and detailed for ultimate chord
rotations of ƟU = 2.5ƟY, whereas those in Vancouver were designed and detailed for ƟU = 4.0ƟY.
This implies that the onset of strength decay in members of the Ottawa buildings started at lower
rotational values in comparison to those in Vancouver. Therefore, the maximum inter-storey drift
of the Ottawa buildings at the CP performance level were lower than those for Vancouver
buildings. This is shown in Table 2 for both sets of analyses based on the two approaches used
for scaling, i.e., Sa(Te) and Sa(Td).
Page 17 of 39
https://mc06.manuscriptcentral.com/cjce-pubs
Canadian Journal of Civil Engineering
Draft
The fragility response of structures shown in Fig. 9 and Fig. 10 indicate a similar trend among
the buildings in Ottawa and Vancouver, i.e., 10-storey buildings reached the CP level of
performance at lower levels of spectral accelerations because these buildings, with longer
periods, were designed for lower spectral accelerations. The 2-storey buildings showed CP level
of performance at higher spectral values. Limit state probabilities at effective period and design
period are given in Table 2 for two sets of fragility analysis, developed either with Sa(Te)
established based on the building periods obtained from dynamic analysis, which incorporate the
effect of structural softening and period elongation during response, or Sa(Td) established based
on the NBCC-recommended building periods. The fragility curves developed based on Sa(Te)
indicated that, on average, the probability of exceeding the IO performance level was 17% for
buildings in Ottawa at the design earthquake intensity, whereas the buildings in Vancouver had
93% probability of exceeding the same level of performance. At the same intensity, the buildings
in Ottawa developed no probability of exceeding the LS performance level, while those in
Vancouver showed 43% of exceeding the same level of performance. The probability of
exceeding the CP performance level at design intensity in Ottawa was 0%, whereas in
Vancouver it was 6%. The fragility curves depict a trend of increasing probabilities of exceeding
performance limits with increasing number of stories; except for 5-storey building in Ottawa at
IO performance level, which was slightly lower than that for 2-storey building. Table 1 also
shows inter-storey drift ratios (Ɵmax) at the CP performance level. It is noteworthy that the
margin between the LS and CP performance levels is higher for buildings in Vancouver, relative
to those in Ottawa. Similar response of building performance was obtained from the fragility
curves for Sa(Td); buildings in Ottawa had less probability of exceeding limit states in
comparison with buildings in Vancouver. The comparison of building performance as obtained
from the fragility curves for Sa(Te) and Sa(Td) indicate similar probabilities of exceeding LS
performance level in Ottawa. The same is true for the CP performance level for cities. The code
Page 18 of 39
https://mc06.manuscriptcentral.com/cjce-pubs
Canadian Journal of Civil Engineering
Draft
specified Td incorporates potential stiffening effects of non-structural members that may be
present in the building. In reality, the structural period falls between the code specified value of
Td and the dynamic period computed based on a model that consists of structural elements only
(Te). However, the probabilities obtained from the fragility curves developed on the basis of
Sa(Te) and Sa(Td) yield similar probabilities of exceedance for the collapse performance level.
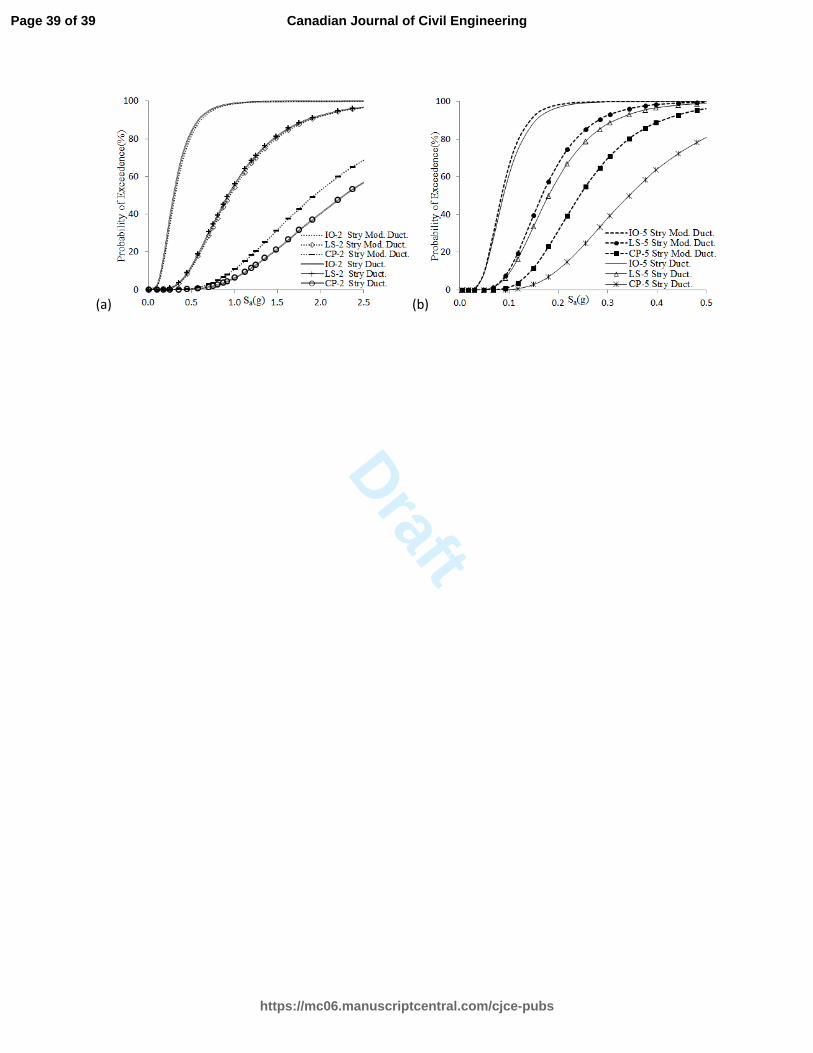
To observe the effect of ductility, additional fragility curves were developed for 2-storey and
5-storey frame buildings in Ottawa when the buildings were designed for the same seismic force
level associated with moderate ductility but having full ductility (ductility=4.0). This resulted in
higher inter-storey drift ratios at the CP performance level. This set of curves is shown in Fig. 11,
indicating the same probabilities for the IO and LS performance levels, but lower probabilities of
exceedance at the CP performance level as compared to those for the moderately ductile
buildings.
The effect of using softening index (SI) on inter-storey drift ratio for IO performance level
was also investigated. The results showed that, using SI resulted in an average of 0.40% and
1.25% inter-storey drift ratios for buildings in Ottawa and Vancouver, respectively, in
comparison with the 1% drift ratio recommended by the existing standards (ASCE 41-13, FEMA
356, ACI 374.2R-13). This observation implies that the Ottawa structures yielded at a lower
rotation than those in Vancouver.
8. Summary and Conclusions
Fragility curves were developed for 2-storey, 5-storey and 10-storey buildings in Ottawa and
Vancouver for vulnerability assessment of reinforced concrete frame buildings with regular
structural layouts. The earthquake records were scaled based on spectral accelerations at
effective period (Te) and design period (Td) of structures. It was found that at design period
Page 19 of 39
https://mc06.manuscriptcentral.com/cjce-pubs
Canadian Journal of Civil Engineering
Draft
spectral acceleration, the Ottawa buildings showed less probability of exceeding limit state
performance levels when compared with those for Vancouver. The Buildings in Vancouver,
designed after the 1985 threshold year showed on average 43% probability of exceeding the
NBCC target performance level of life safety at design earthquake, whereas the same
performance level is exceeded with an average probability of 0% in buildings located in Ottawa.
The buildings in Vancouver showed higher inter-storey drift at collapse, with 6% probability of
exceedance than those in Ottawa, which showed no probability of exceedance. The fragility
curves based on Sa(Td) did not show a significant difference in probabilities of exceeding the CP
performance levels when compared with those developed based on Sa(Te). Because the design
period of Td reflects the as-built conditions of the buildings incorporating the possible stiffening
effects of non-structural elements, it may be more appropriate to use them for seismic
vulnerability assessment, with the fragility curves based on Te reflecting possible softening of
buildings during response.
The fragility curves developed in this investigation were all generated using buildings
with specific heights, designed based on the 2010 NBCC using moderately ductile and fully
ductile design requirements for Ottawa and Vancouver, respectively. While the same ductility
capacities may be attained in buildings designed between 1985 and 2010, the design force levels
may show some fluctuations during this period. Therefore, the use the same fragility curves for
buildings designed by editions of NBCC other than the 2010 version requires judgement with
respect to the effects of variations in design force levels.
References
Akkar, S., Susuoglu, H., and Yakut, A. 2005. Displacement-Based Fragility Functions for Low-
and Mid-rise Ordinary Concrete Buildings. Earthquake Spectra. 21(4):901-927.
doi: http://dx.doi.org/10.1193/1.2084232
Page 20 of 39
https://mc06.manuscriptcentral.com/cjce-pubs
Canadian Journal of Civil Engineering

Draft
American Concrete Institute (ACI). 2013. Guide for testing reinforced concrete structural
elements under slowly applied simulated seismic loads. ACI committee 374. ACI 374.2R-13.
Michigan, United States.
American Society of Civil Engineers (ASCE). 2014. Seismic evaluation and retrofit of existing
buildings. ASCE/SEI 41-13. Virginia, United States.
Atkinson, G.M. 2009. Earthquake time histories compatible with the 2005 National building
code of Canada uniform hard spectrum. Canadian Journal of Civil Engineering. 36(6):991-
1000. doi: 10.1139/L09-044
Beng Ghee, A., Priestley, M.J.N., and Park, R. 1981. Ductility of reinforced concrete bridge
piers under seismic loading. Report 81-3, Department of Civil Engineering, University of
Canterbury, New Zealand..
Borzi, B., Pinho, R., and Crowley, H. 2008. Simplified pushover-based vulnerability analysis for
large-scale assessment of RC buildings. Engineering Structures. 30(3):804-820.
doi:10.1016/j.engstruct.2007.05.021
Canadian Standards Association (CSA). 1973. Design of concrete structures. CSA standards
update service. CSA A23.3-1973. Mississauga, Canada.
Canadian Standards Association (CSA). 1984. Design of concrete structures. CSA standards
update service. CSA A23.3-1984. Mississauga, Canada.
Canadian Standards Association (CSA). 2004. Design of concrete structures. CSA standards
update service. CSA A23.3-04. Mississauga, Canada.
Computers and Structures, Inc (CSI). 2008. ETABS. Nonlinear Version 9.5.0. Computers and
Structures, Inc. Berkeley, CA.
Page 21 of 39
https://mc06.manuscriptcentral.com/cjce-pubs
Canadian Journal of Civil Engineering
Draft
Computers and Structures, Inc. (CSI). 2013. PERFORM-3D. Version 5.0.1. Computers and
Structures, Inc. Berkeley, CA.
Computers and Structures, Inc (CSI), 2013a. SAP2000. Ultimate 16.0.0. Computers and
Structures, Inc. Berkeley, CA.
Cornell, CA., Jalayer, F., Hamburger, RO., and Foutch, D.A. 2002. Probabilistic basis for 2000
SAC Federal Emergency Management Agency steel moment frame guidelines. Journal of
Structural Engineering. Volume 128, Special Issue: Steel moment frames after Northridge-
PartII. Pages: 526-533. doi: 10.1061/(ASCE)0733-9445(2002)
DiPasquale, E., and Cakmak A.S. 1987. Detection and assessment of seismic structural damage.
Technical Report NCEER-87-0015. National Center for Earthquake Engineering Research.
State University of New York.
Ellingwood, B.R., Celik, O.C., and Kinali, K. 2007. Fragility assessment of building structural
systems in Mid-America. Earthquake Engineering and Structural Dynamics. 36(13):1935-
1952. doi: 10.1002/eqe.693
Erberik, M.A. 2008. Fragility-based assessment of typical mid-rise and low-rise RC buildings in
Turkey. Engineering Structures. 30(5):1360-1374. doi:10.1016/j.engstruct.2007.07.016
Federal Emergency Management Agency (FEMA). 2000. Prestandard and commentary for the
seismic rehabilitation of buildings. FEMA 356. Washington, D.C.
Federal Emergency Management Agency (FEMA). 2000a. Recommended seismic design criteria
for new steel moment-frame buildings. SAC Joint Venture. FEMA 350. Washington, D.C.
Geological Survey of Canada (GSC). 2016. Earthquake Zones in Canada. Available from
http://www.earthquakescanada.nrcan.gc.ca/zones/index-en.php (Last accessed 12 May 2016)
Page 22 of 39
https://mc06.manuscriptcentral.com/cjce-pubs
Canadian Journal of Civil Engineering
Draft
Ghodsi T., Ruiz J.A.F. 2010. Pacific earthquake engineering research/seismic safety commission
tall building design case study 2. The Structural Design of Tall and Special Buildings. 19(1-
2):197–256. doi: 10.1002/tal.542
Goulet, C.A., Haselton, C.B., Mitrani-Reiser, J., Beck,, J.L., Deierlein, G.G., Porter, K.A., and
Stewart, J.P. 2007. Evaluation of the seismic performance of a code-conforming reinforced-
concrete frame building—from seismic hazard to collapse safety and economic losses.
Earthquake Engineering & Structural Dynamics. 36(13):1973–1997. doi: 10.1002/eqe.694
Hopper, M. W. 2009. Analytical models for the nonlinear seismic response of reinforced
concrete frames. M.Sc. Thesis. Department of Architectural Engineering. The Pennsylvania
State University. Pennsylvania.
Inel, M., and Ozmen, H.B. 2006. Effects of plastic hinge properties in nonlinear analysis of
reinforced concrete buildings. Engineering Structures. 28(11):1494-1502.
doi:10.1016/j.engstruct.2006.01.017
Jeong, S.H., and Elnashai, A.S. 2007. Probabilistic fragility analysis parameterized by
fundamental response quantities. Engineering Structures. 29(6):11238-1251.
doi:10.1016/j.engstruct.2006.06.026
Jeong, S.H., Mwafy, A.M., Elnashai, A.S. 2012. Probabilistic seismic performance assessment of
code-compliant multi-story RC buildings. Engineering Structures. 34:527-537.
doi:10.1016/j.engstruct.2011.10.019
Kircil, M.S., Polat, Z. 2006. Fragility analysis of mid-rise R/C frame buildings. Engineering
Structures. 28(9):1335-1345. doi:10.1016/j.engstruct.2006.01.004
Liao, W. C. 2010. Performance-based plastic design of earthquake resistant reinforced concrete
moment frames. Ph.D. Thesis. Department of Civil Engineering, The University of Michigan.
Page 23 of 39
https://mc06.manuscriptcentral.com/cjce-pubs
Canadian Journal of Civil Engineering

Draft
Liel, A.B., Haselton C.B., and Deierlein, G.G. 2011. Seismic collapse safety of reinforced
concrete buildings. II: Comparative assessment of nonductile and ductile moment frames.
Journal of the Structural Engineering. 137(4):492-502. doi: 10.1061/(ASCE)ST.1943-
541X.0000275
Mitchell, D., Paultre, P., Tinawi, R., Saatcioglu, M., Tremblay, R., Elwood, K., Adams, J., and
DeVall, R. 2010. Evolution of seismic design provisions in the national building code of
Canada. Canadian Journal of Civil Engineering, 37(9): 1157-1170 (2010). doi:10.1139/L10-
054
National building code of Canada (NBCC). 1953. National Research Council of Canada. Ottawa,
Canada.
National building code of Canada (NBCC). 1965. National Research Council of Canada. Ottawa,
Canada.
National building code of Canada (NBCC). 1970. National Research Council of Canada. Ottawa,
Canada.
National building code of Canada (NBCC). 1975. National Research Council of Canada. Ottawa,
Canada.
National building code of Canada (NBCC). 1980. National Research Council of Canada. Ottawa,
Canada.
National building code of Canada (NBCC). 1985. National Research Council of Canada. Ottawa,
Canada.
National building code of Canada (NBCC). 1990. National Research Council of Canada. Ottawa,
Canada.
Page 24 of 39
https://mc06.manuscriptcentral.com/cjce-pubs
Canadian Journal of Civil Engineering
Draft
National building code of Canada (NBCC). 2005. National Research Council of Canada. Ottawa,
Canada.
National building code of Canada (NBCC). 2010. National Research Council of Canada. Ottawa,
Canada.
National building code of Canada (NBCC). 2010. National Research Council of Canada. Ottawa,
Canada.
National Research Council of Canada (NRCC). 1993. Manual for Screening of Buildings for
Seismic Investigation. ISBN 0-660-15381-5. NRCC 36943. Ottawa, Canada.
Ozcebe, G., and Saatcioglu, M. (1987). Confinement of concrete columns for seismic loading.
ACI Structural Journal. 84(4):308-315.
Ozcebe, G., and Saatcioglu, M. (1989). Hysteretic shear model for reinforced concrete members.
Journal of the Structural Engineering, ASCE. 115(1):132-148. doi: 10.1061/(ASCE)0733-
9445(1989)115:1(132)
Park, R., Priestley, M.J.N., and Gill, W.D. (1982). Ductility of square-confined concrete
columns. Journal of the Structural Engineering, ASCE. 108(4):929-950.
Priestley, M., Verma, R., and Xiao, Y. (1994). Seismic Shear Strength of Reinforced Concrete
Columns. Journal of the Structural Engineering, ASCE. 120(8):2310–2329. doi:
10.1061/(ASCE)0733-9445(1994)120:8(2310)
PRISM (2011). Version 1.1. Earthquake Engineering Research Group. Department of
Architectural engineering, INHA University, South Korea.
Ramamoorthy, S., Gardoni, P., and Bracc, J. (2006). Probabilistic Demand Models and Fragility
Curves for Reinforced Concrete Frames. Journal of the Structural Engineering, ASCE.
132(10):1563–1572. doi:10.1061/(ASCE)0733-9445(2006)
Page 25 of 39
https://mc06.manuscriptcentral.com/cjce-pubs
Canadian Journal of Civil Engineering
Draft
Reyes, JC., and Chopra, AK. 2012. Modal pushover-based scaling of two components of ground
motion records for nonlinear RHA of structures. Earthquake Spectra. August 2012.
28(3):1243-1267. doi: http://dx.doi.org/10.1193/1.4000069
Saatcioglu, M., and Ozcebe, G. 1989. Response of reinforced concrete columns to simulated
seismic loading. ACI Structural Journal. 86(1):3-12.
Tuna Z. 2012. Seismic Performance, Modeling, and Failure Assessment of Reinforced Concrete
Shear Wall Buildings. Ph.D. Thesis. Department of Civil Engineering, University of
California. Los Angeles.
Vamvatsikos, D., and Cornell, CA. 2002. Incremental dynamic analysis. Earthquake Engineering
& Structural Dynamics. 31(3):491-514. doi: 10.1002/eqe.141
Vamvatsikos, D., and Cornell, C.A. 2004. Applied incremental dynamic analysis. Earthquake
Spectra. 20(2):523-553. doi: 10.1193/1.1737737
Zahn, F.A., Park, R., and Priestley, M.J.N. 1986. Design of reinforced concrete bridge columns
for strength and ductility, Report 86-7, Department of Civil Engineering, University of
Canterbury, New Zealand.
Zareian, F., and Krawinkler, H. 2007. Assessment of probability of collapse and design for
collapse safety. Earthquake Engineering and Structural Dynamics. 36(13):1901-1914. doi:
10.1002/eqe.702
Page 26 of 39
https://mc06.manuscriptcentral.com/cjce-pubs
Canadian Journal of Civil Engineering
Draft
Table 1. Structural member details of 2, 5, 10-storey structures.
2 Storey 5 Storey 10 Storey
East and West East and West East West
Size Rebar Size Rebar Size Rebar Rebar
Corner Column 1-Top 300X300 8-20M 300X300 8-20M 350X350 4-25M+4-15M 4-25M+4-15M
Ext Column 1-2 300X300 4-30M 300X300 4-30M 350X350 16-20M 4-30M+8-20M
Ext Column 3-Top - - 300X300 4-25M 350X350 4-25M+4-15M 8-25M
Int-1 Column 1-2 325X325 4-20M+4-15M 450X450 12-25M 500X500 12-30M+6-20M 12-30M+6-20M
Int-1 Column 3-5 - - 450X450 4-25M+4-20M 500X500 8-25M+8-20M 8-30M+8-25M
Int-1 Column 6-10 - - - 500X500 4-25M+4-15M 4-25M+4-20M
Int-2 Column 1-2 325X325 4-20M+4-15M 450X450 4-30M+8-20M 500X500 12-30M+6-20M 12-30M+6-20M
Int-2 Column 3-5 - - 450X450 4-30M 500X500 8-25M+8-15M 12-25M+8-20M
Int-2 Column 6-10 - - - 500X500 4-25M+4-15M 4-25M+4-20M
Int-3 Column 1-2 325X325 4-20M+4-15M 450X450 4-25M+8-20M 500X500 8-30M+8-25M 12-30M+6-20M
Int-3 Column 3-5 - - 450X450 8-20M 500X500 4-25M+8-20M 12-25M+4-20M
Int-3 Column 6-10 - - - 500X500 4-25M+4-15M 4-25M+4-20M
Ext Beam Top 300X500 3-20M 300X500 3-20M 350X500 3-20M 3-20M
Ext Beam Bottom 300X500 2-20M 300X500 2-20M 350X500 2-20M 2-20M
East West
Int Beam 1-5 Top 300X500 4-20M 4-20M 300X500 3-25M 350X500 4-25M 4-25M
Int Beam 1-5 Bottom 300X500 3-20M 4-20M 300X500 2-25M 350X500 2-25M 4-25M
Int Beam 6-10 Top - - - - - 350X500 3-25M 3-25M
Int Beam 6-10 Bottom - - - - - 350X500 3-20M 3-25M
Table 2. Comparison of limit state probabilities of 2, 5, 10-storey structures.
Fragility Based
on Sa(Td)
Fragility Based
on Sa(Te)
Prob. of
Exceedance at
Sa(Td)
Prob. of
Exceedance at
Sa(Te)
Building
Height City
Td,
sec
Te,
sec
Sa(Td),
g
Sa(Te),
g
Ɵmax
(%)
IO
(%)
LS
(%)
CP
(%)
IO
(%)
LS
(%)
CP
(%)
10-Storey Ottawa 1.79 2.84 0.07 0.05 2.44 68 2 0 26 1 0
5-Storey Ottawa 1.06 2.04 0.13 0.05 2.94 58 0 0 10 0 0
2-Storey Ottawa 0.54 1.08 0.30 0.13 3.92 47 2 0 14 0 0
10-Storey Vancouver 1.79 2.84 0.20 0.17 3.07 52 15 7 95 48 14
5-Storey Vancouver 1.06 2.04 0.32 0.17 3.91 67 15 2 93 42 3
2-Storey Vancouver 0.54 1.08 0.62 0.32 3.99 87 36 9 92 38 2
Page 27 of 39
https://mc06.manuscriptcentral.com/cjce-pubs
Canadian Journal of Civil Engineering
Draft
Fig. 1. Evolution of seismic design base shear ratio of 2, 5, 10-storey structures
Fig. 2. Elevation view of the buildings
Fig. 3. Maximum drift capacity on IDA Curve
Fig. 4. Effect of EDF on a Moment vs Total Chord Rotation hysteresis loop area in PERFORM-
3D
Fig. 5. Typical moment-rotation envelope curve for same yield capacity member
Fig. 6. Comparison of mean spectral acceleration of seismic records with NBCC (2010) UHS for
(a) Eastern Canada (Ottawa) and (b) Western Canada (Vancouver)
Fig. 7. Spectral acceleration for single record amplified based on Sa(Td)
Fig. 8. Regression analysis of 2, 5, 10-storey structures in (a) Eastern Canada (Ottawa) and (b)
Western Canada (Vancouver) with amplified seismic records based on Sa(Te); (c) Eastern
Canada (Ottawa) and (d) Western Canada (Vancouver) with amplified seismic records
based on Sa(Td)
Fig. 9. Fragility response of (a) 2-storey, (b) 5-storey, (c) 10-storey structures in Eastern Canada
(Ottawa) and (d) 2-storey, (e) 5-storey, (f) 10-storey structures in Western Canada
(Vancouver) developed with amplified seismic records based on Sa(Te).
Fig. 10. Fragility response of (a) 2-storey, (b) 5-storey, (c) 10-storey structures in Eastern
Canada (Ottawa) and (d) 2-storey, (e) 5-storey, (f) 10-storey structures in Western Canada
(Vancouver) developed with amplified seismic records based on Sa(Td).
Fig. 11. Comparison of (a) 5-storey and (b) 2-storey structures fragility responses developed
with Eastern Canada (Ottawa) seismic records.
Page 28 of 39
https://mc06.manuscriptcentral.com/cjce-pubs
Canadian Journal of Civil Engineering
Draft
Page 29 of 39
https://mc06.manuscriptcentral.com/cjce-pubs
Canadian Journal of Civil Engineering
Draft
Page 30 of 39
https://mc06.manuscriptcentral.com/cjce-pubs
Canadian Journal of Civil Engineering
Draft
Page 31 of 39
https://mc06.manuscriptcentral.com/cjce-pubs
Canadian Journal of Civil Engineering
Draft
Page 32 of 39
https://mc06.manuscriptcentral.com/cjce-pubs
Canadian Journal of Civil Engineering
Draft
Page 33 of 39
https://mc06.manuscriptcentral.com/cjce-pubs
Canadian Journal of Civil Engineering
Draft(a)
``
(b)
Page 34 of 39
https://mc06.manuscriptcentral.com/cjce-pubs
Canadian Journal of Civil Engineering
Draft
Page 35 of 39
https://mc06.manuscriptcentral.com/cjce-pubs
Canadian Journal of Civil Engineering
Draft(a) (b)
(c) (d)
Page 36 of 39
https://mc06.manuscriptcentral.com/cjce-pubs
Canadian Journal of Civil Engineering
Draft(a) (b)
(c) (d)
(e) (f)
Page 37 of 39
https://mc06.manuscriptcentral.com/cjce-pubs
Canadian Journal of Civil Engineering
Draft(a) (b)
(c) (d)
(e) (f)
Page 38 of 39
https://mc06.manuscriptcentral.com/cjce-pubs
Canadian Journal of Civil Engineering
Draft(a) (b)
Page 39 of 39
https://mc06.manuscriptcentral.com/cjce-pubs
Canadian Journal of Civil Engineering