Embed Size (px)
Citation preview

Technical Report Documentation Page
1. Report No.
SSRP-2001/25
2. Government Accession No.
3. Recipient’s Catalog No.
4. Title and Subtitle
SEISMIC DESIGN AND PERFORMANCE OF PRECAST CONCRETE SEGMENTAL BRIDGE COLUMNS
5. Report Date
May 2002
6. Performing Organization Code
7. Author(s)
Joshua T. Hewes and M. J. Nigel Priestley
8. Performing Organization Report No.
UCSD / SSRP-2001/25 9. Performing Organization Name and Address
Department of Structural Engineering School of Engineering
10. Work Unit No. (TRAIS)
University of California, San Diego La Jolla, California 92093-0085
11. Contract or Grant No.
59A0051 12. Sponsoring Agency Name and Address
California Department of Transportation
13. Type of Report and Period Covered
Final Report (1 of 1)
Division of Engineering Services 1801 30th St., West Building MS-9
Sacramento, California 95807
14. Sponsoring Agency Code
15. Supplementary Notes
Prepared in cooperation with the State of California Department of Transportation. 16. Abstract
This research involved the investigation of the performance of unbonded post-tensioned precast concrete segmental
bridge columns under lateral earthquake loading. Two columns with a high aspect ratio and two columns with a low
aspect ratio were tested under simulated lateral seismic loading. Steel jackets of different thickness were used to confine
the plastic end region at the base of each column. The test units all contained the same amount of prestressing steel and
each was tested twice: the first time with a relatively low initial tendon stress, and the second with a higher initial
prestress level. An analytical model describing the column force-displacement behavior was used to predict column
response prior to testing.
All test units performed well for the first test with the low initial tendon stress. The columns underwent large nonlinear
displacements up to drifts on the order of 4.0% without experiencing significant or sudden loss of strength. For the
second tests, the units with thicker steel jackets performed better than those with thinner jackets. Use of the thicker jackets
enabled the columns to achieve a drift of 6.0% with only minimal capacity degradation. Because of the unbonded tendon
design, the residual drift after the tests was minimal. Observed column damage was low in general, and consisted
primarily of minor concrete crushing at the column base. The analytical model reasonably predicted the column force-
displacement response. 17. Key Words
Seismic Design, Seismic Performance, Precast, Concrete, Post-tensioned, Bridge Columns
18. Distribution Statement
Unlimited
19. Security Classification (of this report)
20. Security Classification (of this page)
21. No. of Pages
~230
22. Price
Form DOT F 1700.7 (8-72) Reproduction of completed page authorized

DISCLAIMER The contents of this report reflect the views of the authors who are responsible for the
facts and accuracy of the data presented herein. The contents do not necessarily reflect
the official views or policies of the State of California or the Federal Highway
Administration. This report does not constitute a standard, specification or regulation.
i

ABSTRACT
This research involved the investigation of the performance of unbonded post-tensioned
precast concrete segmental bridge columns under lateral earthquake loading. Two
columns with a high aspect ratio and two columns with a low aspect ratio were tested
under simulated lateral seismic loading. Steel jackets of different thickness were used to
confine the plastic end region at the base of each column. The specimens all contained
the same amount of prestressing steel and each was tested twice: the first time with a
relatively low initial tendon stress, and the second with a higher initial prestress level. An
analytical model describing the column force-displacement behavior was used to predict
column response prior to testing.
All specimens performed well for the first test with the low initial tendon stress. The
columns underwent large nonlinear displacements up to drifts on the order of 4.0%
without experiencing significant or sudden loss of strength. For the second tests, the
specimens with thicker steel jackets performed better than those with thinner jackets. Use
of the thicker jackets enabled the columns to achieve a drift of 6.0% with only minimal
capacity degradation. Because of the unbonded tendon design, the residual drift after the
tests was minimal. Observed column damage was low in general, and consisted
primarily of minor concrete crushing at the column base. The analytical model
reasonably predicted the column force-displacement response.
ii

ACKNOWLEDGEMENTS This research was funded by the California Department of Transportation under contract
number DOT 59A0051, and their help is greatly appreciated. The assistance provided by
VStructural LLC of Grand Prarie, Texas is also appreciated. The assistance given by
Doug Wright during the project is appreciated.
A sincere thanks is given to Dr. M. J. Nigel Priestley, who directed the research effort.
Thanks are also given to the technical support staff of the Charles Lee Powell Structural
Engineering Labs. The support and guidance of Pedro Silva and Sri Sritharan is much
appreciated. Encouragement and comic relief provided by my fellow graduate students is
appreciated.
iii

LIST OF SYMBOLS A Cross sectional area
Ac Concrete cross sectional area
Ag Gross concrete cross sectional area
As Prestressing steel cross sectional area
Ah Cross sectional area of hoop or spiral reinforcement
C Column concrete compression force
c Neutral axis depth
cov Concrete cover distance to the longitudinal reinforcement
D Diameter of column
Dj Diameter of steel jacket
Ec Young’s Modulus of concrete
Es Young’s Modulus of prestressing steel
Fs Prestressing steel force
Fsi Initial prestressing steel force
fc Concrete stress
fc' Unconfined concrete compression strength
f’cc Confined concrete compression strength
fl Lateral confining stress
fs Prestressing steel stress
fsi Initial prestressing steel stress
fs,inelastic Prestressing steel stress after yielding of prestressing steel
fyh Hoop or spiral reinforcement yield stress
fyj Steel jacket yield stress
H Column height
Keff Column secant stiffness at maximum displacement response
Ki Column stiffness at theoretical decompression force
L Distance between the point of maximum moment and point of contra-flexure
Lp Analytical plastic hinge length
Lt Unbonded tendon length
iv

lg Linear potentiometer gage length
lw Distance between linear potentiometers on opposite column faces
M Moment
M1 Decompression moment
M2 Yield moment
M3 Moment in non-linear region of response
P Axial dead load
Pa Axial force from dead load and prestress force
P1 Lateral force at stage one response level
P2 Lateral force at stage-two response level
P3 Lateral force at stage-three response level
s Spacing of transverse reinforcement
tj Steel jacket wall thickness
V Column shear force
Vd Design shear strength
Vc Concrete shear strength
Vp Shear strength due to axial compression force
Vs Shear strength of transverse reinforcement
Vsj Shear strength of steel jacket
x Distance to concrete fiber from centroid of section
x Distance from linear potentiometer to extreme concrete compression fiber
α Angle between diagonal compression strut and column axis
α Column aspect ratio shear strength factor
β Longitudinal reinforcement ratio shear strength factor
γ Allowable shear stress factor
∆t Total displacement
∆p Plastic displacement
∆e Elastic displacement
∆p Plastic displacement
∆u Ultimate displacement
v

∆1 Displacement at stage one response
∆1 Displacement measured by a linear potentiometer in a curvature cell
∆2 Yield displacement
∆2 Displacement measured by a linear potentiometer in a curvature cell
∆2e Elastic component of displacement at stage two response
∆2p Plastic component of displacement at stage two response
∆3e Elastic component of displacement at stage three response
∆3p Plastic component of displacement at stage three response
∆Fs Incremental prestress force increase
∆fs Incremental prestress stress increase
∆Lt Increase in tendon length
εs Prestressing steel strain
∆εs Prestressing steel strain increase
εc Concrete strain
εcc Concrete strain at peak concrete stress
εcu Ultimate concrete strain
εsm Steel strain at maximum stress
ρj Volumetric ratio of steel jacket
ρl Longitudinal reinforcement ratio
φ Curvature
φp Plastic curvature
φu Ultimate curvature
φ1 Critical section curvature at stage one response
φ2 Critical section curvature at stage two response
φ3 Critical section curvature at stage three response
θ Angle between an inclined flexure-shear crack and the column axis
θ Column drift ratio
θp Plastic rotation
vi

TABLE OF CONTENTS
DISCLAIMER.................................................................................................................................. I
ABSTRACT ....................................................................................................................................II
ACKNOWLEDGEMENTS .......................................................................................................... III
LIST OF SYMBOLS..................................................................................................................... IV
TABLE OF CONTENTS .............................................................................................................VII
CHAPTER 1 INTRODUCTION............................................................................................... 1
1.1 General ............................................................................................................................ 1
1.2 Research Objective.......................................................................................................... 3
CHAPTER 2 ANALYTICAL PROCEDURES ........................................................................ 5
2.1 Introduction ..................................................................................................................... 5
2.2 Overview of Column Response....................................................................................... 5
2.3 Force – Displacement Response...................................................................................... 8
2.3.1 Moment – Curvature Analysis................................................................................. 9
2.3.2 Elastic Displacement ............................................................................................. 14
2.3.3 Plastic Displacement ............................................................................................. 16
2.4 Material Constitutive Behavior ..................................................................................... 18
2.4.1 Concrete Stress-Strain Model................................................................................ 18
2.4.2 Prestressing Steel Stress-Strain Model .................................................................. 21
2.5 Column Shear Strength Model ...................................................................................... 22
CHAPTER 3 MODELING, TEST SET-UP AND INSTRUMENTATION ........................... 25
vii

3.1 Introduction ................................................................................................................... 25
3.2 Prototype Structure........................................................................................................ 25
3.3 Laboratory Test Model .................................................................................................. 25
3.4 Test Set-Up.................................................................................................................... 27
3.5 Loading Sequence ......................................................................................................... 31
CHAPTER 4 HIGH ASPECT RATIO COLUMNS................................................................ 33
4.1 Design of Columns ........................................................................................................ 33
4.2 Construction Procedure ................................................................................................. 37
4.3 Materials Testing ........................................................................................................... 49
4.4 Column Prestressing...................................................................................................... 51
4.4.1 First Stressing ........................................................................................................ 51
4.4.2 Second Stressing.................................................................................................... 53
4.5 Experimental Results – Specimen JH1-T1.................................................................... 56
4.5.1 Observations under Repeated Cyclic Loading ...................................................... 56
4.5.2 Force-Displacement Response .............................................................................. 63
4.5.3 Test Data................................................................................................................ 67
4.6 Experimental Results – Specimen JH1-T2.................................................................... 78
4.6.1 Observations under Repeated Cyclic Loading ...................................................... 78
4.6.2 Force-Displacement Response .............................................................................. 82
4.6.3 Test Data................................................................................................................ 85
4.7 Experimental Results – Specimen JH2-T1.................................................................... 95
4.7.1 Observations under Repeated Cyclic Loading ...................................................... 95
4.7.2 Force – Displacement Response.......................................................................... 101
4.7.3 Test Data.............................................................................................................. 104
viii

4.8 Experimental Results – Specimen JH2-T2.................................................................. 113
4.8.1 Observations under Repeated Cyclic Loading .................................................... 113
4.8.2 Force – Displacement Response.......................................................................... 117
4.8.3 Test Data.............................................................................................................. 119
4.9 Discussion of Results .................................................................................................. 130
CHAPTER 5 LOW ASPECT RATIO COLUMNS .............................................................. 135
5.1 Design of Columns ...................................................................................................... 135
5.2 Construction Procedure ............................................................................................... 135
5.3 Materials Testing ......................................................................................................... 141
5.4 Column Prestressing.................................................................................................... 143
5.4.1 First Stressing ...................................................................................................... 143
5.4.2 Second Stressing.................................................................................................. 144
5.5 Experimental Results – Specimen JH3-T1.................................................................. 149
5.5.1 Observations under Repeated Cyclic Loading .................................................... 149
5.5.2 Force – Displacement Response.......................................................................... 156
5.5.3 Test Control Data ................................................................................................ 159
5.6 Experimental Results – Specimen JH3-T2.................................................................. 168
5.6.1 Observations under Repeated Cyclic Loading .................................................... 168
5.6.2 Force – Displacement Response.......................................................................... 173
5.6.3 Test Data.............................................................................................................. 176
5.7 Experimental Results - Specimen JH4-T1.................................................................. 185
5.7.1 Observations under Repeated Cyclic Loading .................................................... 185
5.7.2 Force – Displacement Response.......................................................................... 190
5.7.3 Test Data.............................................................................................................. 192
ix

5.8 Experimental Results – Specimen JH4-T2.................................................................. 202
5.8.1 Observations under Repeated Cyclic Loading .................................................... 202
5.8.2 Force – Displacement Response.......................................................................... 206
5.8.3 Test Data.............................................................................................................. 209
5.9 Discussion of Results .................................................................................................. 217
CHAPTER 6 CONCLUSIONS AND DESIGN RECOMMENDATIONS .......................... 221
6.1 Overview ..................................................................................................................... 221
6.2 Summary of Test Results and Conclusions ................................................................. 221
6.3 Recommendations for Seismic Design of Precast Segmental Columns...................... 224
6.3.1 General Design Issues ......................................................................................... 225
6.3.2 Longitudinal Reinforcement Details ................................................................... 225
6.3.3 Transverse Reinforcement Details....................................................................... 227
REFERENCES............................................................................................................................ 230
x

CHAPTER 1 INTRODUCTION
1.1 General
The use of precast segmental construction for concrete bridges in the United States has
increased in recent years due to the demand for shortened construction periods and the
desire for innovative designs that yield safe, economical and efficient structures.
However, knowledge of the behavior and performance of precast segmental bridges
during earthquakes is lacking, and consequently their widespread use in seismic regions
such as California is yet to be realized. As part of a cooperative research effort funded by
Caltrans and conducted at the University of California, San Diego, testing of large-scale
precast concrete segmental bridge components was conducted at the Charles Lee Powell
Structural Research Laboratories located at UCSD. This report documents the testing of
precast concrete segmental bridge columns under simulated lateral seismic loading and
presents conclusions and design recommendations based on the experimental findings.
Unbonded post-tensioned precast concrete segmental bridge columns are constructed by
stacking precast segments one on top of the other and then connecting the assembly
structurally with vertical post-tensioned prestressing tendons passing through ducts
located in the precast segments. The tendons are anchored in the foundation below the
column and in the bent cap at the column top. Constructing bridge columns in this
manner offers several advantages over conventional R.C. designs. Construction
schedules can be shortened significantly since bridge components can be rapidly
produced at the precasting facility, where assembly lines and steam curing increase the
efficiency of concrete construction. Additionally, the erection of a segmented bridge in
the field can proceed rapidly, thus reducing the disruption to existing traffic
infrastructure.
Another key advantage of the precast system is its expected seismic performance.
Residual column drift will be negligible, and damage in the form of concrete spalling
minimal and limited to the region near the compression toe of the column. Residual
cracks in the column will not exist, and footing damage resulting from strain penetration
1

of longitudinal bars into the footing that is typical of R.C. columns will not be present.
Hence, a precast concrete segmental bridge column will remain functional immediately
after a moderate seismic event and will require minimal repair. Given their exceptional
seismic performance, these columns would be particularly attractive in bridges
designated as lifeline structures.
The seismic performance characteristics described above are a direct consequence of the
unbonded tendon design. A schematic of column response in the transverse direction is
shown in Figure 1.1. As the precast column displaces laterally under earthquake
excitation, a wide flexural crack is formed at the interface between the column base and
the foundation as the column rotates rigidly about its compression toe. The prestressing
steel is stretched once the base crack opening extends to the location of the tendon. Since
the tendon is unbonded over the height of the column, incremental strains are not
concentrated at the crack and if the initial prestress level is carefully selected, inelastic
straining of the prestressing steel does not occur. This is important for several reasons.
First, the ability to transfer shear across the component interfaces by shear friction is
dependent on the clamping force provided by the prestressing tendon. The column
stiffness is also reliant on the prestressing force and hence is not reduced drastically if the
prestress is maintained. Finally, the restoring force provided to the column by the
prestress is maintained during and after the earthquake ensuring that the column returns
to the undeformed position.
Special detailing is required to confine the concrete in the plastic end region of a precast
segmental column since high longitudinal concrete compression strains associated with
rigid rotation of the column about its base are expected near the critical section. Closely
spaced transverse spiral reinforcement could be used to provide the necessary
confinement. This detail would result in significant cosmetic damage in the form of
spalled cover concrete near the base. If however, the bottom precast column unit is
encased in a steel jacket, major spalling of cover concrete in the plastic end region can be
avoided. Only minor concrete crushing at the gap between the bottom of the jacket and
top of the footing will occur, and little post-earthquake repair will be needed.
2

precast segments
base crack andprestressing tendon
steel jacket
Figure 1.1 Idealized Transverse Column Response
1.2 Research Objective
This research effort involved both the analytical and experimental investigation of the
behavior of post-tensioned precast concrete segmental bridge columns under lateral
seismic loading. The main goal of the research was to determine the appropriate design
details that ensure good seismic performance of the precast column system. The
prestressing steel area and initial stress, the transverse reinforcement level for
confinement of the base and for shear, the jacket height, the connection details at segment
interfaces, and column aspect ratio were of prime interest in the program. In order to aid
3

the effort of understanding the influences of the above parameters on system
performance, an analytical model was developed to describe the behavior of the columns
under horizontal seismic input.
Four large-scale test model units were designed and tested. Two test units had an aspect
ratio (column height divided by column diameter) of six, and two an aspect ratio of three.
The prestressing steel tendons were unbonded to the surrounding concrete, and steel
jackets were used to confine the base region of each column. It was desired to investigate
the performance of the columns under both low and high levels of initial prestress. Since
column damage was expected to be low, it was decided that each column could be
effectively used twice. The columns were tested a first time under a relatively low initial
prestress level. The columns were subsequently repaired, post-tensioned again to a
higher initial prestress level, and tested a second time.
4

CHAPTER 2 ANALYTICAL PROCEDURES
2.1 Introduction
The theoretical background necessary for predicting the response of precast segmental
columns under horizontal seismic loading is presented in this chapter. First, a description
of the mechanical behavior of precast segmental columns under lateral seismic loading is
given. The procedure used to calculate the force-displacement response of the column is
developed next. Considerations regarding the modeling of concrete and prestressing steel
constitutive behavior are then discussed. The shear strength of a precast segmental
column is presented last.
2.2 Overview of Column Response
The behavior of a precast column under seismic loading differs fundamentally from that
of a conventional reinforced concrete column. In the design of most reinforced concrete
bridges, the designer selects and carefully details locations where inelastic response is to
occur. These locations of concentrated inelastic behavior are usually in the bridge
columns in the form of plastic hinges, where yielding of reinforcement and plastic
straining of concrete act together to dissipate energy input by the earthquake. It is the
deformation of the materials in the plastic hinges which allows rotation and hence
displacement of the column top. In the precast column, large structural deformations are
not due to plastic deformation within a hinge region, but rather, are due to rigid rotation
of the entire column about its base. The response of a precast column is similar to a
rocking foundation, where the foundation lifts off the ground once the moment resistance
provided by gravity is overcome. In the case of the precast column, it is both the column
vertical dead load (tributary deck weight and column self-weight) and the prestressing
force which provide moment resistance against overturning. Hysteretic energy
dissipation of the precast system is small relative to that of a conventional reinforced
concrete column.
5

Figure 2.1 gives a depiction of a precast column under lateral seismic loading at three key
stages of response. Included in the diagrams are the earthquake force, E, the vertical
dead load, P, the initial prestressing force, Fsi, and the concrete longitudinal compressive
strain profile and neutral axis depth at the critical section. In the figure, and throughout
this report, the prestressing tendon is assumed located at mid-depth of the cross-section.
A representative stress-strain curve for the prestressing steel is shown in Figure 2.2,
where the initial prestressing steel stress after losses and before seismic excitation is fsi.
At a certain level of excitation, the precompression at the column base will be lost at the
extreme tension fiber. This condition defines the first significant point of column
response, and is represented by elastic behavior. At this stage of response, the
prestressing steel stress will not have changed appreciably from the original value, fsi.
c = D/2c = D c < D/2
Loss of precompression;neutral axis equal to section depth
Rigid rotation; neutral axis equal to half section depth
Rigid rotation; neutral axis less than half section depth; prestressing steel stretched
E E E
1 2 3
ssi F F P ∆++ F P si+ F P si+
steel jacket
Figure 2.1 Precast column at key stages of response
6

As seismic forces increase, a crack will form at the column base and begin to propagate
into the section depth. Eventually the base crack will reach mid-depth of the section.
This condition defines the second stage of column response as it represents the beginning
of significant nonlinearity in response. With a further decrease of neutral axis depth, the
prestressing tendon is stretched and the steel stress will increase by ∆fs. Fluctuations in
steel stress during the seismic event will remain in the elastic regime if the initial stress,
fsi, is carefully selected (point 3 in Fig. 2.2). If however the initial stress is too high, or if
the maximum column displacement is larger than expected, the steel stress may enter the
inelastic portion of the stress-strain curve (point 3’ in Fig. 2.2). Upon unloading to the
undeformed position, the effective stress will be reduced to fs,inelastic. The consequence of
this is partial, or in the extreme case complete loss of the tendon prestress force. Since
the ability to transfer shear between precast segments is dependent on the clamping force
provided by the prestressing tendon, it is vital that the designer can accurately predict the
prestressing steel stress increase under seismic input.
0.01 0.02 0.03
Strain
Stre
ss
f si
f si + ∆f s
f s, inelastic
εsi
stress in non-linear portion of stress-straincurve
3
3'
Figure 2.2.2 Prestressing steel stress-strain behavior
7

2.3 Force – Displacement Response
The theoretical lateral force-displacement response of a precast column is depicted in
Figure 2.3. The key stages of response described previously are indicated by points 1-3
in the figure. The overall response is similar to a nonlinear-elastic relationship. Residual
displacement of the column does not exist because the tendon prestressing force acts to
recenter the column after the earthquake. No hysteresis is shown in the response since
the energy dissipation associated cyclic yielding of longitudinal reinforcement in a
conventional reinforced concrete column is not present in the precast system. However,
energy will be dissipated in the system through plastic straining of concrete near the
critical section and yielding of the steel jacket, and consequently some hysteresis will be
present.
Lateral Displacement
Late
ral F
orce
1
2
3
∆1 ∆2
∆p
F1
F2
Figure 2.2.3 Idealized force-displacement response of precast column
8

2.3.1 Moment – Curvature Analysis
A conventional analysis to determine the moment-curvature behavior at the critical
section is not adequate since the total vertical force due to prestress and axial dead load is
not constant, but rather increases as the tendon is stretched. For a conventional
reinforced concrete column, the total vertical force acting on the column is known and
must be balanced by the resultant concrete compression force, C. To calculate the
moment-curvature response, one needs only to select values of the concrete extreme fiber
compressive strain, εc, and iterate for the neutral axis depth, c, using equilibrium
considerations and the concrete and steel reinforcement stress-strain relationships. Since
the steel reinforcement is assumed perfectly bonded to the concrete, strain compatibility
at the section can be used to calculate the resultant steel and concrete forces. However, in
the precast column, the tendon is not bonded to the surrounding concrete and strain
compatibility between the prestressing steel and concrete does not exist. Thus, for a
given concrete strain and neutral axis depth, the prestressing steel strain is not uniquely
determined.
In the method presented herein, an analogy is made between a precast column and
conventional reinforced concrete column. This is done despite the fundamental
difference in behavior of the two systems described previously. In addition, an iterative
process involving not only the extreme fiber concrete strain and neutral axis depth, but
also the prestress force, is used.
During the early stages of column response, the prestressing steel force is essentially
unchanged from its initial value, Fsi. The moment-curvature response is calculated by
picking values for the extreme fiber concrete compression strain, εc, and iterating for the
neutral axis depth, c, which satisfies equilibrium of vertical forces acting on the section:
siF P C += (2.1)
9

The concrete compression resultant is obtained by integration of the concrete stress-strain
relationship over the neutral axis depth:
(2.2) dAf CD/2
c-D/2 c∫=
where fc is the confined concrete stress-strain relationship (as discussed subsequently)
and D is the column diameter. The section moment capacity is given by:
(2.3) xdAf MD/2
c-D/2 c∫=
This method is the same as that given by conventional reinforced concrete theory, and is
used up to and including the point when the neutral axis depth equals half the diameter of
the column (i.e., the ‘stage two’ response level).
For the third stage of response, the following procedure is adopted. Although large
nonlinear displacements of a precast column are due to rigid rotation of the column about
the compression toe, it is assumed that the precast column behaves like a conventional
reinforced concrete column, and that a plastic hinge is located at the interface between
the column base and foundation. Consider Figure 2.4, which depicts the deformed shape
of a precast column during the third stage response, and shows a close-up view of the
interface between the column base and the foundation. As shown, the angle formed
between the base of the column and top of the foundation is assumed equal to the column
plastic rotation, θp, which is:
(2.4) ppp L θ φ=
where φp is the plastic curvature and Lp is the plastic hinge length equal to half the
section diameter (Eq. 2.5). It is noted that the analytical plastic hinge length given for a
10

precast column differs from the value typically used for reinforced concrete (Eq. 2.6), and
was determined by calibration of the analytical model with the experimental test results.
Precast column: 2D Lp = (2.5)
R.C. column: L MPa)(mm, df 0.022 0.08L blyep += (2.6)
In the above, fye and dbl are the expected yield stress and diameter of the longitudinal
reinforcement, respectively [5]. The plastic curvature is defined as the total section
curvature minus the elastic curvature (Eq. 2.7). The total curvature is calculated from the
concrete compression strain at the extreme fiber and the neutral axis depth (Eq. 2.8),
while the elastic curvature is the taken as the curvature at stage two response (Eq. 2.9).
etp - φφ=φ (2.7)
c c
t
ε=φ (2.8)
(2.9) 2φ=φ e
Referring again to Figure 2.4, the prestressing steel is stretched once the base crack
propagates past mid-depth of the section. Associated with the tendon elongation is an
increase of prestressing steel stress, ∆fs, and hence force, ∆Fs. Knowing the unbonded
length of the tendon, Lt, the column diameter, D, and the neutral axis depth, c (calculated
as described subsequently), the increase in tendon strain, ∆εs, is given by:
t
p
ts L
c) - (D/2
LL
θ=
∆=ε∆ (2.10)
11

The corresponding prestress stress increase is calculated as:
sss E f ε∆=∆ (2.11)
where Es is the prestressing steel modulus of elasticity. Using the prestressing steel
cross-sectional area, As, the total force increase in the tendon due to the base crack
opening is given by:
sss A f F ∆=∆ (2.12)
Calculation of the moment-curvature response for the third stage of the response is
performed as follows.
I. Select the extreme fiber concrete compression strain, εc, and guess the neutral
axis depth, c:
c c
t
ε=φ (2.8)
etp - φφ=φ (2.7)
(2.4) ppp L θ φ=
II. Update the total prestressing force, Fs:
(2.13) ssis F F F ∆+=
(2.14) sssis A ) f f ( F ∆+=
12

(2.15) ssssis A ) E f ( F ε∆+=
st
spsis A
L
E ) c - D/2 ( f F
θ+= (2.16)
III. Check equilibrium of vertical forces:
(2.2) dAf CD/2
c-D/2 c∫=
(2.17) sF P ?
C +=
If equilibrium is not satisfied, a new value for the neutral depth axis is chosen and
steps two and three are repeated until equilibrium is achieved. When the correct
neutral axis is found, the column moment capacity is calculated by:
(2.3) xdAf MD/2
c-D/2 c∫=
IV. The complete moment-curvature response is obtained by incrementing the
value of extreme fiber concrete strain, εc, and repeating the above steps until
the ultimate concrete compression strain, εcu, is reached.
13

θp
D/2
c
θp
∆p
θp
∆L
Figure 2.2.4 Rigid rotation of the column about the compression toe
2.3.2 Elastic Displacement
Based on moment-curvature analysis of the section and considering a cantilever column
fixed at the base, the displacement at the first stage of response is calculated from the
section curvature using simple beam theory as given below:
14

21 H
31 φ=∆1 (2.18)
where H is the column height measured from the point of maximum moment to the point
of contra-flexure. The corresponding lateral force is:
H
M F 1
1 = (2.19)
The displacement at the second stage of response is determined by linearly extrapolating
from the displacement at stage one to obtain the elastic component of displacement, and
adding to this an additional component associated with the rigid rotation of the column
about the compression toe. Referring to Figure 2.5, the displacement at the second stage
of response is calculated as:
(2.20) pe 222 ∆+∆=∆
F
F
1
2e 12 ∆=∆ (2.21)
H L F
F - p1
1
22p
φφ=∆2 (2.22)
where Lp was defined previously in Eq. 2.5 and:
H
M F 2
2 = (2.23)
15

Point 2 corresponds to the stage when the crack at the column base has propagated to
mid-depth of the section, and is taken as the yield point of the force-displacement
response. It should be noted however, that the word “yield” is not meant to reflect any
yielding of the prestressing steel reinforcement, but rather is used to describe the point
where significant nonlinearity in column response begins.
Lateral Displacement
Late
ral F
orce
1
2
3
∆1 ∆2
F1
F2
∆2e
F3
∆3
Figure 2.2.5 Force – displacement response envelope
2.3.3 Plastic Displacement
Displacements during the third stage of response are largely due to rigid rotation of the
column about its compression toe, with significant opening of the base crack. Column
displacements for stage three are:
(2.24) pe 333 ∆+∆=∆
16

F
F
2
3e 23 ∆=∆ (2.25)
H L F
F - p2
2
33p
φφ=∆3 (2.26)
where:
H
M F 3
3 = (2.27)
17

2.4 Material Constitutive Behavior
The assumed material behavior of the concrete and prestressing steel used in the test units
is presented in this section.
2.4.1 Concrete Stress-Strain Model
Because high compression strains are expected to develop in the plastic end region, and
since damage in the form of spalled concrete is to be minimized, a steel jacket is used to
provide confinement to the concrete near the column base. The jacket enhances the
compression strength of the core concrete and enables a high concrete compression strain
to be developed.
Calculation of the lateral confining stress provided by the jacket is analogous to that done
for conventional transverse spiral or hoop reinforcement. Considering a jacket with
diameter, Dj, wall thickness, tj, and yield strength fyj, the lateral confining stress is given
by:
D
t2f
2t - D
t2f f
j
jyj
jj
jyjl ≈= (2. 28)
The ultimate concrete compression strain is calculated by [4]:
'cc
smyjjcu f
f1.4 0.004
ερ+=ε (2. 29)
where ρj is the effective volumetric ratio of confining steel, εsm is the strain at maximum
steel stress, and f’cc is the confined concrete compressive strength. The volumetric ratio
of confinement is given by:
D4t j =ρ (2. 30)
18

The model for the stress-strain behavior of confined concrete proposed by Mander et al.
[4] has been used widely and has been incorporated into moment-curvature software
programs designed for conventionally reinforced concrete columns. This model was used
in the moment-curvature analysis described previously. Figure 2.6 shows a
representative stress-strain curve for a volumetric confinement ratio of ρj = 2.0%,
unconfined concrete compressive strength of f’c = 41.4MPa, and steel yield strength of
fyj=276 MPa.
0 0.01 0.02 0.03
Concrete Strain
0
10
20
30
40
50
60
Con
cret
e St
ress
(MPa
)
ρj = 2.0%f c' = 41.1 MPaf yj = 276 M Pa
Figure 2.6 Mander model for confined concrete stress-strain relationship
Comment is due regarding the use of the Mander model for the moment-curvature
analysis of precast columns. A precast column will have a relatively high level of axial
stress at the column base since the prestressing force provides axial load that is in
addition to vertical dead load. Therefore, a high strength concrete is used in the precast
column to avoid early degradation and strength loss under seismic loading. Since the
Mander model was not developed specifically for high strength concrete, its use in the
analysis could introduce error. Research has indicated that the strength gain due to
passive confinement for high strength concrete is less than that for concrete of lower
19

strength. This is because less microcracking and dilation occurs in high strength concrete
prior to failure. Therefore, less hoop strain is induced in the transverse reinforcement
(steel jacket or spiral) and consequently the lateral confining stress is reduced. An over-
prediction of the strength of the concrete would cause a smaller neutral axis depth to be
predicted. Associated with the smaller neutral axis depth would be a larger lever arm
between the resultant internal forces, and thus larger moment capacity. Also, the smaller
neutral axis depth would result in a higher predicted tendon force since for the analytical
model presented, the prestress force increase due to gap opening at the column base
increases as the neutral axis depth decreases (see Eq. 2.16). Thus, the moment capacity
would also be larger because of the increased total prestress force.
High strength concrete is typically more brittle than concrete of lower strength, and
exhibits less overall ductility. The descending branch of the Mander stress-strain model
may thus be too gradual for high strength concrete, and consequently column strengths
may be over-predicted at high concrete compressive strains.
The degree to which the above issues affect the analytical response is not certain.
However, it is believed that acceptable results should be obtained using the Mander
model.
20

2.4.2 Prestressing Steel Stress-Strain Model
A nonlinear stress-strain model was used for the 7-wire low-relaxation prestressing strand
[6]. The stress-strain curve given by the equations below is shown in Figure 2.7.
Prestress steel limit of proportionality: 00860. lp =ε (2.31)
Reduced ultimate prestress steel strain: 0300. lp =ε (2.32)
sss , f :. ε=≤ε 5002800860 (2.33)
0.007 - 0.04 - 270 f :
sss ε
=≥ε 00860. (2.34)
0 0.005 0.01 0.015 0.02 0.025 0.03Strain, εs
0
200
400
600
800
1000
1200
1400
1600
1800
2000
Stre
ss, f
s (M
Pa)
Es = 196,500 MPa
1860 MPa
Figure 2.2.7 Prestressing steel stress-strain model
21

2.5 Column Shear Strength Model
The design shear strength of a precast segmental column with unbonded prestressing steel
is based on the approach of Kowalsky and Priestley [3]. In the approach, the column
shear strength is composed of contributions from a concrete shear resisting mechanism, a
truss mechanism, and an axial compression component.
(2.35) pscd V V V V ++=
The concrete mechanism strength is given by:
)g'cc 0.8A (f V αβγ= (2.36)
The factor α is a function of column aspect ratio and the factor β accounts for the
longitudinal steel ratio. Values for α and β are given by Eq. 2.30 and Eq. 2.31. The
factor γ is related to the allowable shear stress, and reduces with increasing ductility.
Figures 2.8 (a) and 2.8 (b) give the relationship of γ to member curvature ductility
demand and displacement ductility demand, respectively.
1.5 VDM - 3 ≤=α≤1 (2.37)
1 20 0.5 l ≤ρ+=β (2.38)
22

0 2 4 6 8 10 12 14 16 18 20Curvature Ductility
(a) γ vs. curvature ductility
0
0.05
0.1
0.15
0.2
0.25
0.3γ
( MPa
)
0 2 4 6 8Displacement Ductility
(
10
b) γ vs. displacement ductility
0
0.05
0.1
0.15
0.2
0.25
0.3
γ ( M
Pa )
Uniaxial ductility
Biaxial ductility
Uniaxial ductility
Figure 2.2.8 γ factor for concrete shear strength component
The contribution from transverse spiral reinforcement, Vs, is given for circular columns
by:
) θ ( cot s
cov - c - D f A 2
V yspsπ
= (2.39)
where Asp and fy are the cross-sectional area and yield stress of the hoop reinforcement,
respectively. The variable c is neutral axis depth and cov is the concrete cover distance
measured to the longitudinal reinforcement. The variable θ is the angle between an
inclined flexure shear crack and the column axis, and is taken as θ = 35° for design
purposes. For the steel jacket encased column segment, the following gives a
conservative estimate of jacket shear strength [5]:
) θ ( cot D f t 2
V jyjjsπ
= (2.40)
The shear strength resulting from the axial compression acting on the column, provided
by the horizontal component of the diagonal compression strut is calculated by:
23

0 P for 2L
) c - D (P V aap >= (2.41)
(2.42) 0 P for 0 V ap ≤=
P F F P ssia +∆+= (2.43)
where Pa is the total axial compressive force which includes the initial prestress force, Fsi,
the incremental prestress force, ∆Fs, and the applied vertical dead load, P. The variable L
is the length of the column between the point of maximum moment and the point of
contra-flexure.
24

CHAPTER 3 MODELING, TEST SET-UP AND
INSTRUMENTATION
3.1 Introduction
Modeling procedure, test set-up, and instrumentation used for the low and high aspect
ratio test units are presented in this chapter. Test units JH1 and JH2 were columns with
an aspect ratio of six, while units JH3 and JH4 had an aspect ratio of three. All units
were tested in single bending, and hence the aspect ratio typically defined as M/VD –
where M is the maximum moment at the critical section, V is the column shear, and D is
the column diameter – is equal to the column height H divided by the diameter: H/D.
3.2 Prototype Structure
The test model units were not based on a specific prototype structure. However, in order
to compare the performance of the precast system with conventional reinforced concrete
design, the geometry of the test units was chosen similar to that of a conventionally
reinforced circular concrete column tested previously at UCSD [2]. This reinforced
concrete reference column was a 40% scale model of a circular prototype bridge column.
3.3 Laboratory Test Model
The overall dimensions of the test units are shown in Figure 3.1. All test units were built
using precast concrete units and constructed in a segmental fashion. The anchorages for
each end of the tendon were cast within the footing and column cap segments, which
were heavily reinforced because of the high concrete compressive stresses induced by the
prestressing tendon. In addition to the footing and cap segments, test units JH1 and JH2
consisted of four precast cylindrical concrete segments while test units JH3 and JH4
consisted of two precast cylindrical segments. The cylindrical segments had a hollow
core to allow for passage of the prestressing tendon.
25

50 mm diameter ductfor actuator mountingbolts
457 mm 914 mm
914 mm
914 mm
914 mm
5055 mm
610 mm
914 mm
1675 mm
(27) 12.7 mm diameter Grade 270low-relaxation prestressing strands
610 mm
610 mm
A36 steel jacket
610mm
914 mm
610 mm
914 mm
3200 mm
footing
load stub
footing
load stub
1675 1675
segment4
segment3
segment2
segment1
segment1
610mmsegment2
load stubblockout foraxial load bars
60 mm diametertie-down hole
footing
Test units JH1 and JH2 Test units JH3 and JH4
Top view of test units
Figure 3.1 Overall dimensions of precast column test units
26

3.4 Test Set-Up
A schematic representation of the test set-up for units JH3 and JH4 is shown in Figure
3.3. The set-up for units JH1 and JH2 was similar to that for JH3 and JH4. For each test,
the column footing was connected to the laboratory strong floor by six 44.5 mm diameter
high strength post-tensioning bars stressed to 890 kN each. The cyclic lateral point load
was applied at the column top by a servo-controlled 980 kN capacity hydraulic actuator
with a ±610 mm stroke reacting off the laboratory strong wall. Horizontal load levels in
the actuator were monitored during the test through a load cell and the horizontal
displacement at the actuator level measured using a string displacement transducer and an
independent reference column. A constant axial compressive load of 890 kN was applied
to the column by a transfer beam and a pair of 35 mm diameter high-strength steel post-
tensioning bars loaded by two 150 ton hollow core jacks reacting off the laboratory
strong floor. This externally applied axial load was used to model the dead load of the
tributary deck weight and column self-weight. The applied axial load level was the same
for all of the tests.
Curvature along the column height was measured by a system of aluminum brackets
attached to threaded rods. For the non-jacketed column segments, the rods were
embedded in the core concrete. To prevent any possible shear strength enhancement
from the embedded rods, each curvature fixture was composed of two separate rod
sections spaced 25 mm apart with PVC sleeves around each rod assembly within the core
of the column. For test units JH1 and JH2, the curvature rods for the jacketed column
segment were tack welded to the steel jacket and did not penetrate into the segment core
concrete. Since slip of the steel jacket with respect to the concrete core was observed
during tests on units JH1 and JH2, and in order to accurately measure curvature in the
concrete core, 25 mm diameter holes through the jacket were provided at locations of the
threaded rods for units JH3 and JH4. The holes allowed longitudinal movement of the
jacket relative to the core concrete without it bearing against the embedded rods. Uplift
and slip of the footing were monitored during the test by linear potentiometers. Strains in
the steel jacket, transverse reinforcement and tendon strands were monitored during
27

testing by electrical resistance strain gages. The layout of the strain gages and the
potentiometers for units JH3 and JH4 is illustrated in Figure 3.4. A similar array of
instrumentation was used for units JH1 and JH2. Data from the instrumentation was
logged using a NEFF 470 data acquisition system with a 12-bit analog-to-digital
converter in conjunction with in-house developed software. Column curvature was
obtained from the displacement measured in one potentiometer with respect to the other
as described below (see Figure 3.2):
g
w12l
l /) - (
length gaugerotation
∆∆==φ (3.1)
where (∆2 - ∆1) represents the relative displacement between the two potentiometers, lw is
the distance between the two potentiometers and lg is the gauge length. Note that the
average concrete surface compression strain may be obtained by Eq. 3.2:
x l
g
2c φ−
∆=ε (3.2)
lg + ∆1 lg + ∆2
lwx
Figure 3.2 Column curvature calculation from linear potentiometer readings
28

Late
ral f
orce
app
lied
byhy
drau
lic a
ctua
tor
Ver
tical
load
app
lied
by h
ydru
alic
jack
s
Labo
rato
ry st
rong
w
all a
nd fl
oor
(2) l
oad
cells
for m
easu
rem
ent
of a
pplie
d ve
rtica
l loa
d
Ver
tical
load
trans
fer b
eam
Cur
vatu
re in
stru
men
tatio
n
Ref
eren
ceco
lum
n 1829
mm
Foot
ing
tie-d
owns
Figu
re 3
.3 S
chem
atic
of t
est s
et-u
p fo
r spe
cim
ens J
H3
and
JH4
Figure 3.3
29

DS1
,2 @
20
0 m
m
DS3
,4@
15
0 m
m
DS5
-8@
13
0 m
m
DN
4
DN
7D
N8
DN
5D
N6
DN
2D
N3
DN
1
DH
OR
DN
9
Load
ing
Dire
ctio
n
NS
SN
W E
HW
1-3
HE1
-3H
S1-6
HN
1-6
HS1
-6, H
N1-
6@
150
mm
75 m
m
HW
1-3,
HE1
-3@
300
mm
JN, J
S,
JE, J
W@
135
mm
25 m
m
25 m
m
Line
ar P
oten
tiom
eter
s:(1
6) c
urva
ture
(6) s
hear
(3) u
plift
/slip
(1) h
oriz
onta
l
Stra
in G
ages
:(1
8) tr
ansv
erse
spira
l(3
0) st
eel j
acke
t(1
0) p
rest
ress
ing
stee
l
S
W
N
E
= 90
° ros
ette
, 5 m
m g
age
leng
th=
sing
le g
age,
5 m
m g
age
leng
th=
sing
le g
age,
1 m
m g
age
leng
th
Tend
on st
rain
gag
e lo
catio
ns
DS9
,D
S10
Figu
re 3
.4 S
chem
atic
of t
est i
nstru
men
tatio
n fo
r uni
ts JH
3 an
d JH
4
Figure 3.4
30

3.5 Loading Sequence
The loading sequence utilized for the tests is shown graphically in Figure 3.5. The first few
cycles of each test were conducted in the elastic range under load control, with one cycle each
performed at one-half, one, and one and a half times the theoretical load to cause decompression
of the extreme tension fiber of the section at the column base, P1. Subsequent cycles during the
test were conducted in displacement control. Since each column was to be tested twice, it was
desired to limit the damage in the first test of each column to an amount that could be repaired
relatively easily (i.e., epoxy injection of residual cracks and patching of spalled cover concrete).
Thus, the maximum drift imposed during the first test of each specimen was dictated by the
observed damage at a particular drift. The column drift is defined as the displacement at the
level of the applied load divided by the column height to the applied load:
H∆
=θ (3.3)
During testing, inspection of the specimen for damage was done primarily during the first and
third loading cycles. In order to monitor the development of cracks through the various stages of
testing, black and red felt tipped pens were used to mark cracks observed for the push and pull
loading directions, respectively. The cracks were labeled by marking a transverse bar at the end
along with a number designating the force/drift level. For cracks observed during the third cycle,
a superscript of ‘3’ was added to the label.
31

0 5 10 15 20 25 30 35
Cycle Number
-8
-6
-4
-2
0
2
4
6
8
Drif
t Lev
el (%
)
0.6%0.9%
2.2%1.6%
1.2%
3.0%
4.0%
Drift =
5.0%
6.0%
0.5P
1
P 11.
5P1
2.0P
1
P1 = theoretical decompression force
Figure 3.5 Lateral loading sequence for the first and second test of each unit
32

CHAPTER 4 HIGH ASPECT RATIO COLUMNS
4.1 Design of Columns
The design of the test units was guided by principles of capacity based design. It was
desired to achieve ductile behavior under simulated seismic loading while limiting
damage to low levels that could be repaired with little effort. Crushing of the concrete at
the base of the column below the jacket was expected, while spalling of concrete in the
non-jacketed column segments was to be avoided. To ensure ductile response, brittle
failure modes such as shear failure and fracture of prestressing steel had to be guarded
against through careful detailing of the transverse reinforcement and selection of initial
prestress level. Key elements in the design included the amount of confinement to
provide at the column base, the height of the steel jacket, the prestressing steel area and
initial stress level, the size and spacing of transverse reinforcement in the non-jacketed
column segments, and the concrete compressive strength.
A column diameter of 610mm was selected for both test units JH1 and JH2. Parametric
studies were conducted in order to investigate the effects of prestressing steel area and
initial stress and the level of confinement at the column base, on the force-displacement
response of the columns. The concrete compressive strength, fc’, was taken as 41.4 MPa.
Based on the parameter studies, a prestressing steel area, As, of 2665 mm2 (ρl = 1%) was
selected for both units. A steel jacket thickness, tj, of 6 mm (ρj = 3.9%) was chosen for
JH1, while that for JH2 was 2.8 mm (ρj = 1.9%). It was decided to test each unit twice,
with an initial tendon stress of 45% of the ultimate tensile stress (0.4 x fu = 837 MPa) for
both units for the first test, and 60% of ultimate (0.6 x fu = 1116 MPa) for the second test.
In order to avoid spalling of concrete in segments above the steel jacket, concrete
longitudinal compression strains above the jacket needed to be lower than the crushing
strain of the concrete. Moment curvature analyses were conducted for the non-jacketed
segment using the program SEQMC. The axial load used in the analyses was equal to the
33

applied axial dead load of P = 890 kN plus the total prestress force in the tendon at the
maximum column displacement. The concrete strength was taken as 41.4 MPa for the
non-jacketed segments. Based on the analysis, a jacket height of 610mm was selected.
The final design details of the specimens are shown in Figures 4.1 and 4.2. The test
model units both had an aspect ratio H/D of six. Each consisted of a precast footing and
load stub and four precast 609.6 mm diameter cylindrical column segments. The main
longitudinal reinforcement in each column consisted of a single unbonded tendon
comprised of (27) 12.7 mm diameter ASTM A779 Grade 270 (1860 MPa) low-relaxation
steel prestressing strands with a total cross-sectional area of 2665 mm2. The unbonded
tendon length, Lt, was 4953 mm. Segments two thru four (i.e., the three non-jacketed
segments) also contained eight Grade 60 #4 longitudinal bars spaced evenly around the
perimeter of the section, with a cover of 25.4 mm. The bottom column segment (segment
one) was encased in an ASTM A569, A36 steel shell with a wall thickness, tj, of 6.0 mm
and 2.8 mm for specimens JH1 and JH2 respectively. The steel jacket did not extend the
full height of the bottom segment, but rather terminated approximately 25 mm above the
interface between the column and footing. The upper segments were reinforced
transversely with Grade 60 #3 bar spiral spaced at 75 mm with a cover of approximately
12 mm. As stated above, a target initial stress in the tendon of 45% and 60% of ultimate
was chosen for the first and second test of each specimen, respectively.
34

900
900
900
5060
610
900
140 mm diam. PVCtendon duct
Section A-A
#3 spiral @ 75 mm
VSL type EC 5-27 anchor #6 anchor spiral @ 50 mm
B B
Section B-B
#4 longitudinal bar
(27) 12.7 mm diameter Grade 270low-relaxation prestressing strands
610
610
A36 steel jacket; 6 mmand 2.8 mm thickness
for JH1 and JH2
Note: all dimensions shownare in millimeters
Segment 1
Segment 2
Segment 3
Segment 4
A A
Figure 4.1 Test unit JH1 and JH2 column reinforcement details
35
#4 A706 welded hoops @ 50 mm(750 mm radius)
# 6 anchor spiral @ 50 mm(220 mm radius)
# 9 U-bar (8 total)
250 mm
200 mm
250 mm
200 mm
100 mm
200 mm
100 mm
300 mm
150 mm
225 mm
150 mm
225 mm
#9 U-bars
#4 j-hook
tendon duct
footing
column load stub
Figure 4.2 Specimen JH1 and JH2 footing and load stub reinforcement details
36

4.2 Construction Procedure
The test units were constructed at the Powell Structural Research Laboratories on the
University of California, San Diego campus (UCSD). The footing reinforcement cages
were assembled on the laboratory casting bed. The interior four # 9 bars of the footing
top mat reinforcement in both the transverse and loading directions were not placed until
the tendon and tendon anchorage were lowered into the footing reinforcement cage. The
tendon was shipped from the supplier to the laboratory with one end assembled: the
tendon strands had been placed through the anchor and bearing plate and the strand
wedges “seated” in the anchor head. A scaffolding system was constructed around the
footing to allow for the lowering of the tendon into the footing cage, and for the support
of the tendon during casting of the footing. The tendon and anchor were lowered into the
footing cage until the anchor head rested on the bottom mat reinforcement, approximately
100 mm above the bottom of the footing. To locate the anchor spiral reinforcement at the
proper height, two # 5 straight bars were placed on each side of the anchor spiral in a
direction parallel to that of the loading, at heights of approximately ± 200 mm from the
footing mid-height. The anchor spiral reinforcement was tied to these bars while the
anchor itself was secured to the footing bottom mat reinforcement using “tie wire”. To
keep concrete from entering the anchor and tendon duct during casting, care was taken to
seal around the strand wedges at the anchor head, the bearing plate/anchor head interface
and the anchor/tendon duct connection using a silicon sealant. Once the tendon and its
anchorage were centered in the footing and secured in place, the #9 top mat bars and “J-
hook” bars were placed. Figure 4.4 shows a photograph of the footing reinforcement
cage prior to placing of the formwork. The footings of each unit test were cast on the
same day using the same concrete batch.
The column segments were each precast separately. Each reinforcement cage for
segments 2-4 was tied and placed on the casting bed, and ‘sonotube’ used as the
formwork. The PVC pipe to be used as the tendon duct was lowered through the center
of the reinforcement cage and into a 16 mm deep circular recess in the casting bed. This
recess provided for a 16mm protrusion of the PVC from the bottom of the segment after
37

casting, which was used to align or “index” the segments during the stacking phase of the
construction process. For segment one of the columns, sonotube was not used since the
concrete was poured directly into the steel jacket.
The reinforcement cage for each load stub was tied and placed on the casting bed. After
the formwork was placed, the stressing end anchor was lowered into the interior portion
of the cage. The anchor was held at the correct height and kept centered using supports
connected to the formwork. The anchor spiral was held at the correct height in the same
manner as that in the footing. A silicon sealant was again used to prevent leakage of
concrete into the tendon duct and anchor during the casting process. A photograph of the
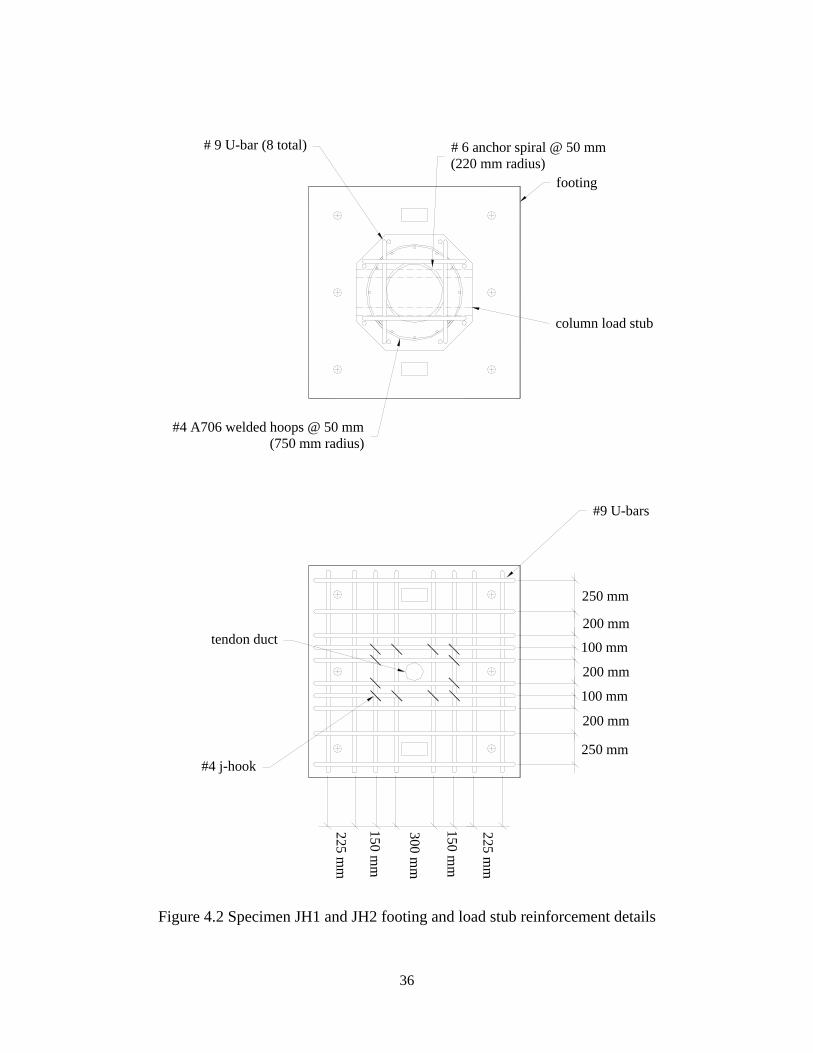
load stub reinforcement prior to casting is shown in Figure 4.5. The reinforcement cage
of one of the non-jacketed column segments is shown in Figure 4.6, while Figure 4.7
shows the jacketed segments prior to casting. The column segments and load stubs were
cast on the same day using the same concrete batch.
Once the concrete had cured sufficiently, the assembly of each test specimen occurred in
the following manner. The footing was positioned in the laboratory, leveled and
“hydrostone”, a gypsum based cement, poured underneath it to provide a uniform bearing
surface. Figure 4.8 shows the footing of specimen JH1 after being placed in the
laboratory. Also visible in the photo is the scaffolding system erected around the footing
to hold the tendon in a vertical position. The bottom segment of the column (segment 1 –
the steel encased portion of the column) was hoisted over the top of the scaffolding
system and centered over the tendon. The segment was lowered over the tendon down to
approximately 50 mm above the top of the footing, and aluminum shims were placed in
between the top of the footing and the bottom of the segment. The segment was then
lowered slowly until the PVC protrusion indexed with the female PVC connection at the
top of the footing and until the segment rested on the shims. The segment was made
“plumb” by adjusting the number and/or thickness of shims. Once the segment was
sufficiently level, the position of the shims was marked and the segment was raised
several feet above the footing to allow for the application of epoxy to the bottom of the
38

segment. The epoxy layer was applied in an even thickness of approximately 10mm.
Since the average total thickness of the shims used was approximately 5mm, excess
epoxy was squeezed out as the segment was lowered back down onto the shims. This
approach of applying an epoxy layer greater than the shim thickness ensured that no
voids would exist between the footing and segment once the segment was resting on the
shims. Figure 4.9 shows test unit JH1 after the jacketed segment was lowered into
position. The epoxy was allowed to cure for 24 hours before the next segment was
lowered down over the tendon and onto the top the first segment (Figure 4.10). This
process of shimming, leveling and epoxy application was repeated for the remaining
segments and load stub. Figures 4.11 – 4.14 depict assembly of the test units.
The damaged regions at the column base and above the jacket were repaired after the first
test of each specimen. Loose concrete was removed and the regions scrubbed with a wire
brush. The areas were rinsed with water to remove any remaining concrete particles and
then allowed to dry. The spalled concrete above the steel jacket at the base of the second
column segment was reinstated by patching the area with SikaTop 123 – a polymer-
modified, Portland cement, 2-component, fast-setting, non-sag patching mortar. The
residual crack at the column base was grouted using Sikadur 35 – a high-modulus, low-
viscosity, high-strength epoxy resin adhesive. Figures 4.15 and 4.16 show the base crack
during the grouting process and the patched region above the steel jacket, respectively.
After the spalled region above the jacket was repaired, the lower half of the second
column segment was wrapped with fiberglass in an effort to prevent spalling of cover
concrete during the second test. Five layers of the Tyfo Fibrwrap SEH-51 Composite
System were applied in segments in order to work around the existing curvature rods and
instrumentation. Each continuous band was installed with a six-inch minimum overlap
back onto itself. Figure 4.3 illustrates the layout of the fiberglass wrap, while Figure 4.17
shows the column during installation of the jacket.
39

1220mm(4ft.)
(3) 150mm wide composite bands
(1) 100mm wide composite band
610mm(2ft)
footing
fiberglass composite; total thickness = 6.5mm
segment 2
steel jacketedsegment 1
Figure 4.3 Composite wrap details
Figure 4.4 Footing reinforcement cage with tendon installed
40
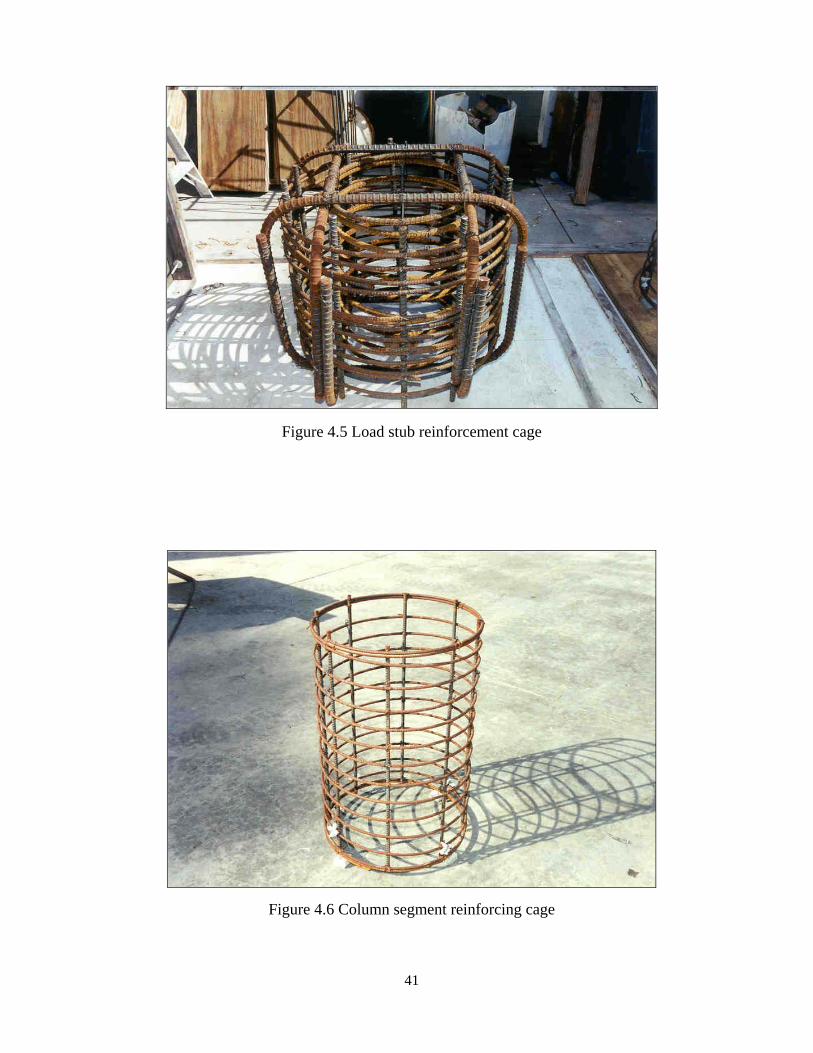
Figure 4.5 Load stub reinforcement cage
Figure 4.6 Column segment reinforcing cage
41

Figure 4.7 Jacketed column segment prior to casting
Figure 4.8 Test unit footing positioned in laboratory
42

Figure 4.9 Footing with column segment 1 positioned
Figure 4.10 Application of epoxy at interface between segments 1 and 2
43

Figure 4.11 Positioning of segment 3
Figure 4.12 Lowering segment 4 down over prestressing tendon
44

Figure 4.13 Test units during construction
Figure 4.14 Post-tensioning the assembled test units
45

Figure 4.15 Close-up of grouting of the base residual crack
Figure 4.16 Patching of spalled region at bottom of segment 2
46
Figure 4.17 Wrapping segment two with a composite jacket
47

48

4.3 Materials Testing
Material properties of concrete and steel used in the construction of specimens JH1 and
JH2 were determined through testing at UCSD’s Charles Lee Powell Structural Research
Laboratories. The compression strength of concrete was measured at 7 days, 21 days, and
28 days and on the day of each test. The results are listed in Table 4.1. Values in the
table are an average strength based on three tests on unconfined concrete cylinders (152.4
mm diameter x 304.8 mm height), which were cast during the pour.
Table 4.1 Concrete compressive strength for specimens JH3 and JH4 (fc’, MPa)
Specimen 7-Day 21-Day 28-Day Day of Test 1 Day of Test 2
JH1 48.7 ± 0.6 57.0 ± 1
JH2 32.3 ± 1 42.1 ± 0.2 44.0 ± 0.3
50.8 ± 1.1 55.5 ± 1
Footing 38.7 ± 0.7 -- 49.5 ± 1 61.4 ± 1 --
Tensile tests were conducted on the steel reinforcing bars used in the load stubs and non-
jacketed column segments and on the plate material used for steel jackets. Three coupons
305mm in length were tested in a SATEC 490 kN capacity uniaxial testing machine for
each of the reinforcing bar sizes. A complete stress-strain relationship up to the ultimate
stress was obtained for each coupon. For tests on the #3 and #6 bar spiral, a well-defined
yield plateau was not observed since the material had already been deformed. Thus, the
yield strength was taken as the stress at 0.2% offset strain, consistent with ASTM
standards. Values for the yield strength and ultimate strength are listed in Table 4.2. No
pull-test data was obtained for the #9 bars used in the footings and load stubs. ‘Dog-
bone’ shaped coupons were manufactured for tensile tests on the steel jacket material.
The dimensions, tolerances and manufacturing procedure of the coupons conformed to
ASTM standards. Three coupons each were tested for the two material thickness’, with a
49

complete stress-strain relationship up to the ultimate stress obtained for each coupon.
Since a well-defined yield point was not observed in tests on either material thickness,
the yield strength was also taken as the stress at 0.2% offset strain. The yield and
ultimate strengths are listed in Table 4.2.
Table 4.2 JH3 and JH4 Yield and ultimate strengths of reinforcing steel
Description Size Yield Strength
(MPa)
Ultimate Strength
(MPa)
Longitudinal bars #4 (12.7mm) 443 ± 2 728 ± 2
Anchor Spiral #6 (19.1mm) 421 ± 2 685 ± 2
Segment Spiral #3 (9.5mm) 465 ±12 691 ± 8
Load Stub Hoops #4 (12.7mm) 414 ± 3 614 ± 2
Thin coupons 2.9 mm thick 283 ± 7 390 ± 7
Thick coupons 6.2 mm thick 303 ± 3 464 ± 3
The adhesive used to bond the precast components together was Sikadur 31 – High Mod
Gel. It is a two component solvent-free, moisture insensitive, high modulus, high
strength epoxy adhesive. The expected properties of this material at the age of 14 days
were compressive strength of 82.7 MPa, tensile strength of 24.8 MPa, and shear strength
of 23.4 MPa.
50

4.4 Column Prestressing
4.4.1 First Stressing
The specimens were post-tensioned using a hydraulic stressing ram at a concrete age of
66 days. Strain gages mounted on the tendon strands, transverse spiral and steel jacket
were connected to the data acquisition system and an initial set of readings was taken
prior to the post-tensioning operation. Strain on the concrete surface was measured at
four points around the circumference of the column using a demountable mechanical
strain-measuring device (demec device). An initial set of readings was taken for the
demec points prior to stressing.
During stressing, load levels in the tendon were calculated using an analog pressure
transducer connected to the ram hydraulics and a calibration chart. In addition, four
electrical resistance strain gages mounted on the tendon strands and connected to a data
acquisition system with real-time digital display were used to monitor strains in the
prestressing steel.
Because of the relatively unbonded free tendon length, a significant strain loss due to
wedge seating was expected. The estimated mechanical seating of the wedges was 10
mm. The corresponding expected prestress force loss was 1007 kN. Thus, to achieve the
design total prestress force of 2230 kN after losses, an applied total force of 3237 kN was
required. Specimen JH1 was post-tensioned first. After stressing, it was found that a
tendon force 22% higher than expected existed in the tendon based on readings from the
prestressing steel strain gages readings. The cause of this was believed to be due to a
lower mechanical wedge seating than assumed. Because of this, the level of prestress
force applied to specimen JH2 prior to wedge seating was lower than that applied to JH1
and was approximately 2850 kN.
Figure 4.18 shows the tensile strains in the prestressing steel during stressing of JH1 and
JH2. For specimen JH1, all four gages mounted on the tendon functioned, while for
51

specimen JH2, only two of the four gages worked. The average of the four strain gage
readings for JH1 prior to seating the strand wedges was 6225 µε, corresponding to a total
tendon force of 3260 kN. This is slightly higher than the force of 3237 kN indicated by
the pressure transducer connected to the ram hydraulics. After seating the wedges, the
average strain reading for the tendon gages was 5213 µε, and the corresponding tendon
force equal to 2730 kN. As mentioned above, this is 22% higher than the calculated
prestress force after losses. Using the observed strain loss indicated by the strain gages,
the actual wedge seating was found to be approximately 6.1 mm. The average readings of
the two strain gages for specimen JH2 prior to seating the wedges was 5438 µε, and the
associated tendon force equal to 2848 kN. The average strain after losses was 4156
µε, and the corresponding prestress force was 2177 kN.
For both specimens, the average concrete surface strain after losses measured using the
demec gage was significantly higher than predicted. Average concrete strains of
397µε and 374µε were observed for specimens JH1 and JH2, respectively. Using an
elastic modulus based on the experimentally determined concrete compressive cylinder
strength, the predicted concrete strains are 329 µε and 267 µε for specimens JH1 and
JH2, respectively. These are somewhat lower than the observed values given above. It
should be noted however that the initial readings taken at each set of demec points prior
to the post-tensioning operation showed a wide scatter. Thus, little confidence is given to
the accuracy of the strain readings from the demec gage for the first stressing.
Continuous readings were taken for the demec points in the time between the stressing
operation and the first test of each specimen. Using these readings and the initial strain
readings in the tendon strands on the day of testing, prestress losses of 40 kN and 42 kN
were calculated for specimens JH1 and JH2, respectively. The day of test total prestress
force for each specimen was calculated using the tendon gage readings and the above
losses. For specimen JH1, the final prestress was taken as 2730 kN – 40 kN = 2690 kN,
while that for JH2 was 2177 kN – 42 kN = 2135 kN.
52

4.4.2 Second Stressing
After repairing the damage incurred during the first test, each specimen was post-
tensioned to a higher tendon force level. A prestress level of 60% of the ultimate strength
of the tendon was desired for the second test of each specimen. Readings from the
tendon strain gages after the first test of each specimen indicated that a decrease in the
tendon force of 163 kN and 170 kN occurred for specimens JH1 and JH2, respectively.
Thus, the prestress force prior to the second stressing for JH1 was 2690 kN – 163 kN =
2527 kN, and that for specimen was 2135 kN – 170kN = 1965 kN. A total force of 3850
kN was applied to specimen JH1 prior to wedge seating, while a prestress of 3710 kN
was applied to JH2. Using an assumed wedge seating of approximately 6.4 mm, the
predicted force in each tendon after losses was 3180 kN and 3039 kN for specimens JH1
and JH2, respectively. Only two of the four the strain gages mounted on the tendons of
each specimen functioned properly during stressing. An average of the gage readings for
JH1 indicated a force increase of 710 kN in the tendon, corresponding to a total prestress
force of 2527 kN + 710 kN = 3237 kN. The average strain readings for gages on JH2
indicated a force increase of 440 kN, and the corresponding total prestress after losses
was 1965 kN + 440 kN = 2405 kN.
Several sets of readings were recorded for each demec point location on each specimen
prior to the second stressing. The independent readings were all very close and thus it is
felt that a good “zero” was established for each set of points. The prestress force increase
was calculated using the average surface strain increase measured by the demec gage and
an elastic modulus based on the compressive cylinder strength of the concrete. The
calculated force increase for specimen JH1 was 770 kN, while that for JH2 was 672 kN.
Good agreement between the force increase calculated using the demec points and tendon
strain gages was achieved for JH1. The increase in prestress force given by the demec
readings is significantly higher than that indicated by the tendon strain gages for
specimen JH2.
53

It is believed that the demec gage readings should give a reasonable estimate of the force
increase in the tendon of each specimen. The reason for the low strain readings recorded
for the prestressing steel of JH2 is not understood. The final prestress force after losses
was calculated as an average of the force increase indicated by the demec gage and
tendon strain gages. For specimen JH1, the total tendon force taken as 2527 kN + 740
kN = 3267 kN while that for JH2 was 1965kN + 556 kN = 2521 kN. The prestress loss
measured for the period between the end of the second post-tensioning and the second
test was negligible for both specimens.
It must be noted that there exists some uncertainty in the actual total prestress force for
each specimen. The above gives only a “best-estimate” of the true prestress force. An
error on the order of 10% - 20% is not unreasonable. However, since additional axial
load was applied to the specimens (as described in the Section 3.4), the error in total
vertical load acting on the column should not be extreme.
54

0 10 20 30
Time (minute)40
0
2000
4000
6000
8000
Stra
in (m
icro
stra
in)
0 20 40 6
Time (minute)0
0
2000
4000
6000
Stra
in (m
icro
stra
in)
(a) Specimen JH1
(b) Specimen JH2
Figure 4.4.18 Tendon strains during first prestressing of specimens JH1 and JH2
55

4.5 Experimental Results – Specimen JH1-T1
4.5.1 Observations under Repeated Cyclic Loading
A description of the behavior of specimen JH1 is given along with some supporting
photographic illustrations. The push direction is indicated by plus sign (+) and the pull
direction by a minus sign (-).
±0.5 P1 (Pmax=37.3 kN and Pmin=-37.4 kN)
There was no cracking observed in either the push or pull direction.
±P1 (Pmax= 74.9 kN and Pmin= -75.0 kN)
There was no cracking observed in either the push or pull direction.
±1.5P1 (Pmax= 112.2 kN and Pmin= -112.5 kN)
Flexural cracking was observed at the interface between column segments one and two
directly adjacent to the top of the steel jacket during the pull loading.
3 cycles at 0.36% drift (Pmax = 125.6 kN and Pmin = -118.6 kN)
During the push direction of loading, flexural cracking was observed at the interface
between segments one and two. A small flexural crack at the interface between the
footing and segment one was observed during the first pull loading.
3 cycles at 0.6% drift (Pmax= 164.7 kN and Pmin= -156.2 kN)
Flexural cracking at the footing/column interface as well as extension of the crack at the
top of the steel jacket was observed during the first push loading cycle. Flexural cracks
in segment two were observed at heights of approximately 275mm, 425mm and 575 mm
above the steel jacket for the first cycle of loading. Cracks at the interfaces between the
footing and segment one, and between segment one and segment two, were observed to
have opened to approximately 0.5-1.0 mm during the first cycle of loading.
56

3 cycles at 0.9% drift (Pmax= 186.7 kN and Pmin= -175.6 kN)
The formation of flexural cracks continued to progress up the height of the column. The
crack width at the base of the column was observed to be 1-1.5 mm and the neutral axis
depth from the compression edge was approximately 350 mm. Minor crack extensions
were observed after the third loading cycle.
3 cycles at 1.2% drift (Pmax= 196.9 kN and Pmin= -185.3 kN)
Flexural cracks were observed in the third column segment at this drift level. After three
complete loading cycles, segment two was observed to have cracks somewhat evenly
spaced along its full height. Minor spalling of concrete at the gap between the jacket toe
and the footing was observed. The crack opening at the footing level was 2 mm and the
neutral axis depth was observed to be around 300 mm. Figure 4.19 shows the crack
pattern on the south face of the column.
3 cycles at 1.6% drift (Pmax= 206.1 kN and Pmin= -194.9 kN)
Continued minor concrete spalling at the column compression toe was observed for both
the push and pull loading directions (see Figure 4.20). Two new flexural cracks,
approximately 200mm above the joint between segment two and segment three, were
observed in segment three on both the south and north faces after the first push and pull
loading cycle. The crack at the column base opened to 3 – 4 mm during cycles at this
drift level.
3 cycles at 2.0% drift (Pmax= 210.4 kN and Pmin= -199.4 kN)
Increased spalling of concrete below the jacket toe was observed. Vertical cracking and
the beginning of concrete crushing were observed in the compression face of segment
two just above the steel jacket during the first pull loading direction. The crack widths at
the column base and at the interface between segment one and segment two were
approximately 5 mm and 2 mm respectively.
57

3 cycles at 3.0% drift (Pmax= 217.0 kN and Pmin= -206.3 kN)
During the first push loading, significant crushing of concrete and vertical splitting was
observed in segment two at the compression face directly above the steel-jacketed
segment. This is shown in Figure 4.21. The cover concrete in an area of approximately
175 mm by 175 mm just above the steel jacket had separated from the concrete core. An
increased amount of concrete crushing at the column compression toe over previous drift
levels was also observed. Upon unloading from the first half-cycle, the test was paused
at zero horizontal load before deciding to continue with the first pull loading. Spalling of
cover concrete and vertical cracking in segment two just above the jacketed segment at
the south generator were also observed during the first pull loading. Crack openings of
10 mm and 5 mm were observed at the column base and at the jacketed segment/segment
two joint, respectively. The opening at the interface between the column base and
footing is shown in Figure 4.22. The damaged region at the base of the second column
segment is also visible in the photo. During the second cycle push loading, the crack
opening at the interface between segments one and two was larger than during the first
cycle. It appeared as though the column was beginning to hinge about the top of the
steel-jacketed segment, rather than about the column base. Continued vertical cracking in
segment two on the compression face as well as crushing just below the jacketed segment
was observed for both the push and pull directions during the second loading cycle. No
further damage to the column was observed during the third cycle of loading.
Test End
The damaged region at the column base at the north side is shown in Figure 4.23. Figure
4.24 shows the region directly above the steel jacket after the loose concrete had been
removed and prior to repair. A residual crack at the column base existed due to the
crushed concrete in that region. The damage below the jacket was however, essentially
cosmetic and could be repaired relatively easily. No inclination of the flexural cracks
was observed. All cracks observed in the non-jacketed column segments closed
completely once the lateral force was removed at test end. The prestressing steel did not
58

fracture during the test. As expected, the residual drift of the column was very low and
was equal to 0.14%.
59

Figure 4.19 JH1 – Test 1 Crack pattern at 1.2% drift
Figure 4.20 JH1 – Test 1 Spalling below jacket at 1.6% drift
60

Figure 4.21 JH1 – Test 1 Damaged region above jacket at segment 3 base at 3.0% drift
Figure 4.22 JH1 – Test 1 Crack at column base at 3.0% drift
61

Figure 4.23 JH1 I Test 1 Damage below jacket at test end
Figure 4.24 JH1 – Test 1 Spalled region above jacket at test end
62

4.5.2 Force-Displacement Response
The force-displacement response for the first test of specimen JH1 is displayed in Figure
4.25. Stable, hysteretic response was observed for both directions of loading up to the
maximum imposed drift of 3.0%. Significant non-linear behavior initiated at a force
level of approximately 160 kN, or 2.25 times the theoretical load to cause decompression
at the column base (i.e., 2.25 x P1). Maximum column strengths were achieved at the
maximum imposed drift of 3.0% and were 217.0 kN and -206.3 kN for the push and pull
loading directions, respectively. Though the response was stable throughout the test, there
can be seen two spikes of the force for the negative direction of loading at 3.0% drift.
These spikes occurred during unloading from the third pull cycle at test end and were a
result of actuator instability.
-120 -80 -40 0 40 80 120
Lateral Displacement (mm)
-250
-200
-150
-100
-50
0
50
100
150
200
250
Late
ral F
orce
(kN
)
-3 -2 -1 0 1 2 3Drif t (%)
AnalyticalAdjusted AnalyticalExperimental
Pull
Push
P
f 'c Ac = 0.272
Figure 4.25 JH1–Test 1 Force-displacement response
63
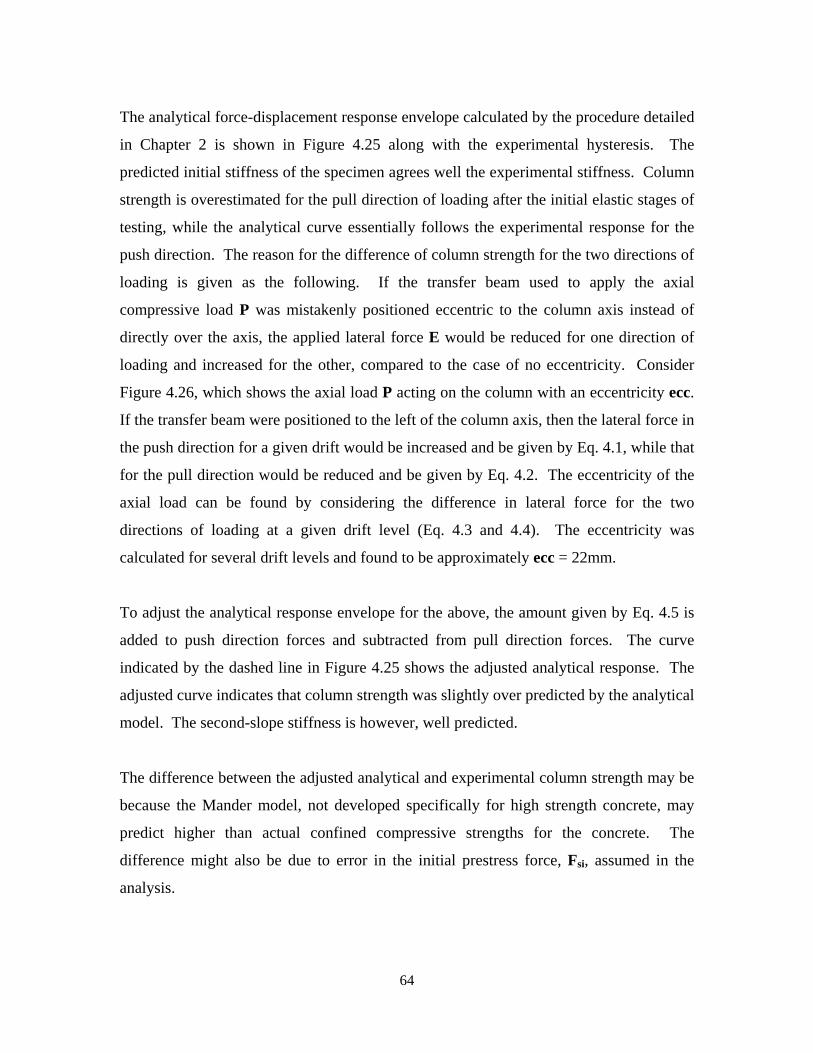
The analytical force-displacement response envelope calculated by the procedure detailed
in Chapter 2 is shown in Figure 4.25 along with the experimental hysteresis. The
predicted initial stiffness of the specimen agrees well the experimental stiffness. Column
strength is overestimated for the pull direction of loading after the initial elastic stages of
testing, while the analytical curve essentially follows the experimental response for the
push direction. The reason for the difference of column strength for the two directions of
loading is given as the following. If the transfer beam used to apply the axial
compressive load P was mistakenly positioned eccentric to the column axis instead of
directly over the axis, the applied lateral force E would be reduced for one direction of
loading and increased for the other, compared to the case of no eccentricity. Consider
Figure 4.26, which shows the axial load P acting on the column with an eccentricity ecc.
If the transfer beam were positioned to the left of the column axis, then the lateral force in
the push direction for a given drift would be increased and be given by Eq. 4.1, while that
for the pull direction would be reduced and be given by Eq. 4.2. The eccentricity of the
axial load can be found by considering the difference in lateral force for the two
directions of loading at a given drift level (Eq. 4.3 and 4.4). The eccentricity was
calculated for several drift levels and found to be approximately ecc = 22mm.
To adjust the analytical response envelope for the above, the amount given by Eq. 4.5 is
added to push direction forces and subtracted from pull direction forces. The curve
indicated by the dashed line in Figure 4.25 shows the adjusted analytical response. The
adjusted curve indicates that column strength was slightly over predicted by the analytical
model. The second-slope stiffness is however, well predicted.
The difference between the adjusted analytical and experimental column strength may be
because the Mander model, not developed specifically for high strength concrete, may
predict higher than actual confined compressive strengths for the concrete. The
difference might also be due to error in the initial prestress force, Fsi, assumed in the
analysis.
64
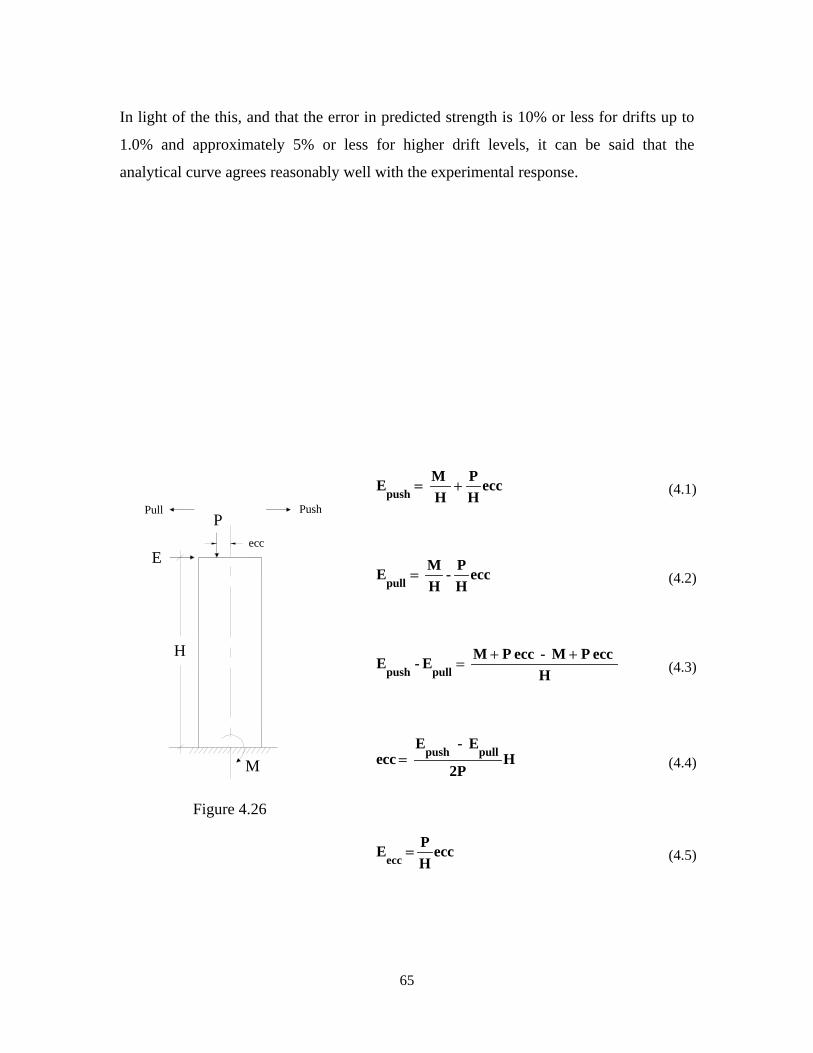
In light of the this, and that the error in predicted strength is 10% or less for drifts up to
1.0% and approximately 5% or less for higher drift levels, it can be said that the
analytical curve agrees reasonably well with the experimental response.
eccHP
H M Epush += (4.1)
H
Pull Push
eccE
P
M
eccHP -
HM Epull = (4.2)
H ecc P M - ecc P M E - E pullpush
++= (4.3)
H2P
E - E cce pullpush= (4.4)
Figure 4.26
eccHP Eecc = (4.5)
65

The initial stiffness of the specimen did not deteriorate drastically until high drift levels.
In order to quantify any decrease in the initial elastic stiffness, Ki, defined as the stiffness
at a force level equal to the theoretical decompression force, is introduced and given is by
Eq. 4.6:
1
1i
P K∆
= (4.6)
where P1 is the theoretical decompression force and ∆1 is the displacement observed at
that force level during loading to a given drift. The loading stiffness, Ki, is calculated
during reloading to the second positive peak after one complete cycle at the particular
drift. The decrease in initial column stiffness is depicted in Figure 4.27. For low to
moderate drifts, the stiffness decreased by about one third while at the maximum imposed
drift of 3.0%, the initial loading stiffness had dropped to 40% of its original value.
0 1 2 3
Drif t (%)
4
6
8
10
12
Stif
fnes
s (kN
/mm
)
100
90
80
70
60
50
40
Perc
ent o
f O
rigin
al S
tiffn
ess (
%)
Figure 4.27 JH1–Test 1 Initial loading stiffness versus drift
66

The hysteretic energy dissipation of the specimen, indicated by the area within the force-
displacement loops, was low for all drift levels. Using the calculated area within the
loops and the procedure given in Ref. 5, an equivalent viscous damping ratio was
calculated for the various drift levels. The damping coefficient is shown as a function of
drift in Figure 4.28. It can be seen that the damping increased from around 4% for early
stages of testing to 7% at the maximum drift. The increase in the damping coefficient at
high drifts may be due to the energy dissipated by crushing of concrete at both the
column base and above the jacket in column segment two. It was found that for the
higher drift levels, the hysteretic energy dissipated during the second cycle was less than
the first – the damping coefficients were lower by several percent.
0 1 2 3
Drif t (%)
0
2
4
6
8
10
Equi
vale
nt V
isco
us D
ampi
ng (%
)
Figure 4.28 JH1 – Test 1 Equivalent viscous damping
4.5.3 Test Data
A large array of instrumentation was used to monitor various quantities of interest during
testing. This included linear potentiometers to measure displacements and curvature and
67

strain gages mounted on reinforcing steel. The data recorded during testing is presented
in a reduced form as strain and curvature profile plots using values recorded at peak
displacements during the first cycle of loading for each force or drift level.
Column Curvature
Curvature along the column height is shown in Figure 4.29. The curvature values were
calculated as described previously in Section 3.4. The large curvatures for high drifts at
the base of the column and at a height of approximately 600 mm are due to the crack
opening between the bottom of the column and the footing, and between the first and
second column segments, respectively. Thus, the displacement measured at the top of the
column at high drifts was due not only to the rotation of the column about its
compression toe, but also to rotation about the top of the steel jacketed segment. This is
contrary to the analytical model presented, which assumes the majority of crack opening
occurs at the column base. It is believed that the curvatures at the base as calculated are
higher than actual, since the assumption that plane sections remain plane might not be
valid. This idea is evidenced by the discontinuity of the critical section at the neutral axis
observed during testing.
Because much of the column rotation is concentrated at the base of the column, high
curvatures and thus high compression strains develop at the compression toe. An
estimate of the extreme fiber concrete strain at the critical section for 3.0% drift is given
as (see En. 3.2):
0.021 )mm 6x10(60mm)(1.0 - 167mm4.5mm 1-4-
c ==ε
The predicted strain from the moment-curvature analysis for 3.0% drift is εc = 0.014.
68

-0.00015 -0.0001 -5e-005 0 5e-005 0.0001 0.00015
Curvature (mm-1)
0
400
800
1200
1600
2000
Col
umn
Hei
ght (
mm
)
f e d c b a a b c d e f
a drift = 0.6%b drift = 0.9%c drift = 1.2%d drift = 1.6%e drift = 2.2%f drift = 3.0%
Pull Push
Figure 4.29 JH1–Test 1 Curvature along column height
Prestressing Steel Strain
A comparison between the analytical and experimental increase in tendon strain due to
opening of the crack at the column base is shown Figure 4.30. Readings from the strain
gages mounted on the tendon strands were used to construct the experimental curve. For
each strain gage, the readings at peak displacement and at zero horizontal displacement
prior to the peak were subtracted to give a value of incremental strain. The strain gages
were mounted on opposite sides of the tendon arrangement. Since the analytical model
assumes all the prestressing steel to be located exactly at mid-depth of the section, and
since the gauged strands were actually located a finite distance away from the center, the
experimental values from opposite sides of the tendon arrangement were averaged. It
should be noted that only two of the four strain gages functioned properly during testing.
It can be seen that the tendon strain increase is over-predicted except at low drift levels.
Following the analytical model presented in Chapter 2, this implies that the actual neutral
axis depth was larger than predicted. As mentioned previously, the Mander model may
69

over-estimate the confined strength of high strength concrete, and consequently predict a
smaller neutral axis depth. In light of the uncertainty regarding the strain gage readings
and the fact that the maximum error is on the order of 30% or less, it can be argued that
the predicted and observed curves agree within reason. Note also that the an error of
30% in the predicted tendon strain increase leads to only 2% error for the total vertical
force (prestress plus applied axial load) acting on the column.
-2 0 2
Drif t (%)
0
200
400
600
800
Stra
in In
crea
se (m
icro
stra
in)
PredictedExperimental
Figure 4.30 JH1–Test 1 Predicted and experimental tendon strain increase
Steel Jacket Strains
Five pairs of orthogonal strain gages were mounted on the north and south generators of
the steel jacket oriented in the vertical and horizontal directions. Five horizontal gages
were mounted at the east and west generators. Figures 4.31 and 4.32 show the hoop
strain profiles at the north and south generators, respectively. Large hoop strains near the
base of the jacket developed because of confining action of the jacket on the compressed
concrete at the column compression toe. Maximum hoop strains at the jacket toe
occurred at 3.0% drift and were 1800 µε and 4900 µε for the north and south generators,
70

respectively. Relatively large hoop strains also occurred at the top of the jacket due to
the high concrete compressive strain at the interface between column segments one and
two.
Hoop strains at the east and west generators are shown in Figures 4.33 and 4.34. The
strains are caused by both the shear acting on the column and by the influence of
confining action of the jacket at the column compression toe. The strains are higher near
the bottom of the jacket since the higher concrete compressive strain near the base causes
higher levels of dilation of the core concrete. The maximum observed strains of 650 µε
and 750 µε for the push and pull directions are well below the material yield strain of
approximately 1550 µε.
The vertical strain profiles for the north and south generators are displayed in Figures
4.35 and 4.36. The vertical strains at the compression generators (north for push/south
for pull) are induced by the bending action of the column and are significant for both
directions of loading. Maximum strains of approximately 600 µε and 1850 µε were
observed for the push and pull directions at a drift of 3.0%.
Transverse Spiral Strains
Strains in the spiral reinforcement of the non-jacketed column segments are shown in
Figures 4.37 and 4.38 for the north and south generators. The negative or compression
strains observed at the north generator are not expected since dilation of the compressed
concrete induces circumferential tension in the spiral. It is believed that a change in
polarity of the strain gage signals somehow occurred. The hoop strains increase down
the height of the column since the moment, and thus the concrete compressive strains,
increase down the column height. For the 3.0% drift level, a marked increase in strain
occurred for the gage at 750 mm above the footing. This location corresponds to just
above the top of the jacket where significant spalling of the cover concrete was observed.
The maximum strain for the push direction was just below the yield strain of 2200 µε,
while that for the pull direction was 700 µε.
71

Hoop strains at the east and west sides of the column are shown in Figures 4.39 and 4.40.
The strains are relatively small except at the bottom of the second column segment on the
east side where the strain jumps from positive to negative. The changes in sign of the
strains there and along the full height at the west generator are not understood, but may
be due to gage instability and/or swapped strain gage leads.
72

0 400 800 1200 1600 2000
Strain (microstrain)
0
200
400
600
Hei
ght o
n Ja
cket
(mm
)0 400 800 1200 1600 2000
Strain (microstrain)
0
200
400
600
Hei
ght o
n Ja
cket
(mm
)
PUSH DIRECTION PULL DIRECTION0.36%0.6%0.9%1.2%1.6%2.0%3.0%
0.36%0.6%0.9%1.2%1.6%2.0%3.0%
Figure 4.31 JH1 – Test 1 Jacket hoop strain at north generator
0 1000 2000 3000 4000 5000
Strain (microstrain)
0
200
400
600
Hei
ght o
n Ja
cket
(mm
)
-1000 0 1000 2000 3000 4000
Strain (microstrain)
0
200
400
600
Hei
ght o
n Ja
cket
(mm
)
PUSH DIRECTION PULL DIRECTION0.36%0.6%0.9%1.2%1.6%2.0%3.0%
0.36%0.6%0.9%1.2%1.6%2.0%3.0%
Figure 4.32 JH1 – Test 1 Jacket hoop strain at south generator
73

0 200 400 600 800
Strain (microstrain)
0
100
200
300
400
500
Hei
ght o
n Ja
cket
(mm
)0 200 400 600 800
Strain (microstrain)
0
100
200
300
400
500
Hei
ght o
n Ja
cket
(mm
)
PUSH DIRECTION PULL DIRECTION
0.36%0.6%0.9%1.2%1.6%2.0%3.0%
0.36%0.6%0.9%1.2%1.6%2.0%3.0%
Figure 4.33 JH1 – Test 1 Jacket hoop strain at east generator
0 200 400 600 800
Strain (microstrain)
0
200
400
600
Hei
ght o
n Ja
cket
(mm
)
0 200 400 600 800
Strain (microstrain)
0
200
400
600
Hei
ght o
n Ja
cket
(mm
)
PUSH DIRECTION PULL DIRECTION
0.36%0.6%0.9%1.2%1.6%2.0%3.0%
0.36%0.6%0.9%1.2%1.6%2.0%3.0%
Figure 4.34 JH1 – Test 1 Jacket hoop strain at west generator
74

-400 -200 0 200 400
Strain (microstrain)
0
200
400
600
Hei
ght o
n Ja
cket
(mm
)-800 -600 -400 -200 0
Strain (microstrain)
0
200
400
600
Hei
ght o
n Ja
cket
(mm
)
PUSH DIRECTION
PULL DIRECTION
0.36%0.6%0.9%1.2%1.6%2.0%3.0%
0.36%0.6%0.9%1.2%1.6%2.0%3.0%
Figure 4.35 JH1 – Test 1 Jacket vertical strain at north generator
-2000 -1600 -1200 -800 -400 0
Strain (microstrain)
0
200
400
600
Hei
ght o
n Ja
cket
(mm
)
-1600 -1200 -800 -400 0 400
Strain (microstrain)
0
200
400
600
Hei
ght o
n Ja
cket
(mm
)
PUSH DIRECTION PULL DIRECTION
0.36%0.6%0.9%1.2%1.6%2.0%3.0%
0.36%0.6%0.9%1.2%1.6%2.0%3.0%
Figure 4.36 JH1 – Test 1 Jacket vertical strain at south generator
75

-800 -400 0 400
Strain (microstrain)
400
800
1200
1600
2000
2400
Hei
ght A
bove
Foo
ting
(mm
)-2000 -1600 -1200 -800 -400 0
Strain (microstrain)
400
800
1200
1600
2000
2400
Hei
ght A
bove
Foo
ting
(mm
)
PUSH DIRECTION PULL DIRECTION
0.36%0.6%0.9%1.2%1.6%2.0%3.0%
0.36%0.6%0.9%1.2%1.6%2.0%3.0%
Figure 4.37 JH1 – Test 1 Spiral strains at north generator
-800 -400 0 400
Strain (microstrain)
400
800
1200
1600
2000
2400
Hei
ght A
bove
Foo
ting
(mm
)
-400 -200 0 200 400 600
Strain (microstrain)
400
800
1200
1600
2000
2400
Hei
ght A
bove
Foo
ting
(mm
)
PUSH DIRECTION PULL DIRECTION0.36%0.6%0.9%1.2%1.6%2.0%3.0%
0.36%0.6%0.9%1.2%1.6%2.0%3.0%
Figure 4.38 JH1 – Test 1 Spiral strain at south generator
76

-800 -600 -400 -200 0 200 400
Strain (microstrain)
400
800
1200
1600
2000
2400
Hei
ght A
bove
Foo
ting
(mm
)-800 -400 0 400
Strain (microstrain)
400
800
1200
1600
2000
2400
Hei
ght A
bove
Foo
ting
(mm
)
PUSH DIRECTION PULL DIRECTION
0.36%0.6%0.9%1.2%1.6%2.0%3.0%
0.36%0.6%0.9%1.2%1.6%2.0%3.0%
Figure 4.39 JH1 – Test 1 Spiral strain at east generator
-120 -80 -40 0 40 80
Strain (microstrain)
400
800
1200
1600
2000
2400
Hei
ght A
bove
Foo
ting
(mm
)
-200 -100 0 100 200
Strain (microstrain)
400
800
1200
1600
2000
2400
Hei
ght A
bove
Foo
ting
(mm
)
PUSH DIRECTION PULL DIRECTION
0.36%0.6%0.9%1.2%1.6%2.0%3.0%
0.36%0.6%0.9%1.2%1.6%2.0%3.0%
Figure 4.40 JH1 – Test 1 Spiral strain at west generator
77

4.6 Experimental Results – Specimen JH1-T2
4.6.1 Observations under Repeated Cyclic Loading
The planned loading sequence after repairing the damage from the first test and re-
stressing to the higher force level, called for one cycle each to be performed in force
control at one-half, one, and one-and-a-half times the theoretical force to cause
decompression at the critical section (P1). After switching to displacement control, three
cycles were to then be performed at twice the decompression force. The displacements
observed during the first cycle at 1.5 x P1 however, were larger than those predicted for
the next target level of 2 x P1. It was thus decided to switch to displacement control after
the first cycle at 1.5 x P1 and then perform two more cycles at that level. A summary of
the observed behavior is given below. The push direction of loading is represented by a
plus sign (+), while the pull direction is signified by a minus sign (-).
±0.5 P1 (Pmax= 43.2 kN and Pmin= -44.2 kN)
There was no cracking observed in either the push or pull direction.
±P1 (Pmax= 86.8 kN and Pmin= -87.8 kN)
A hairline crack was observed below the steel jacket at the footing/column interface for
the pull loading direction.
3cycles at 0.36% drift (Pmax= 111.2 kN and Pmin= -108.3 kN)
Flexural cracking at the base of the column, below the steel jacket, was observed for the
push direction of loading.
3 cycles at 0.6% drift (Pmax= 145.9kN and Pmin= -142.5 kN)
The neutral axis depth was approximately 450 mm from the extreme compression edge at
this drift. Several cracks in column segment two were noted to have formed at locations
of previous cracks from the first test. The crack width at the base of the column was
about 1 mm.
78

3 cycles at 0.9% drift (Pmax= 179.9 kN and Pmin= -176.6 kN)
The depth to the neutral axis from the compression edge decreased to 340 mm. Several
cracks in the segment above the steel jacket were noticed at the gaps between the
fiberglass bands.
3 cycles at 1.2% drift (Pmax= 200.0 kN and Pmin= -197.5 kN)
Opening of the crack at the footing/column interface was more noticeable, increasing to
approximately 3 mm. A crack at the interface between the top of the steel jacket and
column segment two was observed and had a width of around 0.5-1 mm.
3 cycles at 1.6% drift (Pmax= 218.5 kN and Pmin= -214.8 kN)
At the footing level, the neutral axis depth was around 280 mm from the extreme
compression fiber and the crack width at the tension side was approximately 6 mm. The
epoxy below the toe of the jacket was intact and showed no signs of deterioration. Minor
crack extensions were observed in the segment above the jacket during the third cycle.
3 cycles at 2.2% drift (Pmax= 228.5 kN and Pmin= -225.1 kN)
Some damage to the epoxy repair below the jacket was noticed at the extreme
compression fiber. The neutral axis depth at the critical section was on the order of 200
mm from the compression edge.
3 cycles at 3.0% drift (Pmax= 242.1 kN and Pmin= -239.2 kN)
The neutral axis depth decreased to about 175 mm. The opening of the crack at the
column base was around 8 mm at the tension edge. At the top of the jacket, the crack
width between the jacketed segment and segment two was around 3-4 mm.
3 cycles at 4.0% drift (Pmax= 243.5 kN and Pmin= -239.5 kN)
The epoxy at the column compression toe continued to “crush” at this level of drift. The
neutral axis depth at the base decreased to 150 mm from the compression edge. The
crack opening at the base was on the order of 12-14 mm at the extreme tension fiber.
79

3 cycles at 5.0% drift (Pmax= 243.4 kN and Pmin= -235.9 kN)
The crack at the column base continued to widen and was approximately 18-19 mm. No
further opening of the crack adjacent to the top of the jacket was observed.
3 cycles at 6.0% drift (Pmax= 243.4 kN and Pmin= -235.9 kN)
The estimated width of the crack at the footing level was 22-23 mm. Significant damage
to the epoxy below the jacket toe was observed for cycles at this drift. In addition,
concrete within the section near the compression toe was crushed to some degree. This
was noticed at the crack opening at the extreme tension fiber, where one could actually
see into the central portion of the cross section due to the large lift-off of the column from
the footing. A photograph of the base crack is shown in Figure 4.41. Some spalling of
concrete below the steel jacket at the east and west generators was observed. The gap
between the bottom of the jacket and the top of the footing at the extreme compression
edge was reduced slightly due to slippage of the jacket with respect to the concrete core
and due to the rotation of the segment. An overall view of the column at the 6% drift
level is displayed in Figure 4.42.
Test End
Observed damage to the column during testing consisted of the damage below the jacket
at the critical section and the small flexural cracks in the upper column segments. A
residual crack at the level of the footing at the north and south generators existed due to
the damaged epoxy. Crushing of concrete at the shear generators was relatively minor.
No concrete crushing was observed in the upper, non-jacketed column segments, and the
flexural cracks there closed completely after the lateral force was removed. Fracture of
strands did not occur during the test. The residual drift of specimen was on the order of
0.15-0.2 % after testing.
80
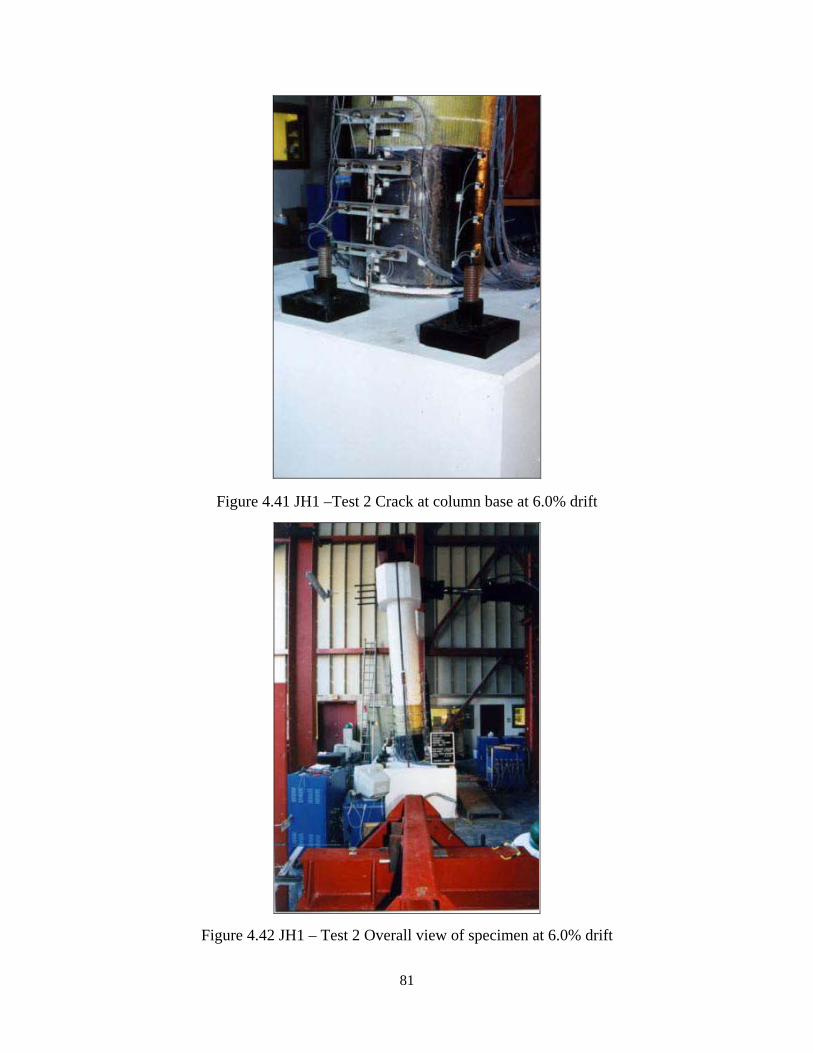
Figure 4.41 JH1 –Test 2 Crack at column base at 6.0% drift
Figure 4.42 JH1 – Test 2 Overall view of specimen at 6.0% drift
81

4.6.2 Force-Displacement Response
The lateral force-displacement response for the second test of specimen JH1 is shown in
Figure 4.43. The response of the column was stable and symmetric up to the maximum
imposed drift of 6.0%. Equal strengths were achieved for the push and pull directions of
loading. The beginning of significant non-linear response initiated at a force of around
200 kN - a force level which corresponds to approximately 2.2 times P1. The maximum
column strengths occurred at a drift of 4.0% and were 243.5 kN and -239.5 kN for the
push and pull directions, respectively. Degradation of the column strength was minimal at
higher drifts, with a decrease in capacity of 3% and 5% observed at the maximum
imposed drift for the push and pull directions.
-240 -200 -160 -120 -80 -40 0 40 80 120 160 200 240
Lateral Displacement (mm)
-300
-250
-200
-150
-100
-50
0
50
100
150
200
250
300
Late
ral F
orce
(kN
)
-6 -5 -4 -3 -2 -1 0 1 2 3 4 5 6Drif t (%)
AnalyticalExperimental
Pull
Push
indicates f ailure basedon reaching εcu
P
f 'c Ac = 0.276
Figure 4.43 JH1–Test 2 Force-displacement response
82

The analytical force-displacement response envelope is shown in Figure 4.43 along with
the experimental hysteretic response. The initial stiffness of the specimen is not well
predicted. This is because the column had been tested previously. Despite reinstating the
spalled cover concrete above the jacket and epoxy grouting the base crack below the
jacket, the original column stiffness was not restored. Although column strength was
over-predicted for all drift levels, the shape of the analytical curve for moderate to high
drifts follows the experimental reasonably well. At high drifts, the observed decrease in
strength is slightly larger than predicted by the analytical curve. Two reasons are given
for this. First, as explained previously in Section 1.5.2, the Mander model may over-
predict the confined compressive strength, f’cc, of high strength concrete. Predicted
column strengths would thus be higher than actual. In addition, the larger drop in
strength than predicted may be caused by the descending branch of the Mander stress-
strain curve being too gradual since high strength concrete tends to be less ductile than
concrete of lower strength. The difference between the analytical and experimental
force-displacement response at moderate to high drift levels is less than 10%. In light of
this, the uncertainty in initial prestress force, and the fact that the column had been tested
previously, it can be said that the analytical prediction agrees with the experimental
behavior well.
The predicted failure point of the test unit is also shown in Figure 4.43. The predicted
failure was based on reaching the ultimate concrete compression strain, εcu, and hence
rupture of the steel jacket (as given by the energy-balance approach detailed in Ref. 4).
However, the value for εcu given by Eq. 2.29 is typically conservative by 50%, and thus it
is believed that a significant reserve in displacement capacity existed.
The initial loading stiffness of the column for both first and second tests is displayed in
Figure 4.44. The vertical axis on the right side of the graph represents the stiffness at a
particular drift for the second test as a percentage of the original stiffness measured at the
theoretical decompression point (P1) during the first test. It can be seen that the column
stiffness was restored to approximately 70% of that observed for the first test after epoxy
83

grouting the base crack and patching the spalled concrete in column segment two. In
general, the decrease in stiffness as a function of imposed drift was less dramatic for the
second test than the first. After 1.6% drift, the second test stiffness is actually slightly
higher than the first. The epoxy used at the column base to repair the damaged region
after the first test was more ductile than concrete, and thus did not deteriorate as
significantly as the concrete did for the first test.
The equivalent viscous damping for the first and second test is shown in Figure 4.45. It
can be seen that the hysteretic energy dissipation increased slightly with increasing drift.
The equivalent viscous damping for the second test was lower than that for the first test
for all drift levels. This may be caused by the significant crushing of concrete at the
column base and by the spalling of cover concrete above the jacket observed for the first
test. The difference between the first and second test equivalent viscous damping is not
great, however: the maximum damping for the first test was about 7% while that for the
second test was 6%. Considering both curves, an average equivalent viscous damping of
5% could be assumed.
0 2 4 6
Drif t (%)
2
4
6
8
10
12
Stif
fnes
s (kN
/mm
)
90
80
70
60
50
40
30
20
Perc
ent o
f O
rigin
al S
tiffn
ess (
%)
Test 1Test 2
Figure 4.44 JH1 – Test 2 Initial loading stiffness versus drift
84

0 2 4 6
Drif t (%)
0
2
4
6
8
10
Equi
vale
nt V
isco
us D
ampi
ng (%
)
Test 1Test 2
Figure 4.45 JH1 – Test 2 Equivalent viscous damping versus drift
4.6.3 Test Data
Curvature and strain profiles constructed using data recorded at peak displacement during
the first cycle of loading are presented in this section. Profiles for drifts between 0.6%
and 6.0% are shown. In addition to the prestressing steel, jacket and spiral strain profiles,
hoop strains in the fiberglass bands measured at the north and south generators are
shown.
Column Curvature
Figure 4.46 shows the distribution of curvature along the column height for the second
test of JH1. The profiles look similar to those for the first test, with curvature
concentrated at the base and at the interface between column segments three and four.
Curvatures at the column base for drifts equal to and less than 3.0% are almost identical
85

to those observed for the first test. An estimate of the concrete longitudinal compression
strain at the extreme fiber of the critical section for the 6.0% drift level is given below.
εc x= 10 mm166 mm 57.2 mm 2.7 mm-1 = 0.045− −( )( )10 4
The predicted strain from the moment-curvature analysis for 6.0% drift is 0.031.
Prestressing Steel Strain
The predicted and experimental tendon strain increase curves are given in Figure 4.47.
The analytical model over-predicts the strain increase by approximately 30% on average.
Reasons given in Section 4.5.3 for the discrepancy between observed and predicted strain
increase for the first test of JH1 also apply for the second test.
-0.0003 -0.0002 -0.0001 0 0.0001 0.0002 0.0003
Curvature (mm-1)
0
400
800
1200
1600
2000
Col
umn
Hei
ght (
mm
)
a drift = 0.6%b drift = 0.9%c drift = 1.2%d drift = 1.6%e drift = 2.2%f drift = 3.0%g drift = 4.0%h drift = 5.0%i drift = 6.0%
i h g f e d c b a a b c d e f g h i
Figure 4.46 JH1–Test 2 Curvature along column height
86

Steel Jacket Strains
Hoop strain profiles for the north and south generators are shown in Figures 4.48 and
4.49, respectively. Note that the strain gage mounted near the bottom of the jacket at the
south side did not function properly and thus was not used in the strain profile. Hoop
strains are largest at the bottom of the jacket for the same reasons given for the first test.
At the base of the jacket, hoop strains slightly higher than the yield strain occurred at a
drift of 1.6%. At the maximum drift of 6.0%, the hoop strain at the jacket toe was several
times the yield strain of the material. Yielding of the jacket occurred as high as mid-
height of the segment for 6.0% drift. Figure 4.50 shows the hoop strains in the jacket at
west generator. The strains are substantially higher near the base of the jacket. The
maximum strain occurred at a drift of 6.0% and was approximately 1250 µε. Data for the
east generator strain gages was not obtained due to a problem with the data acquisition
system.
Vertical strains in the jacket at the north and south generators are shown in Figures 4.51
and 4.52. Significant strains were induced at both the north and south sides of the jacket
due to bending of the segment. Strains above the yield strain of the material occurred at
the bottom of the jacket at high drifts. Strains at the north generator are higher for the
push direction of loading since at the compression side, dilation of concrete enhances the
bond between the inner core concrete and the steel jacket. Strains at the south generator
are higher for the pull direction for the same reason.
Transverse Spiral Strains
Strains in the transverse spiral reinforcement along the column height are shown in
Figures 4.53 - 4.56. The maximum strains in the spiral are similar in magnitude to those
observed for the first test. The erratic strain readings along the height observed for some
of the profiles are believed to be due to gage instability. Interpretation of the data in a
meaningful way is thus difficult. It can be said however that hoop strains at a height of
around 800 mm above the footing at the north generator (the region just above the steel
jacket where spalling had occurred during the first test) are high since dilation of the
87

compressed concrete is greater than higher up on the column. The strains at the east and
west generators are low in general, but the trend of increasing strain down the column is
visible.
Fiberglass Jacket Strains
Two electrical resistance strain gages with a gage length of 60 mm were mounted on the
lower two fiberglass rings at both the north and south generators. The gages were
oriented in the horizontal position in order to measure hoop strains associated with the
confining action of the wrap on the compressed concrete. Strain profiles are shown in
Figures 4.57 and 4.58 for the north and south generators, respectively. The maximum
observed strains occurred just above the top of the steel jacket were approximately 1750
µε and 1500 µε for the north and south sides, respectively
-6 -4 -2 0 2 4 6
Drif t (%)
0
400
800
1200
1600
Stra
in In
crea
se (m
icro
stra
in)
PredictedExperimental
Pull Push
Figure 4.47 JH1 – Test 2 Predicted and experimental tendon strain increase
88

0 2000 4000 6000 8000
Strain (microstrain)
0
200
400
600
Hei
ght o
n Ja
cket
(mm
)0 2000 4000 6000 8000
Strain (microstrain)
0
200
400
600
Hei
ght o
n Ja
cket
(mm
)
0.6%0.9%1.2%1.6%2.2%3.0%4.0%5.0%6.0%
0.6%0.9%1.2%1.6%2.2%3.0%4.0%5.0%6.0%
PUSH DIRECTION PULL DIRECTION
Figure 4.48 JH1 – Test 2 Jacket hoop strain at north generator
0 2000 4000 6000 8000
Strain (microstrain)
0
200
400
600
Hei
ght o
n Ja
cket
(mm
)
0 1000 2000 3000 4000 5000
Strain (microstrain)
0
200
400
600
Hei
ght o
n Ja
cket
(mm
)
0.6%0.9%1.2%1.6%2.2%3.0%4.0%5.0%6.0%
0.6%0.9%1.2%1.6%2.2%3.0%4.0%5.0%6.0%
PUSH DIRECTION PULL DIRECTION
Figure 4.49 JH1 – Test 2 Jacket hoop strain at south generator
89

0 400 800 1200 1600
Strain (microstrain)
0
200
400
600
Hei
ght o
n Ja
cket
(mm
)0 400 800 1200 1600
Strain (microstrain)
0
200
400
600
Hei
ght o
n Ja
cket
(mm
)
0.6%0.9%1.2%1.6%2.2%3.0%4.0%5.0%6.0%
0.6%0.9%1.2%1.6%2.2%3.0%4.0%5.0%6.0%
PUSH DIRECTION PULL DIRECTION
Figure 4.50 JH1 – Test 2 Jacket hoop strain at west generator
90

-4000 -3000 -2000 -1000 0 1000
Strain (microstrain)
0
200
400
600
Hei
ght o
n Ja
cket
(mm
)-4000 -3000 -2000 -1000 0 1000
Strain (microstrain)
0
200
400
600
Hei
ght o
n Ja
cket
(mm
)
0.6%0.9%1.2%1.6%2.2%3.0%4.0%5.0%6.0%
0.6%0.9%1.2%1.6%2.2%3.0%4.0%5.0%6.0%
PUSH DIRECTION PULL DIRECTION
Figure 4.51 JH1 – Test 2 Jacket vertical strain at north generator
-5000 -4000 -3000 -2000 -1000 0
Strain (microstrain)
0
200
400
600
Hei
ght o
n Ja
cket
(mm
)
-4000 -3000 -2000 -1000 0 1000
Strain (microstrain)
0
200
400
600
Hei
ght o
n Ja
cket
(mm
)
0.6%0.9%1.2%1.6%2.2%3.0%4.0%5.0%6.0%
0.6%0.9%1.2%1.6%2.2%3.0%4.0%5.0%6.0%
PUSH DIRECTION PULL DIRECTION
Figure 4.52 JH1 – Test 2 Jacket vertical strain at south generator
91

-400 -200 0 200 400 600
Strain (microstrain)
400
800
1200
1600
2000
2400
Hei
ght A
bove
Foo
ting
(mm
)-2500 -2000 -1500 -1000 -500 0
Strain (microstrain)
400
800
1200
1600
2000
2400
Hei
ght A
bove
Foo
ting
(mm
)
PUSH DIRECTION
0.6%0.9%1.2%1.6%2.2%3.0%4.0%5.0%6.0%
0.6%0.9%1.2%1.6%2.2%3.0%4.0%5.0%6.0%
PULL DIRECTION
Figure 4.53 JH1 – Test 2 Spiral strain at north generator
-800 -400 0 400 800
Strain (microstrain)
400
800
1200
1600
2000
2400
Hei
ght A
bove
Foo
ting
(mm
)
-200 0 200 400 600 800 1000
Strain (microstrain)
400
800
1200
1600
2000
2400
Hei
ght A
bove
Foo
ting
(mm
)
PUSH DIRECTION
0.6%0.9%1.2%1.6%2.2%3.0%4.0%5.0%6.0%
0.6%0.9%1.2%1.6%2.2%3.0%4.0%5.0%6.0%
PULL DIRECTION
Figure 4.54 JH1 – Test 2 Spiral strain at south generator
92

-400 -200 0 200 400
Strain (microstrain)
400
800
1200
1600
2000
2400
Hei
ght A
bove
Foo
ting
(mm
)-600 -400 -200 0 200 400
Strain (microstrain)
400
800
1200
1600
2000
2400
Hei
ght A
bove
Foo
ting
(mm
)
PUSH DIRECTION
0.6%0.9%1.2%1.6%2.2%3.0%4.0%5.0%6.0%
0.6%0.9%1.2%1.6%2.2%3.0%4.0%5.0%6.0%
PULL DIRECTION
Figure 4.55 JH1 – Test 2 Spiral strain at east generator
-200 -100 0 100 200
Strain (microstrain)
400
800
1200
1600
2000
2400
Hei
ght A
bove
Foo
ting
(mm
)
-200 -100 0 100 200
Strain (microstrain)
400
800
1200
1600
2000
2400
Hei
ght A
bove
Foo
ting
(mm
)
PUSH DIRECTION
0.6%0.9%1.2%1.6%2.2%3.0%4.0%5.0%6.0%
0.6%0.9%1.2%1.6%2.2%3.0%4.0%5.0%6.0%
PULL DIRECTION
Figure 4.56 JH1 – Test 1 Spiral strain at west generator
93

0 200 400 600 800
Strain (microstrain)
600
640
680
720
760
800
Hei
ght A
bove
Foo
ting
(mm
)0 1000 2000 3000
Strain (microstrain)
600
640
680
720
760
800
Hei
ght A
bove
Foo
ting
(mm
)
PUSH DIRECTION
0.6%0.9%1.2%1.6%2.2%3.0%4.0%5.0%6.0%
0.6%0.9%1.2%1.6%2.2%3.0%4.0%5.0%6.0%
PULL DIRECTION
Figure 4.57 JH1 – Test 2 Fiberglass jacket hoop strain at north generator
0 1000 2000 3000
Strain (microstrain)
600
640
680
720
760
800
Hei
ght A
bove
Foo
ting
(mm
)
0 200 400 600 800
Strain (microstrain)
600
640
680
720
760
800
Hei
ght A
bove
Foo
ting
(mm
)
PUSH DIRECTION
0.6%0.9%1.2%1.6%2.2%3.0%4.0%5.0%6.0%
0.6%0.9%1.2%1.6%2.2%3.0%4.0%5.0%6.0%
PULL DIRECTION
Figure 4.58 JH1 – Test 2 Fiberglass jacket hoop strain at south generator
94

4.7 Experimental Results – Specimen JH2-T1
4.7.1 Observations under Repeated Cyclic Loading
A description of the behavior of specimen JH2 during the first test is given along with
some supporting photographic illustrations. The planned loading sequence given in
Section 3.5 called for one cycle each to be performed in force control at one-half, one,
and one-and-a-half times the theoretical force to cause decompression at the critical
section (P1). After switching to displacement control, three cycles were to then be
performed at twice the decompression force. The displacements observed during the first
cycle at 1.5 x P1 however, were larger than those predicted for the next force target level
of 2 x P1. It was thus decided to switch to displacement control after the first cycle at 1.5
x P1 and then perform two more cycles at that level.
±0.5 P1 (Pmax=39.1 kN and Pmin= -39.4 kN)
No cracking was observed for either direction of loading.
±P1 (Pmax= 78.5 kN and Pmin= -78.7 kN)
A horizontal flexural crack was observed below the steel jacket at the footing level for
both the push and pull direction of loading.
3 cycles at ±1.5Pd (Pmax= 117.6 kN and Pmin= -117.9 kN)
Flexural cracks at the interface between segments one and two were observed for both the
push and pull directions of loading. Cracking at the column base was noted for the pull
direction of loading.
3 cycles at 0.6% drift (Pmax= 162.0 kN and Pmin= -154.1 kN)
More pronounced flexural cracks at the column base were observed during the first cycle
of loading. The flexural crack between the steel jacketed segment and segment above
was approximately 1mm for both directions of loading. Flexural cracks were observed in
95

the second column segment at heights of 300 mm and 450 mm above the top of the
jacket.
3 cycles at 0.9% drift (Pmax= 182.0 kN and Pmin= -173.0 kN)
New flexural cracks at a 250mm spacing were observed in segment two during the first
half-cycle at this drift level. Existing cracks in the segment extended towards the column
sides in the first pull half-cycle of loading. Crack openings of approximately 1mm and
2mm were observed at the interface between segments one and two, and at the column
base, respectively.
3 cycles at 1.2% drift (Pmax= 196.1 kN and Pmin= -185.3 kN)
Significant extension of existing cracks towards the column sides was observed in
segment two for both the first push and pull loading. At this drift level, flexural cracks
were spaced evenly along the full height of the second column segment up to the bottom
of the third segment. Figure 4.59 shows the crack pattern at the south generator for the
third push loading. The crack at the column base opened to approximately 2mm.
Incipient spalling of concrete at the gap between the jacket toe and footing was observed
for the push loading direction.
3 cycles at 1.6% drift (Pmax= 203.5 kN and Pmin= -192.5 kN)
Minor crushing of concrete below the steel jacket at the column compression toe was
noted for cycles at this drift level. Extension of existing flexural cracks in column
segment number two was noted for both directions of loading in the first cycle. New
flexural cracks were observed approximately 125 mm below the interface between
segments two and three, at the interface between those segments, and at a distance off
100 mm above the interface. At the footing level, the crack opening was approximately 3
mm.
96

3 cycles at 2.0% drift (Pmax= 205.8 kN and Pmin= -194.2 kN)
Continued minor spalling of concrete below the steel jacket at the critical section was
observed. Continued spalling was observed for both loading directions for the third
cycle. The depth of the neutral axis was noted to be 125-150 mm at the column base and
the column had lifted off the footing approximately 5mm on the tension side.
3 cycles at 3.0% drift (Pmax= 206.9 kN and Pmin= -191.5 kN)
Crushing of the concrete at the column compression toe was increased significantly for
this drift level. The damaged region is shown in Figure 4.60. Vertical cracks and
incipient spalling were observed at the extreme compression edge just above the steel
jacket in column segment two for both directions of loading.
3 cycles at 4.0% drift (Pmax= 192.4 kN and Pmin= -179.3 kN)
The width of the base crack was approximately 12-13 mm at this drift. Concrete spalling
below the jacket increased and minor crushing was observed at the bottom of the second
column segment, just above the top of the jacket. Spalling at the base extended from the
extreme compression fiber around the circumference to the east and west generators.
Test End
Damage to the column was concentrated primarily at the column base below the jacket
toe, where significant crushing of concrete occurred. Because of the crushed concrete in
that region, a residual crack of approximately 3 mm (as measured at the extreme fiber of
the section) existed at the footing/column interface. The crack and spalled region are
shown in Figure 4.61. Little work would be required however, to repair the damage. The
damage above the jacket could also be repaired relatively easily by removing any loose
cover concrete, and by patching the area with mortar. No inclined cracks were observed
during the test, and the flexural cracks observed along the height of the column closed
completely once the lateral force was removed at test end. It should be noted that the
crack openings remained small except at the base of the column where the column lifted
97

off the footing at the tension side, and at the top of the jacket where a crack formed
between column segment two and three. The prestressing steel did not fracture during
the test and the residual drift of the column after the test measured just over 0.3%.
98

Figure 4.59 JH2 – Test 1 Crack pattern at 1.2% drift
Figure 4.60 JH2 –Test 1 Damage below jacket at 3.0% drift
99
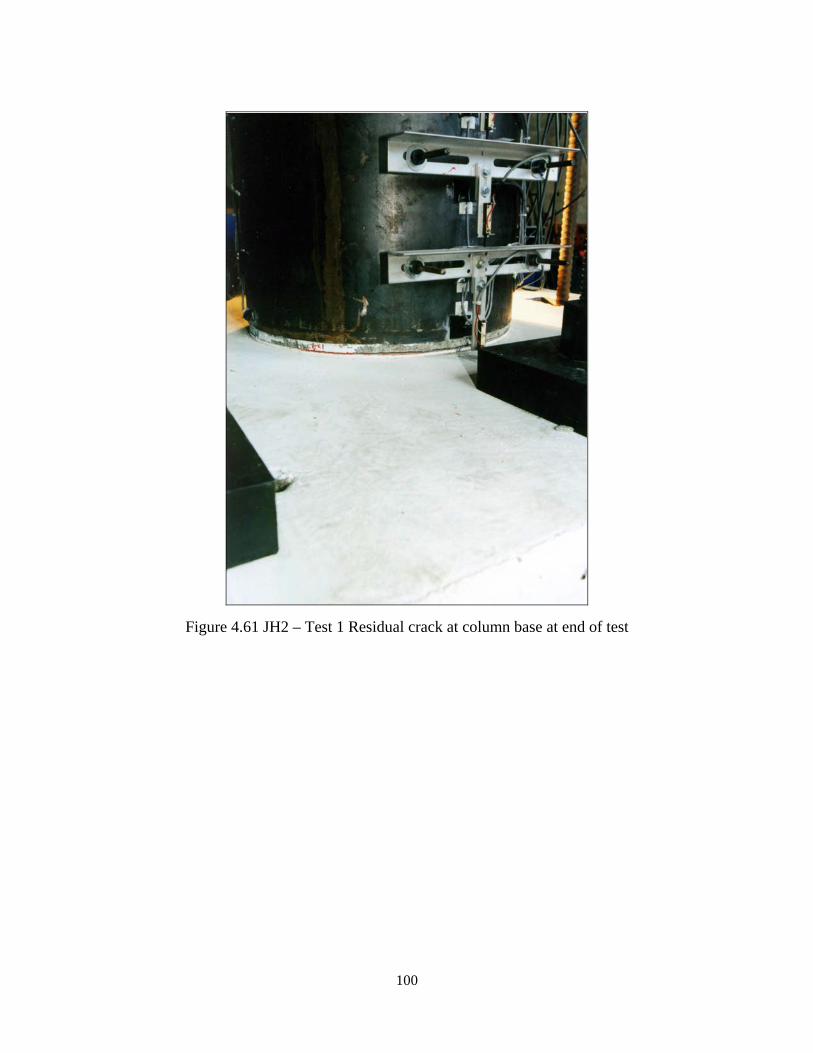
Figure 4.61 JH2 – Test 1 Residual crack at column base at end of test
100

4.7.2 Force – Displacement Response
The lateral force-displacement response of the column for the first test is shown in Figure
4.62. The specimen exhibited stable and symmetric hysteretic behavior up to the
maximum imposed drift of 4.0%. Significant non-linear response initiated at a force of
160 kN, or approximately 2.5 x P1. The maximum column strengths for the push and
pull loading directions were 206.9 kN and –194.2 kN, and occurred at drifts of 3.0% and
2.0%, respectively. Degradation of the column strength was not dramatic, with capacities
at the 4.0% drift approximately 7% lower than the maximum observed values.
-160 -120 -80 -40 0 40 80 120 160
Lateral Displacement (mm)
-250
-200
-150
-100
-50
0
50
100
150
200
250
Late
ral F
orce
(kN
)
-4 -3 -2 -1 0 1 2 3 4Drif t (%)
AnalyticalExperimentalAdjusted Analytical
Pull
Push
P
f 'c Ac = 0.229
Figure 4.62 JH2 – Test 1 Force-displacement response
101

The analytical force-displacement response envelope is also shown in Figure 4.62.
Similar to the first test of unit JH1, it is believed that the axial load transfer beam was
positioned slightly off the column axis, and consequently the observed strength in the pull
direction of loading was lower than that for the push loading direction. The analytical
curve was adjusted for this as detailed for specimen JH1 in Section 4.5.2. The predicted
initial stiffness follows the experimentally observed stiffness well. Column strength after
the initial stages is under-predicted for both loading directions. Deviation of the
predicted strength from observed is not great however, with a maximum error for the
push and pull directions of 5%.
The initial stiffness of the column is shown in Figure 4.63. After the initial elastic cycles,
the stiffness decreased almost linearly with increasing drift. At moderate drifts, the
stiffness had dropped to approximately 50% of its original value while at the maximum
imposed drift of 4.0%, the stiffness was approximately one quarter of the original. At the
maximum drift, the initial stiffness was only slightly higher the effective column
stiffness, Keff, equal to the force at maximum displacement divided by the maximum
displacement.
Similar to specimen JH1, the hysteretic energy dissipation of specimen JH2 was low.
The damping coefficient is shown as a function of drift in Figure 3.64. The damping
increased from around 4% for early stages of testing to just less than 9% at the maximum
drift. The increase in the calculated equivalent viscous damping is associated with the
increased level of crushing of concrete below the jacket and the minor spalling observed
at the bottom of the second column segment. At the maximum imposed drift, the second
cycle damping was lower than the first, and was around 7%.
102

0 1 2 3 4
Drif t (%)
2
4
6
8
10
Stif
fnes
s (kN
/mm
)
100
90
80
70
60
50
40
30
20
Perc
ent o
f O
rigin
al S
tiffn
ess (
%)
Figure 4.63 JH2 – Test 1 Initial loading stiffness versus drift
0 1 2 3
Drif t (%)4
0
2
4
6
8
10
Equi
vale
nt V
isco
us D
ampi
ng (%
)
Figure 4.64 JH2 – Test 2 Equivalent viscous damping versus drift
103

4.7.3 Test Data
Data recorded during testing for the strain gages and linear potentiometers is presented in
this section. Profiles of strains in the prestressing steel, steel jacket and the transverse
spiral reinforcement, and of curvature along the column height are shown for drifts
between 0.6% and 4.0%.
Column Curvature
Curvature along the column height is depicted in Figure 4.65. The curvatures are highest
near the column base and at 600 mm above the base for the same reasons detailed in
Section 4.5.3 for specimen JH1. The measured curvatures at each drift for specimen JH2
are lower than those observed for the first test of specimen JH1 since the axial load ratio
was higher for JH1. The maximum curvature measured at the base occurred at a drift
4.0% and was 1.75x10⁻⁴ mm-1. The corresponding concrete compressive strain is:
εc x= 6.8 mm174 mm 57 mm 75 mm-1 = 0.029− −( )( . )1 10 4
The predicted extreme fiber concrete strain is 0.021.
Prestressing Steel Strain
The increase in tendon strain as a function of drift predicted by the analytical model is
shown in Figure 4.66. The predicted strain increase is higher than the observed. At low
drifts, the error is on the order of 100%, while at high drifts the strain increase is over-
predicted by approximately 50%. The lower than predicted observed strain increase
implies larger neutral axis depths for the given drift levels. As was stated for the first test
of specimen JH1, the neutral axis depth may be under-predicted by the Mander model
since it predicts higher confined concrete compressive strengths than what may be
appropriate for high strength concrete. This would result in over-prediction of the tendon
strain increase (see Eq. 2.16).
104

-0.0002 -0.0001 0 0.0001 0.0002
Curvature (mm-1)
0
400
800
1200
1600
2000
Col
umn
Hei
ght (
mm
)
g f e d c b a a b c d e f g
a drift = 0.6%b drift = 0.9%c drift = 1.2%d drift = 1.6%e drift = 2.2%f drift = 3.0%g drift = 4.0%
Pull Push
Figure 4.65 JH2 – Test 1 Curvature along column height
-4 -2 0 2 4
Drif t (%)
0
400
800
1200
Stra
in In
crea
se (m
icro
stra
in)
PredictedExperimental
Figure 4.66 JH2 – Test 1 Predicted and experimental tendon strain increase
105

Steel Jacket Strain
Hoop strains in the steel jacket at the north and south generators are shown in Figures
4.67 and 4.68, respectively. Note that the strain gage mounted near the top of the jacket
at the north generator did not function during the test. The hoop strain at the jacket toe
was approximately equal to the yield strain for a drift of 2.0%. At 3.0% drift, the hoop
strain near the base was several times yield, while at 4.0% drift the jacket was strained to
approximately 10 times the yield strain of the material. The large jacket hoop strains near
the base are due to the large concrete compression strains and associated dilation of the
concrete at the compression toe of the column. Yielding occurred as high as mid-height
of the segment at 4.0% drift.
Figures 4.69 and 4.70 illustrate hoop strain profiles for the east and west generators. At
the west generator, the gage mounted at mid-height of the jacket did not function during
testing and was not used to construct the strain profiles. The maximum hoop strain
occurred near the base for the east generator and was approximately 1800 µε. The strains
increase down the jacket height due to the confining effect of the jacket on the core
concrete at the compression generators. At the west generator, the maximum hoop strain
was observed at the gage located 140 mm above the bottom of the jacket and was
approximately 2600 µε.
The vertical strain profiles for the north and south sides of the jacket are displayed in
Figures 4.71 and 4.72, respectively. The vertical strains are relatively small except for
drifts of 3.0% and 4.0%. Strain profiles are shown for all three cycles at the 4.0% drift
level. The vertical strains at mid-height of the north side of the jacket continued to
increase significantly for each cycle at 4.0%. The high strains mark the beginning local
buckling of the jacket: during the second test of specimen JH2 (results given later in this
chapter), a significant bulge in the jacket at mid-height of the column was observed at a
drift of 3.0%. Large vertical compressive strains also occurred at the south generator
near the base of the jacket.
106

Transverse Spiral Strain
The hoop strain profiles for the transverse spiral are shown in Figures 4.73 – 4.76. The
strains at the north and south generators increase down the height of the column since the
tendency for concrete dilation increases down the column height with increasing moment.
The maximum strain occurred at the south generator near the base of the second column
segment at 4.0% drift and was 950 µε. The observed strains were well below the
material yield strain of 2200 µε. Shear induced strains in the spiral reinforcement
measured at the east and west generators were small for all drifts.
107

0 4000 8000 12000 16000 20000
Strain (microstrain)
0
200
400
600
Hei
ght o
n Ja
cket
(mm
)0 4000 8000 12000 16000 20000
Strain (microstrain)
0
100
200
300
400
500
Hei
ght o
n Ja
cket
(mm
)
PUSH DIRECTION PULL DIRECTION0.6%0.9%1.2%1.6%2.2%3.0%4.0%
0.6%0.9%1.2%1.6%2.2%3.0%4.0%
Figure 4.67 JH2 – Test 1 Jacket hoop strain at north generator
0 4000 8000 12000 16000
Strain (microstrain)
0
200
400
600
Hei
ght o
n Ja
cket
(mm
)
0 2000 4000 6000 8000
Strain (microstrain)
0
200
400
600
Hei
ght o
n Ja
cket
(mm
)
PUSH DIRECTION PULL DIRECTION0.6%0.9%1.2%1.6%2.2%3.0%4.0%
0.6%0.9%1.2%1.6%2.2%3.0%4.0%
Figure 4.68 JH2 – Test 1 Jacket hoop strain at south generator
108

0 400 800 1200 1600 2000
Strain (microstrain)
0
200
400
600
Hei
ght o
n Ja
cket
(mm
)0 400 800 1200 1600 2000
Strain (microstrain)
0
200
400
600
Hei
ght o
n Ja
cket
(mm
)
PUSH DIRECTION PULL DIRECTION0.6%0.9%1.2%1.6%2.2%3.0%4.0%
0.6%0.9%1.2%1.6%2.2%3.0%4.0%
Figure 4.69 JH2 – Test 1 Jacket hoop strain at east generator
0 1000 2000 3000 4000
Strain (microstrain)
0
200
400
600
Hei
ght o
n Ja
cket
(mm
)
-1000 0 1000 2000 3000
Strain (microstrain)
0
200
400
600
Hei
ght o
n Ja
cket
(mm
)
PUSH DIRECTION PULL DIRECTION0.6%0.9%1.2%1.6%2.2%3.0%4.0%
0.6%0.9%1.2%1.6%2.2%3.0%4.0%
Figure 4.70 JH2 – Test 1 Jacket hoop strain at west generator
109

-10000 -8000 -6000 -4000 -2000 0
Strain (microstrain)
0
200
400
600
Hei
ght o
n Ja
cket
(mm
)
-8000 -4000 0
Strain (microstrain)
0
200
400
600
Hei
ght o
n Ja
cket
(mm
)
PUSH DIRECTION PULL DIRECTION0.6%0.9%1.2%1.6%2.2%3.0%4%x14.0%x24.0%x3
0.6%0.9%1.2%1.6%2.2%3.0%4.0%x14.0%x24.0%x3
Figure 4.71 JH2 – Test 1 Jacket vertical strain at north generator
-8000 -4000 0
Strain (microstrain)
0
200
400
600
Hei
ght o
n Ja
cket
(mm
)
-8000 -4000 0
Strain (microstrain)
0
200
400
600
Hei
ght o
n Ja
cket
(mm
)
PUSH DIRECTION PULL DIRECTION0.6%0.9%1.2%1.6%2.2%3.0%4%x14.0%x24.0%x3
0.6%0.9%1.2%1.6%2.2%3.0%4.0%x14.0%x24.0%x3
Figure 4.72 JH2 – Test 1 Jacket vertical strain at south generator
110

-800 -400 0 400
Strain (microstrain)
400
800
1200
1600
2000
2400
Hei
ght A
bove
Foo
ting
(mm
)-800 -400 0 400 800
Strain (microstrain)
400
800
1200
1600
2000
2400
Hei
ght A
bove
Foo
ting
(mm
)
PUSH DIRECTION PULL DIRECTION
0.6%0.9%1.2%1.6%2.2%3.0%4.0%
0.6%0.9%1.2%1.6%2.2%3.0%4.0%
Figure 4.73 JH2 – Test 1 Spiral strain at north generator
0 200 400 600 800 1000
Strain (microstrain)
600
800
1000
1200
1400
1600
Hei
ght A
bove
Foo
ting
(mm
)
-100 0 100 200 300
Strain (microstrain)
600
800
1000
1200
1400
1600
Hei
ght A
bove
Foo
ting
(mm
)
PUSH DIRECTION PULL DIRECTION0.6%0.9%1.2%1.6%2.2%3.0%4.0%
0.6%0.9%1.2%1.6%2.2%3.0%4.0%
Figure 4.74 JH2 – Test 1 Spiral strain at south generator
111

-160 -120 -80 -40 0 40 80
Strain (microstrain)
400
800
1200
1600
2000
2400
Hei
ght A
bove
Foo
ting
(mm
)-160 -120 -80 -40 0 40 80
Strain (microstrain)
400
800
1200
1600
2000
2400
Hei
ght A
bove
Foo
ting
(mm
)
PUSH DIRECTION PULL DIRECTION
0.6%0.9%1.2%1.6%2.2%3.0%4.0%
0.6%0.9%1.2%1.6%2.2%3.0%4.0%
Figure 4.75 JH2 – Test 1 Spiral strain at east generator
-200 0 200 400 600
Strain (microstrain)
600
800
1000
1200
1400
Hei
ght A
bove
Foo
ting
(mm
)
-200 0 200 400 600
Strain (microstrain)
600
800
1000
1200
1400
Hei
ght A
bove
Foo
ting
(mm
)
PUSH DIRECTION PULL DIRECTION0.6%0.9%1.2%1.6%2.2%3.0%4.0%
0.6%0.9%1.2%1.6%2.2%3.0%4.0%
Figure 4.76 JH2 – Test 1 Spiral strain at west generator
112

4.8 Experimental Results – Specimen JH2-T2
4.8.1 Observations under Repeated Cyclic Loading
A description of the behavior of specimen JH2 during the second test is given along with
some supporting photographic illustrations. The planned loading sequence called for one
cycle each to be performed in force control at one-half, one, and one-and-a-half times the
theoretical force to cause decompression at the critical section (P1). After switching to
displacement control, three cycles were to then be performed at twice the decompression
force. The displacement predicted for the next target level of 2 x P1 was reached before
the force of 1.5 x P1. Thus, the test was switched to displacement control of the actuator
after the first cycle at the given displacement.
±0.5 P1 (Pmax= 37.5 kN and Pmin= -38.3 kN)
No cracking was observed.
±P1 (Pmax= 75.4 kN and Pmin= -76.1 kN)
Flexural cracking was observed at the base of the column, where the depth to the neutral
axis from the extreme compression fiber was around 450 mm.
3 cycles at 0.45% (Pmax= 101.6 kN and Pmin= -93.7 kN)
The neutral axis depth at the base of the column was approximately 400 mm from the
compression edge. The width of the base crack was around 1 mm.
3 cycles at 0.6% drift (Pmax= 122.5 kN and Pmin= -111.4 kN)
The neutral axis depth decreased to 360 mm. No new cracks were noted.
3 cycles at 0.9% drift (Pmax= 154.2 kN and Pmin= -137.6 kN)
The crack at the base of the column extended to approximately mid-depth of the section
and the width increased to 2 mm. Cracking in the second column segment at locations of
113

previous cracks (from the first test) was observed. The cracks were visible at the gaps
between the fiberglass bands.
3 cycles at 1.2% drift (Pmax= 173.3 kN and Pmin= -154.9 kN)
Continued flexural cracking in the second column segment was observed. Some new
cracks were observed at the gaps between the fiberglass bands.
3 cycles at 1.6% drift (Pmax= 188.2 kN and Pmin= -172.7 kN)
The distance to the neutral axis from the compression edge at the column base was
around 250 mm. The width of the base crack increased to 4 mm. Minor extension of
existing cracks was observed.
3 cycles at 2.2% drift (Pmax= 195.4 kN and Pmin= -189.0 kN)
The neutral axis depth decreased to approximately 225 mm and the base crack width, as
measured at the extreme tension fiber, increased to 6 mm. Cracking was observed at
several of the crack locations from the first test.
3 cycles at 3.0% drift (Pmax= 189.8 kN and Pmin= -190.8 kN)
The base crack widened to around 11 mm and the neutral axis depth decreased to just
under 200 mm. A significant “bulge” in the steel jacket was observed at the north side of
the column at a height of about 300 mm above the footing. It appeared as if the jacket
had buckled outward from the core concrete. The buckled area was approximately 125
mm in height. The epoxy at the compression toe below the jacket appeared to be in good
condition with no deformation or crushing observed.
3 cycles at 4.0% drift (Pmax= 177.4 kN and Pmin= -185.4 kN)
The bulge at the north generator was more significant for the first push loading. The
bottom of the jacket was also noticeably “belled” due to the large hoop straining caused
by dilation of the core concrete at the compression toe. Lift-off of the column base from
the footing at the extreme tension edge was about 19 mm at this drift level. The gap
114

between the bottom of the jacket and top of the footing decreased slightly to around
22mm due to jacket slippage and rotation of the segment (the gap prior to testing was 28
mm).
3 cycles at 5.0% drift (Pmax= 164.5 kN and Pmin= -174.1 kN)
The crack at the footing level increased to 25 mm, as measured at the extreme tension
edge. Horizontal translation of the column base with respect to the footing in the amount
of 5 – 6 mm was noted at this drift. The translation was towards the north, or in the
direction of the column shear for the push direction. The gap width between the jacket
toe and footing decreased to approximately 18 mm
Test End
A photo of steel jacket at the north generator taken after testing is shown in Figure 4.77.
A bulge at mid-height of the jacket is visible. The lower half of the jacket is noticeably
‘belled’ due to the severe hoop straining at the critical section. The residual drift of the
column at the end of the test was on the order of 0.7%. Part of this was due to the
translation of the column base with respect to the footing noted above. As was the case
for the first test, significant damage was observed below the jacket due to the high
longitudinal compressive strains at the compression toe of the column. No damage was
observed in the column segments above the steel jacket other than the minor flexural
cracks detailed above. No inclination of cracks was observed, and all cracks – except for
the crack at the base of the column – closed completely once the lateral force was
removed from the column. A residual crack at the column base existed at each loading
generator due to the deformed epoxy and crushed concrete. As noted, significant
deformation of the steel jacket was observed for cycles at high drift levels. The
prestressing steel did not fracture during testing.
115

Figure 4.77 JH2 – Test 2 Bulge in steel jacket at north generator after testing
116

4.8.2 Force – Displacement Response
The second test lateral force-displacement response of specimen JH2 is shown in Figure
4.78. Stable hysteretic response was observed during the test, up to the maximum
imposed drift of 5.0%. Approximately equal strengths were achieved for the two loading
directions. Significant non-linear response initiated at around 170 kN. This force level
corresponds to approximately 2.4 x P1. The maximum column strengths were 195.4 kN
and –190.8 kN for the push and pull directions, respectively. The maximum strength for
the push direction occurred at a drift of 2.2%, while that for the pull direction was
observed at 3.0% drift. At a drift of 5.0%, the column strength had decreased to 16% and
8 % of the maximum achieved strength for the push and pull directions, respectively.
-200 -160 -120 -80 -40 0 40 80 120 160 200
Lateral Displacement (mm)
-250
-200
-150
-100
-50
0
50
100
150
200
250
Late
ral F
orce
(kN
)
-5 -4 -3 -2 -1 0 1 2 3 4 5Drif t (%)
AnalyticalExperimental
Pull
Push
indicates f ailure basedon reaching εcu
P
f 'c Ac = 0.221
Figure 4.78 JH2 – Test 2 Force-displacement response
117

The predicted force-displacement response envelope based on the analytical model is
shown in Figure 4.78 along with the experimental hysteresis curve. Both the initial
stiffness and column strength are over-predicted. The error in the analytical curve is
approximately 6% at 2.2% drift, and increases to 16% and the maximum imposed drift of
5.0%. This may be because the column was subjected to relatively high drifts during the
first test, with the effect of causing significant damage to the core concrete within the
steel jacket. Since the concrete was encased by the jacket and thus concealed, it was not
possible to determine the extent of the damage or repair it prior to the second test. The
repair measures taken may not have been sufficient to restore the structural integrity of
the column. In addition, the possible over-estimation of concrete strength and ductility
by the Mander model for the high strength concrete may contribute to the error.
Considering the above, the difference between the observed and predicted column
strength is reasonable. The predicted failure of the test unit is also shown on the
analytical curve. As was noted for unit JH1, the value of ultimate concrete strain given
by Eq. 2.29 is typically conservative by 50%. It is thus expected that the unit posses
significant displacement capacity after the predicted failure point.
The initial loading stiffness of the specimen for both the first and second test is shown as
a function of the imposed drift level in Figure 4.79. It can be seen that the stiffness was
restored to 65% of the original value observed for test 1 after repairing the damage above
and below the jacket and restressing to the higher force level. The degree of stiffness
degradation from one drift level to the next for the second test was similar to that
observed for the first. At the maximum drift of 5.0%, the loading stiffness was only 10%
of the original stiffness observed at the decompression force during the first test.
Considering the hysteretic response in Figure 4.78, it is seen that the initial loading
stiffness of the column for high drift levels was equal to the effective column stiffness,
Keff, at maximum drift. Thus, the response was no longer bilinear elastic, but rather
linear with stiffness equal to the effective stiffness.
118

Figure 4.80 shows the equivalent hysteretic damping calculated for both the first and
second tests. As was observed for the first test, the damping increased with increasing
drift. On average, the hysteretic damping was higher for the first test than the second
was. The slight difference may be due to the extra energy dissipated during the first test
by crushing of the concrete below the jacket toe and the spalling of the cover concrete at
the base of the second column segment. The difference between the tests is rather small
however, and an average of the two curves could be taken to represent the damping
versus drift relationship.
4.8.3 Test Data
Column Curvature
The curvature distribution along the height of the column for the second test of specimen
JH2 is shown in Figure 4.81. The curvatures shown are higher than those observed for
the first test because of the higher total vertical force acting at the critical section. The
largest curvatures occurred at the base of the column and at the interface between the
jacketed segment and second column segment. The measured curvatures within the
height of the jacket were small, as were those observed above the bottom of the second
column segment. The maximum curvature at the column base was observed at a drift of
5.0% and was 2.7x10⁻⁴ mm-1 for the push direction and 2.5x10⁻⁴ mm-1 for the pull
direction of loading. The associated concrete longitudinal compression strain is:
εc x= 12.4 mm173 mm 60 mm 7 mm-1 = 0.057− −( )( . )2 10 4
The values used in the above calculation were observed for the push direction of loading.
A calculation for the pull direction of loading gave an extreme concrete strain at of 0.049.
The predicted strain from the moment-curvature analysis is 0.03, somewhat lower than
the experimental values given above.
119

0 2 4 6
Drif t (%)
0
2
4
6
8
10
Stif
fnes
s (kN
/mm
)
100
90
80
70
60
50
40
30
20
10
0
Perc
ent o
f O
rigin
al S
tiffn
ess (
%)
Test 1Test 2
Figure 4.79 JH2 – Test 2 Initial loading stiffness versus drift
`0 1 2 3 4 5
Drif t (%)
0
2
4
6
8
10
Equi
vale
nt V
isco
us D
ampi
ng (%
)
Test 1Test 2
Figure 4.80 JH2 – Test 2 Equivalent viscous damping
120

-0.0003 -0.0002 -0.0001 0 0.0001 0.0002 0.0003
Curvature (mm-1)
0
400
800
1200
1600
2000
Col
umn
Hei
ght (
mm
)
h g f e d c b a a b c d e f g h
a drift = 0.6%b drift = 0.9%c drift = 1.2%d drift = 1.6%e drift = 2.2%f drift = 3.0%g drift = 4.0%h drift = 5.0%
Pull Push
Figure 4.81 JH2 – Test 2 Curvature along column height
Prestressing Steel Strain
The predicted prestressing steel strain increase is shown in Figure 4.82 along with the
experimental results. As can be seen, the strain increase was over-predicted by a
substantial amount. This implies that the neutral axis depth from the compression edge
was under-predicted. This is explained by the same reasoning given in Section 4.5.3 for
specimen JH1. In addition, if the core concrete within the steel jacket was damaged
significantly during the first test, the epoxy grouting of the base crack probably did not
restore the concrete to its original undamaged condition. If the strength and integrity of
the core concrete was not good for the second test, the analytical model cannot be
expected to predict with much accuracy the increase of tendon strain.
Steel Jacket Strain
Hoop strains at the north and south generator are shown in Figures 4.83 and 4.84,
respectively. Hoop straining at the jacket toe was extreme due to the dilation of the
121

concrete at the compression toe caused by high longitudinal compression strains. At the
north generator, the maximum strains occurred at approximately mid-height of the jacket.
However, the readings from the gage at mid-height are believed to be inaccurate due to
gage instability. It can be seen that the gage mounted near the bottom of the jacket at the
south generator showed little variation in strain and indicated strains lower those at the
north generator. Strains at the east and west generators are shown in Figures 4.85 and
4.86, respectively. The maximum hoop strains occurred at the jacket toe for both the east
and west sides. The reason for the compressive strains indicated at jacket mid-height at
the east generator is not known. The strains near the bottom of the jacket are
significantly higher at the west generator, with a maximum strain of approximately
16,000 µε. It is difficult to explain the complex patterns of strain shown for the north,
south, east and west locations. When gages on opposite sides of the jacket show
significantly different readings, it is difficult to know which gage better represents the
actual physical behavior. From the strain profiles shown, it can be said however that very
high strains were induced in the jacket at high drifts.
The vertical strain distributions along the height of the jacket at the north and south sides
of the column are shown in Figures 4.87 and 4.88. At the north generator, high
compression strains occurred at mid-height of the jacket. This location coincides with the
area where outward buckling of the jacket was observed. High compression strains can
also be seen at mid-height at the south generator. The vertical strains caused by bending
of the segment increase significantly at higher drifts since transfer of stresses from the
core concrete to the jacket is enhanced by concrete dilation at the compression toe.
Transverse Spiral Strains
Strain profiles for the spiral reinforcement are displayed in Figures 4.89 – 4.92. The
strains at the north, south, east and west generators are small in general. A trend of
increasing strain down the height of the column can be seen for the north and south sides.
This is due to the increasing effect of the confinement action of the spiral on the core
concrete down the column height. The maximum hoop strains occurred near the base of
122

the second column segment and were on the order of 300 – 500 µε. Shear strains at the
east and west sides of the column were negligible.
Fiberglass Jacket Strain
Fiberglass jacket hoop strain profiles are shown in Figures 4.93 and 4.94 for the north
and south sides of the column, respectively. At the north generator, the strains are higher
for the push direction while at the south generator, they are higher for the pull direction.
At the north side, the maximum hoop strain occurred just above the top of the steel jacket
and was approximately 850 µε. The maximum strain for the south generator was
approximately 550µε. Hoop strains in the fiberglass jacket indicate that the jacket was
“activated” by dilation of concrete in segment two and that it was providing confinement
to the concrete.
-4 -2 0 2 4
Drif t (%)
0
400
800
1200
Stra
in In
crea
se (m
icro
stra
in)
PredictedExperimental
Figure 4.82 JH2 – Test 2 Predicted and experimental tendon strain increase
123

0 5000 10000 15000 20000 25000
Strain (microstrain)
0
100
200
300
400
500
Hei
ght o
n Ja
cket
(mm
)0 5000 10000 15000 20000 25000
Strain (microstrain)
0
100
200
300
400
500
Hei
ght o
n Ja
cket
(mm
)
PUSH DIRECTION PULL DIRECTION
0.6%0.9%1.2%1.6%2.2%3.0%4.0%5.0%
0.6%0.9%1.2%1.6%2.2%3.0%4.0%5.0%
Figure 4.83 JH2 – Test 2 Jacket hoop strain at north generator
0 4000 8000 12000 16000
Strain (microstrain)
0
200
400
600
Hei
ght o
n Ja
cket
(mm
)
0 4000 8000 12000 16000
Strain (microstrain)
0
200
400
600
Hei
ght o
n Ja
cket
(mm
)
PUSH DIRECTION PULL DIRECTION
0.6%0.9%1.2%1.6%2.2%3.0%4.0%5.0%
0.6%0.9%1.2%1.6%2.2%3.0%4.0%5.0%
Figure 4.84 JH2 – Test 2 Jacket spiral strain at south generator
124

-1000 -500 0 500 1000 1500
Strain (microstrain)
0
200
400
600
Hei
ght o
n Ja
cket
(mm
)-1000 -500 0 500 1000 1500
Strain (microstrain)
0
200
400
600
Hei
ght o
n Ja
cket
(mm
)
PUSH DIRECTION PULL DIRECTION0.6%0.9%1.2%1.6%2.2%3.0%4.0%5.0%
0.6%0.9%1.2%1.6%2.2%3.0%4.0%5.0%
Figure 4.85 JH2 – Test 2 Jacket hoop strain at east generator
0 4000 8000 12000 16000
Strain (microstrain)
0
200
400
600
Hei
ght o
n Ja
cket
(mm
)
0 4000 8000 12000 16000
Strain (microstrain)
0
200
400
600
Hei
ght o
n Ja
cket
(mm
)
PUSH DIRECTION PULL DIRECTION
0.6%0.9%1.2%1.6%2.2%3.0%4.0%5.0%
0.6%0.9%1.2%1.6%2.2%3.0%4.0%5.0%
Figure 4.86 JH2 – Test 2 Jacket hoop strain at west generator
125

-16000 -12000 -8000 -4000 0
Strain (microstrain)
0
200
400
600
Hei
ght o
n Ja
cket
(mm
)-20000 -16000 -12000 -8000 -4000 0
Strain (microstrain)
0
200
400
600
Hei
ght o
n Ja
cket
(mm
)
PUSH DIRECTION PULL DIRECTION0.6%0.9%1.2%1.6%2.2%3.0%4.0%5.0%
0.6%0.9%1.2%1.6%2.2%3.0%4.0%5.0%
Figure 4.87 JH2 – Test 2 Jacket vertical strain at north generator
-10000 -8000 -6000 -4000 -2000 0
Strain (microstrain)
0
200
400
600
Hei
ght o
n Ja
cket
(mm
)
-6000 -4000 -2000 0 2000
Strain (microstrain)
0
200
400
600
Hei
ght o
n Ja
cket
(mm
)
PUSH DIRECTION PULL DIRECTION0.6%0.9%1.2%1.6%2.2%3.0%4.0%5.0%
0.6%0.9%1.2%1.6%2.2%3.0%4.0%5.0%
Figure 4.88 JH2 – Test 2 Jacket vertical strain at south generator
126

-100 0 100 200
Strain (microstrain)
400
800
1200
1600
2000
2400
Hei
ght A
bove
Foo
ting
(mm
)0 100 200 300 400
Strain (microstrain)
400
800
1200
1600
2000
2400
Hei
ght A
bove
Foo
ting
(mm
)
PUSH DIRECTION PULL DIRECTION0.6%0.9%1.2%1.6%2.2%3.0%4.0%5.0%
0.6%0.9%1.2%1.6%2.2%3.0%4.0%5.0%
Figure 4.89 JH2 – Test 2 Spiral strain at north generator
0 200 400 600 800 1000
Strain (microstrain)
600
800
1000
1200
1400
1600
Hei
ght A
bove
Foo
ting
(mm
)
-400 0 400 800
Strain (microstrain)
600
800
1000
1200
1400
1600
Hei
ght A
bove
Foo
ting
(mm
)
PUSH DIRECTION
PULL DIRECTION
0.6%0.9%1.2%1.6%2.2%3.0%4.0%5.0%
0.6%0.9%1.2%1.6%2.2%3.0%4.0%5.0%
Figure 4.90 JH2 – Test 2 Spiral strain at south generator
127

-120 -80 -40 0 40
Strain (microstrain)
400
800
1200
1600
2000
2400
Hei
ght A
bove
Foo
ting
(mm
)-160 -120 -80 -40 0 40 80
Strain (microstrain)
400
800
1200
1600
2000
2400
Hei
ght A
bove
Foo
ting
(mm
)
PUSH DIRECTION PULL DIRECTION
0.6%0.9%1.2%1.6%2.2%3.0%4.0%5.0%
0.6%0.9%1.2%1.6%2.2%3.0%4.0%5.0%
Figure 4.91 JH2 – Test 2 Spiral strain at east generator
-160 -120 -80 -40 0 40
Strain (microstrain)
600
800
1000
1200
1400
Hei
ght A
bove
Foo
ting
(mm
)
-80 -40 0 40
Strain (microstrain)
600
800
1000
1200
1400
Hei
ght A
bove
Foo
ting
(mm
)
PUSH DIRECTION PULL DIRECTION
0.6%0.9%1.2%1.6%2.2%3.0%4.0%5.0%
0.6%0.9%1.2%1.6%2.2%3.0%4.0%5.0%
Figure 4.92 JH2 – Test 2 Spiral strain at west generator
128

-100 0 100 200 300
Strain (microstrain)
600
700
800
900
1000
Hei
ght A
bove
Foo
ting
(mm
)0 200 400 600 800 1000
Strain (microstrain)
600
700
800
900
1000
Hei
ght A
bove
Foo
ting
(mm
)
PUSH DIRECTION PULL DIRECTION
0.6%0.9%1.2%1.6%2.2%3.0%4.0%5.0%
0.6%0.9%1.2%1.6%2.2%3.0%4.0%5.0%
Figure 4.93 JH2 – Test 2 Fiberglass jacket hoop strain at north generator
-400 0 400 800
Strain (microstrain)
600
700
800
900
1000
Hei
ght A
bove
Foo
ting
(mm
)
-400 0 400 800
Strain (microstrain)
600
700
800
900
1000
Hei
ght A
bove
Foo
ting
(mm
)
PUSH DIRECTION PULL DIRECTION
0.6%0.9%1.2%1.6%2.2%3.0%4.0%5.0%
0.6%0.9%1.2%1.6%2.2%3.0%4.0%5.0%
Figure 4.94 JH2 – Test 2 Fiberglass jacket strain at south generator
129

4.9 Discussion of Results
The seismic design and experimental testing of two high aspect ratio precast segmental
bridge columns were presented in this chapter. The prestressing steel was unbonded to
the concrete along the full height of the column. Each unit was tested once, with a given
total prestress force in the tendon. After the first test, both test units were repaired by
epoxy grouting the base crack, reinstating spalled cover concrete, and by wrapping the
region above the steel jacket in a fiberglass jacket. The units were then restressed to a
higher tendon force level and tested a second time. Column JH1 used a jacket thickness
approximately twice that used in specimen JH2. A comparison of the performance for
the first and second test of each unit is given in this section. A comparison between the
performance of the units is also given.
The force-displacement response for the first and second test of unit JH1 are shown in
Figure 4.95. While the total prestress force for the second test was approximately 22%
higher than that for the first test, the maximum observed strength was only about 14%
higher than the strength for the first test. It should be noted that despite the higher
prestress force, the axial load ratio was actually lower for the second test since the
concrete continued to gain strength during the time between the first and second tests.
The experimental response for the two tests of unit JH2 are shown in Figure 4.96. The
prestress force for the second test was about 21% higher than that for the first test, but the
maximum observed second test strength was actually 5% less than that for the first. It is
believed that the damage to the core concrete within the steel jacket was significant for
the first test and thus adversely affected the second test performance of JH2.
Confinement of the core concrete by the steel jacket near the column base may have been
compromised for the second test due to the large inelastic hoop straining of the jacket
observed for the first test.
130

-240 -200 -160 -120 -80 -40 0 40 80 120 160 200 240
Lateral Displacement (mm)
-200
-100
0
100
200
Late
ral F
orce
(kN
)
JH1 - Test 1JH1 - Test 2
-6 -5 -4 -3 -2 -1 0 1 2 3 4 5 6Drif t (%)
Axial Load Ratio:JH1-T1 = 0.276JH1-T2 = 0.272
Figure 4.95 JH1 - Test 1 and 2 force-displacement response comparison
-200 -150 -100 -50 0 50 100 150 200
Lateral Displacement (mm)
-200
-100
0
100
200
Late
ral F
orce
(kN
)
JH2 - Test 1JH2 - Test 2
-5 -4 -3 -2 -1 0 1 2 3 4 5Drif t (%)
Axial Load Ratio:JH2-T1 = 0.229JH2-T2 = 0.221
Figure 4.96 JH2 Test 1 and 2 force-displacement response comparison
131

A comparison between the performance of JH1 and JH2 for the first and second tests is
given in Figures 4.97 and 4.98, respectively. It can be seen that for the first test, the
force-displacement response of each unit is similar. The column strengths matched
almost exactly up to approximately 2% drift. At 3.0% drift, the strength of JH1 was only
slightly higher than that of JH2. This indicates that for moderate drift levels, variations in
the prestress force and jacket thickness do not appreciably affect the strength and
ductility of the column. It can be seen however that the strength of unit JH2 began to
degrade after the 3.0% drift level. The strength of unit JH1 on the other hand was still
increasing at 3.0% drift. For the higher axial load level of the second test, degradation of
column strength for JH2 initiated at approximately 2.2% drift, while little drop in
capacity was observed for specimen JH1 at the maximum imposed drift of 6.0%. Thus, it
may be concluded that the level of confinement provided by the thinner jacket will result
in good performance up to drifts of around 3% for axial load ratios around 0.2-0.25. For
higher axial load ratios and drift levels, the higher level of confinement provided by the
thicker jacket is more appropriate.
In general, the analytical model presented herein correlated reasonably well with the
experimentally observed behavior of the columns for each test. In some cases, the
predicted strength was higher than the actual column strength. The reasons for
discrepancies between analytical and experimental response were explained previously,
but are given here again. First, the value for the initial prestress force in each column
prior to each test was determined by analyzing data recorded the post-tensioning
operation. The prestress force values are however only “best estimates”, and there does
exist a degree of uncertainty regarding the true or exact prestress force induced in each
column for each test. It is believed that errors in the prestress force for a given column
and test were at a maximum, 15%. Since additional axial load was applied to model
column dead load, the error in the total vertical force acting at the critical section is less
than 15%. The small differences in strength could thus be due to small errors in the total
vertical force acting on the section.
132

Another source of error in the analytical response could be the use of the Mander Model
for confined concrete. As was detailed in Chapter 2, the model may overestimate both
the confined concrete strength and ductility of high strength concrete. If this is the case,
then predicted column strengths would tend to be higher than actual and the predicted
post-elastic stiffness might exhibit a more gradual decrease in strength at high drift levels.
Comment is due regarding the spalling of cover concrete observed at the base of the
second column segment during the first test of each specimen. Design of the columns
was based on the premise of limiting the damage level to a low amount at design drift
levels. Spalling of concrete in the non-jacketed segments was to be avoided. The
unexpected spalling observed during testing may be due to the use of the Mander model
for confined concrete in the sectional analysis of the non-jacketed segment. Since the
model may over-predict concrete strength and ductility for high strength concrete, the
calculated moment at first crushing could have been over-estimated. To obtain a better
estimate of the section moment capacity at incipient spalling, a stress-strain model
developed for high strength concrete should be used in the moment-curvature analysis.
Alternatively, the Mander model could be used, but with extra conservatism.
It can be said that the both test units performed well overall. For unit JH1, capacity
degradation under increasing cyclic displacements was minimal for both tests, while unit
JH2 exhibited some strength degradation at drifts of 4.0% and 5.0% during the second
test. Residual drift of the columns was low: for JH1, the residual drift at the end of the
second test was approximately 0.2% while that for JH2 was 0.7%. Overall, damage to
the columns was low after testing. The spalling of cover concrete above the jacketed
segment could have been avoided by extending the steel jacket further up the column
height. Test unit JH2 incurred more damage than JH1 due to the thinner jacket and hence
lower confinement at the column base. The degree of concrete degradation at the
compression toe and the strain levels in the steel jacket were higher for unit JH2.
133

-160 -120 -80 -40 0 40 80 120 160
Lateral Displacement (mm)
-200
-100
0
100
200
Late
ral F
orce
(kN
)
JH1 - Test1JH2 - Test 1
-4 -3 -2 -1 0 1 2 3 4Drif t (%)
Axial Load Ratio:JH1 = 0.276JH2 = 0.229
Figure 4.97 JH1 and JH2 Test 1 force-displacement response comparison
-250 -200 -150 -100 -50 0 50 100 150 200 250
Lateral Displacement (mm)
-200
-100
0
100
200
Late
ral F
orce
(kN
)
JH1 - Test 2JH2 - Test 2
-6 -5 -4 -3 -2 -1 0 1 2 3 4 5 6Drif t (%)
Axial Load Ratio:JH1 = 0.272 JH2 = 0.221
Figure 4.98 JH1 and JH2 Test 2 force-displacement response comparison
134

CHAPTER 5 LOW ASPECT RATIO COLUMNS
5.1 Design of Columns
Specimens JH3 and JH4 were one-half the height of JH1 and JH2 and had an aspect ratio
H/D of three. Each specimen was built using segmental construction and consisted of a
precast footing and load stub and two precast 610 mm diameter cylindrical column
segments. The overall geometry and reinforcement details of each specimen are shown
in Figure 5.1. Selection of the jacket height, jacket material thickness, and initial
prestress force was based on studies mentioned previously and on the observed
performance of the higher aspect ratio columns tested earlier in the research program and
reported in Chapter 4.
The main longitudinal reinforcement in each column consisted of a single unbonded
tendon comprised of (27) 12.7 mm diameter ASTM A779 Grade 270 low-relaxation
steel prestressing strands with a total cross-sectional area of 2665 mm2. The upper
column segment also contained eight Grade 60 #4 longitudinal bars spaced evenly around
the perimeter of the section, with a cover of 25.4 mm. The lower segment of each
column was encased in an ASTM A569, A36 steel shell with a wall thickness of 2.8 mm
and 6.0 mm for test units JH3 and JH4 respectively. The steel jacket did not extend the
full height of the lower segment, but rather terminated approximately 21 mm above the
bottom surface. The upper column segment in both specimens was reinforced
transversely with Grade 60 #3 (10mm) bar spiral spaced at 150 mm with a cover of
approximately 12 mm. A target initial stress in the tendon of 40% and 60% of the
ultimate stress was chosen for the first and second test of each specimen, respectively.
5.2 Construction Procedure
Existing precast footings and load stubs from the first phase of the experimental testing
program were used in the construction of test specimens JH3 and JH4. The tendon and
anchor head from previous tests were removed from each footing by sliding both out an
135

access hole located at the underside of the footing. The new tendon and anchor head
were installed by the reverse process. This process is depicted in Figure 5.2. The access
hole on the underside of each footing was filled with Hydrostone so that the tendon and
anchor assembly would not move once the footings were placed in the upright position.
After each footing was positioned, Hydrostone was placed under it to provide a level,
uniform bearing surface.
The upper and lower column segments were precast individually. The reinforcing cages
for the upper segments were tied and positioned on the casting beds along with the steel
jackets for the lower segments. Lengths of sonotube were used as the formwork for the
upper column segments while the steel jackets served as the forms for the lower
segments. Ducts for the prestressing steel were provided at the center of the section of
each segment using PVC pipe with inside and outside diameters of 127 mm and 140 mm
respectively. The indexing mechanism used to align column segments during the
assembly process, described in Section 4.1 for the construction of units JH1 and JH2, was
also used for JH3 and JH4.
After the concrete had cured sufficiently, the mating surfaces of the components were
cleaned with a wire-brush to remove any loose cement and to roughen the surface. The
surfaces were washed with water to remove any remaining cement particles and then
were allowed to dry completely. After the components were moved into the laboratory,
each specimen was assembled by lowering the steel jacketed segment down over the
tendon and onto the footing top. The segment was bonded to the footing using Sikadur-
31. The upper column segment and the load stub were placed in the same manner.
During assembly, vertical plumb of the specimen was monitored and ensured by placing
aluminum shims of different thickness in between the top surface of one component and
the bottom of the next before epoxy was applied at the joint. Figures 5.3 - 5.6 depict the
construction sequence. After assembly of the specimens was completed, each was
painted white in order to accentuate any cracks that formed during testing.
136

After the first test on each specimen, the damaged region at the column base below the
jacket toe was repaired. Loose concrete was removed from the gap between the bottom
of the jacket and footing and the area scrubbed with a wire brush. The region was rinsed
with water to remove any remaining concrete and was then allowed to dry completely.
The residual crack was then grouted using Sikadur 35, as described for the high aspect
ratio columns reported on in Chapter 4.
140 mm diam. PVCtendon duct
A A
Section A-A
#3 spiral @ 150 mm
VSL type EC 5-27 anchor
#6 anchor spiral @ 50 mm
Section B-B
#4 longitudinal bar
(27) 12.7 mm diameter Grade 270low-relaxation prestressing strands
610mm
A36 steel jacket; 6 mmand 2.8 mm thicknessfor JH1 and JH2
610mm
BB
A36 steel jacket
Figure 5.1 Test unit JH3 and JH4 reinforcement details
137

Figure 5.2 Threading tendon through base (rotated 90 degrees)
Figure 5.3 Footing after installation of tendon 138

Figure 5.4 Installation of lower column segment
Figure 5.5 Installation of column load stub
139

Figure 5.6 Completed column
140

5.3 Materials Testing
Material properties of concrete and steel used in the construction of specimens JH3 and
JH4 were determined through testing at UCSD’s Charles Lee Powell Structural Research
Laboratories. The compression strength of concrete was measured at 7 days, 21 days,
and 28 days and on the day of each test. The results are listed in Table 5.1. The values in
the table are an average strength based on three tests on unconfined concrete cylinders
(152.4 mm diameter x 304.8 mm height) that were cast during the pour.
Table 5.1Concrete compressive strengths for specimens JH3 and JH4 (fc’, MPa)
Specimen 7-Day 21-Day 28-Day Day of Test
1
Day of Test
2
JH3 37.1 ± 1 45.2 ± 1.1 48.5 ± 1.1 57.3 ± 1.6 57.1 ± 0.8
JH4 37.1 ± 1 45.2 ± 1.1 48.5 ± 1.1 58.1 ± 1.1 57.8 ± 1.7
Tensile tests were conducted on the steel reinforcement used in the upper column
segment and on the plate material used for steel jackets. Three coupons 305 mm in
length were tested in a SATEC 490 kN capacity uniaxial testing machine for each of the
reinforcing bar sizes. A complete stress-strain relationship up to the ultimate stress was
obtained for each coupon. A well-defined yield plateau was observed for the tests on
both the #3 and #4 bars. Values for the yield strength and ultimate strength are listed in
Table 4.2. ‘Dog-bone’ shaped coupons were manufactured for tensile tests on the steel
jacket material. The dimensions, tolerances and manufacturing procedure of the coupons
conformed to ASTM standards. Three coupons each were tested for the two material
thickness, with a complete stress-strain relationship up to the ultimate stress obtained for
each coupon. Since a well-defined yield point was not observed in tests on either
material thickness, the yield strength was taken as the stress at 0.2% offset strain,
consistent with ASTM standards. The yield and ultimate strengths are listed in Table 5.2.
141

Table 5.2 JH3 and JH4 Yield and ultimate strengths of reinforcing steel
Description Size Yield Strength
(MPa)
Ultimate Strength
(MPa)
Longitudinal bars #4 (12.7mm) 57.1 ± 0.8
Spiral #3 (9.5mm) 441 ± 3.7 710 ± 3.7
Thin coupons 2.8 mm thick 290 364
Thick coupons 6.0 mm thick 317 463
The adhesive used to bond the precast components together was Sikadur 31 – High Mod
Gel. It is a two component solvent-free, moisture insensitive, high modulus, high
strength epoxy adhesive. The expected properties of this material at the age of 14 days
were compressive strength of 82.7 MPa, tensile strength of 24.8 MPa, and shear strength
of 23.4 MPa.
142

5.4 Column Prestressing
5.4.1 First Stressing
The specimens were post-tensioned using a hydraulic stressing ram at a concrete age of
77 days. Strain gages mounted on the tendon strands, transverse spiral and steel jacket
were connected to the data acquisition system and an initial set of readings was taken
prior to the post-tensioning operation. Strain on the concrete surface was measured at six
points around the circumference of the column using a demountable mechanical strain-
measuring device (demec device). An initial set of readings was taken for the demec
points prior to stressing.
During stressing, load levels in the tendon were calculated using both an analog and a
digital pressure transducer connected to the ram hydraulics and a calibration chart. Also,
ten electrical resistance strain gages mounted on the tendon strands and connected to a
data acquisition system with real-time digital display were used to monitor strains in the
prestressing steel.
Because of the short tendon length, significant strain losses due to mechanical seating of
the strand wedges in the anchor head were expected. Thus, to achieve the design initial
prestress of 1984 kN (= 0.4 x 1861.6 Mpa x 2665 mm2 x10-3), a total force of 3055 kN
was applied to each specimen. This was based on an assumed wedge seating of 6.4 mm.
In light of the relative uncertainty in actual seating losses and because each column was
to be tested within a few days of stressing, no account was taken for time dependent
effects.
Figure 5.7 shows the measured strains in the tendon strands during stressing of specimens
JH3 and JH4. For specimen JH3, the readings from six strain gages (four of the ten gages
read a constant -21x103 µε indicating a bad connection, and were not used) were
averaged and indicated a prestressing force of 1957 kN immediately after stressing. As
seen in Figure 5.7 (b), data from nine strain gages was obtained for specimen JH4.
143

However, data from only eight of the gages was used to calculate the average prestressing
force since it was felt that the low strains recorded by one gage were an anomaly and did
not represent the true average strain in the tendon strands. A force of 2039 kN after
stressing was calculated for specimen JH4.
Readings from the demec points gave a concrete strain of 257 µε and 245 µε for
specimens JH3 and JH4 respectively. Using an elastic modulus based on the compressive
cylinder strength of the concrete and the above strain values, the prestressing force after
stressing was calculated to be 2260 kN and 2150 kN for specimens JH3 and JH4
respectively.
Based on the above, a force of 2100 kN was taken as the average prestressing force in
each column tendon immediately after the post-tensioning operation. Continuous
readings were taken for the demec points in the time between the post-tensioning
operation and first test of each specimen. Using these readings and also the initial strain
readings in the tendon strands on the day of testing, a prestress loss corresponding to
80µε was calculated for specimen JH3. For JH4, an average prestress loss of 47 µε was
calculated from the demec and prestressing strand readings. Using the observed strain
losses and an elastic modulus of 196.5 Gpa for the prestressing steel, the day of test total
prestress force for specimen JH3 was taken as 2060 kN, while that for JH4 was taken as
2077 kN. These tendon force levels correspond to approximately 42% of the ultimate
strength of the tendon.
5.4.2 Second Stressing
The specimens were post-tensioned a second time approximately three weeks after the
first stressing, and subsequent to stage 1 testing. A prestress level of 60% of the ultimate
strength of the tendon was desired for the second test of each specimen. Due to the short
tendon length and wedge seating however, it was not possible to achieve the required
prestress force without exceeding the prestressing steel limit of proportionality, flp. Using
144

a conservative estimate for the steel yield level, a maximum prestressing force of 3600
kN was applied to each column.
Tendon strains during the second post-tensioning of both specimens are shown in Figure
5.8. For specimen JH3, an average strain of 5188 µε corresponding to a force of 2717
kN, was calculated from six strain gages. Of the ten strain gages mounted on the tendon
in specimen JH4, eight gave unstable readings during stressing or did not function at all
and were not used. An average of the readings from the remaining two gages indicated an
average tendon strain of 5096 µε, corresponding to a force of 2669 kN.
The concrete surface strain increase measured using the demec points was 110 µε and
106 µε for specimens JH3 and JH4, respectively. Using an elastic modulus based on the
compressive cylinder strength of the concrete, the above strain values correspond to an
increase of the tendon force of 972 kN for specimen JH3 and 933 kN for JH4. To
evaluate the predicted concrete strain increase, consideration of the tendon force prior to
the start of the second post-tensioning must be given. Readings from the tendon strain
gages after the first test of each specimen indicated a decrease in the total prestress force
of 169 kN and 116 kN for specimens JH3 and JH4 respectively. Thus the force level in
each tendon prior to the second stressing was 2060 kN – 169 kN = 1891 kN for JH3, and
2077 kN – 116 kN = 1961 kN for JH4. Using an assumed mechanical seating of strand
wedges of 6.4 mm and the unbonded tendon length of 3137 mm, a strain loss due to
wedge seating of 2024 µε was calculated. The theoretical prestress force immediately
after stressing was thus 3600 kN – 1060 kN = 2540 kN. The predicted increase in
prestress force was thus 2540 kN – 1891 kN = 650 kN for specimen JH3 and 2540 kN –
1961 kN = 580 kN for JH4. The corresponding predicted concrete strain increase was
73.5 µε and 65.6 µε for specimens JH3 and JH4 respectively.
It is believed that the discrepancy between the observed and theoretical concrete strain
increase was caused by a lower value for the prestress loss due to wedge seating than
assumed. The induced prestress after losses was thus higher than predicted. The final
145

estimate of the total tendon prestress force immediately after stressing was based on the
strain gage readings from the tendon strands. The observed prestress loss in between the
time of the second stressing and second test of each specimen was less than one percent
of the total prestress force. Thus the day of test prestress force for specimen JH3 was
taken as 2717 kN, while that for JH4 was 2669 kN.
146

0 40 80 120 160
Time (minute)
0
2000
4000
6000
Stra
in (m
icro
stra
in)
0 20 40 60 80
Time (minute)
0
2000
4000
6000
Stra
in (m
icro
stra
in)
(a) Specimen JH3
(b) Specimen JH4
Figure 5.7 Tendon strains for first prestressing of specimens JH3 and JH4
147

0 20 40
Time (minute)60
0
2000
4000
6000
8000
Stra
in (m
icro
stra
in)
0 40 80
Time (minute)
0
2000
4000
6000
Stra
in (m
icro
stra
in)
(a) Specimen JH3
(b) Specimen JH4
Figure 5.8 Tendon strains during the second prestressing of specimens JH3 and JH4
148

5.5 Experimental Results – Specimen JH3-T1
5.5.1 Observations under Repeated Cyclic Loading
The test was conducted in force control for the initial elastic stages. One cycle each was
performed at one-half, one, and one-and-a-half times the theoretical force to cause
decompression at the extreme tension fiber of the critical section (P1). The test was then
switched to displacement control and three cycles each, were performed at increasing
drift levels up to the maximum imposed drift of 4.0%. A summary of the observed
behavior is given below. The push direction of loading is represented by a plus sign (+),
while the pull direction is signified by a minus sign (-). Several photographs taken during
the various stages of testing are shown.
± 0.5 Pd (Pmax= +61.7 kN and Pmin= -59.4 kN)
No cracking was observed for either direction of loading.
± Pd (Pmax= +122.6 kN and Pmin = -122.3 kN)
No cracking was observed for either direction of loading.
± 1.5 Pd (Pmax= 183.8 kN and Pmin= -184.5 kN)
The formation of a crack at the joint between the upper and lower column segments was
observed for both the push and pull loading directions. However, the gap may have been
due to slippage of the steel shell with respect to the concrete core of the segment, and
may not have represented actual cracking of the section at that level. A hairline crack at
the extreme concrete fiber, below the steel jacket at the level of the footing, was observed
for pull direction of loading. The crack was approximately one inch in length as
measured along the circumference of the section.
149

3 cycles at 0.2% drift (Pmax= +220.4 kN and Pmin= -226.5 kN)
More noticeable cracking at the footing level was observed for the first push and pull
cycle. The crack extended approximately 75 mm into the section depth from the extreme
tension fiber.
3 cycles at 0.6% drift (Pmax= +334.1 kN and Pmin= -342.8 kN)
Cracks in the upper column segment at heights of 175 mm and 225 mm above the top of
the steel jacket were observed for the push and pull directions respectively. The neutral
axis depth at the column base was approximately 225–250 mm from the extreme
compression fiber at this drift level. The crack width at the column base was 1.0 – 1.5
mm.
3 cycles at 1.2% drift (Pmax= +377.5 kN and Pmin= -389.7 kN)
The neutral axis at the column base was observed to be approximately 175 mm from the
extreme compression fiber for both directions of loading. The width of the crack at the
footing level, as measured at the extreme tension fiber, increased to 4–5 mm. The
beginning of concrete crushing below the jacket was observed during the first cycle.
Concrete continued to spall during the third cycle at this drift. New cracks in the upper
column segment at heights of 300mm and 375 mm above the jacket were observed during
the first cycle for the push and pull directions, respectively.
3 cycles at 1.6% drift (Pmax= +382.3 kN and Pmin= -397.4 kN)
An increased amount of spalling below the steel jacket at the column base was noted for
cycles at this drift. The zone of crushing extended around the circumference to a depth,
as measured along the section dimension, of approximately 50 – 63mm. The neutral axis
depth at the base decreased to about 138 – 150 mm while the crack width increased to 6
mm at the extreme tension fiber. Several new flexural cracks in the upper column
segment, as well as extension of existing cracks, were noted for this drift. Figure 5.9
shows the test unit during cycles at this drift. Note the relative lack of significant damage
along the height of the column.
150

3 cycles at 2.2% drift (Pmax= +393.0 kN and Pmin= -412.6 kN)
The degree of spalling below the jacket was increased at this drift in both the level of
penetration into the section and the distance along the circumference from the extreme
compression fiber. The neutral axis depth at the base remained around 140 mm, while
the crack at the base widened to about 8–9 mm. Figure 5.10 gives a close-up view of the
column base. The significant crack opening and minor concrete crushing are visible in
the photo.
3 cycles at 3.0% drift (Pmax= +399.0 kN and Pmin= -418.7 kN)
The zone of crushing progressed around the circumference of the column to 75-100 mm
in depth, as measured along the section dimension. The neutral axis decreased to 125–
138 mm, while the base crack width increased to about 12 mm. The degree of concrete
crushing at the column compression toe is shown in Figure 5.11. The damage at this drift
was minimal.
3 cycles at 4.0% drift (Pmax= +391.0 kN and Pmin= -417.9 kN)
The neutral axis depth was estimated to be around 125-150 mm from the extreme
compression fiber and the crack opening at the base of the column around 16–17 mm.
Figure 5.12 shows a close-up photograph of the base crack. The extent of spalling along
the circumference of the section below the jacket increased to approximately 150mm in
depth as measured along the section dimension. The gap between the bottom of the steel
jacket and top of the footing at the compression toe was reduced significantly – to about 9
mm. The as built gap width before the start of the test was approximately 21 mm. Figure
5.13 shows the extent of damage below the jacket as well as the lift-off of the bottom of
the lower column segment from the footing at the extreme tension fiber. An overall view
of the column at the 4.0% drift level is shown in Figure 5.14. In the photo, the column
seems to be rotated in an almost rigid fashion about its base. This was indeed the case,
and the overall column behavior after the initial elastic stage may be described as rigid-
body rotation about the compression toe.
151

Test End
Overall, damage to the column was minimal at the end of the test, consisting of only the
spalled region of concrete below the jacket. Due to the crushed concrete in that region, a
residual crack existed on either side of the section. The damage at the base was however,
essentially cosmetic, and could be expected to be repaired relatively easily. No damage
to the footing at the interface with the column base was observed. The width of cracks
observed in the upper column segment remained small throughout the test – on the order
of 0.5 mm or less – and closed completely once the lateral force was removed. No
inclination of the cracks was observed. Fracture of strands did not occur during the test.
As expected, the residual drift of the system at the end of the test was small, and was
equal to just under 0.1%.
Figure 5.9 JH3 – Test 1 Column at –1.6% total drift
152

Figure 5.10 JH3 – Test 1 Damaged region below jacket at 2.2% drift
Figure 5.11 JH3 – Test 1 Close-up of damage at compression toe of column at 3.0% drift
153
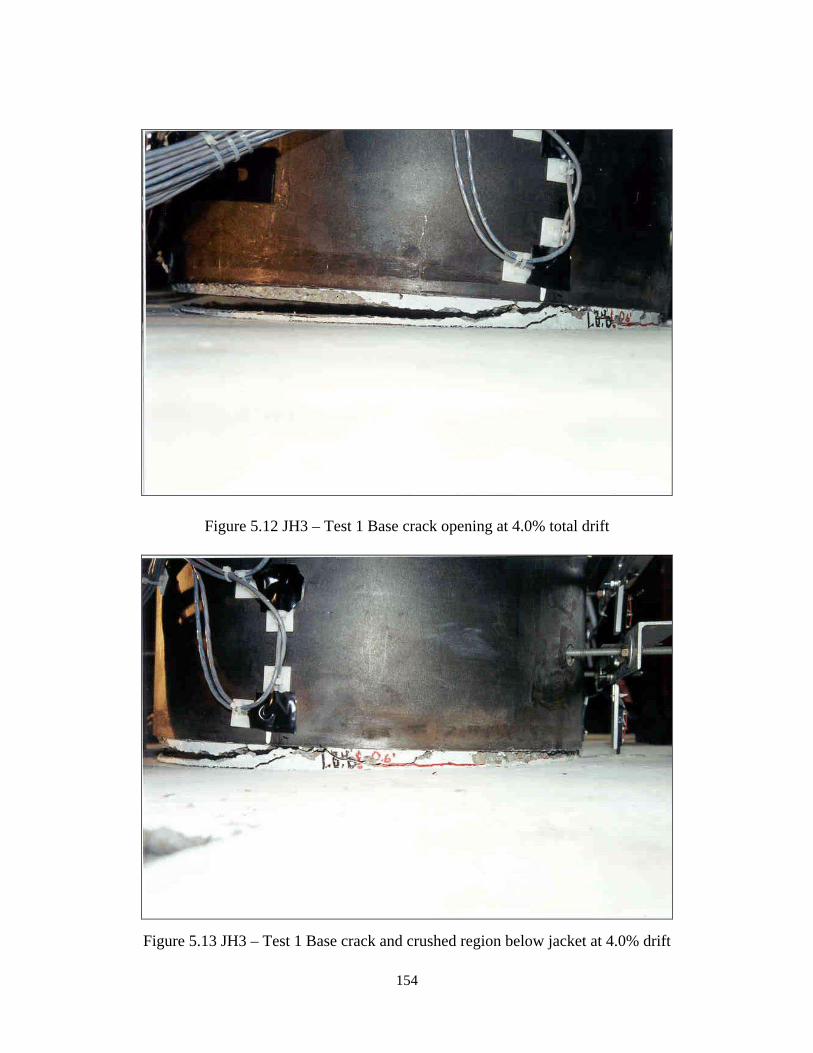
Figure 5.12 JH3 – Test 1 Base crack opening at 4.0% total drift
Figure 5.13 JH3 – Test 1 Base crack and crushed region below jacket at 4.0% drift
154

Figure 5.14 JH3 – Test 1 Column during third push cycle at 4.0% drift
155

5.5.2 Force – Displacement Response
The measured force–displacement response of specimen JH3-T1 is shown in Figure 5.15.
As can be seen, the specimen exhibited stable hysteretic response in both directions of
loading up to the maximum imposed drift of 4.0%. The force-displacement loops are
essentially symmetric, with only slightly higher strengths achieved in the pull direction of
loading. The loops are pinched near the origin due to the clamping force provided by the
prestress. The onset of significant non-linearity in the response occurred at a force of
around 245-265 kN, or approximately twice the theoretical force to cause decompression
at the critical section. The peak strengths for both directions of loading occurred during
the first cycle at 3.0% and were 400 kN and -419 kN for the push and pull directions,
respectively. No significant strength degradation was observed during the test, with
capacities at the 4.0% drift level only slightly lower than those observed at 3.0% drift (a
5% drop in strength by the third cycle at 4.0%).
-80 -40 0 40 80
Lateral Displacement (mm)
-400
-300
-200
-100
0
100
200
300
400
Late
ral F
orce
(kN
)
-4 -3 -2 -1 0 1 2 3 4Drift (%)
AnalyticalAdjusted AnalyticalExperimental
Pull
Push
P + Fsi
f 'c Ac = 0.192
Figure 5.15 JH3 – Test 1 Force-displacement response
156
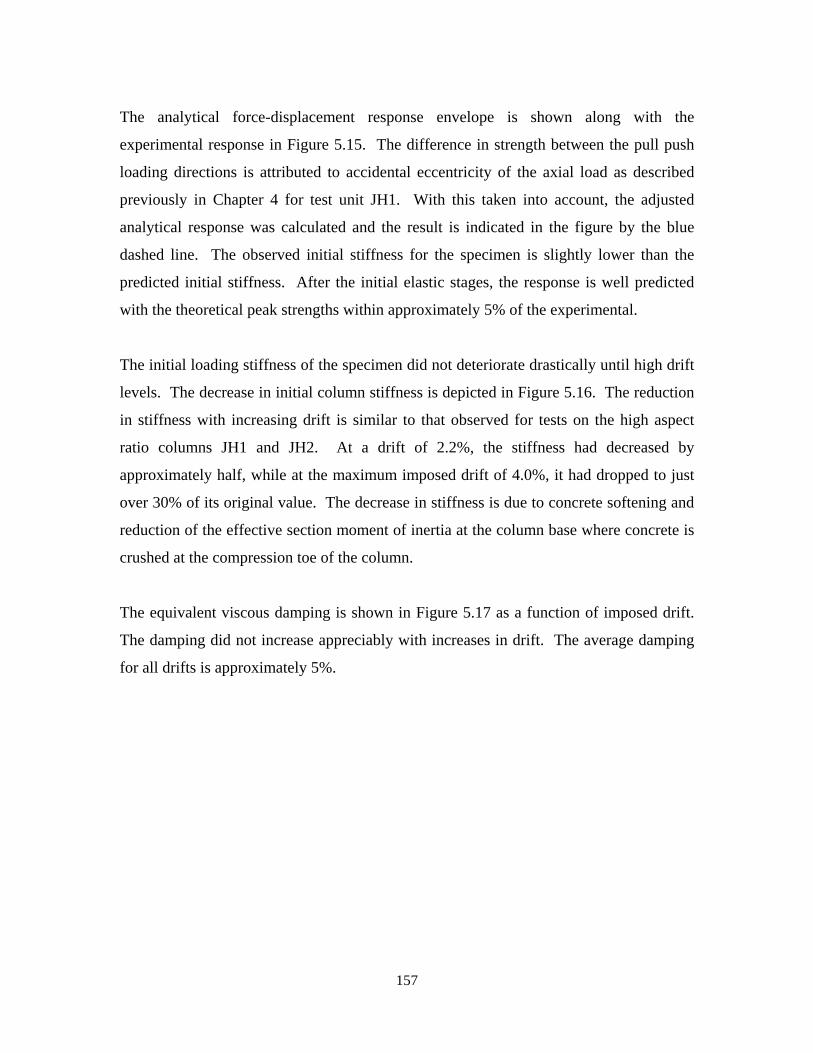
The analytical force-displacement response envelope is shown along with the
experimental response in Figure 5.15. The difference in strength between the pull push
loading directions is attributed to accidental eccentricity of the axial load as described
previously in Chapter 4 for test unit JH1. With this taken into account, the adjusted
analytical response was calculated and the result is indicated in the figure by the blue
dashed line. The observed initial stiffness for the specimen is slightly lower than the
predicted initial stiffness. After the initial elastic stages, the response is well predicted
with the theoretical peak strengths within approximately 5% of the experimental.
The initial loading stiffness of the specimen did not deteriorate drastically until high drift
levels. The decrease in initial column stiffness is depicted in Figure 5.16. The reduction
in stiffness with increasing drift is similar to that observed for tests on the high aspect
ratio columns JH1 and JH2. At a drift of 2.2%, the stiffness had decreased by
approximately half, while at the maximum imposed drift of 4.0%, it had dropped to just
over 30% of its original value. The decrease in stiffness is due to concrete softening and
reduction of the effective section moment of inertia at the column base where concrete is
crushed at the compression toe of the column.
The equivalent viscous damping is shown in Figure 5.17 as a function of imposed drift.
The damping did not increase appreciably with increases in drift. The average damping
for all drifts is approximately 5%.
157

0 1 2 3 4
Drif t (%)
20
30
40
50
60
70
Stif
fnes
s (kN
/mm
)
100
90
80
70
60
50
40
30
Perc
ent o
f O
rigin
al S
tiffn
ess (
%)
Figure 5.16 JH3 –Test 1 Initial loading stiffness versus drift
0 1 2 3 4
Drif t (%)
0
2
4
6
8
10
Equi
vale
nt V
isco
us D
ampi
ng (%
)
Test 1
Figure 5.17 JH3 – Test 1 Equivalent viscous damping versus drift
158

5.5.3 Test Control Data
A large array of instrumentation was used to monitor various quantities of interest during
the test. This included linear potentiometers to measure displacements and curvature, and
strain gages mounted on reinforcing steel. The data recorded during testing is presented
in a reduced form as strain and curvature profile plots using values recorded at peak
displacements during the first cycle of loading.
Column Curvature
Curvature along the column height is shown in Figure 5.18. The curvature values were
calculated as previously described. It can be seen that from the early stages of testing on,
much of the column rotation was concentrated at the base where the large crack formed
below the bottom of the steel jacket at the level of the footing. This is evidenced by the
large spike in curvature near the bottom of the column in the curvature plot. It is believed
that the curvatures shown at the column base are higher than the actual values since the
assumption that plane sections remain plane may not be valid, and since the calculation
of curvature uses the linear potentiometer readings from both sides of the section. A
calculation of curvature based on the potentiometer reading on only the compression
generator side and on the neutral axis depth is more appropriate. Calculations were
performed using estimates for the neutral axis depth recorded during testing and this
approach. The curvatures obtained using the “correct” method were on average, 20%
lower than those calculated using potentiometer readings from both sides of the column
section.
An estimate of the concrete strain in the region at the column base may be obtained by
averaging the curvatures for the push and pull directions for a given level of drift and
then multiplying by the observed neutral axis depth. The procedure is not exact but
should yield a number representative of the magnitude of compression strain at the
column base. An estimate of the compression strain at the 4.0% drift level is given by:
εc = 0.8 φave c = 0.8 (0.00028 mm-1) 135 mm = 0.03
159

where φave is the average of curvatures calculated for the push and pull direction at 4.0%
drift, c is the estimated neutral axis distance from the compression edge at the base of the
column and the 0.8 is to account for the curvature being overestimated as described
above.
-0.0003 -0.0002 -0.0001 0 0.0001 0.0002 0.0003
Curvature (mm-1)
0
400
800
1200
Col
umn
Hei
ght (
mm
)
f e d c b a a b c d e f
a drift = 0.6%b drift = 1.2%c drift = 1.6%d drift = 2.2%e drift = 3.0%f drift = 4.0%
Pull Push
Figure 5.18 JH3 –Test 1 Curvature along column height
Prestressing Steel Strain
A comparison between the predicted and experimental increase in tendon strain due to
opening of the crack at the column base is shown in Figure 5.19. The experimental curve
was constructed as described in Section 4.5.3. As can be seen, excellent agreement was
achieved between the experimental and analytical prediction. The good correlation of
strain increase might be due to the relatively high number of strain gages used on the
tendon. In other words, the larger the number of gages used to monitor a given quantity,
the more confidence one can have in the validity of the data (barring any systematic
errors).
160

Steel Jacket Strains
Five pairs of orthogonal strain gages were mounted on the east and west (shear)
generators of the steel jacket oriented in the vertical and horizontal directions. At the
north and south generators, five horizontal gages were mounted to monitor hoop strains
in the jacket. Figures 5.20 and 5.21 show the hoop strains developed during testing on
the north and south generators, respectively. Note that the strain profiles are viewed from
left to right for increasing force/displacement levels, starting with 0.5 x P1 and ending
with the maximum drift of 4%. At the compression generators, circumferential tension is
induced in the jacket by the dilation of compressed concrete in that region. As seen in the
figure, particularly high hoop strains were developed at the jacket toe where the
longitudinal compression strain in the concrete was highest. Significant increases in
hoop strains at the jacket toe from one drift level to the next occurred at 2.2%, 3% and
4% drift. At a drift of 4.0%, the hoop strain near the bottom of the jacket was well
beyond yield and was on the order of 5000 µε.
Figures 5.22 and 5.23 show the hoop strain profiles for the east and west generators.
Jacket strains at the shear (east/west) generators are due to the shear force acting on the
column and to some degree, the confining action of the jacket on the compressed
concrete. As seen in the figure, the hoop strains increased down the height of the jacket
and were smaller in magnitude than those observed at the north and south locations. The
maximum observed strain was approximately 800 µε. Thus, shear-induced strains were
much lower than confinement strains.
Vertical strains at the east and west generators are displayed in Figures 5.24 and 5.25,
respectively. Vertical strains at the east side are small along most of the jacket height
except near the toe of the jacket where substantial tension strains existed. These strains
are likely a result of the bending action acting on the segment. At the west generator,
significant compressive strains developed at both the top and bottom of the jacket. It is
not clear why the strains were compressive in nature. The maximum absolute magnitude
of the vertical strains at both east and west generators was approximately 800 µε.
161

Transverse Spiral Strains
Figures 5.26 through 5.29 show strain profiles for the upper column segment spiral
reinforcement. The confining action of the spiral reinforcement at the north and south
generators is illustrated in Figures 5.26 and 5.27, where the hoop strains are seen to be
increasing down the height of the segment. The maximum observed strain occurred at
the base of the segment at 4.0% drift and was approximately 800 µε. The strain in the
transverse reinforcement at the east and west generators is shown in Figures 5.28 and
5.29. The strains are relatively low since the column shear force is carried by the
horizontal component of the diagonal compression strut and since the concrete dilation is
less at the sides of the column than at the compression generators.
-4 -2 0 2 4
Drif t (%)
0
400
800
1200
1600
2000
Stra
in In
crea
se (m
icro
stra
in)
PredictedExperimental
Figure 5.19 JH3 – Test1 Predicted and Experimental Tendon Strain Increase
162

0 2000 4000 6000
Strain (microstrain)
0
200
400
600
Hei
ght o
n Ja
cket
(mm
)0 2000 4000 6000
Strain (microstrain)
0
200
400
600
Hei
ght o
n Ja
cket
(mm
)
PULL DIRECTIONPUSH DIRECTION
4% 4%
0.2%0.6%1.2%1.6%2.2%3.0%4.0%
0.2%0.6%1.2%1.6%2.2%3.0%4.0%
Figure 5.20 JH3 – Test 1 Jacket hoop strain at north generator
0 1000 2000 3000 4000 5000
Strain (microstrain)
0
200
400
600
Hei
ght o
n Ja
cket
(mm
)
-500 0 500 1000 1500 2000 2500
Strain (microstrain)
0
200
400
600
Hei
ght o
n Ja
cket
(mm
)
PULL DIRECTIONPUSH DIRECTION
0.2%0.6%1.2%1.6%2.2%3.0%4.0%
0.2%0.6%1.2%1.6%2.2%3.0%4.0%
Figure 5.21 JH3 – Test 1 Jacket hoop strain at south generator
163

0 200 400 600 800
Strain (microstrain)
0
200
400
600
Hei
ght o
n Ja
cket
(mm
)-200 0 200 400 600 800
Strain (microstrain)
0
200
400
600
Hei
ght o
n Ja
cket
(mm
)
PULL DIRECTIONPUSH DIRECTION
0.2%0.6%1.2%1.6%2.2%3.0%4.0%
0.2%0.6%1.2%1.6%2.2%3.0%4.0%
Figure 5.22 JH3 – Test 1 Jacket hoop strain at east generator
0 200 400 600 800
Strain (microstrain)
0
200
400
600
Hei
ght o
n Ja
cket
(mm
)
0 200 400 600 800 1000
Strain (microstrain)
0
200
400
600
Hei
ght o
n Ja
cket
(mm
)
PULL DIRECTIONPUSH DIRECTION
0.2%0.6%1.2%1.6%2.2%3.0%4.0%
0.2%0.6%1.2%1.6%2.2%3.0%4.0%
Figure 5.23 JH3 – Test 1 Jacket hoop strain at west generator
164

-400 0 400 800 1200
Strain (microstrain)
0
200
400
600
Hei
ght o
n Ja
cket
(mm
)
-400 0 400 800 1200
Strain (microstrain)
0
200
400
600
Hei
ght o
n Ja
cket
(mm
)
PULL DIRECTIONPUSH DIRECTION
0.2%0.6%1.2%1.6%2.2%3.0%4.0%
0.2%0.6%1.2%1.6%2.2%3.0%4.0%
Figure 5.24 JH3 – Test 1 Jacket vertical strain at east generator
-800 -600 -400 -200 0 200
Strain (microstrain)
0
200
400
600
Hei
ght o
n Ja
cket
(mm
)
-800 -600 -400 -200 0 200
Strain (microstrain)
0
200
400
600
Hei
ght o
n Ja
cket
(mm
)
PULL DIRECTIONPUSH DIRECTION
0.2%0.6%1.2%1.6%2.2%3.0%4.0%
0.2%0.6%1.2%1.6%2.2%3.0%4.0%
Figure 5.25 JH3 – Test 1 Jacket vertical strains at west generator
165

-80 -40 0 40 80 120
Strain (microstrain)
600
800
1000
1200
1400
Hei
ght A
bove
Foo
ting
(mm
)0 200 400 600 800
Strain (microstrain)
600
800
1000
1200
1400
Hei
ght A
bove
Foo
ting
(mm
)
PULL DIRECTIONPUSH DIRECTION
0.2%0.6%1.2%1.6%2.2%3.0%4.0%
0.2%0.6%1.2%1.6%2.2%3.0%4.0%
Figure 5.26 JH3 – Test 1 Spiral strains at north generator
0 200 400 600 800
Strain (microstrain)
600
800
1000
1200
1400
Hei
ght A
bove
Foo
ting
(mm
)
-200 -100 0 100 200
Strain (microstrain)
600
800
1000
1200
1400
Hei
ght A
bove
Foo
ting
(mm
)
PULL DIRECTION
PUSH DIRECTION
0.2%0.6%1.2%1.6%2.2%3.0%4.0%
0.2%0.6%1.2%1.6%2.2%3.0%4.0%
Figure 5.27 JH3 – Test 1 Spiral strains at south generator
166

0 100 200 300 400
Strain (microstrain)
600
800
1000
1200
1400
Hei
ght A
bove
Foo
ting
(mm
)0 100 200 300 400
Strain (microstrain)
600
800
1000
1200
1400
Hei
ght A
bove
Foo
ting
(mm
)
PULL DIRECTION
PUSH DIRECTION
0.2%0.6%1.2%1.6%2.2%3.0%4.0%
0.2%0.6%1.2%1.6%2.2%3.0%4.0%
Figure 5.28 JH3 – Test 1 Spiral strains at east generator
40 60 80 100 120 140
Strain (microstrain)
800
1000
1200
1400
Hei
ght A
bove
Foo
ting
(mm
)
0 100 200 300 400
Strain (microstrain)
800
1000
1200
1400
Hei
ght A
bove
Foo
ting
(mm
)
PULL DIRECTIONPUSH DIRECTION
0.2%0.6%1.2%1.6%2.2%3.0%4.0%
0.2%0.6%1.2%1.6%2.2%3.0%4.0%
Figure 5.29 JH3 – Test 1 Spiral strains at west generator
167

5.6 Experimental Results – Specimen JH3-T2
5.6.1 Observations under Repeated Cyclic Loading
The planned loading sequence described in Section 3.5 was altered for the same reasons
and in the same manner as explained for the second tests of units JH1 and JH2. A
summary of the observed behavior is given below. The push direction of loading is
represented by a plus sign (+), while the pull direction is signified by a minus sign (-).
±0.5 Pd (Pmax= +81.3 kN and Pmin= -81.4 kN)
No cracking was observed for either direction of loading.
±Pd (Pmax= +161.5 kN and Pmin = -162.6 kN)
Cracking at the column case below the steel jacket was observed for both the push and
pull loading directions. The crack extended to a depth of approximately 50-75 mm into
the section from the extreme tension fiber for the push direction, but only a few
millimeters into the section for the pull direction.
±1.5 Pd (Pmax= 242.7 kN and Pmin= -242.2 kN)
The crack at the column base extended significantly during the first cycle at this force
level – to a depth of around 175-200 mm from the extreme tension fiber. Cracking was
not observed in the upper (non-jacketed) segment.
3 cycles at 0.6% drift (Pmax= +287.1 kN and Pmin= -318.5 kN)
Flexural cracks in the upper column segment were noted during cycles at this drift and
occurred at locations of previous cracks from the first test. A single crack at
approximately 175 mm above the jacket was noted for the push direction and two cracks,
one at 125 mm and the other at 275 mm above the jacket, were observed for the pull
direction. The depth of the neutral axis at the column base was on the order of 275 mm
from the tension edge.
168

3 cycles at 0.9% drift (Pmax= +331.7 kN and Pmin= -363.2 kN)
The neutral axis depth at the column base was estimated to be about one-half the total
section depth at this drift level. The width of the crack at the footing level, as measured
at the extreme tension fiber, was approximately 2 mm. Minor extensions of cracks in the
upper column segment were observed.
3 cycles at 1.2% drift (Pmax= +359.1 kN and Pmin= -396.3 kN)
The neutral axis at the column base was observed to be approximately 200-225 mm from
the compression edge for both directions of loading. The width of the crack at the
footing level, as measured at the extreme tension fiber, increased to 3–4 mm. Two new
cracks in the upper column segment at heights of 38 mm and 460 mm above the jacket
were observed during the first and third pull, respectively. Similar to the first test
however, the crack widths in the upper column segment remained small throughout the
test, while the crack at the column base continued to widen as the drift level increased.
It was at this drift level that spalling below the jacket at the extreme compression fiber
was observed during the first test of specimen JH3. For this the second test however, the
compression toe below the jacket at the column base had been repaired by epoxy
injection of the residual crack and the extreme compression fiber consisted of epoxy
rather than concrete. Thus, it was not possible to discern the state of the concrete within
the region of the repair.
3 cycles at 1.6% drift (Pmax= +389.4 kN and Pmin= -425.1 kN)
The neutral axis depth at the column base was approximately 175-200 mm from the
extreme compression edge. The base crack width was observed to be 4-5 mm. No
further cracking was noticed in the upper column segment.
3 cycles at 2.2% drift (Pmax= +419.7 kN and Pmin= -456.4 kN)
New cracks in the upper column segment at heights of 450 mm and 600 mm above the
top of the jacket were noted during the first push and pull, respectively. At the base of
169

the column, the crack opening at the extreme tension fiber increased to 9 mm and the
neutral axis decreased to around 170 mm. Degradation of the concrete below the jacket
near mid-depth of the column cross-section (east shear generator) was noted during the
third cycle.
3 cycles at 3.0% drift (Pmax= +432.1 kN and Pmin= -463.1 kN)
The neutral axis depth appeared to be unchanged at the column base for this level of drift.
It was difficult to determine with certainty the exact value however, as the base crack
became inclined near the neutral axis and propagated into the core region within the
jacket. The lift-off of the column base at the tension side was increased to approximately
12 mm at this drift. Continued degradation of concrete below the jacket at the east shear
generator was noted during the third cycle. In addition, small particles of concrete fell
onto the top of the footing from up inside the jacket on the tension side. At the
compression toe, a significant reduction in the gap width between the bottom of the
jacket and the top of the footing was noted (gap reduced to about 12 mm compared to the
pretest, as-built value of 21 mm).
3 cycles at 4.0% drift (Pmax= +416.5 kN and Pmin= -452.4 kN)
The neutral axis depth was estimated to be, with some uncertainty, around 150-175mm.
The gap between the toe of the jacket and the footing top decreased slightly to 11 mm.
The liftoff of the column base was approximately 17-19 mm. Slippage of the jacket with
respect to the concrete core in the amount of 5 mm was observed at this drift level. This
was noticed at the bottom curvature rod locations where a hole through the jacket to the
core had been provided. An increased level of damage to the concrete below the jacket at
the east side of the column was noted.
3 cycles at 5.0% drift (Pmax= +399.7 kN and Pmin= -433.1 kN)
The depth of the neutral axis from the compression edge was noted to have increased to
around 175-190 mm. The gap between the footing top and the bottom of the jacket
170

decreased to 9.5 mm, and the crack opening at the extreme tension fiber increased to
approximately 22 mm.
3 cycles at 6.0% drift (Pmax= +376.3 kN and Pmin= -408.7 kN)
The toe of the jacket on the compression side was noted to be nearly in contact with the
footing surface, with a measured gap width of only 6-7 mm. The crack at the column
base increased in width to around 25 mm. Figure 5.30 shows a view of the east generator
below the steel jacket, where significant crushing of concrete occurred. An overall view
of the column at 6.0% drift is shown in Figure 5.31.
Test End
Damage to the column was minimal at the end of the test, consisting of only the region
below the jacket where epoxy and concrete were crushed. Due to the crushed epoxy in
that region, a significant residual crack existed on either side of the section. No damage
to the footing at the interface with the column base was observed. The width of cracks
observed in the upper column segment remained small throughout the test – on the order
of 0.5 mm or less – and closed completely once the lateral force was removed. No
inclination of the cracks was observed in the upper column segment. Fracture of strands
did not occur during the test. The residual drift of the system at the end of the test was
0.2%.
171

Figure 5.30 JH3 –Test 2 View of east generator below jacket at 6.0% drift
Figure 5.31 JH3 –Test 2 Overall view of column at 6.0% drift
172

5.6.2 Force – Displacement Response
The experimental force–displacement response for the second test of specimen JH3 is
shown in Figure 5.32. The specimen exhibited stable hysteretic response in both
directions of loading up to the maximum imposed drift of 6.0%. The force-displacement
loops are essentially symmetric, with slightly higher strengths achieved in the pull
direction of loading. The onset of significant non-linearity in the response occurred at a
force on the order of 300kN, which corresponds to twice the theoretical decompression
force (2 x P1). The peak strengths for both directions of loading occurred during the first
cycle at 3.0% drift and were 432 kN and -463 kN for the push and pull directions,
respectively. Column strength began to degrade after the 3.0% level of drift, and had
decreased by 12% from the peak observed strength at a drift of 6%.
-120 -80 -40 0 40 80 120
Lateral Displacement (mm)
-500
-400
-300
-200
-100
0
100
200
300
400
500
Late
ral F
orce
(kN
)
-6 -5 -4 -3 -2 -1 0 1 2 3 4 5 6Drif t (%)
AnalyticalAdjusted AnalyticalExperimental
Pull
Push
P + Fsi
f 'c Ac = 0.233
indicates f ailure basedon reaching εcu
Figure 5.32 JH3 – Test 2 Force-displacement response
173

The initial stiffness of the specimen and peak strengths at early drift levels are not well
predicted. This is expected for the same reason detailed in Section 4.6.2. The slightly
higher strengths observed in the pull direction of loading could be due to eccentricity of
the axial load transfer beam as explained for other tests earlier in the report. The adjusted
analytical response is given by the blue dashed line in Figure 5.32. At drift levels equal
to and greater than 2.2%, the analytical force-displacement envelope gives a reasonable
estimate the experimental. The second slope behavior is modeled well, with the
analytical curve following the decrease in strength at drifts greater than 3.0%. Predicted
peak strengths are within 5% of the experimentally observed strengths for drifts up to
around 4.5%, after which point the error increases to approximately 8.5%.
The initial loading stiffness of the specimen, as measured at the theoretical
decompression force, is plotted as a function of drift in Figure 5.33. The stiffness
observed during the first test of specimen JH3 is also shown. It can be seen that the
epoxy grouting of the base crack restored the column stiffness to approximately 50% of
that observed at the beginning of the first test. Other than at the early stages of the
testing, the second test stiffness is very similar to that observed for the first test. The
loading stiffness decreased to only 10% of original column stiffness at the maximum
imposed drift of 6.0%. During cycles at drifts of 5% and 6%, the initial loading stiffness
was essentially equal to the effective column stiffness, Keff.
The hysteretic damping was low for the second test of JH3. Figure 5.34 shows the
calculated equivalent viscous damping for both tests of the specimen. The trend of
increasing damping with drift is evident. At low drifts, the second test damping is lower
than that of the first. The damping level at moderate drifts is similar for both tests. At
drifts of 5% and 6%, the equivalent damping was on the order of 7%.
174

0 1 2 3 4 5 6
Drif t (%)
0
20
40
60
80
Stif
fnes
s (kN
/mm
)
100
90
80
70
60
50
40
30
20
10
0
Perc
ent o
f O
rigin
al S
tiffn
ess (
%)
Figure 5.33 JH3 – Test 2 Initial loading stiffness versus drift
0 2 4 6
Drif t (%)
0
2
4
6
8
10
Equi
vale
nt V
isco
us D
ampi
ng (%
)
Test 1Test 2
Figure 5.34 JH3 –Test 2 Equivalent viscous damping versus drift
175

5.6.3 Test Data
The data recorded during the second test of specimen JH3 is presented in a reduced form
as strain and curvature profile plots using values recorded at peak displacements during
the first cycle of loading.
Column Curvature
Curvature along the height of the column is shown in Figure 5.35. Note that curvatures
for the 6% drift level are not shown since the linear potentiometers at the column base did
not have sufficient compression or extension travel. As was observed in the first test of
specimen JH3, from the early stages of testing on, the majority of the column rotation is
concentrated at the level of the footing. Curvatures at the column base at a drift of 4.0%
are slightly higher than those observed at the 4.0% drift level during the first test. A
curvature of 0.00036 mm-1 was observed at 5.0% drift. It is again noted that the
curvatures shown are believed to be higher than the actual curvatures due to the
phenomenon described previously.
-0.0004 -0.0002 0 0.0002 0.0004
Curvature (mm-1)
0
400
800
1200
Col
umn
Hei
ght (
mm
)
h g f e d c b a a b c d e f g h
a drift = 0.6%b drift = 0.9%c drift = 1.2%d drift = 1.6%e drift = 2.2%f drift = 3.0%g drift = 4.0%h drift = 5.0%
Pull Push
Figure 5.35 JH3 – Test 2 Curvature along column height
176

Prestressing Steel Strains
The analytical and experimental increase in tendon strain due to the opening of the crack
at the column base is shown in Figure 5.36. The analytical slightly over-predicts the
increase of strain in the tendon for low and moderate drifts. The opposite is observed at
higher drifts where the actual strain increase is higher than the predicted. The observed
increase in strain for the push direction of loading at drifts of 5.0% and 6.0% is higher
than that observed for the pull loading direction. Following the analytical model, this
implies a smaller neutral axis depth for the push direction than the pull at those drifts. It
is not clear why a difference in neutral axis depth would exist for the two directions of
loading. Overall, the analytical model provides a reasonable estimate of the tendon strain
increase.
Steel Jacket Strains
Hoop strains in the steel jacket at the north and south generators are illustrated in Figures
5.37 and 5.38, respectively. The strain profiles in each figure are for increasing drifts
from left to right and are shown for drift levels of 0.6% to the maximum imposed drift of
6.0%. For the low-level cycles (on the far left in each figure), hoop strains on the order
of 5000 µε were observed. These are residual strains from the first test of the specimen.
At drifts of 3.0% and 4.0%, the observed strains are significantly higher than those
observed for the same drift during the first test. This is likely due to the higher axial load
ratio for the second test. Since higher concrete compression strains at the base would
generally be expected because of the increased axial load level, the tendency for dilation
of concrete at the compression toe would be increased. This in turn would lead to
increased hoop straining of the jacket as it acts to confine the expanding concrete.
Significant yielding of the jacket occurred as high as mid-height on the jacket. Hoop
strains near the base of the jacket for the maximum drift of 6.0% were approximately 12
times the yield strain of the material.
Hoop strains in the jacket at the east and west generators are displayed in Figures 5.39
and 5.40, respectively. It is believed that the compressive strains indicated near the
177

jacket toe for the east generator are likely due to a faulty gage and do not represent actual
jacket strains. In general, the hoop strains increase down the height of the jacket for both
the east and west sides (except as already noted) and are of much smaller magnitude than
those observed at the north and south faces. The higher strains near the bottom are a
result of the confining action of the jacket on the highly compressed concrete at the
column compression toe.
Figures 5.41 and 5.42 show the vertical strains in the jacket for the east and west
generators, respectively. Minimal vertical strains were observed along most of the jacket
height, except near the bottom where significant tension strains were present. It is
believed that the strains are due to bending action acting on the segment. At the east side,
strains on the order of the material yield strain were observed at 6.0% drift, while
maximum strains several times yield were observed at the west side.
Transverse Spiral Strains
Strains in the transverse spiral in the upper column segment are shown in Figures 5.43
through 5.46. Hoop strains at the north and south generators, for the push and pull
directions respectively, increase down the height of the segment because of higher
concrete dilation near the bottom. Maximum strains near the bottom of the segment at
6.0% drift are similar to those observed for the first test at 4.0% drift. The maximum
hoop strains are just over one-half the yield strain for both the north and south generators.
Hoop strains at the east and west generators are smaller than those observed at the north
and south faces of the column. The maximum hoop strain for both the east and west
generators occurred at mid-height of the segment at a drift of 6.0% and were on the order
of 300-350 µε.
178
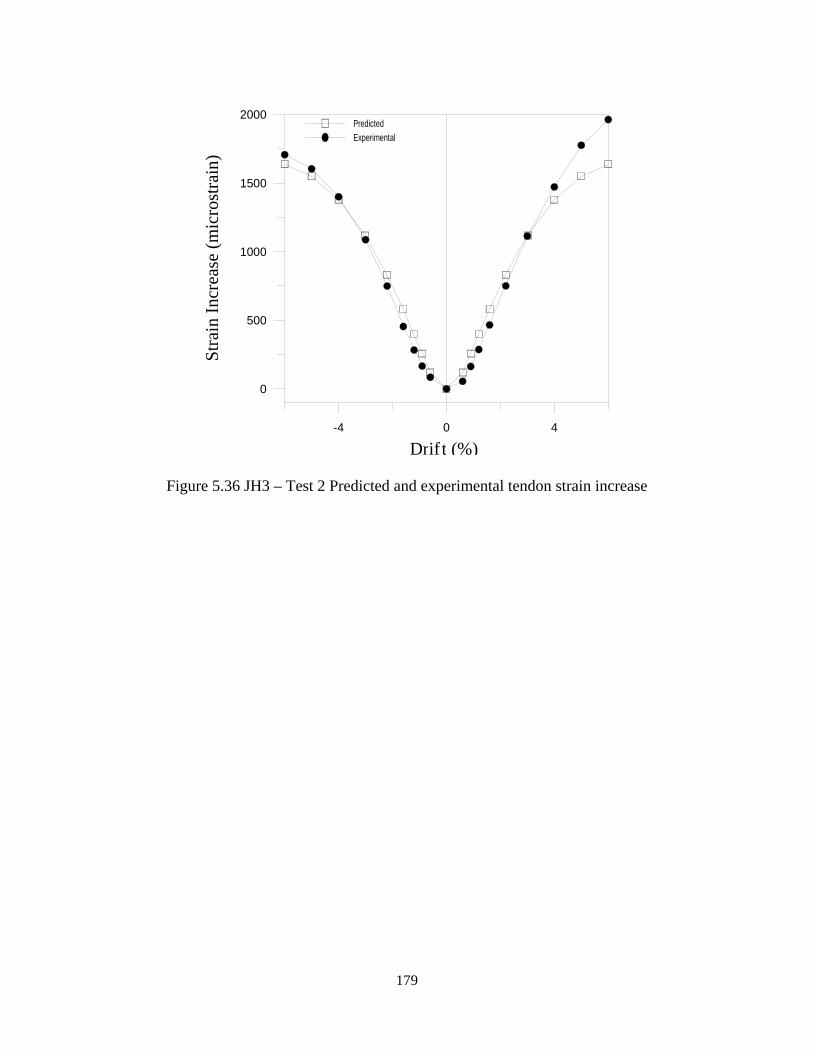
-4 0 4
Drif t (%)
0
500
1000
1500
2000
Stra
in In
crea
se (m
icro
stra
in)
PredictedExperimental
Figure 5.36 JH3 – Test 2 Predicted and experimental tendon strain increase
179

0 5000 10000 15000 20000
Strain (microstrain)
0
200
400
600
Hei
ght o
n Ja
cket
(mm
)
0 5000 10000 15000 20000
Strain (microstrain)
0
200
400
600H
eigh
t on
Jack
et (m
m)
PULL DIRECTIONPUSH DIRECTION
0.9%1.2%1.6%2.2%3.0%4.0%5.0%6.0%
0.9%1.2%1.6%2.2%3.0%4.0%5.0%6.0%
Figure 5.37 JH3 – Test 2 Jacket hoop strain at north generator
0 5000 10000 15000 20000 25000
Strain (microstrain)
0
200
400
600
Hei
ght o
n Ja
cket
(mm
)
0 5000 10000 15000 20000
Strain (microstrain)
0
200
400
600
Hei
ght o
n Ja
cket
(mm
)
PULL DIRECTIONPUSH DIRECTION
0.9%1.2%1.6%2.2%3.0%4.0%5.0%6.0%
0.9%1.2%1.6%2.2%3.0%4.0%5.0%6.0%
Figure 5.38 JH3 – Test 2 Jacket hoop strain at south generator
180

-800 -400 0 400 800 1200
Strain (microstrain)
0
200
400
600
Hei
ght o
n Ja
cket
(mm
)-800 -400 0 400 800 1200
Strain (microstrain)
0
200
400
600
Hei
ght o
n Ja
cket
(mm
)
PULL DIRECTIONPUSH DIRECTION
0.6%0.9%1.2%1.6%2.2%3.0%4.0%5.0%6.0%
0.6%0.9%1.2%1.6%2.2%3.0%4.0%5.0%6.0%
Figure 5.39 JH3 Test 2 Jacket hoop strain at east generator
0 200 400 600 800 1000
Strain (microstrain)
0
200
400
600
Hei
ght o
n Ja
cket
(mm
)
0 200 400 600 800 1000 1200
Strain (microstrain)
0
200
400
600
Hei
ght o
n Ja
cket
(mm
)
PULL DIRECTIONPUSH DIRECTION
0.6%0.9%1.2%1.6%2.2%3.0%4.0%5.0%6.0%
0.6%0.9%1.2%1.6%2.2%3.0%4.0%5.0%6.0%
Figure 5.40 JH3 –Test 2 Jacket strain at west generator
181

-400 0 400 800 1200 1600
Strain (microstrain)
0
200
400
600
Hei
ght o
n Ja
cket
(mm
)-400 0 400 800 1200 1600
Strain (microstrain)
0
200
400
600
Hei
ght o
n Ja
cket
(mm
)
PULL DIRECTIONPUSH DIRECTION
0.6%0.9%1.2%1.6%2.2%3.0%4.0%5.0%6.0%
0.6%0.9%1.2%1.6%2.2%3.0%4.0%5.0%6.0%
Figure 5.41 JH3 – Test 2 Jacket vertical strain at east generator
-2000 0 2000 4000 6000 8000
Strain (microstrain)
0
200
400
600
Hei
ght o
n Ja
cket
(mm
)
-2000 0 2000 4000 6000 8000
Strain (microstrain)
0
200
400
600
Hei
ght o
n Ja
cket
(mm
)
PULL DIRECTIONPUSH DIRECTION
0.6%0.9%1.2%1.6%2.2%3.0%4.0%5.0%6.0%
0.6%0.9%1.2%1.6%2.2%3.0%4.0%5.0%6.0%
Figure 5.42 JH3 – Test 2 Jacket vertical strain at west generator
182

0 50 100 150 200 250 300
Strain (microstrain)
600
800
1000
1200
1400
Hei
ght A
bove
Foo
ting
(mm
)0 200 400 600 800 1000
Strain (microstrain)
600
800
1000
1200
1400
Hei
ght A
bove
Foo
ting
(mm
)
PULL DIRECTIONPUSH DIRECTION
0.6%0.9%1.2%1.6%2.2%3.0%4.0%5.0%6.0%
0.9%1.2%1.6%2.2%3.0%4.0%5.0%6.0%
Figure 5.43 JH3 – Test 2 Spiral strains at north generator
0 200 400 600 800
Strain (microstrain)
600
800
1000
1200
1400
Hei
ght A
bove
Foo
ting
(mm
)
-120 -80 -40 0 40 80 120
Strain (microstrain)
600
800
1000
1200
1400
Hei
ght A
bove
Foo
ting
(mm
)
PULL DIRECTION
PUSH DIRECTION0.9%1.2%1.6%2.2%3.0%4.0%5.0%6.0%
0.6%0.9%1.2%1.6%2.2%3.0%4.0%5.0%6.0%
Figure 5.44 JH3 – Test 2 Spiral strains at south generator
183

100 150 200 250 300 350 400
Strain (microstrain)
600
800
1000
1200
1400
Hei
ght A
bove
Foo
ting
(mm
)80 120 160 200 240 280 320
Strain (microstrain)
600
800
1000
1200
1400
Hei
ght A
bove
Foo
ting
(mm
)
PULL DIRECTIONPUSH DIRECTION
0.6%0.9%1.2%1.6%2.2%3.0%4.0%5.0%6.0%
0.6%0.9%1.2%1.6%2.2%3.0%4.0%5.0%6.0%
Figure 5.45 JH3 – Test 2 Spiral strains at east generator
-40 0 40 80 120 160 200
Strain (microstrain)
800
1000
1200
1400
Hei
ght A
bove
Foo
ting
(mm
)
50 100 150 200 250 300
Strain (microstrain)
800
1000
1200
1400
Hei
ght A
bove
Foo
ting
(mm
)
PULL DIRECTIONPUSH DIRECTION
0.6%0.9%1.2%1.6%2.2%3.0%4.0%5.0%6.0%
0.6%0.9%1.2%1.6%2.2%3.0%4.0%5.0%6.0%
Figure 5.46 JH3 – Test 2 Spiral strains at west generator
184

5.7 Experimental Results - Specimen JH4-T1
5.7.1 Observations under Repeated Cyclic Loading
±0.5 P1 (Pmax= +62.1 kN and Pmin= -61.7 kN)
No cracking was observed for either direction of loading.
±P1 (Pmax= +124.4 kN and Pmin = -124.8 kN)
A hairline crack was observed adjacent to the top of the jacket for the pull direction of
loading. It was felt however that this was not an actual crack in the concrete section at
that level, but rather a gap between the jacket top and the bottom of the upper column
segment due to slippage of the jacket with respect to the lower segment concrete core.
±1.5 P1 (Pmax= +187.2 kN and Pmin= -186.6 kN)
A faint, hairline crack at the interface between the footing and column base was noted for
both directions of loading.
3 cycles at 0.2% drift (Pmax= +226.2 kN and Pmin= -226.5 kN)
More significant cracking at the base of the column was observed for either loading
direction, with the crack extending to a depth of 100 mm from the extreme tension fiber.
3 cycles at 0.6% drift (Pmax= +335.8 kN and Pmin= -331.0 kN)
Flexural cracking in the upper column segment was noted at a height of 175-200 mm
above the top of the jacket during the first push and pull loading. An additional crack
approximately 225 mm above the jacket was noted during the third cycle pull. The crack
at the base of the column extended significantly at this drift, with the neutral axis depth
estimated to be 275 mm from the compression edge. The crack width at the base at the
extreme tension fiber was 2 mm. Possible incipient spalling at the compression toe of the
column below the jacket was noted.
185

3 cycles at 0.9% drift (Pmax= +364.0 kN and Pmin= -358.1 kN)
The neutral axis depth at the column base was estimated to be about 215 mm from the
compression edge and the crack width at the base approximately 3 mm. New cracks at
325 mm above the top of the jacket for the push direction, and 600 mm above the jacket
for the pull, were observed during the first cycle. Minor spalling of concrete at the
column compression toe was noted during the first cycle. The spalling in that region was
increased for the third cycle of loading.
3 cycles at 1.2% drift (Pmax= +380.2 kN and Pmin= -377.3 kN)
The neutral axis at the column base was observed to be approximately 170 mm from the
extreme compression fiber for both directions of loading. The width of the crack at the
footing level as measured at the extreme tension fiber, increased to 4–5 mm. Extension
of cracks in the upper column segment was noted during the first loading cycle. The
degree of concrete crushing below the jacket at the compression toe was increased over
that observed at 0.9% drift.
3 cycles at 1.6% drift (Pmax= +392.4 kN and Pmin= -392.6 kN)
Spalling at the base progressed around the circumference to a distance, as measured along
the section depth from the compression edge, of about 60-75 mm. The neutral axis at the
column base decreased to about 160 mm at this drift, and the crack width at the base was
approximately 6-7 mm. The crack opening at the footing level during the third pull, as
well as the spalled region below the jacket from the push direction of loading, are shown
in Figure 5.47.
3 cycles at 2.2% drift (Pmax= +404.8 kN and Pmin= -416.5 kN)
Minor extension of cracks in the upper column segment occurred. The neutral axis at the
base decreased slightly to around 150 mm and the base crack widened to 8-9 mm.
186

3 cycles at 3.0% drift (Pmax= +415.1 kN and Pmin= -428.9 kN)
Spalling below the toe of the jacket increased a little during cycles at this drift,
progressing around the circumference to a depth, as measured along the section
dimension from the compression edge, of 75-100 mm. The neutral axis depth decreased
slightly and the lift-off of the base of the column from the footing at the tension side
increased to around 12-13 mm.
3 cycles at 4.0% drift (Pmax= +419.7 kN and Pmin= -438.7 kN)
The neutral axis depth appeared to be unchanged at this drift. A base crack opening of
15-16 mm was observed at the tension edge. The gap between the toe of the jacket and
the top of the footing was reduced from the as-built value of 22 mm, to approximately 11
mm. Spalling along the circumference of the base of the column progressed to a depth
from the compression edge of about 125 mm. Figure 5.48 shows the damaged region
below the jacket at the compression toe for the third push at 4.0% drift. Slippage of the
jacket with respect to the core is visible in the photo: the bottom curvature rod, originally
at the center of the hole in the jacket, is nearly touching the top of the hole. The
downward slippage of the jacket was estimated to be on the order of 5 mm. A photo of
the column for the third pull to 4.0% drift is shown in Figure 5.49. The large crack
opening at the column base is visible, and the column appears to be rotated rigidly about
its compression toe.
Test End
Damage to the column was minimal at the end of the test, consisting of only the spalled
region of concrete below the jacket. A close-up photo of the damaged region below the
jacket is shown in Figure 5.50. The residual crack caused by the crushing of concrete in
that region is visible. No damage to the footing at the interface with the column base was
observed. Other than the flexural cracks detailed above, no damage occurred in the
upper, non-jacketed column segment. No inclination of the flexural cracks was observed,
and all cracks closed completely once the lateral force was removed. Fracture of strands
did not occur during the test. The observed column residual drift was 0.05%.
187

Figure 5.47 JH4 – Test 1 Crack at column base at 1.6% drift
Figure 5.48 JH4 – Test 1 Crack at column base and damaged region at 4.0% drift
188

Figure 5.49 JH4 – Test 1 Overall view of specimen at 4.0% drift
Figure 5.50 JH4 – Test 1 Close-up of damaged region below jacket at test end
189

5.7.2 Force – Displacement Response
The lateral force–displacement response for the first test of unit JH4 is displayed in
Figure 5.51. The force–displacement loops are symmetric and approximately equal
strengths were obtained for both directions of loading. As noted for specimen JH3 and as
characteristic of the unbonded design in general, the hysteresis loops are pinched near the
origin. The beginning of significant non-linear response occurred at about 300 kN, or
approximately 2.4 times the theoretical decompression force, P1. Peak strengths of 420
kN and –439 kN were achieved at the maximum imposed drift of 4.0% for the push and
pull directions of loading respectively.
-80 -40 0 40 80
Lateral Displacement (mm)
-500
-400
-300
-200
-100
0
100
200
300
400
500
Late
ral F
orce
(kN
)
-4 -3 -2 -1 0 1 2 3 4Drif t (%)
AnalyticalExperimental
Pull
Push
P
f 'c Ac = 0.196
Figure 5.51 JH4 – Test 1 Force-displacement response
190

The analytical force-displacement response envelope is shown along with the
experimental response in Figure 5.51. The analytical initial elastic stiffness matches well
the experimental. For drift levels around 0.5%, the analytical column strength is slightly
higher than the observed. At moderate to high drift levels, the column strength is well
predicted by the analytical model, with a maximum error of 7% at 4% drift. Acceptable
agreement is achieved in general for the entire column response.
The decrease of the initial loading stiffness of the column as a function of imposed drift
level is shown in Figure 5.52. At moderate drift levels, the stiffness had decreased by
approximately 50%, while at the maximum imposed drift of 4.0% the initial loading
stiffness was 35% of the original. The decrease in stiffness with increasing drift observed
for unit JH4 is almost identical to that for JH3.
0 1 2 3 4
Drif t (%)
20
30
40
50
60
70
Stif
fnes
s (kN
/mm
)
100
90
80
70
60
50
40
30
Perc
ent o
f O
rigin
al S
tiffn
ess (
%)
Figure 5.52 JH4 – Test 1 Initial loading stiffness versus drift
191

The hysteretic energy dissipation of the specimen, indicated by the area within the force-
displacement loops, was low for all drift levels. The calculated damping coefficient is
shown as a function of drift in Figure 5.53. It can be seen that the damping was
essentially constant throughout the test, averaging approximately 5%.
0 1 2 3 4
Drif t (%)
0
2
4
6
8
10
Equi
vale
nt V
isco
us D
ampi
ng (%
)
Figure 5.53 JH4 – Test 1 Equivalent viscous damping versus drift
5.7.3 Test Data
Profiles of strains measured in the steel jacket, transverse spiral, prestressing steel, and of
curvature along the column height are shown plotted as a function of drift in this section.
Again, the plots were constructed using data recorded at peak displacement during the
first cycle of loading and include data for cycles between 0.2% and 4.0% drift.
192

Column Curvature
Curvature along the column height is shown in Figure 5.54. Similar to that observed for
tests on specimen JH3, the column rotation was concentrated at the base of the column as
evidenced by the high curvatures there. Curvatures shown at approximately 460 mm
above the footing are significantly higher for the push direction than the pull direction of
loading. This discrepancy was caused by slippage of the north linear potentiometer at
that level during early stages of testing. The curvatures at 330 mm above the footing are
noticeably higher for the pull direction of loading. This was also caused by slippage of
the curvature measuring instrumentation at that level. As was explained for specimen
JH3, it is believed that the curvatures shown at the base are higher than actual due to the
discontinuity of the section there. Thus, the curvature profiles as shown give more of a
qualitative than quantitative measure of column curvature. When profiles for the first test
of JH3 and JH4 are compared, it can be seen that almost identical curvatures were
measured at the column base. Since the curvatures and observed neutral axis depths for
the two tests are similar, concrete compressive strains at the base of JH4 should be of the
same magnitude as that calculated for specimen JH3. The predicted longitudinal
compressive strain at the extreme fiber of the critical section was 0.019. This value is
lower than the experimental value of 0.030 calculated for the first test of specimen JH3 in
Section 5.5.3, but is reasonable in light of uncertainties regarding the estimated neutral
axis and the calculated curvature from the experimental data.
Prestressing Steel Strain
Figure 5.55 shows the analytical and experimental tendon strain increase. It can be seen
that the predicted curve overestimates the incremental tendon strain increase, with errors
greater than 20% except at drifts of 3.0% and 4.0%. It is found that the error does not
significantly affect the predicted response of the column since the prestress force increase
associated with the strain increase is but a small fraction of the total vertical load acting
on the column. As illustrated previously, the analytical model adequately predicted the
force-displacement response of the column despite the tendon strain increase error. It is
envisioned that for typical axial load and initial prestress force levels, the theoretical
193

response should be relatively insensitive to even considerable errors in the predicted
prestress force increase. Over prediction of the strain increase implies that the neutral
axis depth is underestimated by the analytical model (see Eq. 2.16).
-0.0003 -0.0002 -0.0001 0 0.0001 0.0002 0.0003
Curvature (mm-1)
0
400
800
1200
Col
umn
Hei
ght (
mm
)
g f e d c b a a b c d e f g
a drift = 0.6%b drift = 0.9%c drift = 1.2%d drift = 1.6%e drift = 2.2%f drift = 3.0%g drift = 4.0%
Pull Push
Figure 5.54 JH4 – Test 1 Curvature along column height
Steel Jacket Strain
Hoop strains in the steel jacket at the north and south generators are shown in Figures
5.56 and 5.57, respectively. The strain gage mounted at the top of the jacket at the north
side did not function properly and was not used in the strain profile. The strain profiles
are similar to those observed for specimen JH3, with increasing hoop strain down the
height of the jacket. Higher strains near the toe of the jacket are expected since the larger
concrete longitudinal compressive strains at the column compression toe cause greater
dilation of concrete. Significant increases in strain from one drift level to the next were
observed, starting at 1.6% drift. The maximum observed strains at the base of the jacket
were on the order of several times the yield strain. Hoop strains at a height of 175 mm on
194

the jacket were significantly higher for the push direction of loading than the pull. Upon
inspection of the data, it was found that the north gage at that location read around 2000
µε prior to the start of the test. Similar readings for the north and south gages are
obtained if the north gage is biased by the above amount.
The jacket hoop strains measured at the east and west generators are shown in Figures
5.58 and 5.59, respectively. In general, the strains increase down the height of the jacket,
due to the confining effect of the jacket near the base. The maximum strains are below
the yield strain of the material and are slightly higher than those observed for the thinner
jacket of specimen JH3. The vertical strains at the east and west sides of the jacket are
shown in Figures 5.60 and 5.61. High compressive strains, well above the material yield,
for the east gage at 175 mm above the bottom of the jacket are believed to be spurious
and not representative of the actual jacket strain.
Transverse Spiral Strains
Strain profiles for the transverse reinforcement in the upper column segment for the
north, south, east and west generators are shown in Figures 5.62, 5.63, 5.64, and 5.65,
respectively. The hoop strains increase down the height of the segment at the north
generator for the push direction and at the south generator for the pull direction.
Maximum strains for the north and south sides occur near the bottom of the segment at a
drift of 4.0% and are on the order of 800-900 µε. The maximum strains are well below
the material yield strain of approximately 2200 µε. Strains at the north generator for the
pull, and south generator for the push, are low since the concrete is not dilated on the
tension side of the section. Hoop strains at the east and west sides of the column are
minimal because the column shear is carried by the horizontal component of the diagonal
compression strut formed between the column top and column compression toe.
195

-4 -2 0 2 4
Drif t (%)
0
500
1000
1500
2000
Stra
in In
crea
se (m
icro
stra
in)
PredictedExperimental
Figure 5.55 JH4 – Test 1 Predicted and experimental tendon strain increase
196

0 1000 2000 3000 4000
Strain (microstrain)
0
200
400
600
Hei
ght o
n Ja
cket
(mm
)0 1000 2000 3000 4000
Strain (microstrain)
0
200
400
600
Hei
ght o
n Ja
cket
(mm
)
PULL DIRECTIONPUSH DIRECTION
0.2%0.6%0.9%1.2%1.6%2.2%3.0%4.0%
0.2%0.6%0.9%1.2%1.6%2.2%3.0%4.0%
Figure 5.56 JH4 – Test 1 Jacket hoop strain at north generator
0 2000 4000 6000 8000
Strain (microstrain)
0
200
400
600
Hei
ght o
n Ja
cket
(mm
)
0 2000 4000 6000
Strain (microstrain)
0
200
400
600
Hei
ght o
n Ja
cket
(mm
)
PULL DIRECTIONPUSH DIRECTION
0.2%0.6%0.9%1.2%1.6%2.2%3.0%4.0%
0.2%0.6%0.9%1.2%1.6%2.2%3.0%4.0%
Figure 5.57 JH4 – Test 1 Jacket hoop strains at south generator
197

0 400 800 1200
Strain (microstrain)
0
200
400
600
Hei
ght o
n Ja
cket
(mm
)0 400 800 1200
Strain (microstrain)
0
200
400
600
Hei
ght o
n Ja
cket
(mm
)
PULL DIRECTIONPUSH DIRECTION
0.2%0.6%0.9%1.2%1.6%2.2%3.0%4.0%
0.2%0.6%0.9%1.2%1.6%2.2%3.0%4.0%
Figure 5.58 JH4 – Test 1 Jacket hoop strains at east generator
-800 -400 0 400 800 1200
Strain (microstrain)
0
200
400
600
Hei
ght o
n Ja
cket
(mm
)
-800 -400 0 400 800 1200
Strain (microstrain)
0
200
400
600
Hei
ght o
n Ja
cket
(mm
)
PULL DIRECTIONPUSH DIRECTION
0.2%0.6%0.9%1.2%1.6%2.2%3.0%4.0%
0.2%0.6%0.9%1.2%1.6%2.2%3.0%4.0%
Figure 5.59 JH4 – Test 1 Jacket hoop strains at west generator
198

-5000 -4000 -3000 -2000 -1000 0 1000
Strain (microstrain)
0
200
400
600
Hei
ght o
n Ja
cket
(mm
)-5000 -4000 -3000 -2000 -1000 0 1000
Strain (microstrain)
0
200
400
600
Hei
ght o
n Ja
cket
(mm
)
PULL DIRECTIONPUSH DIRECTION
0.2%0.6%0.9%1.2%1.6%2.2%3.0%4.0%
0.2%0.6%0.9%1.2%1.6%2.2%3.0%4.0%
Figure 5.60 JH4 – Test 1 Jacket vertical strains at east generator
-400 -200 0 200 400 600
Strain (microstrain)
0
200
400
600
Hei
ght o
n Ja
cket
(mm
)
-400 -200 0 200 400 600
Strain (microstrain)
0
200
400
600
Hei
ght o
n Ja
cket
(mm
)
PULL DIRECTIONPUSH DIRECTION
0.2%0.6%0.9%1.2%1.6%2.2%3.0%4.0%
0.2%0.6%0.9%1.2%1.6%2.2%3.0%4.0%
Figure 5.61 JH4 – Test 1 Jacket vertical strains at west generator
199

-100 0 100 200
Strain (microstrain)
600
800
1000
1200
1400
Hei
ght A
bove
Foo
ting
(mm
)0 200 400 600 800 1000
Strain (microstrain)
600
800
1000
1200
1400
Hei
ght A
bove
Foo
ting
(mm
)
PULL DIRECTIONPUSH DIRECTION
0.2%0.6%0.9%1.2%1.6%2.2%3.0%4.0%
0.2%0.6%0.9%1.2%1.6%2.2%3.0%4.0%
Figure 5.62 JH4 – Test 1 Spiral strains at north generator
0 200 400 600 800 1000
Strain (microstrain)
600
800
1000
1200
1400
Hei
ght A
bove
Foo
ting
(mm
)
-100 -50 0 50 100 150 200
Strain (microstrain)
600
800
1000
1200
1400
Hei
ght A
bove
Foo
ting
(mm
)
PULL DIRECTIONPUSH DIRECTION
0.2%0.6%0.9%1.2%1.6%2.2%3.0%4.0%
0.2%0.6%0.9%1.2%1.6%2.2%3.0%4.0%
Figure 5.63 JH4 – Test 1 Spiral strains at south generator
200
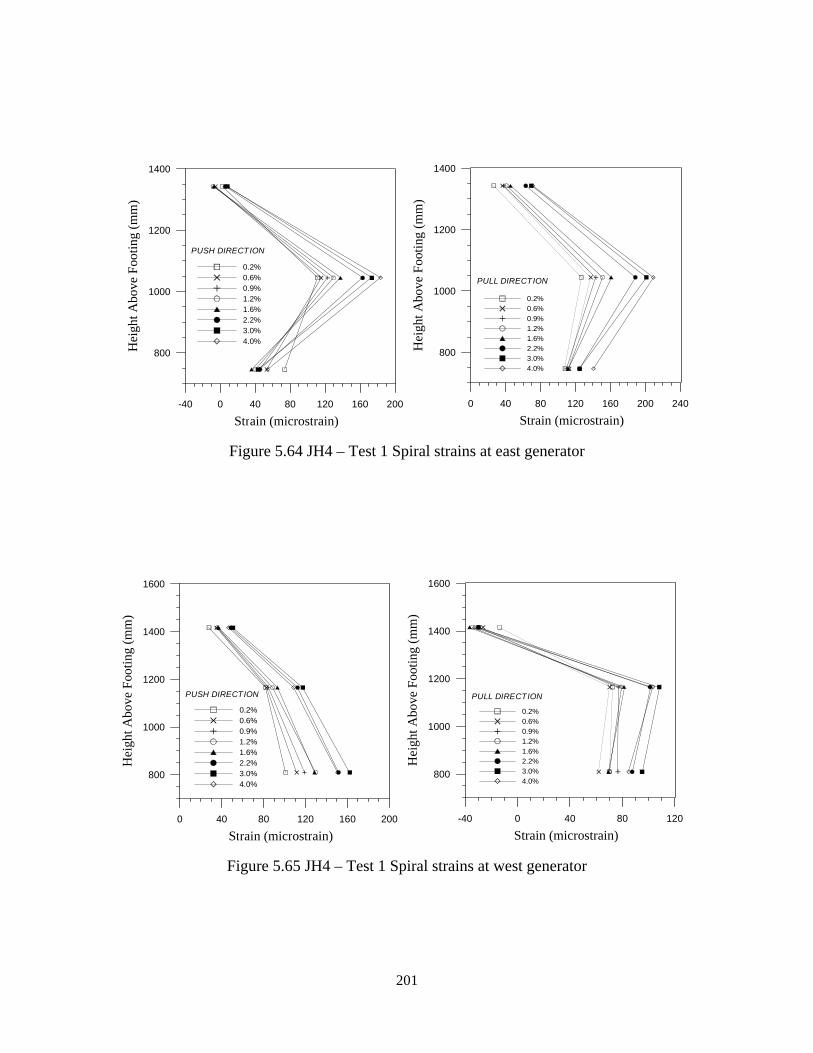
0 40 80 120 160 200 240
Strain (microstrain)
800
1000
1200
1400
Hei
ght A
bove
Foo
ting
(mm
)-40 0 40 80 120 160 200
Strain (microstrain)
800
1000
1200
1400
Hei
ght A
bove
Foo
ting
(mm
)
PULL DIRECTION
PUSH DIRECTION
0.2%0.6%0.9%1.2%1.6%2.2%3.0%4.0%
0.2%0.6%0.9%1.2%1.6%2.2%3.0%4.0%
Figure 5.64 JH4 – Test 1 Spiral strains at east generator
-40 0 40 80 120
Strain (microstrain)
800
1000
1200
1400
1600
Hei
ght A
bove
Foo
ting
(mm
)
0 40 80 120 160 200
Strain (microstrain)
800
1000
1200
1400
1600
Hei
ght A
bove
Foo
ting
(mm
)
PULL DIRECTIONPUSH DIRECTION
0.2%0.6%0.9%1.2%1.6%2.2%3.0%4.0%
0.2%0.6%0.9%1.2%1.6%2.2%3.0%4.0%
Figure 5.65 JH4 – Test 1 Spiral strains at west generator
201

5.8 Experimental Results – Specimen JH4-T2
5.8.1 Observations under Repeated Cyclic Loading
The planned loading sequence after epoxy grouting the base crack and re-stressing to the
higher force level called for one cycle each to be performed in force control at one-half,
one, and one-and-a-half times the theoretical force to cause decompression of the extreme
tension fiber at the critical section (P1). After switching to displacement control, three
cycles were to then be performed at twice the decompression force. The displacements
observed during the first cycle at 1.5 x P1 however, were larger than those predicted for
the next target level of 2 x P1. It was thus decided to switch to displacement control after
the first cycle at 1.5 x P1 and then perform two more cycles at that level.
A problem with the actuator control system was noticed at -1.5 x P1, and the test was
paused. A faulty connection between the controller and the actuator was discovered and
fixed. Upon reloading during the second cycle, it was immediately noticed on the x-y
chart recorder that the column stiffness had increased significantly. This was not
expected and thus the test was paused a second time to recheck the controls system. It
was determined that prior to fixing the bad connection, the force readings indicated for
the actuator were lower than actual. Thus, two more cycles were performed at a drift
equal to that observed for the first cycle. Forces indicated below for cycles at 0.5 x P1,
and P1 are likely lower than the actual force applied to the specimen
±0.5 P1 (Pmax= +72.8 kN and Pmin= -73.5 kN)
No cracking was observed for either direction of loading.
±P1 (Pmax= +145.0 kN and Pmin = -145.5 kN)
Cracking at the base of the column was noted for both the push and pull directions. The
crack extended approximately 125 mm into the section from the extreme tension fiber.
202

3 cycles at 0.34% drift (Pmax= 258.4 kN and Pmin= -260.4 kN)
The base crack extended to about 225 mm from the tension edge for cycles at this drift
3 cycles at 0.6% drift (Pmax= +328.8 kN and Pmin= -339.2 kN)
The crack at the base of the column extended to mid-depth of the section. In the upper
column segment, flexural cracking 225 mm above the jacket at locations of previous
cracks (from the first test) was observed during both the first push and pull loading.
3 cycles at 0.9% drift (Pmax= +377.3 kN and Pmin= -384.0 kN)
Minor extension of cracks in the upper segment was observed, while the base crack
extended to a distance of 230 mm from the compression edge. The crack opening at the
column base at the tension edge was 2-3 mm.
It was at this drift level that spalling below the jacket at the compression toe was
observed during the first test of specimen JH4. For this the second test however, the
compression toe below the jacket at the column base had been repaired by epoxy
injection of the residual crack and the extreme compression fiber consisted of epoxy
rather than concrete. Thus, it was not possible to discern the state of the concrete within
the region of the repair.
3 cycles at 1.2% drift (Pmax= +410.1 kN and Pmin= -413.4 kN)
Spalling of concrete below the jacket at approximately 150 mm from the compression
edge was observed at this drift. Note that the location where the crushing was observed
coincided with the point where the epoxy repair ended and “good” (or undamaged
concrete from the first test) concrete began. The depth to the neutral axis from the
extreme compression fiber was on the order of 210 mm. The crack width at the base was
noted to be 4-5 mm.
203

3 cycles at 1.6% drift (Pmax= +437.2 kN and Pmin= -439.5 kN)
The neutral axis depth continued to decrease; measuring approximately 185 mm. Lift-off
of the column base at the tension edge was 6 mm.
3 cycles at 2.2% drift (Pmax= +459.9 kN and Pmin= -465.3 kN)
The neutral axis and crack width at the column base were approximately 160 mm (from
the compression edge) and 9 mm respectively. Crushing of the epoxy at the column
compression toe was noted.
3 cycles at 3.0% drift (Pmax= +471.5 kN and Pmin= -484.0 kN)
A reduction in the depth of the neutral axis to 125-150 mm was noted. The base crack
width was approximately 12-13 mm. Slippage of the jacket with respect to the core
concrete was noticed at the bottom south curvature rod location where the jacket was
observed to be bearing on the top of the rod.
3 cycles at 4.0% drift (Pmax= +479.1 kN and Pmin= -492.4 kN)
The lift-off of the bottom of the column from the footing top at the tension edge was
around 17 mm. The depth to the neutral axis remained unchanged. At the compression
toe, the gap between the jacket and the footing was reduced to 9 mm for the push
direction and to about 12 mm for the pull direction.
3 cycles at 5.0% drift (Pmax= +475.5 kN and Pmin= -493.3 kN)
The neutral axis depth again appeared unchanged while the crack at the base widened to
about 21 mm. A slight decrease in the gap width between the jacket toe and the top of
the footing at the compression side was observed for both directions of loading.
3 cycles at 6.0% drift (Pmax= +467.1 kN and Pmin= -490.6 kN)
The crack opening at the column base increased to approximately 25 mm at the extreme
tension fiber. The jacket was observed to be nearly touching the top of the footing at the
column compression toe, with the gap there reduced to around 5 mm. The wide crack
204

opening at the footing level associated with the rotation of the column about its
compression toe is visible as well.
Test End
As was the case for the first test of specimen JH4, the damage to the column was
concentrated at the column base below the jacket where high longitudinal compression
strains that developed caused concrete crushing. No spalling was observed in the upper,
non-jacketed column segment. Cracks in the upper column segment showed no
inclination and closed completely after testing was complete. No damage to the footing
at the interface with the column base was observed. Fracture of the prestressing steel did
not occur. The residual drift of the system was 0.1%.
205

5.8.2 Force – Displacement Response
The lateral force–displacement response for the second test of specimen JH4 is displayed
in Figure 5.66. The force-displacement loops are symmetric and approximately equal
strengths were obtained for both directions of loading. The beginning of significant non-
linear response occurred at about 325 kN, a force level corresponding to 2.2 times the
theoretical force to cause decompression at the column base. The peak column strength
for the push direction of loading was 480 kN and occurred at a drift of 4.0%. For the pull
loading direction, a maximum strength of 490 kN was achieved at a drift level of 5.0%.
Little strength degradation occurred during cycles at higher drift levels, with a drop in
strength of only 0.5% and 2.5% observed at the maximum imposed drift of 6.0% for the
push and pull directions, respectively.
-120 -80 -40 0 40 80 120
Lateral Displacement (mm)
-500
-400
-300
-200
-100
0
100
200
300
400
500
Late
ral F
orce
(kN
)
-6 -5 -4 -3 -2 -1 0 1 2 3 4 5 6Drif t (%)
AnalyticalExperimental
Pull
Push
P
f'c Ac = 0.234
indicates f ailure basedon reaching εcu
Figure 5.66 JH4 – Test 2 Experimental force-displacement response
206

The analytical force-displacement response envelope is shown along with the
experimental in Figure 5.66. Similar to what was observed for the second tests of other
units, the initial stiffness of the specimen is not well predicted. This is again attributed to
the fact the column had already been tested, and the repair measures did not restore the
column to a damage free state. The match between the predicted and experimental
strength at moderate drifts is good, with predicted strengths within about 3% of the
observed. At higher drifts, the predicted response deviates more significantly for the
push loading direction with column strength overestimated by 7% at the maximum
imposed drift of 6.0%. The slight difference in strength between the two directions of
loading did not appear to be caused by eccentricity of the applied axial load, as was the
case for other tests. In general, the analytical and experimental curves correlate well.
The initial loading stiffness of the specimen for both the first and second test is shown in
Figure 5.67 as a function of imposed drift. The epoxy grouting of the base crack after the
first test restored the stiffness of the column to approximately 70% of that observed for
the first test. At drifts of 1.6% and 2.2%, the stiffness was identical to that observed
during the first test, while at higher drifts, the initial stiffness for the second test was
actually higher than the first. Deterioration of the column stiffness at high drifts was not
as significant as that observed for the second test of specimen JH3. At the maximum
imposed drift of 6.0%, the stiffness of specimen JH3 had decreased to less than 10% of
its original value, while that for JH4 had decreased to 40% of the original stiffness. This
is likely due to the higher level of confinement at the column base provided by the thicker
jacket of specimen JH4.
The hysteretic energy dissipation of the specimen was low for all levels of drift. The
equivalent viscous damping ratios calculated for each drift level are shown in Figure
5.68. It can be seen that the hysteretic damping was approximately constant, increasing
only slightly from around 4% for low drifts, to 5% for the higher drift levels. The
damping ratios calculated for the first test of specimen JH4 are also shown in the figure.
The system damping was approximately the same for both tests.
207

0 2 4 6
Drif t (%)
10
20
30
40
50
60
70
Stif
fnes
s (kN
/mm
)
100
90
80
70
60
50
40
30
Perc
ent o
f O
rigin
al S
tiffn
ess (
%)
Test 1Test 2
Figure 5.67 JH4 – Test 2 Initial loading stiffness versus drift
0 2 4 6
Drif t (%)
0
2
4
6
8
10
Equi
vale
nt V
isco
us D
ampi
ng (%
)
Test 1Test 2
Figure 5.68 JH4 – Test 2 Equivalent viscous damping versus drift
208

5.8.3 Test Data
Strain and curvature profile plots are presented in this section. The profiles shown are for
drifts between 0.34% and 6.0% unless noted otherwise.
Column Curvature
Curvature along the height of the column is shown in Figure 5.69. Curvatures at 6.0%
drift are not shown since the linear potentiometers did not possess enough displacement
capacity in either compression or tension. The curvature is noted to be high at the bottom
of the column where the wide crack formed as the column displaced laterally. The
observed curvatures are nearly identical to those observed during the first test. It is again
mentioned that the actual curvatures at the base are likely lower than the calculated, as
explained previously. An approximate value for the concrete strain at the compression
edge is calculated as:
εc = 0.8 φave c = 0.8 (0.00034 mm-1) 135 mm = 0.038
where φave is the average of curvatures calculated for the push and pull direction at 5.0%
drift, c is the observed neutral axis distance from the compression edge at the base of the
column and the 0.8 is to account for the curvature being overestimated as described
previously. The predicted extreme fiber concrete compression strain at 5.0% drift was
0.026.
Prestressing Steel Strain
The predicted incremental tendon strain for the second test is shown along with the
experimental in Figure 5.70. In general, analytical prediction overestimated the tendon
strain increase. Despite the observed error, the model gives an acceptable approximation
to the actual behavior since as stated previously, the predicted column force-displacement
response should be fairly insensitive to errors in the predicted prestress force. Again, the
over prediction of strain increase implies an under prediction of neutral axis depth.
209

-0.0004 -0.0002 0 0.0002 0.0004
Curvature (mm-1)
0
400
800
1200
Col
umn
Hei
ght (
mm
)
h g f e d c b a a b c d e f g h
a drift = 0.6%b drift = 0.9%c drift = 1.2%d drift = 1.6%e drift = 2.2%f drift = 3.0%g drift = 4.0%h drift = 5.0%
Pull Push
Figure 5.69 JH4 – Test 2 Curvature along column height
Steel Jacket Strain
Hoop strains in the steel jacket at the north, south, east and west generators are shown in
Figures 5.71, 5.72, 5.73, and 5.74, respectively. The hoop strains are seen to be
increasing down the height of the jacket. The high hoop strains near the toe of the jacket
at the north and south generators are caused by dilation of the concrete core due to
localized high compressive strains in the concrete. The maximum strains at the base
were observed at a drift of 6.0% and were approximately 9000 µε and 15,000 µε at the
north and south sides of the jacket. These levels of strain are significantly higher than the
material yield strain of around 1500 µε, and slightly lower than those observed during the
second test of specimen JH3. Strains at the east and west generators are higher near the
base due to the influence of the confining action of the jacket on the compressed concrete
at the north/south generators. The strains are on the order of the material yield strain and
are similar in magnitude to those observed for the second test of specimen JH3. The
vertical strains in the jacket at the east and west sides of the column are shown in Figures
210

5.75 and 5.76, respectively. The strains are in general, compressive in nature and higher
near the base. Considerably higher strains at the jacket toe are noted for the east
generator.
Transverse Spiral Strains
Figures 5.77 through 5.80 illustrate the hoop strains in the spiral reinforcement of the
upper column segment. The highest strains are at the base of the segment and are not
much higher than those observed for the first test and are well below the yield strain.
Thus, the spiral was not fully activated by dilation of the concrete at the compressive
faces of the segment. The strains at the east and west faces of the segment are low,
indicating that the column shear was carried primarily by the horizontal component of the
diagonal concrete compression strut.
-4 0 4
Drif t (%)
0
1000
2000
3000
Stra
in In
crea
se (m
icro
stra
in)
PredictedExperimental
Figure 5.70 JH4 – Test 2 Predicted and experimental tendon strain increase
211

0 2000 4000 6000 8000
Strain (microstrain)
0
200
400
600
Hei
ght o
n Ja
cket
(mm
)0 2000 4000 6000 8000 10000
Strain (microstrain)
0
200
400
600
Hei
ght o
n Ja
cket
(mm
)
PULL DIRECTIONPUSH DIRECTION
0.34%0.6%0.9%1.2%1.6%2.2%3.0%4.0%5.0%6.0%
0.34%0.6%0.9%1.2%1.6%2.2%3.0%4.0%5.0%6.0%
Figure 5.71 JH4 – Test 2 Jacket hoop strain at north generator
0 4000 8000 12000 16000
Strain (microstrain)
0
200
400
600
Hei
ght o
n Ja
cket
(mm
)
0 4000 8000 12000
Strain (microstrain)
0
200
400
600
Hei
ght o
n Ja
cket
(mm
)
PULL DIRECTIONPUSH DIRECTION
0.6%0.9%1.2%1.6%2.2%3.0%4.0%5.0%6.0%
0.6%0.9%1.2%1.6%2.2%3.0%4.0%5.0%6.0%
Figure 5.72 JH4 – Test 2 Jacket hoop strain at south generator
212

-400 0 400 800 1200 1600
Strain (microstrain)
0
200
400
600
Hei
ght o
n Ja
cket
(mm
)-400 0 400 800 1200 1600 2000
Strain (microstrain)
0
200
400
600
Hei
ght o
n Ja
cket
(mm
)
PULL DIRECTIONPUSH DIRECTION
0.34%0.6%0.9%1.2%1.6%2.2%3.0%4.0%5.0%6.0%
0.34%0.6%0.9%1.2%1.6%2.2%3.0%4.0%5.0%6.0%
Figure 5.73 JH4 – Test 2 Jacket hoop strain at east generator
-1000 0 1000 2000
Strain (microstrain)
0
200
400
600
Hei
ght o
n Ja
cket
(mm
)
-1000 -500 0 500 1000 1500 2000
Strain (microstrain)
0
200
400
600
Hei
ght o
n Ja
cket
(mm
)
PULL DIRECTIONPUSH DIRECTION0.34%0.6%0.9%1.2%1.6%2.2%3.0%4.0%5.0%6.0%
0.34%0.6%0.9%1.2%1.6%2.2%3.0%4.0%5.0%6.0%
Figure 5.74 JH4 – Test 2 Jacket hoop strain at west generator
213

-1600 -1200 -800 -400 0 400
Strain (microstrain)
0
200
400
600
Hei
ght o
n Ja
cket
(mm
)-1600 -1200 -800 -400 0 400
Strain (microstrain)
0
200
400
600
Hei
ght o
n Ja
cket
(mm
)
PULL DIRECTIONPUSH DIRECTION
0.34%0.6%0.9%1.2%1.6%2.2%3.0%4.0%5.0%6.0%
0.34%0.6%0.9%1.2%1.6%2.2%3.0%4.0%5.0%6.0%
Figure 5.75 JH4 – Test 2 Jacket vertical strain at east generator
-600 -400 -200 0 200 400 600
Strain (microstrain)
0
200
400
600
Hei
ght o
n Ja
cket
(mm
)
-800 -400 0 400 800
Strain (microstrain)
0
200
400
600
Hei
ght o
n Ja
cket
(mm
)
PULL DIRECTIONPUSH DIRECTION
0.34%0.6%0.9%1.2%1.6%2.2%3.0%4.0%5.0%6.0%
0.34%0.6%0.9%1.2%1.6%2.2%3.0%4.0%5.0%6.0%
Figure 5.76 JH4 – Test 2 Jacket vertical strain at west generator
214

-600 -400 -200 0 200 400
Strain (microstrain)
600
800
1000
1200
1400
Hei
ght A
bove
Foo
ting
(mm
)-400 0 400 800 1200
Strain (microstrain)
600
800
1000
1200
1400
Hei
ght A
bove
Foo
ting
(mm
)
PULL DIRECTIONPUSH DIRECTION0.34%0.6%0.9%1.2%1.6%2.2%3.0%4.0%5.0%6.0%
0.34%0.6%0.9%1.2%1.6%2.2%3.0%4.0%5.0%6.0%
Figure 5.77 JH4 – Test 2 Spiral strains at north generator
0 200 400 600 800
Strain (microstrain)
700
800
900
1000
1100
1200
1300
Hei
ght A
bove
Foo
ting
(mm
)
0 40 80 120 160
Strain (microstrain)
700
800
900
1000
1100
1200
1300
Hei
ght A
bove
Foo
ting
(mm
)
PULL DIRECTIONPUSH DIRECTION0.34%0.6%0.9%1.2%1.6%2.2%3.0%4.0%5.0%6.0%
0.34%0.6%0.9%1.2%1.6%2.2%3.0%4.0%5.0%6.0%
Figure 5.78 JH4 – Test 2 Spiral strains at south generator
215

0 100 200 300 400
Strain (microstrain)
600
800
1000
1200
1400
Hei
ght A
bove
Foo
ting
(mm
)0 100 200 300 400
Strain (microstrain)
600
800
1000
1200
1400
Hei
ght A
bove
Foo
ting
(mm
)
PULL DIRECTIONPUSH DIRECTION
0.34%0.6%0.9%1.2%1.6%2.2%3.0%4.0%5.0%6.0%
0.34%0.6%0.9%1.2%1.6%2.2%3.0%4.0%5.0%6.0%
Figure 5.79 JH4 – Test 2 Spiral strains at east generator
-1200 -800 -400 0 400
Strain (microstrain)
800
1000
1200
1400
Hei
ght A
bove
Foo
ting
(mm
)
-1200 -800 -400 0 400
Strain (microstrain)
800
1000
1200
1400
Hei
ght A
bove
Foo
ting
(mm
)
PULL DIRECTIONPUSH DIRECTION
0.34%0.6%0.9%1.2%1.6%2.2%3.0%4.0%5.0%6.0%
0.34%0.6%0.9%1.2%1.6%2.2%3.0%4.0%5.0%6.0%
Figure 5.80 JH4 – Test 2 Spiral strains at west generator
216

5.9 Discussion of Results
The seismic design and experimental testing of two low aspect ratio precast segmental
bridge columns were presented in this chapter. Each test unit was reinforced
longitudinally with an unbonded prestressing tendon and was tested a first time under a
given level of total prestress force. After the first test, both units were repaired by epoxy
grouting the base crack and then restressed to a higher tendon force level. Unit JH4 used
a jacket thickness approximately twice that used in JH3. A comparison of the
performance of the specimens is given in this section.
Figure 5.81 shows the force-displacement response envelopes for the two tests of test unit
JH3. It can be seen the maximum observed strength for the second test was only 10%
higher than the maximum strength of first test. The prestress force was however 32 %
higher for the second test. The drop in strength from 3.0% drift to 4.0% drift was more
significant for the second test because of the higher axial load level. The experimental
force-displacement response curves for the first and second test of unit JH4 are shown in
Figure 5.82. An increase in the maximum strength over that observed for the first test of
approximately 13% was observed for the second test. Similar to JH3, the second test
total prestress force for JH4 was 32% higher than the first test.
The force-displacement response of the first test of unit JH3 is compared with that for
JH4 in Figure 5.83. The responses of the columns are very similar and only at high drifts,
where the strength of JH4 is slightly higher than JH3, do the envelopes deviate
appreciably. The strength of JH3 peaked at about 3.0% drift while for specimen JH4, the
maximum strength was attained at the maximum imposed drift of 4.0%. Figure 5.84
gives a comparison of the second test force-displacement envelopes for JH3 and JH4.
Despite having an approximately equal total prestress force, the maximum strength
achieved for specimen JH4 was approximately 8% higher than that for JH3. Similar to
the first test, the strength of specimen JH3 reached a maximum at 3.0% drift while the
maximum strength for JH4 occurred at 4.0% drift. The above may be attributed to the
higher confinement level provided at the critical section by the thicker jacket of unit JH4.
217

The increased confinement would provide for greater confined concrete strengths, thus
increasing the column strength, and enable higher compression strains to be sustained
without significant concrete strength deterioration. Similar to that concluded in Section
4.9 for the high aspect ratio columns, the thinner jacket used in JH3 may be sufficient for
drifts on the order of 3.0%. For higher drifts, a confinement level equal to that provided
by the thicker jacket of JH4 may ensure good performance.
Comments regarding the force-displacement response predictions for low aspect ratio test
units JH3 and JH4 are similar to those presented in Section 4.9 for the high aspect ratio
test units JH1 and JH2. The agreement between the analytical and experimental force-
displacement response curves was in general, good. Slight differences between the
curves might be due to errors in the initial prestress force value used in the moment-
curvature analysis for each unit and test.
Both columns performed well overall. Both exhibited stable response up to the
maximum imposed drift of 4.0% for the first tests. Specimen JH4 performed better than
JH3 for the second test due to the higher level of confinement at the critical section. No
spalling of concrete was observed in the non-jacketed upper column segment of either
specimen. Shear induced strains in the transverse spiral reinforcement were low for all
tests, and no inclinations of the flexural cracks were observed. Thus, the column shear
strength was provided by the horizontal component of the diagonal compression strut of
the column. Damage to both columns was minimal, even after imposed drifts of 5.0%
and 6.0%. As was observed for tests on the high aspect ratio columns, the measured
residual column drift was low, and equal to less than 0.2% for all four tests.
218

-120 -100 -80 -60 -40 -20 0 20 40 60 80 100 120
Lateral Displacement (mm)
-500
-400
-300
-200
-100
0
100
200
300
400
500
Late
ral F
orce
(kN
)
JH3 - Test 1JH3 - Test 2
-6 -5 -4 -3 -2 -1 0 1 2 3 4 5 6Drif t (%)
Axial Load Ratio:Test 1 = 0.192Test 2 = 0.233
Figure 5.81 JH3 Test 1 and 2 force-displacement response comparison
-120 -100 -80 -60 -40 -20 0 20 40 60 80 100 120
Lateral Displacement (mm)
-500
-400
-300
-200
-100
0
100
200
300
400
500
Late
ral F
orce
(kN
)
JH4 - Test 1JH4 - Test 2
-6 -5 -4 -3 -2 -1 0 1 2 3 4 5 6Drif t (%)
Axial Load Ratio:Test 1 = 0.196Test 2 = 0.234
Figure 5.82 JH4 Test 1 and 2 force-displacement response comparison
219

-80 -60 -40 -20 0 20 40 60 8
Lateral Displacement (mm)0
-500
-400
-300
-200
-100
0
100
200
300
400
500
Late
ral F
orce
(kN
)
JH3 - Test 1JH4 - Test 1
-4 -3 -2 -1 0 1 2 3 4Drif t (%)
Axial Load Ratio:JH3 = 0.192JH4 = 0.196
Figure 5.83 JH3 and JH4 Test 1 force-displacement response comparison
-120 -100 -80 -60 -40 -20 0 20 40 60 80 100 120
Lateral Displacement (mm)
-500
-400
-300
-200
-100
0
100
200
300
400
500
Late
ral F
orce
(kN
)
JH3 - Test 2JH4 - Test 2
-6 -5 -4 -3 -2 -1 0 1 2 3 4 5 6Drif t (%)
Axial Load Ratio:JH3 = 0.233JH4 = 0.234
Figure 5.84 JH3 and JH4 Test 2 force-displacement response comparison
220
CHAPTER 6 CONCLUSIONS AND DESIGN
RECOMMENDATIONS
6.1 Overview
This research involved the analytical and experimental investigation of the performance
of unbonded post-tensioned precast concrete segmental bridge columns under lateral
earthquake loading. Four large-scale columns were constructed in a laboratory setting
and tested under increasing cyclic fully reversed loads/displacements simulating seismic
input. The columns were constructed by stacking precast segments on top of each other
and then post-tensioning the assembly with vertical prestressing steel located at the center
of the column cross-section. The bottom segment in each column was encased in a steel
jacket while the segments above were reinforced with conventional spiral reinforcement.
The column tendons were unbonded for all tests. In the first phase of the research, two
high aspect ratio columns with identical prestressing steel reinforcement but different
jacket thickness were tested. Specimens with similar details but of a lower aspect ratio
were tested in the second phase of the project. Each specimen was tested twice, the first
time with a low-moderate initial prestress force and a second time with a higher tendon
prestress level.
6.2 Summary of Test Results and Conclusions
With the exception of specimen JH1, each of the test units achieved a drift of 4.0%
during the first test with little or no degradation of strength. For JH1, significant spalling
of cover concrete above the steel jacket initiated at 3.0% drift, and the test was therefore
stopped at that level. All test units behaved in a ductile manner, exhibiting nonlinear
response while having negligible residual displacement after the tests. Measured residual
column drifts were on the order of 0.10%, except for unit JH2 that had 0.3% residual drift
at test end. The low residual drift resulted from the high total vertical force on the
column (prestress force plus applied dead load), which provided a large recentering or
restoring force. Since the tendons were unbonded, inelastic straining of the tendon did
221

not occur and the original prestress force was maintained. The observed damage during
the first tests of JH1 and JH2 was greater than anticipated. In addition to the expected
concrete crushing below the jacket toe, unexpected spalling of cover concrete occurred in
the non-jacketed segments directly above the steel jackets to a height of 300mm above
the top of the jacket. The steel jackets should thus have extended higher up on the
columns. The damage to units JH3 and JH4 was low for the first test. Only minor
crushing of concrete at the gap between the top of the footing and bottom of the jacket
occurred. No spalling was observed in the upper non-jacketed column segments of those
columns. All cracks observed during testing remained horizontal (i.e., no inclined
flexure-shear cracks were observed), indicating that the full column shear was carried by
the horizontal component of the diagonal compression strut.
The hysteretic energy dissipation of the test units was relatively low, but did increase
slightly with increasing drift. For the early stages of testing the equivalent viscous
damping was, on average, approximately 5%. For units JH1 and JH2, the damping did
increase markedly at a drift of 3.0% because of the energy dissipated by the spalling of
concrete in the non-jacketed segments. In general, units JH2 and JH3 with the thinner
jackets showed a greater increase in damping with higher drifts than did the test units
with the thick jackets. This was likely due to the lower confinement level provided by
the thinner jackets and thus higher degree of crushing at the column base.
Columns JH1 and JH4 with the thicker jackets performed better than JH2 and JH3 for the
second test. At the maximum imposed drifts of 5.0% and 6.0% for units JH2 and JH3
respectively, the strengths had dropped on average by 12% from the maximum observed
strengths. A decrease in capacity of only 3% on average was observed for units JH1 and
JH4 at the maximum imposed drift of 6.0%. In addition, the column strengths were
substantially higher than those were for JH2 and JH3. The above is because the thicker
jackets provided approximately double the level of confinement at the critical section
than did the thinner jackets of JH2 and JH3. The substantially higher confinement level
enabled the core concrete to sustain higher longitudinal compression strains without
222

deterioration of the integrity of the core concrete. The average residual drift observed for
the columns at the end of the second test was 0.15%, except for JH2, which had 0.7%
residual column drift. Damage for the second tests consisted of only the crushing of
concrete below the bottom of the jacket and significant yielding of the steel jacket in
hoop tension.
Failure was predicted for each of the second tests based on reaching the ultimate concrete
compression strain. For units JH1 and JH4 with the thicker jackets, failure was predicted
for approximately the 6.0% drift level, while for units JH2 and JH3 with the thinner
jackets failure was predicted at drifts significantly less than the maximum imposed drift.
This was not expected since the procedure used to calculate the ultimate concrete
compression strain is typically conservative by 50%. It is noted that concrete
compression strains obtained using the analytical model may not be representative of
actual strain levels at the critical section. Specifically, it was seen that the analytical
model tended to underestimate the concrete strain at the column base at high drift levels.
The hysteretic energy dissipation for the second tests was again, observed to be low. For
units JH1 and JH4 with the thicker jackets, the calculated equivalent damping was
approximately 5% - 6% on average. For the specimens with thinner jackets, an average
damping level of 6%-7% was observed. The difference between damping levels is
minor, and in light of the many uncertainties and approximations that exist in earthquake
engineering design, it is hard to argue against assuming a damping level of 5% equivalent
viscous damping for all drifts levels and design conditions.
It was found that the gap provided between the jacket toe and footing allowed sufficient
clearance for the longitudinal slippage of the jacket with respect the concrete core and
lowering of the jacket due to column rotation without the jacket bearing on the footing.
However, at drifts on the order of 5% or 6%, the bottom of the jacket was nearly in
contact with the footing. Relative shear slip between the segments was not a problem
during testing. Since no shear keys were provided at the interface between segments, the
223

column shear was transferred entirely by friction. It is felt that for most designs, this will
generally be the case since the total vertical force on the column is substantial. However,
for very squat columns or for columns with a low total vertical force, the need for shear
keys should be investigated. In addition, significant vertical downward accelerations
during an earthquake could cause a reduction in the effective vertical compression force
thus reducing the shear friction capacity at segment interfaces. It is unlikely however,
that vertical accelerations of the magnitude required to significantly reduce the
precompression on the section would occur in conjunction with significant horizontal
accelerations.
The analytical model presented in Chapter 2 adequately predicted the response of the test
units. In general, the theoretical force-displacement response calculated for each unit
gave a reasonable estimate of the actual column behavior. Small differences in strength
in the two loading directions for some of the tests were likely due to accidental
eccentricity of the externally applied axial load. Discrepancies between the analytical
and experimental response are attributed to small errors in the calculated initial prestress
force.
Based on the analytical and experimental results, the followings conclusions are drawn.
Concrete bridge columns built using segmental construction, and reinforced
longitudinally with unbonded prestressing steel can safely and effectively resist lateral
earthquake forces. The columns are capable of undergoing large nonlinear displacements
without experiencing significant or sudden loss of strength. Residual displacements after
the seismic event should be minimal, and the damage incurred low. Only minor repair
work would be required after the earthquake, thus reducing costs and limiting the amount
of disruption of normal use of the bridge structure.
6.3 Recommendations for Seismic Design of Precast Segmental Columns
Preliminary recommendations for the seismic design of precast concrete segmental
columns based on tests documented in this report are given. Full design
224

recommendations based the experimental results and on a current analytical research
study are to be published in a companion report.
6.3.1 General Design Issues
The design of precast columns for seismic forces should be based on capacity design
principles. Displacements of the precast system are assumed due to rigid body rotation of
the column about the base and conservative transverse reinforcement details near the base
should be adopted. Other regions of the column and other structural components that are
to remain essentially elastic should be designed for the expected moment capacity of the
column critical section achieved at the design drift level.
6.3.2 Longitudinal Reinforcement Details
Selection of the prestressing steel area and initial stress can be guided by a trial and error
approach using the analytical force-displacement response model presented in Chapter 2
of this report. The response curves shown in Figure 6.1 are given as an example of a
parametric study used to guide the design of the precast column test units for this
experimental research program. The curves shown in the figure were created by keeping
the prestressing steel area constant while increasing the initial prestress stress (and hence
increasing the initial axial load ratio), and are for a transverse reinforcement volumetric
ratio, ρj, of 4.0%. The initial axial load ratio, equal to the axial dead load plus the initial
prestress force, is listed for each curve. The axial load ratio at the maximum
displacement is shown in parentheses next to the initial value. It can be seen that using a
very low axial load ratio results in a response with a steep, positive second slope stiffness
while using an extremely high initial axial load ratio results in less overall ductility and a
negative post-elastic stiffness. Clearly, the response obtained using a high initial axial
load ratio in not desirable due to the above mentioned behavior. Using a low initial axial
load ratio may not be desirable either since relatively low column strengths would be
achieved with reasonable column diameters. It is noted that the second slope stiffness
225

and system ductility will also depend on the transverse reinforcement ratio provided near
the column base.
It would seem that the ideal option for design would be to strike a balance between
strength and ductility. The curve given for an initial axial load ratio of 0.20 exhibits a
positive second slope stiffness and significant displacement ductility. Both the initial
axial load ratio and axial load ratio at the maximum displacement for the 0.20 curve are
similar to those observed during the tests documented in this report. Thus, damage levels
consistent with those observed during testing should result with an axial load ratio of this
magnitude. Based on the above, considerations for the level of prestress given below
seem reasonable.
• The initial prestressing steel stress should be such that an initial axial
load ratio of approximately 0.20 is achieved.
• The maximum axial load ratio during the seismic event should be less
than or equal to approximately 0.30.
These values should be used only as a guide, and should not be taken as absolute
minimums/maximums. It is up to the designer to consider the influence of the above
variables on column response and make their appropriate selection so that the desired
performance is achieved.
226

Lateral Displacement
Late
ral F
orce
Axial Load Ratio = P + Fsi
f 'c Ac
0.10 (0.227)0.15 (0.255)0.20 (0.288)0.25 (0.323)0.30 (0.381)0.35 (0.415)
Figure 6.1 Influence of initial axial load ratio on column response
6.3.3 Transverse Reinforcement Details
The detailing adopted for transverse reinforcement is critical to the seismic performance
of the precast system. High longitudinal concrete compression strains are expected at the
base, and thus significant confinement levels are required to prevent early degradation of
concrete strength and ensure a high ultimate concrete compression strain, εcu. The level
of confinement to be provided by the steel jacket at the plastic end region will depend on
the design drift and the axial load ratio. The selection of jacket thickness will also
depend on the performance level objective. A jacket with a volumetric ratio of 2.0%
might provide for sufficient column ductility, but could result in extensive permanent
hoop strains after the seismic event. If the performance level objective calls for “minimal
repair required”, then the volumetric ratio of the jacket should be relatively high.
227

228
The ultimate displacement capacity of the precast system may be conservatively
estimated using the ultimate concrete strain given by Eq 2.29 repeated below.
'cc
smyjjcu f
f1.4 0.004
ερ+=ε (2.29)
The ultimate displacement calculated using the above ultimate strain would likely be very
conservative. However, until more research is conducted on the behavior of the precast
system under seismic loading, it is felt this conservatism is appropriate. For the axial
load ratios suggested above, a minimum volumetric steel ratio of 2.0% is reasonable for
drifts up to 3.0%. For higher drifts and/or axial load ratios, an increased volumetric ratio
on the order of 4.0% is suggested. Calculation of the full force-displacement response
behavior should be performed to evaluate column performance for a given steel jacket
volumetric ratio.
The height of the steel jacket should also be conservatively chosen if spalling of concrete
above the jacket is to be avoided. A moment-curvature analysis of the non-jacketed
segment directly above the jacketed segment can be used to determine the required height
to avoid spalling. First, the maximum expected column moment to be developed at the
critical section during seismic response should be determined. The maximum axial force
– equal to the axial dead load plus the initial prestress force plus the incremental prestress
force – should be calculated as well. A moment curvature analysis is then run for the
non-jacketed segment, with the axial load equal to the value determined above. From the
analysis, the moment when the concrete strain is equal to εc = 0.004 is found. The ratio
of this moment to that at the critical section gives the height of the column that does not
require a jacket to prevent cover concrete spalling. The jacket height determined in this
manner should be increased by a safety factor to account for the possibility of maximum
column strength being higher than predicted. In addition, the confined concrete stress-
strain model used in the moment-curvature analysis should be representative of the

229
concrete used. That is, a model appropriate for high strength concrete should be used if
high strength concrete is in the design.
As an alternative to the above, selection of the jacket height can be guided by the
recommendations below. The values for the extent of jacketing given below are similar
to those suggested in Ref. 5, and are appropriate based on the experimentally observed
performance of the test units.
• For axial load ratios (maximum axial load ratio during the seismic
event) of 0.30 or less, the jacketed region is equal to (1) the section
dimension in the direction considered, or (2) the region over which the
moment exceeds 75% of the maximum moment.
• For axial load ratios great than 0.30, the above values should be
increased by 50%.
It is stressed that the axial load ratio referred to above is that at the maximum
displacement response since the total axial load acting on the column increases from its
initial value as the prestressing steel is stretched.
230
REFERENCES 1. ATC, Improved Seismic Design Criteria for California Bridges, Report ATC-32, Applied
Technology Council, Palo Alto, Calif., August, 1983
2. Hose, Y.D., Seible, F. and Preistley, M. J. N., Strategic Relocation of Plastic Hinges in
Bridge Columns, Structural Systems Research Project, Report No. SSRP 97/05,
University of California at San Diego, La Jolla, California, September 1997.
3. Kowalsky, M. J., Priestley, M. J., “Improved Analytical Model for Shear Strength of
Circular Reinforced Concrete Columns in Seismic Zones”, ACI Structural Journal,
American Concrete Institute, Vol. 97, No. 3, May-June 2000
4. Mander, J. B., Priestley, M.J.N., and Park, R., “Theoretical Stress-Strain Model For
Confined Concrete”, Journal of the Structural Division, ASCE, Vol. 114, No. 8, August
1988, pp. 1804-1826
5. Priestley, M.J.N., Seible, F., Calvi, G.M., Seismic Design and Retrofit of Bridges, John
Wiley & Sons, New York, 1996.
6. CALTRANS SESIMIC DESIGN CRITERIA, California Department of Transportation,
Sacramento, CA., 1999