Embed Size (px)
Citation preview

SEISMIC BEHAVIOR AND DESIGN OF SEGMENTAL PRECAST POST-TENSIONED
CONCRETE PIERS
By
HAITHAM MOHAMED MAHMOUD MOUSAD DAWOOD
A thesis submitted in partial fulfillment of
the requirements for the degree of
MASTER OF SCIENCE IN CIVIL ENGINEERING
WASHINGTON STATE UNIVERSITY
Department of Civil Engineering
AUGUST 2010

ii
To the Faculty of Washington State University:
The members of the Committee appointed to examine the dissertation/thesis
of HAITHAM MOHAMED MAHMOUD MOUSAD DAWOOD find it satisfactory
and recommend that it be accepted.
___________________________________
Mohamed A. ElGawady, Ph.D., Chair
___________________________________
William F. Cofer, Ph.D.
___________________________________
David I. McLean, Ph.D.

iii
ACKNOWLEDGEMENT
I‟m grateful to Dr. Mohamed ElGawady, my advisor and committee chair, for his
guidance, patience and valuable suggestions throughout the entire research work. I would like to
thank Dr. William Cofer and Dr. David McLean for their participation and assistance on my
committee. I would like also to thank Dr. Joshua Hewes (NAU) for co-authoring the first two
publications with me and Dr. ElGawady, also for his constructing comments on the first part of
this study. I am also grateful to TransNOW for providing the research funding. I also
acknowledge Dr. Mahmoud Imam (Taif U) for all his encouragement and support before and
during pursuing my master‟s degree at WSU.
I dedicate this thesis to my mother (Gihan), my father (Mohamed) and my sweet sisters
(Hend and Heba) for surrounding me with their love and kindness throughout my journey of
success. I would like to express my deepest appreciation to my wife (Eman) for her love, patient
and faithful encouragement and helping me for setting up a good study atmosphere in order to
finish my degree. I would also like to thank all my friends and colleagues, Jamal Elmapruk
(WSU), Ahmed Awed (U of Idaho), Ahmed El-Hadidy (U of Waterloo) and Waleed Adel
(Mansoura U) for their encouragement and moral support during the course of this study.
I would like also to acknowledge the Earthquake Engineering Research Institute (EERI)
for providing me with a grant to present this research in the EERI 2010 annual meeting in San
Francisco, CA. Also, the civil and environmental engineering department for helping me to
attend the meeting.

iv
SEISMIC BEHAVIOR AND DESIGN OF SEGMENTAL PRECAST POST-TENSIONED
CONCRETE PIERS
Abstract
By Haitham Mohamed M. Mousad Dawood, M.S.
Washington State University
August, 2010
Chair: Mohamed ElGawady
Segmental precast post tensioned (SPPT) bridge pier is an economical construction
system, and a re-centering structural system. Understanding the seismic behavior of the SPPT
system is an important step towards its application in high seismic zones.
First, the thesis presents a detailed three dimensional finite element model developed
using the ABAQUS platform. A brief description and discussion of cyclic tests on eight large
scale SPPT piers was also presented. The finite element model was validated against the
experimental results and it showed good agreement. Sensitivity analyses using the finite element
model showed that the model is sensitive to the softening behavior of the concrete material
constitutive law.
Then, the FE model was used to discuss the design parameters that potentially affect the
lateral seismic response of the SPPT bridge piers. Design parameters investigated include the
initial post-tensioning stress as a percentage of the tendon yield stress, the applied axial stresses
on concrete due to post-tensioning, pier aspect ratios, construction details, steel tube thicknesses,
and internal mild steel rebar added as energy dissipaters.

v
After that, the FE model was validated against two experimental studies conducted at
Washington State University. The SPPT piers were tested as single piers in the first study while
two SPPT piers were connected from the top with a reinforced concrete beam to form a moment
resistant bent in the second study. The FE model showed good agreement with the backbone
behavior of the tested specimens. A parametric study was carried out to study the effect of piers
dimensions, post-tensioning and external service loads on full scale FE models.
Finally, a large set of FE models of piers with different design parameters was used to
develop a set of empirical equations. These equations were incorporated into a design procedure
for the SPPT concrete piers.
vi
TABLE OF CONTENTS
Page
ACKNOWLEDGEMENTS…………………………………………………………………. iii
ABSTRACT…………………………………………………………………………………. iv
LIST OF TABLES………………………………………………………………………….. ix
LIST OF FIGURES………………………………………………………………………….. x
CHAPTER ONE............................................................................................................................. ... 1
1. INTRODUCTION......................................................................................................................... 1
1.1 Innovative Precast Post-tensioned Bridge Piers and Bents Developed at
Washington State University……………………………………………………………………………………………….. 1
1.1.1 Structural Advantages………………………………………………………………………………………… 1
1.1.2 Construction advantages……………………………………………………………………………………… 3
1.1.3 Environmental Advantages………………………………………………………………………………… 3
1.2 Research objectives………………………………………………………………………………………………………… 4
CHAPTER TWO………………………………………………………………………………………………………………………….. 5
2. LITERATURE REVIEW……………………………………………………………………………………………………..… 5
2.1 Seismic Behavior of Segmental Precast Post-tensioned Piers ………………….... 5
2.1.1 Experimental Studies……………………………………………………………………………………..…… 7
2.1.1.1 Experimental Studies Done At WSU…………………………………………………..... 7
2.1.2 Simple Models……………………………………………………………………………………………………… 9
2.1.3 Finite Element Models………………………………………………………………………………………… 10
2.1.4 Lumped-mass Models…………………………………………………………………………………………. 11
2.1.5 Energy Dissipation Systems……………………………………………………………………………… 12
2.2 Concrete Confinement……………………………………………………………... 13
2.3 Conclusions……………………………………………………………………….... 14
2.4 References…………………………………………………………………………... 14
CHAPTER THREE……………………………………………………………………………………………………………………. 16
3. BEHAVIOR OF SEGMENTAL PRECAST POST-TENSIONED BRIDGE PIERS
UNDER LATERAL LOADS: EXPERIMENTAL AND MODELING …………………… 16
3.1 Abstract……………………………………………………………………………………………………………………………. 16
3.2 Keywords ………………………………………………………………………… 16
3.3 Introduction……………………………………………………………………………………………………………………. 17
3.4 Finite Element Modeling of Self-Centering Piers……………………………………………………… 19
3.5 Experimental work………………………………………………………………………………………………………… 23
3.5.1 Test pier design details………………………………………………………………………………………. 23
3.5.2 Test setup, instrumentation, and loading protocol…………………………………………… 26
3.5.3 Description of test results…………………………………………………………………………………… 27
3.6 Model Validation…………………………………………………………………………………………………………… 31
3.7 Analyses results…………………………………………………………………………………………………………….. 33
3.8 Sensitivity Analyses……………………………………………………………………………………………………… 40
3.9 Findings and conclusions……………………………………………………………………………………………… 43
3.10 Acknowledgements…………………………………………………………………………… 44
3.11 References……………………………………………………………………………………………………………………. 44
CHAPTER FOUR…………………………………………………………………………… 46
vii
4. BEHAVIOR OF SEGMENTAL PRECAST POST-TENSIONED BRIDGE PIERS
UNDER LATERAL LOADS: PARAMETRIC STUDY……………………………………. 46
4.1 Abstract………………………………………………………………………………………………………………………….. 46
4.2 Keywords……………………………………………………………………………………………………………………….. 47
4.3 Introduction……………………………………………………………………………………………………………………. 47
4.4 Results and Discussions……………………………………………………………………………………………….. 50
4.4.1 Effects of initial post-tensioning level in the tendon ……………………………………….. 50
4.4.2 Effects of initial stresses on the concrete ………………………………………………………….. 54
4.4.3 Effects of pier aspect ratio ………………………………………………………………………………... 57
4.4.4 Effects of construction details ………………………………………………………………………….… 60
4.4.5 Effects of confinement thickness ……………………………………………………………………… 62
4.4.6 Effects of adding internal energy dissipaters……………………………………………………. 63
4.5 Findings and Conclusions……………………………………………………………………………………………… 65
4.6 Acknowledgements……………………………………………………………………………… 67
4.7 References……………………………………………………………………………………………………………………… 67
CHAPTER FIVE…………………………………………………………………………….. 68
5. FINITE ELEMENT MODEL CALIBRATION AGAINST SPPT SYSTEM
DEVELOPED IN WASHINGTON STATE UNIVERSITY AND PARAMETRIC STUDY 68
5.1 Introduction…………………………………………………………………………. 68
5.2 Piers Tested by Booker A. (2008) ………………………………………………… 68
5.3 Bents Tested by Shaalan (2009) …………………………………………………… 70
5.4 Finite Element Model Implementation……………………………………………… 71
5.5 Results and Discussions…………………………………………………………..… 73
5.5.1 Piers…………………………………………………………………………... 73
5.5.2 Bents………………………………………………………………………..… 75
5.6 Parametric Study……………………………………………………………………………… 76
5.6.1 Effects of applied post-tensioning force………………………………………………. 76
5.6.2 Effects of load combination………………………………………………………………………………… 77
5.6.3 Effects of pier aspect ratio…………………………………………………...…………… 78
5.6.4 Effects of pier size…………………………………………………………………………. 79
5.6.5 Effects of diameter size…………………………………………………………………… 80
5.6.6 Effects of confinement…………………………………………………………………..… 81
5.7 Conclusions………………………………………………………………………………………………..…………………… 83
5.8 References………………………………………………………………………...… 84
CHAPTER SIX…………………………………………………………………………….... 86
6. PERFORMANCE-BASES SEISMIC DESIGN OF UNBONDED SEGMENTAL
PRECAST POST-TENSIONED CONCRETE PIERS…………………………………………………………... 86
6.1 Abstract……………………………………………………………………………... 86
6.2 Keywords …………………………………………………………………………… 87
6.3 Segmental Precast Post-tensioned (SPPT) Piers……………………………………. 87
6.4 Residual Drift Angles………………………………………………………………. 87
6.5 Summary of the Finite Element Model…………………………………………….. 88
6.6 Study Description…………………………………………………………………… 90
6.7 Performance levels……………………………………..…………………………… 92
6.7.1 Performance criteria for the serviceability level…………….……….……… 93
viii
6.7.2 Performance criteria for the collapse-prevention level……………………… 94
6.8 Equivalent viscous damping………………………………………………………… 94
6.9 Study Procedure…………………………………………………………………….. 95
6.10 Collapse-prevention and Serviceability Performance levels……………..……….. 96
6.10.1 Effective stiffnesses (KCP-e and KS-e) ………………………………………. 96
6.10.2 Yield loads (FCP-y and FS-y) ………………………………………………… 97
6.10.3 Displacements corresponding to yield loads (ΔCP-y and ΔS-y)……………… 99
6.10.4 Performance displacements (ΔCP-P and ΔS-P)……………………………….. 99
6.10.5 Performance loads (FCP-P and FS-P) ………………………………………… 100
6.11 Error in predicting the bilinearized backbone curves …………………………… 101
6.12 Increases in the post-tensioning force with increasing the applied lateral drift
angle…………………………………………………………………………………… 103
6.13 Design Procedure ………………………………………………………………… 107
6.14 Findings and Conclusions………………………………………………………… 111
6.15 References…………………………………………………………………………. 112
APPENDIX………………………………………………………………………………….. 116
A. APPENDIX A (MATERIALS TESTING)………………………………………………. 117
A.1 Concrete……………………………………………………………………………. 117
A.2 Post-tensioning bars……………………………………………………………….. 119
A.3 Glass Fiber Reinforced Polymer (GFRP)………………………………………….. 121
A.4 Fiber Sheets Used To Retrofit JH12 & JH22 (CHAPTER 3)……………………… 126
A.5 References………………………………………………………………………….. 126

ix
LIST OF TABLES
Page
Table 2.1: Examples of bridges constructed using segmental piers……………………………………. 5
Table 3.1: The matrix of the experimental work…………………………………………. 24
Table 3.2: Summary of steel coupons tension tests…………………………………………………………….... 25
Table 3.3: Concrete compressive strength for test units (fc‟, MPa)……………………………………. 25
Table 3.4: Properties of the FRP…………………………………………………………………………………………….. 30
Table 4.1: Different values assigned for each parameter in the parametric study………... 50
Table 5.1: Description of the piers used in the laboratory testing………………………. 69
Table 5.2: Description of the bents used in the laboratory testing……………………….. 70
Table 6.1: Different investigated parameters for the SPPT………………………………. 91
Table 6.2: Material Properties of the GFRP tubes………………………………………... 91
Table 6.3: Mean, standard deviation an coefficient of variation of the error associated
with using the empirical equations……………………………………………. 103
Table A.1: Summary of compression test results…………………………………………. 118
Table A.2: Summary of tension tests of GFRP specimens……………………………….. 122
Table A.3: Typical dry fiber propertied used in chapter (3)……………………………… 126
x
LIST OF FIGURES
Page
Figure 1.1: Schematic drawing of the SPPT-CFFT System……………………………………………… 3
Figure 2.1: Examples of segmental piers ………………………………………………. 6
Figure 2.2: Piers tested (From ElGawady et al. 2010)………………………………………………………. 8
Figure 2.3: Tested frames (From ElGawady and Shaalan 2010)………………………………………. 9
Figure 2.4: Backbone curve of the test specimens, (From ElGawady et al. 2009)………….. 10
Figure 3.1: A typical mesh and applied loads and displacements for the SPPT pier........ 20
Figure 3.2: Test setup for specimens…………………………………………………………………………………… 26
Figure 3.3: Experimental hysteretic response plots……………………………………………………………. 28
Figure 3.4: Experimental hysteretic response plots……………………………………………………………. 29
Figure 3.5: Stress strain curves for unconfined and confined concrete................................ 31
Figure 3.6: Specimen JH12 (a) during testing, and (b) FE model results............................ 34
Figure 3.7: A schematic of a rocking pier indicating stresses and strains at different
heights of the pier……………………………………………………………………………………………… 34
Figure 3.8: Specimen JH11 at failure…………………………………………………………………………………. 36
Figure 3.9: Experimental versus predicted backbone curves for slender virgin piers……… 37
Figure 3.10: Experimental versus predicted backbone curves for squat virgin piers…….… 38
Figure 3.11: Errors in predicting the strengths…………………………………………………………………… 38
Figure 3.12: Error in post tensioning stress versus drift angle…………………………………………… 40
Figure 3.13: Different softening behavior of concrete………………………………………………………… 41
Figure 3.14: The effects of concrete material softening behavior on the response of piers 42
Figure 3.15: Effects of coefficients of friction on the backbone curves of pier JH11…….. 42
Figure 4.1: Detailed dimensions for piers……………………………………………… 47
Figure 4.2: A typical mesh and applied loads and displacements for the SPPT pier….. 49
Figure 4.3: The effects of changing the initial post-tensioning stress in the tendons
while keeping the same stress on concrete………………………………….. 51
Figure 4.4: Piers‟ drifts Vs. the stresses in the post-tensioning tendons normalized by
its yield stress……………………………………………………………… 52
Figure 4.5: The effects of changing the initial post-tensioning stress in the tendons for
squat piers…………………………………………………………………… 52
Figure 4.6: Squat piers‟ drifts Vs. the stresses in the post-tensioning tendons
normalized by its yield stress……………………………………………….. 53
Figure 4.7: The effects of increasing the axial stresses due to post-tensioning forces on
concrete segments…………………………………………………………. 55
Figure 4.8: The increase in the post-tensioning stresses vs. the standard piers lateral
drifts ………………………………………………………………………… 56
Figure 4.9: The effects of increasing the axial stresses on concrete segments for Pier B. 57
Figure 4.10: The increase in the post-tensioning stresses vs. piers type B lateral drifts….. 57

xi
Figure 4.11: Layout of the piers having different aspect ratios………………………… 58
Figure 4.12: The effect of changing the piers‟ aspect ratio on the backbone curves…… 58
Figure 4.13: The mechanism of deformation for slender and squat piers………………. 59
Figure 4.14: Configuration of each pier of CON series…………………………………. 60
Figure 4.15: The effects of the different configurations on the backbone curves………. 61
Figure 4.16: The effects on the backbone curves of the different confinement
thicknesses…………………………………………………………………………………………………………. 63
Figure 4.17: The effects of the IED on the backbone curves……………………………. 63
Figure 4.18: High stress concentrations in the segments due to the insufficient
development length of the IED bar…………………………………………. 64
Figure 4.19: The effects of different IED rebar diameters on normalized stresses on the
rebar……………………………………………………………………….. 65
Figure 5.1: Schematic drawing showing the setup for the cyclic loading test for the
piers…………………………………………………………………………. 69
Figure 5.2: Schematic drawing for the two piers used for the calibration of the FE
model ……………………………………………………………………….. 69
Figure 5.3: Schematic drawing showing the setup for the cyclic loading test for the
bents……………………………………………………………………………………………………………………. 70
Figure 5.4: Schematic drawing for the tested frames…………………………………… 71
Figure 5.5: Typical mesh used for the FE model………………………………………... 72
Figure 5.6: Stress strain curves for the concrete …………….………………………….. 73
Figure 5.7: Experimental versus predicted backbone curves for the singly segmented
pier………………………………………………………………………………………………………………………. 74
Figure 5.8: Experimental versus predicted backbone curves for the multi segmented
pier......................................................................................................................... 74
Figure 5.9: Experimental versus predicted backbone curves for the singly segmented
bents………………………………………………………………………… 75
Figure 5.10: Experimental versus predicted backbone curves for the multi segmented
bents………………………………………………………………………… 76
Figure 5.11: Effects of changing the applied post-tensioning forces on the backbone
curves of piers having different aspect ratios……………………………… 77
Figure 5.12: Effects of different combinations of axial stresses for piers with different
aspect ratios………………………………………………………………… 78
Figure 5.13: Effects of piers aspect ratios on the backbone curves……………………… 79
Figure 5.14: Backbone curves for two piers having different aspect ratios ……………... 80
Figure 5.15: Backbone curves for piers from the S series (dashed line) and L series
(solid line) with different heights…………………………………………… 81
Figure 5.16: An approximate mechanism for rocking of two piers having the same
height but with different cross sectional diameter………………………… 81
Figure 5.17: Backbone curves for piers of the L series constructed using different FRP 82

xii
materials………………………………………………………………….….
Figure 5.18: Backbone curves for piers of the S series constructed using different FRP
materials……………………………………………………………………. 82
Figure 5.19: The stress-strain relationships for piers from the S and L series confined
using different FRP materials……………………………………………….. 83
Figure 6.1: FE model for a SPPT pier used in this study………………………………... 89
Figure 6.2: Deformed shape of the pier…………………………………………………. 90
Figure 6.3: Compressive stress strain relationship obtained from Samaan et al. (1998)
to model the GFRP confined concrete of the piers…………………………. 92
Figure 6.4: Backbone curve along with its bilinearized form (FEMA 356)……………. 96
Figure 6.5: The yield load associated with each specific pier ………………………….. 98
Figure 6.6: The performance load associated with each specific pier………………….. 101
Figure 6.7: The lateral drift angle vs. the error in predicting the pier‟s strength……….. 102
Figure 6.8: The relationship between the lateral drift angle (%) vs. the stress in the
post-tensioning tendon‟s normalized by its initial stress for piers………….. 104
Figure 6.9: Error in predicting the post-tensioning stress in the tendons Vs. lateral drift
angle………………………………………………………………………… 106
Figure 6.10: Flow chart diagram of the proposed design procedure for SPPT piers……. 108
Figure 6.11: A diagram showing how to obtain the target periods of the pier from the
uniform hazard displacement spectra of the Seattle, WA area……………. 109
Figure A.1: Test setup for computing concrete characteristic strength f‟c…………….. 117
Figure A.2: Test setup for computing static modulus of elasticity of the concrete
cylinders…………………………………………………………………… 118
Figure A.3: Stress strain curves from the cylinders tests along with the equations of the
trend lines………………………………………………………………….. 119
Figure A.4: Copy of the report supplied by the DYWIYDAG company………………. 120
Figure A.5: Copy of the compression testing report of the FRP……………………….. 123

1
CHAPTER ONE
INTRODUCTION
The use of precast segmental construction for concrete bridges in the United States has
increased in recent years due to the demand for shortened construction periods, low
environmental impacts and the desire for innovative designs that result in safe, economical and
efficient structures. However, the behavior and performance of precast segmental bridges during
earthquakes is of concern, and consequently their widespread use in moderate to high seismic
regions such as the West Coast of the United States is limited.
1.1 Innovative Precast Post-tensioned Bridge Piers and Bents Developed at Washington
State University
During the last few years, an innovative segmental precast post-tensioned bridge
construction system was developed at Washington State University. The piers of the developed
system consist of segmental concrete filled fiber reinforced polymer tubes (SPPT-CFFT),
superimposed one on top of the other, and then connected structurally with vertical post-
tensioned tendons passing through ducts located in the precast segments. The tendons are
anchored in the foundation of the pier and in the bent cap at the pier top Fig. 1.1. Constructing
bridge piers in this manner offers several structural, construction and environmental advantages
over conventional R.C. designs.
1.1.1 Structural Advantages
A schematic deformed shape of the SPPT-CFFT segmental pier under transverse loading
is shown in (Fig. 1.1). The post-tensioning load keeps the whole system as one unit. Under

2
lateral loads, the stresses under the precast segments start to be a combination of the normal
force induced by prestressing and moment induced by the lateral load. Once the stresses reach a
zero value at a point under a segment, any increase in the lateral load leads to an opening
between that segment and the one beneath it. This opening continues to propagate with the load
increase until it reaches the prestressing bars at the G.C. of the cross section. This is when the
post-tensioning steel bar is stretched and the stress in the tendons increase. The fact that the
opening between the components propagates means that the stiffness of the system decreases and
as a result the energy absorbed from the seismic event decreases.
The tendon is unbonded over the height of the pier so incremental stresses and strains are
not concentrated at the crack. This is the reason why unbonded tendons are chosen for this
system, and if the initial prestress level is well chosen, the prestressing steel will not yield. This
is essential for this system for several reasons. First, the ability to transfer shear forces across the
segments interfaces by shear friction is dependent on the clamping force provided by the
prestressing tendon. The pier stiffness depends on the prestressing force and hence is not reduced
drastically if the prestress is maintained. Finally, the restoring force (self-centring ability) is
provided to the pier if the prestress is maintained during and after the earthquake ensuring that
the pier returns to the undeformed position.
SPPT-CFFT piers and bents have an encouraging behavior under seismic loads, as the
residual pier drift will be negligible, and damage in the form of concrete spalling is minimal and
limited to the region near the compression toe of the pier. Yielding of longitudinal bars, which is
typical of R.C. piers, will not occur for the precast post-tensioned concrete filled fiber tubes
(SPPT-CFFT). This means that a segmental precast concrete bridge pier will remain functional
immediately after a moderate to strong seismic event and will require minimal repair. Due to

3
their exceptional seismic performance, this system would be particularly attractive in bridges
considered as lifeline structures.
1.1.2 Construction Advantages
Construction schedules can be shortened significantly since bridge components can be
rapidly produced at the precasting facility, where assembly lines and steam curing increase the
efficiency of concrete construction. Additionally, the erection of a segmental bridge in the field
can proceed rapidly, thus reducing the disruption to existing traffic infrastructure.
1.1.3 Environmental Advantages
Noise, leakage of wet concrete into waterways and fuel consumption due to congestion
and rerouting of cars during construction are reduced when using this system. So it reduces
sound, water and air pollution if compared to the conventional R.C. systems.
Figure 1.1 Schematic drawing of
the SPPT-CFFT System
Post-tensioned bar
Dry joints opened
during EQ
Force
Before and after EQ
During EQ

4
1.2 Research Objectives
This study started with the development of a FE model capable of capturing the behavior
of the segmental precast post-tensioned (SPPT) pier system. The model was calibrated against
three different experimental studies with different configurations of the SPPT system. The model
was then used to conduct a parametric study to have a better understanding of the effect of
different parameters and configurations on the seismic behavior of the SPPT piers. The data
collected from a large number of analyzed piers was then used to develop a design procedure for
the system using empirical equations.

5
CHAPTER TWO
LITERATURE REVIEW
2.1 Seismic Behavior of Segmental Precast Post-tensioned Piers
Segmental precast post-tensioned (SPPT) systems in low to medium seismic zones have
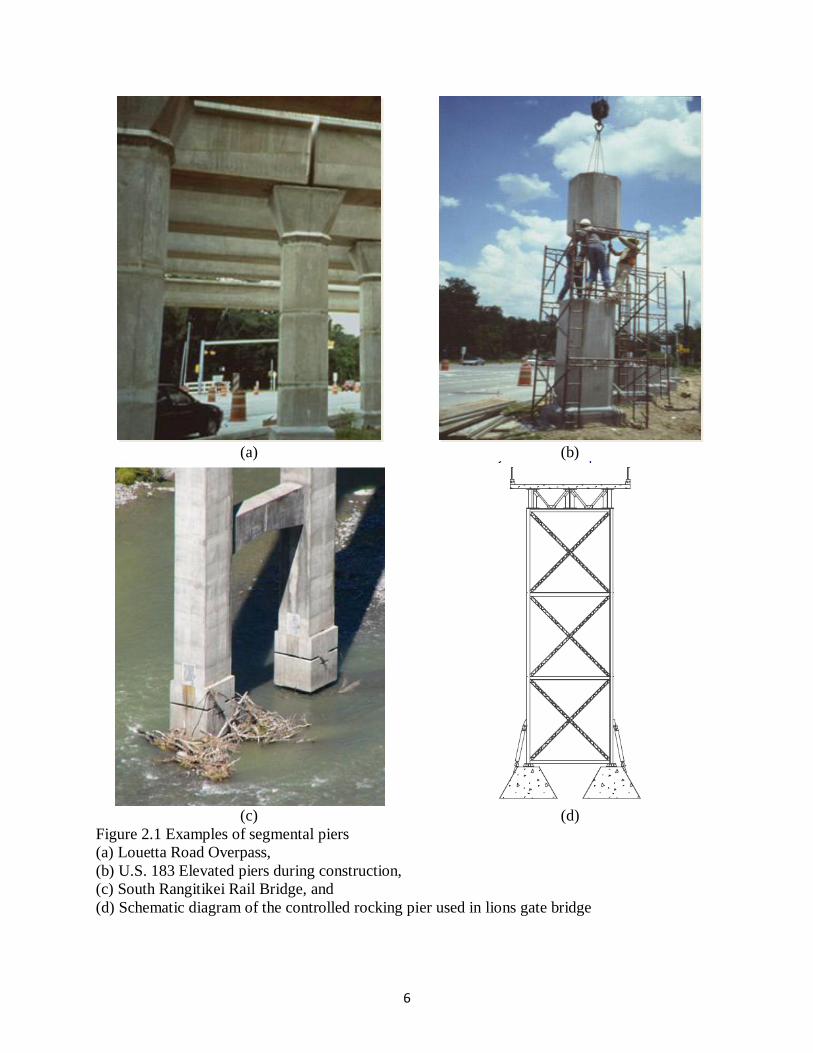
proven to be an economical and advantageous construction system. Table 2.1 and Fig. 2.1 show
examples of bridges constructed in this way. However, little is known about the seismic behavior
of SPPT system. Recently, several research projects have investigated the seismic behavior of
unbonded and bonded post-tensioned segmental piers.
Table 2.1 Examples of bridges constructed using segmental piers
Bridge Location Description
Louetta Road Overpass Houston, Texas precast post-tensioned piers
Sunshine Skyway Bridge Florida precast PT hollow elliptical pier segments
U.S. 183 Elevated Austin, TX Hollow Precast Piers
Varina-Enon Bridge Virginia Precast concrete elements for the piers
South Rangitikei Rail Bridge New Zealand Rocking bridge pier
Lions Gate Bridge (north
approach)
Vancouver Rocking bridge pier
6
(a) (b)
(c) (d)
Figure 2.1 Examples of segmental piers
(a) Louetta Road Overpass,
(b) U.S. 183 Elevated piers during construction,
(c) South Rangitikei Rail Bridge, and
(d) Schematic diagram of the controlled rocking pier used in lions gate bridge

7
2.1.1 Experimental Studies
Hewes and Priestley (2002) conducted cyclic loading on four, 40% scaled, unbonded
segmental post-tensioned piers with different aspect ratios. Each pier was tested twice under low
and high initial post-tensioning stress. Two different thicknesses of steel confinement were used
for the lower segments only, while the upper segments were reinforced concrete.
Chang et al. (2002) conducted a study on four large-scale hollow precast unbonded post-
tensioned reinforced concrete segmented piers. Each specimen consisted of nine or ten 100 cm
[39.4 in] tall, precast pier segments.
Chou and Chen (2006) tested two one-sixth scale (16.67%) precast unbonded post-
tensioned concrete filled steel tube segmental piers through cyclic loading tests.
Marriott et al. (2009) tested three, one-third scale (33%) piers. Two were segmental piers
while the third was of monolithic reinforced concrete (RC) construction as a control specimen.
The previously mentioned efforts highlighted the ability of the system to undergo large
lateral displacements with no sudden strength reduction (failure). The reported residual
displacements were much lower compared to monolithic RC systems. The low hysteretic energy
dissipation capacity, due to the minimal concrete damage, was of concern.
2.1.1.1 Experimental Studies Done At WSU
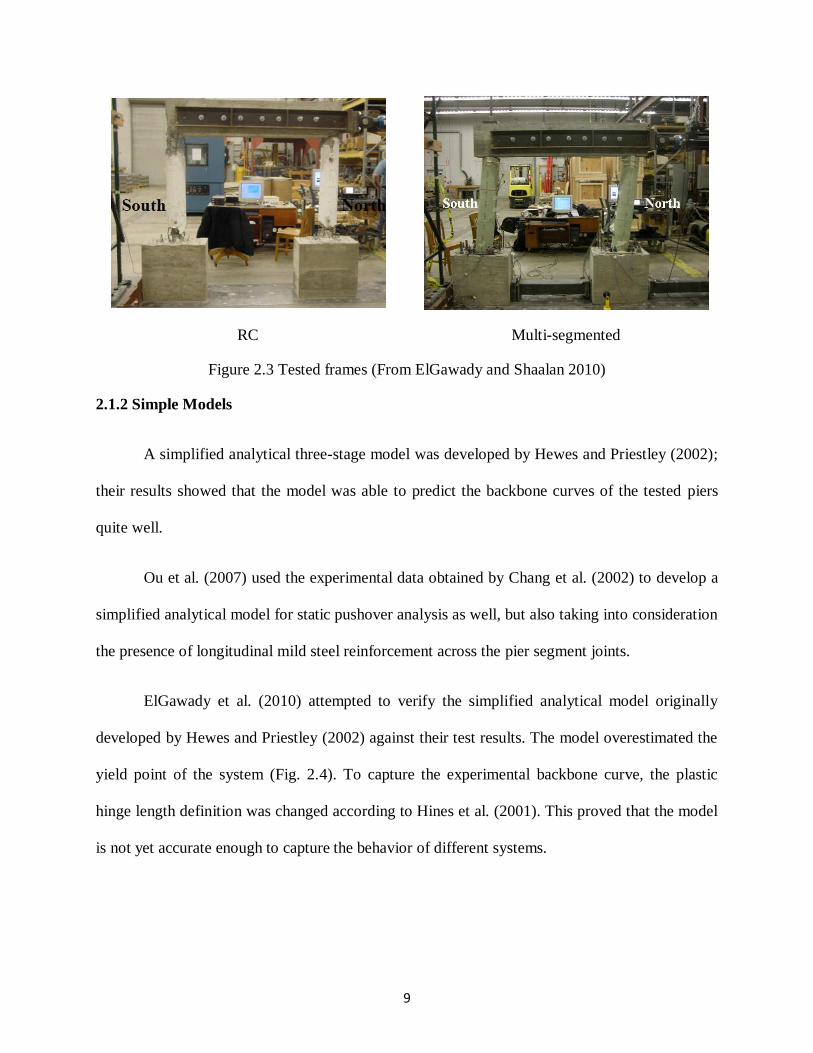
ElGawady et al. (2010) and ElGawady and Shaalan (2010) studied the performance of
segmental precast post-tensioned piers and bents (frames) under cyclic loads. The test matrices
of the two studies consisted of four SPPT-CFFT, piers, and frames along with two cast-in-place
RC specimens (Figs. 2.2 and 2.3) as control specimens. The segments consisted of plain concrete

8
cylinders confined by glass fiber reinforced polymer (GFRP) tubes. For each study, one single
segment specimen and three multi-segmented specimens were tested (consisted of 4 segments for
the piers study and 3 segments for the frames study stacked over each other). Steel angles were
used as external fuses for one multi-segmented specimen in each study. Also, rubber pads were
used as base isolators for one pier and one frame.
RC pier Multi-segmented
Figure 2.2 Piers tested (From ElGawady et al. 2010)
9
RC Multi-segmented
Figure 2.3 Tested frames (From ElGawady and Shaalan 2010)
2.1.2 Simple Models
A simplified analytical three-stage model was developed by Hewes and Priestley (2002);
their results showed that the model was able to predict the backbone curves of the tested piers
quite well.
Ou et al. (2007) used the experimental data obtained by Chang et al. (2002) to develop a
simplified analytical model for static pushover analysis as well, but also taking into consideration
the presence of longitudinal mild steel reinforcement across the pier segment joints.
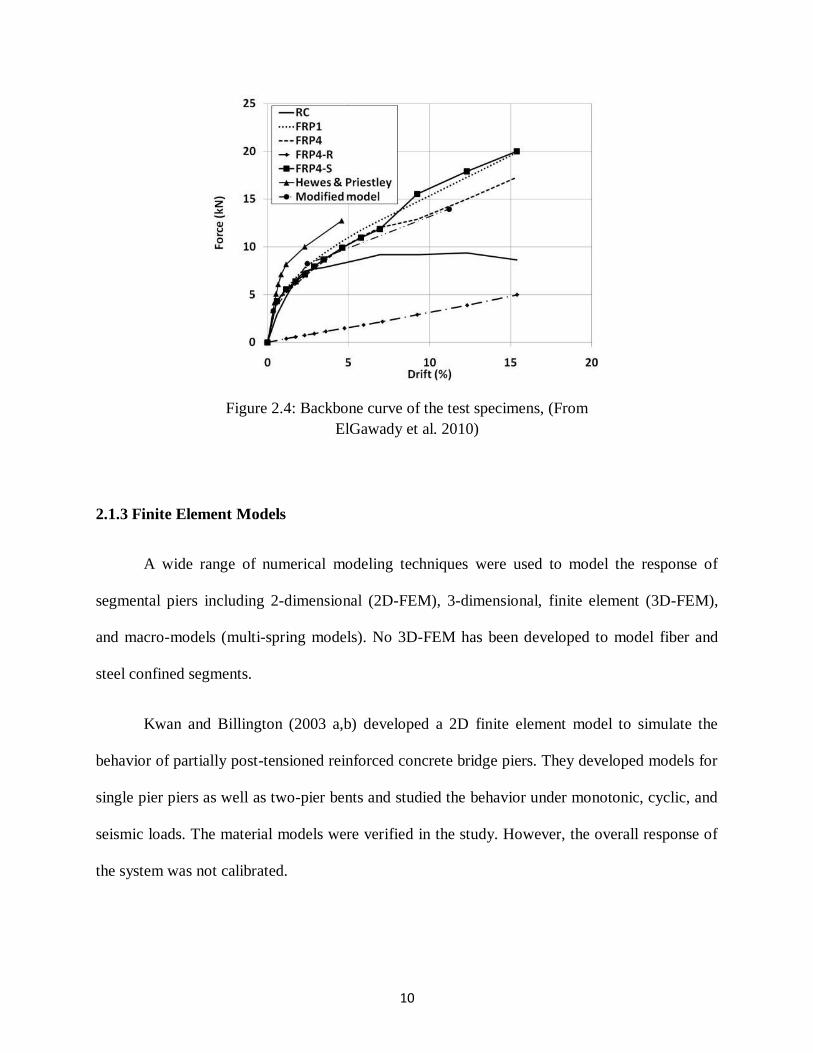
ElGawady et al. (2010) attempted to verify the simplified analytical model originally
developed by Hewes and Priestley (2002) against their test results. The model overestimated the
yield point of the system (Fig. 2.4). To capture the experimental backbone curve, the plastic
hinge length definition was changed according to Hines et al. (2001). This proved that the model
is not yet accurate enough to capture the behavior of different systems.
10
Figure 2.4: Backbone curve of the test specimens, (From
ElGawady et al. 2010)
2.1.3 Finite Element Models
A wide range of numerical modeling techniques were used to model the response of
segmental piers including 2-dimensional (2D-FEM), 3-dimensional, finite element (3D-FEM),
and macro-models (multi-spring models). No 3D-FEM has been developed to model fiber and
steel confined segments.
Kwan and Billington (2003 a,b) developed a 2D finite element model to simulate the
behavior of partially post-tensioned reinforced concrete bridge piers. They developed models for
single pier piers as well as two-pier bents and studied the behavior under monotonic, cyclic, and
seismic loads. The material models were verified in the study. However, the overall response of
the system was not calibrated.

11
Ou et al. (2007) also developed a 3D finite element model using the test results of Chang
et al. (2002). A cyclic loading pattern was applied to the model to validate the simplified
analytical model.
The 2D-FEM and 3D-FEM, at present, are only capable of capturing the general behavior
of the segmental piers. Each of the FE models was calibrated against one set of data. Hence, the
literature did not include a standard approach to develop a FE model capable of capturing the
behavior of different systems layouts, particularly fiber and steel confined. This is the
preliminary target of this study.
Marriott et al. (2009) developed and tested the efficiency of two macro-models (multi-
spring model). ElGawady and Shaalan (2010) developed a pushover analysis of a segmental
frame system using SAP2000. To be able to correctly implement this type of approach, a good
physical understanding of the system and its behavior is required in order to implement the
correct assumptions and parameters to the model and to be confident in the output.
2.1.4 Lumped-mass Models
In this approach, the piers are assumed to be a single degree of freedom system (SDOF)
with a lumped mass at the top. The hysteretic diagrams developed by experimental tests and/or
FE models are then modified to an idealized flag-shape hysteretic for the SDOF.
Ou et al. (2007) used the 3D FE analyses and the cyclic test data from Chang et. al (2002)
to develop a flag-shaped (FS) model. By assuming that the piers are a lumped-mass SDOF, the
response-history of the piers under 25 near-fault ground motions was easily computed in order to
study the behavior of the system under seismic loading.

12
Chou and Hsu (2008) developed FS and stiffness-degrading flag-shaped (SDFS) models
according to the hysteretic curves obtained from the cyclic loading of precast post-tensioned
segmented piers. Both the FS and SDFS models considered hysteretic energy dissipation.
However, only SDFS took the stiffness degradation into consideration. The discrepancy between
the results of both assumptions showed the importance of considering stiffness degradation in
predicting the dynamic response of the system.
The importance of this approach is that it makes possible a simplified dynamic analysis
of the system under seismic excitations. Then it allows the development of the seismic analysis
in a fast and economical way, compared with FE analysis.
2.1.5 Energy Dissipation Systems
To overcome the drawback of low hysteretic energy dissipation capacity, additional
energy dissipaters were used to increase the hysteretic damping of the system. In most cases
hysteretic damping comes from the yielding of the steel element. Energy dissipaters can be
divided into two main categories, namely, internal and external (fuses) energy dissipation
systems.
Chang et al. (2002) and Ou et al. (2007) used mild steel bars between pier segments as
internal energy dissipaters. The bars proved their efficiency by significantly increasing the
hysteretic energy dissipation. The major problem with this type of dissipater is that, after
yielding, the bars are permanently deformed and the whole system suffers from residual
displacement after loading.
External energy dissipaters (fuses) have been used by Chou and Chen (2006), Marriott et
al. (2009), ElGawady et al. (2010) and ElGawady and Shaalan (2010).

13
Chou and Chen (2006) provided one of their piers with a dog bone shaped external
energy dissipater. They reported that it increased the equivalent viscous damping of the system
from 6.5% to 9%.
Marriott et al. (2009) used two different layouts of external energy dissipater systems for
segmental piers. They used mild steel bars encased in steel confining tubes and injected with
epoxy to have a fuse-like behavior and to be able to dissipate energy while subjected to tension
and compression stresses.
ElGawady et al. (2010) and ElGawady and Shaalan (2010) used external steel angles and
rubber pads respectively as external energy dissipaters and isolation dissipation devices. The idea
of the steel angles is the same as with other metal dissipaters: energy is dissipated by the yielding
of the steel. On the other hand, rubber dissipates energy in another way, as the soft rubber
changed the energy dissipation function from a discrete function occurred at every impact
between the rocking segments to a continuous function ElGawady et al. (2005 and 2006).
Both internal and external energy dissipaters increased the dissipation of hysteretic
energy. The fuses had the advantage of being easily changed and, hence, not increasing the
residual drift of the system. Use of the rubber isolation pads significantly decreased the initial
stiffness.
2.2 Concrete Confinement
Mander et al. (1988) developed a theoretical model to predict the stress-strain behavior of
concrete confined using steel stirrups and/or jackets.
In recent years, external confinement of concrete using FRP composites has emerged as a
popular method of both pier retrofit and new construction, particularly for circular piers. Various

14
models for predicting stress-strain behavior have been developed (e.g., Samaan et al. (1998),
Fam and Rizkalla (2001), Becque at al. (2003), Lam and Teng (2002 & 2003), Jiang and Teng
(2007) and Teng et al. (2009)).
Confinement increases element ductility and the ultimate strength of the elements. If used
in a tubular shape, confinement can be a permanent formwork which can save the time and
money spent preparing temporary formworks.
2.3 Conclusions
Experimental studies show that the permanent deformation of SPPT is minimal compared to
that of RC piers.
Experimental studies show the limited ability of the system to dissipate input seismic energy
so additional energy dissipaters were used.
Energy dissipaters are important for the SPPT system. External fuses don‟t increase the
residual drift, but internal fuses do.
The simple analytical models can not yet be generalized and need more research to be more
accurate.
2D and 3D FE modeling is essential in understanding the behavior of the system under
different loading patterns. A combination of FE modeling and FS/SDFS models can be an
extremely powerful tool to compute the dynamic response of the system without running
expensive experimental testing. However, first, a systematic way of preparing a FE model
for the system must be developed.
2.4 References
Booker, A. J. (2008). „„Performance of continous and segmented post-tensioned concrete
filled fiber tubes.‟‟ M.Sc. thesis, Washington State Univ., WA, USA

15
Chang, K. C., Loh, C. H., Chiu, H. S., Hwang, J. S., Cheng, C. B., and Wang, J. C.
(2002). “Seismic behavior of precast segmental bridge columns and design methodology
for applications in Taiwan”, Taiwan Area National Expressway Engineering Bureau,
Taipei, Taiwan in Chinese.
Chou, C.-C., and Chen, Y.-C., (2006). “Cyclic tests of post-tensioned precast CFT
segmental bridge columns with unbonded strands” J. Earthquake Engng. Struct. Dyn., 35,
159-175.
Chou, C.-C., and Hsu, C.-P.,(2008).”Hysteretic model development and seismic response
of unbonded post-tensioned precast CFT segmental bridge columns.” J. Earthquake
Engng. Struct. Dyn., 37, 919-934.
ElGawady, M., Booker, A.J., and Dawood, H., (2010). “Seismic behavior of post-
tensioned concrete filled fiber tubes.” J. Composites for Construction, ASCE, (to appear
in October 2010 issue)
ElGawady, M., and Shaalan, A., (2010- In review). “Seismic behavior of self-centering
bridge bents”, ASCE, Journal of Bridge Engineering.
Hewes, J. T., and Priestley N. (2002). “Seismic design and performance of precast
concrete segmental bridge columns.” Report No. SSRP-2001/25, Univ. of California at
San Diego.
Kwan,W.-P., and Billington, S. L. (2003). „„Unbonded posttensioned concrete bridge
piers. I: Monotonic and cyclic analyses.‟‟ J. Bridge Eng., 8(2), 92–101.
Kwan,W.-P., and Billington, S. L. (2003). „„Unbonded posttensioned concrete bridge
piers. II: Seismic analyses.‟‟ J. Bridge Eng., 8(2), 102–111.
Marriott., D., Pampanin, S., and Palermo, A., (2009). “Quasi-static and pseudo-dynamic
testing of unbonded post-tensioned rocking bridge piers with external replaceable
dissipaters” J. Earthquake Engng. Struct. Dyn., 38, 331-345.
Ou, Y.-C., Chiewanichakorn, M., Aref, A. J., and Lee, G. C. (2007). “Seismic
performance of segmental precast unbonded posttensioned concrete bridge columns.” J.
Str. Eng., 133(11), 1636-1647.
Shaalan, A. (2009). „„Performance of re-centering moment resisting frames composed of
continous and segmented precast post-tensioned concrete columns confined by FRP
tubes‟‟ M.Sc. thesis, Washington State Univ., WA, USA

16
CHAPTER THREE
BEHAVIOR OF SEGMENTAL PRECAST POST-TENSIONED BRIDGE PIERS UNDER
LATERAL LOADS: EXPERIMENTAL AND MODELING
Haitham Dawood1 Mohamed ElGawady
2§ Joshua Hewes
3
3.1 Abstract
Segmental precast post tensioned (SPPT) bridge pier is an economic construction system,
and a re-centering structural system. Understanding the seismic behavior of a SPPT system is an
important step towards its application in high seismic zones. This paper presents a detailed three
dimensional finite element model developed using the ABAQUS platform. A brief description
and discussion of cyclic tests on eight large scale SPPT piers was also presented. The test
investigated the effects of the pier aspect ratio and the initial post-tensioning force on the seismic
behavior and the reparability of the tested piers. The effects of confining the bottom segment
using steel tubes were also investigated. The experimental work showed that the SPPT pier
system is able to withstand large lateral drift angles with minimal damage. The finite element
model was validated against the experimental results and it showed good agreement. Finally,
sensitivity analyses using the finite element model showed that the model is sensitive to the
softening behavior of the concrete material constitutive law.
3.2 Keywords
Finite element method, concrete, precast, post-tensioned, bridge construction, piers
1 Graduate Research Assistant, Dept. of Civil and Environmental Engineering, Washington State University, Pullman, WA, [email protected] 2 Assistant Professor, Dept. of Civil and Environmental Engineering, Washington State University, Pullman, WA,
[email protected]; §Corresponding author
3 Assistant Professor, Dept. of Civil and Environmental Engineering, Northern Arizona University,

17
3.3 Introduction
Correctly designed and detailed reinforced concrete structures, under the prevailing
capacity design concepts, are anticipated to exhibit inelastic response leading to structural
damage and permanent residual drift angles at the conclusion of severe ground motion
excitations. This leads to long-term closure of highways while expensive retrofits, or even
complete replacements, are carried out. Following the Kobe earthquake (Japan 1995), over 100
reinforced concrete bridge piers were demolished due to a residual drift angles in excess of 1.5%
(Lee and Billington 2010).
Recent research on the seismic behavior of segmental precast post-tensioned (SPPT)
bridge piers has shown that they display less residual displacement and damage when compared
to conventional reinforced concrete (RC) bridge piers (e.g., Hewes 2002, Ou et al. 2007,
Marriott et al. 2009, ElGawady et al. 2010 and ElGawady and Shaalan 2010). The potential
benefits of using precast post-tensioned structural elements in high seismic zones were
highlighted in the U.S. PRESSS research program where a self-centering system that was
implemented with precast elements demonstrated superior seismic performance (Priestley et al.
1999).
A segmental precast pier consists of precast segments stacked on top of each other. The
segments are connected by unbonded post-tensioning tendons passing through a duct cast in the
segments during fabrication. The pier‟s segments will rock back and forth during ground motion
excitation and re-center upon termination of the shaking as a result of the restoring force
provided by the post-tensioning.
The effect of pier aspect ratio, applied initial post-tensioning force, applied external axial
load, and solid or hollow core cross sections as well as confinement of the segments using steel

18
stirrups, steel tubes, and/or fiber reinforced polymer tubes on the seismic performance of SPPT
piers has been investigated (e.g. Chang et al. 2002, Hewes 2002 and Ou et al. 2007, Marriott et
al. 2009, ElGawady et al. 2010(a), ElGawady et al. 2010(b), and ElGawady and Shaalan 2010).
These studies showed that SPPT piers were capable of withstanding large nonlinear
displacements without experiencing significant or sudden loss of strength. The nonlinear
behavior resulted not only from material nonlinearity, like in a conventional RC system, but also
from geometric nonlinearity resulted from opening of the interface joints between segments as
well as between the bottommost segment and the foundation. The significant contribution of the
geometric nonlinearity to the nonlinear behavior of the SPPT piers resulted in smaller damage
and residual displacement compared to their counterpart RC piers at a given lateral drift angle.
Currently, SPPT pier construction is an economical option to accelerate bridge
construction in regions of low seismicity in the USA. Examples of bridges constructed with
segmental piers include the Louetta Road Overpass (SH-249, Texas), Linn Cove Viaduct
(Grandfather Mountain, North Carolina), Sunshine Skyway Bridge (I-275, Florida), Varina-Enon
Bridge (I-295, Virginia), John T. Collinson Rail Bridge (Pensacola, Florida), Seven Mile Bridge
(Tallahassee, Florida), and the Chesapeake and Delaware Canal Bridge (St. Georges, Delaware).
However, the applications of this construction system in moderate to high seismic regions in the
USA are limited due to concerns about its seismic response and low energy dissipation
capabilities.
In an effort to increase the energy dissipation capacity of SPPT piers, researchers have
investigated the influence of internal bonded mild steel bars at the interfaces between the
segments as well as between the bottommost segment and foundation (Chang et al. 2002).
However, the yielding of the mild steel bars increased residual displacements and damage

19
compared to piers without mild steel. External energy dissipaters “fuses” have also been
investigated as a means of enhancing energy dissipation (Chou and Chen 2006, Marriott et al.
2009, Rouse 2009, ElGawady et al. 2010(a), ElGawady et al. 2010(b), and ElGawady and
Shaalan 2010). These external simple yield-dissipaters significantly increased the energy
dissipation with minor effects on the residual displacement of the system.
This paper presents a detailed three dimensional (3D) finite element (FE) model
developed using ABAQUS/Standard version 6.8-2 to capture the backbone curves of SPPT piers.
The paper starts with a detailed description of the FE model including the element types used,
material constitutive models, loading patterns, boundary conditions, and contact interaction
properties. Then, a discussion of an experimental study conducted on eight large scale SPPT
piers subjected to static-cyclic loading is presented. The developed model was validated against
the results of this experimental research. Finally, sensitivity analyses were carried out.
3.4 Finite Element Modeling of Self-Centering Piers
ABAQUS/Standard version 6.8-2, a general purpose finite element code, was selected as
a basic platform for this study. For the simulation of the SPPT pier system a built-in first-order
full integration 8-node linear brick element (C3D8) was used to represent the concrete and the
confining material in the model (Fig. 3.1). A 2-node linear beam element in space (B31) was
used to simulate the post-tensioning tendon. The mesh size was selected based on a sensitivity
analysis such that the analyses converge to the same output while maintaining a reasonable
computation effort.

20
Figure 3.1: A typical mesh and applied loads and displacements
for the SPPT pier.
Concrete damaged plasticity and concrete smeared cracking are the two models available
in ABAQUS/Standard 6.8-2 to model concrete material behavior. The concrete damaged
plasticity model (Lubliner et al. 1989 and Lee and Fenves 1998) assumes that the main two
concrete failure mechanisms are the tensile cracking and compression crushing of the concrete
material. Crack propagation is modeled by using continuum damage mechanics, i.e., stiffness
degradation. The damaged plasticity model was selected to be used in this study since it has
higher potential for convergence compared to concrete smeared cracking. Moreover, the concrete
damaged plasticity model is designed for applications in which the material is subjected to
monotonic, cyclic, and/or dynamic loading, which gives the model the potential to be applied
under different loading types.
Lateral
displacement
direction
Vertical
axial
load
Pier
Post tensioning
tendon
Foundation
21
To fully define the concrete material it is required to define material density, Young‟s
modulus, Poisson‟s ratio and the concrete damaged plasticity model parameters. The definition
of the concrete damaged plasticity model requires the definition of the plasticity parameters, as
well as compressive and tensile behavior. The five plasticity parameters are: the dilation angle in
degrees, the flow potential eccentricity, the ratio of initial equibiaxial compressive yield stress to
initial uniaxial compressive yield stress, the ratio of the second stress invariant on the tensile
meridian to that on the compressive meridian, and the viscosity parameter that defines visco-
plastic regularization. The aforementioned parameters were set to 1°, 0.1, 1.16, 0.66, and 0.0,
respectively. The values of the last four parameters were recommended by the ABAQUS
documentation for defining concrete material (ABAQUS version 6.8 documentation- SIMULIA
2008). The dilation angle was chosen to be unity to give stability to the material model while
minimizing the confinement effect of the material as the confinement effects were taken
independently into consideration while getting the stress strain curves of the confined concrete.
For a given concrete characteristic compressive stress at 28 days (f‟c) and confinement
characteristics (thickness, material‟s type, and properties) the concrete stress strain curve in
compression can be developed using a suitable confined concrete model. (e.g., Mander et al.
1988, Samaan et al. 1998, Fam and Rizkalla 2001, Beque et al. 2003, and Teng et al. 2009).
The concrete Young‟s Modulus can be either measured according to ASTM (C469) or
calculated using Eq. 3.1 (ACI318-2008).
Ec= 4733 𝑓𝑐′ MPa [57,000 𝑓𝑐′ psi] (Eq. 3.1)
The concrete behavior in tension was modeled using a linear elastic approach until
cracking is initiated at f‟t where f‟t is defined using Eq. 3.2 (ACI318-2008), followed by a
22
horizontal plateau. This horizontal plateau was used to improve the numerical stability and
convergence of the model (Wight 2006).
f‟t= 0.62276 𝑓′𝑐 Mpa [ 7.5 𝑓′𝑐 psi] (Eq. 3.2)
The concrete compressive and tensile behaviors were inputted to the program using a
tabulated form of yield stress versus inelastic strain and yield stress versus cracking strain
respectively (ABAQUS version 6.8 documentation- SIMULIA 2008).
The constitutive model used to simulate the steel tendons and steel jackets was the
classical metal plasticity model. An idealized elasto-plastic stress strain curve for each material
was developed and used as the input for the ABAQUS model. The input for the classic metal
plasticity model includes density, Young‟s Modulus, Poisson‟s Ratio and the yield stress versus
plastic strain submitted in a tabular form.
The three translational (Ux, Uy, Uz) degrees of freedom (DOF) were constrained for all
the nodes at the bottom surface of the foundation (Fig. 3.1). Since the pier is symmetric with
respect to an XY plane, a symmetry (ZSYMM) boundary condition was used along the plane of
symmetry to reduce the analysis time.
The post-tensioning tendons in the model are embedded at the top into a loading stub
representing the bridge superstructure and at the bottom into the foundation (Fig. 3.1). The
normal contact behavior between the concrete surfaces and between the confining steel tube and
the concrete segments was modeled using the default constraint enforcement method with a hard
contact pressure-over closure having finite sliding with node to surface as the discretization
method. The penalty method was chosen to formulate the tangential contact behavior between
different surfaces of the model.

23
Three loading steps were used for the analysis of the models. During the first step, a post-
tensioning force was applied using a stress-type initial condition to the tendons. During the
second step, the gravity load was applied as a traction force applied to the top surface of the
model in the negative y-direction (Fig. 3.1). The third loading step consisted of a monotonic push
in the x-direction simulated by a linearly increasing lateral displacement until the failure of the
model occurs and the analysis was not able to proceed any further.
3.5 Experimental Work
3.5.1 Test Pier Design Details
Four large-scale precast concrete segmented piers (Table 3.1) were constructed and tested
at the Powell Structural Research Laboratories on the University of California at San Diego
(UCSD) to investigate their strength – deformation characteristics and failure modes under
simulated lateral seismic loading (Hewes 2002). The following primary features were
investigated in the experimental program: (1) Pier aspect ratio, (2) Lateral confinement level at
the maximum moment location, (3) Initial tendon stress, and (4) Damage reparability. The piers
were circular in cross-section with diameter of 610 mm [24 in], and the main longitudinal
reinforcement in each pier consisted of a single unbonded concentric tendon comprised of 27 –
12.7 mm [0.5 in] diameter ASTM A779 Grade 270 (1860 MPa [270 ksi]) low-relaxation steel
prestressing strands with a total cross-sectional area of 2665 mm2
[4.13 in2]. Two test piers had
an aspect ratio (AR) of 6, and the other two piers had AR = 3, where aspect ratio is defined as
the height between point of lateral loading and pier base divided by pier diameter.

24
Table 3.1: The matrix of the experimental work
Pier
Pier
aspect
ratio
No. of
segments
Steel jacket
thickness
Initial
tendon‟s
stress /
ultimate
tendon‟s
tensile stress
Measured post-
tensioning
stress MPa [psi]
JH11 *
6 4 6.0 mm
[0.24 in]
40% 1021 [148,090]
JH12**
60% 1215 [176,238]
JH21 *
6 4 2.8 mm
[0.11 in]
40% 801 [116,200]
JH22**
60% 946 [137,210]
JH31 *
3 2 2.8 mm
[0.11 in]
40% 773 [112,114]
JH32**
60% 1020 [147,939]
JH41 *
3 2 6.0 mm
[0.24 in]
40% 779 [112,984]
JH42**
60% 1002 [145,328] * Virgin specimens
**Retested specimens after retrofitting
The bottommost segment of each pier utilized an ASTM A569, A36 steel jacket to
provide the relatively high level of lateral confinement which is required due to the high
compression strains associated with a pier rocking about its base. For each aspect ratio, one pier
used a jacket with a transverse volumetric reinforcing ratio of ρv= 1.9% and the other with ρv=
3.9%. The steel jacket terminated approximately 25 mm [1.0 in] above the bottom of the segment
to prevent the jacket from bearing on the footing during testing. The height of the steel jackets in
all piers was selected such that spalling of cover concrete in the non-jacketed segments above it
would be avoided. The jacketed segments did not contain any longitudinal reinforcement other
than the prestressing tendon. Table 3.2 gives the jacket tensile properties and Table 3.3 gives the
concrete compressive strength measured for each pier at the 28th day and the day of testing.

25
Table 3.2: Summary of steel coupons tension tests
Piers Description Size Yield Strength
(MPa)
Ultimate
Strength
(MPa)
JH1 and JH2 Thin coupons 2.9 mm thick 283 ± 7 390 ± 7
Thick coupons 6.2 mm thick 303 ± 3 464 ± 3
JH3 and JH4 Thin coupons 2.8 mm thick 290 364
Thick coupons 6.0 mm thick 317 463
Table 3.3 Concrete compressive strength for test units
(fc‟, MPa)
Pier 28-Day Day of Test 1 Day of Test 2
JH1 44.0 0.3
48.7 0.6 57.0 1
JH2 50.8 1.1 55.5 1
JH3 48.5 1.1
57.3 1.6 57.1 0.8
JH4 58.1 1.1 57.8 1.7
Footing 49.5 1 61.4 1 --
All other pier segments above the base segment used traditional transverse spiral rebar
for lateral confinement. The transverse spiral was Grade 60 #3 bar spaced at 75 mm [3.0 in] and
150 mm [5.9 in] for piers with AR = 6 and AR = 3, respectively. The upper non-jacketed
segments also contained eight Grade 60 #4 longitudinal bars spaced evenly around the perimeter
of the section with a cover of 25.4 mm [1.0 in]. Test piers JH1 and JH2 had a total of four precast
piers segments while JH3 and JH4 had two precast segments each. The unbonded tendon length
was Lt = 4953 mm [195 in] for JH1 and JH2, while that for JH3 and JH4 was Lt = 3137 mm
[123.5 in].
In order to investigate the influence of initial tendon stress level on pier behavior, and to
evaluate how well a pier could be repaired after a seismic event, each pier was tested twice. The
first test on each pier was conducted at a given initial tendon stress, and then each pier was
inspected, repaired, and post-tensioned to a higher initial tendon stress level for the second test.
Table 3.1 provides a summary of pier test data including initial tendon stress level.
26
3.5.2 Test Setup, Instrumentation, and Loading Protocol
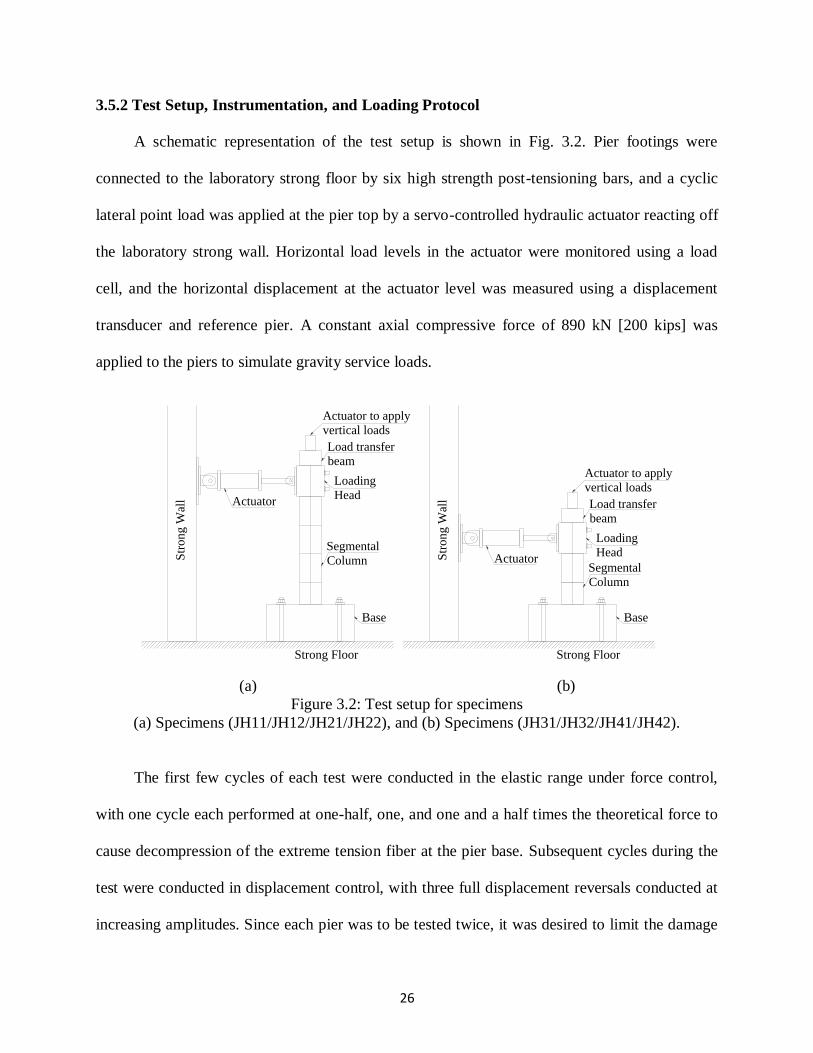
A schematic representation of the test setup is shown in Fig. 3.2. Pier footings were
connected to the laboratory strong floor by six high strength post-tensioning bars, and a cyclic
lateral point load was applied at the pier top by a servo-controlled hydraulic actuator reacting off
the laboratory strong wall. Horizontal load levels in the actuator were monitored using a load
cell, and the horizontal displacement at the actuator level was measured using a displacement
transducer and reference pier. A constant axial compressive force of 890 kN [200 kips] was
applied to the piers to simulate gravity service loads.
(a) (b)
Figure 3.2: Test setup for specimens
(a) Specimens (JH11/JH12/JH21/JH22), and (b) Specimens (JH31/JH32/JH41/JH42).
The first few cycles of each test were conducted in the elastic range under force control,
with one cycle each performed at one-half, one, and one and a half times the theoretical force to
cause decompression of the extreme tension fiber at the pier base. Subsequent cycles during the
test were conducted in displacement control, with three full displacement reversals conducted at
increasing amplitudes. Since each pier was to be tested twice, it was desired to limit the damage
Actuator
Segmental
Column
Strong Floor
Loading
Head
Actuator to apply
vertical loads
Str
ong W
all
Load transfer
beam
ActuatorSegmental
Column
Strong Floor
Base
Loading
Head
Actuator to apply
vertical loads
Load transfer
beam
Base
Str
ong W
all

27
in the first test of each pier to an amount that could be repaired relatively easily. Thus the
maximum drift imposed during the first test of each specimen was dictated by the observed
damage at a particular drift.
3.5.3 Description of Test Results
All test piers exhibited ductile flexural response up to the maximum imposed drift of each
test, as is visible in the hysteretic force – displacement response plots shown in Figs. 3.3 and 3.4.
A prominent feature of piers with unbonded tendons is the recentering tendency, which also
implies less hysteretic energy dissipation compared to a traditional reinforced concrete pier.
Initial concrete crushing was observed at the region in the bottommost segment between the
bottom of the steel jacket and top of footing at a drift angle of 1.2% for all piers during their first
test. However, the extent of spalling was minor and the damage to this region was very limited
during the first tests. After drift angle levels of about 0.5%, pier top displacement was observed
to be primarily due to rotation of the pier about the compression toe. This was evidenced by a
large flexural crack opening of the interface joint between the pier and its foundation with no
significant flexural crack openings above the footing level.

28
-160 -120 -80 -40 0 40 80 120 160
Lateral Displacement (mm)
-250
-200
-150
-100
-50
0
50
100
150
200
250
Lat
eral
Forc
e (k
N)
-4 -3 -2 -1 0 1 2 3 4Drif t (%)
Pull
Push
(a) -160 -120 -80 -40 0 40 80 120 160
Lateral Displacement (mm)
-250
-200
-150
-100
-50
0
50
100
150
200
250
Lat
eral
Forc
e (k
N)
-4 -3 -2 -1 0 1 2 3 4Drif t (%)
Pull
Push
(b)
-240 -180 -120 -60 0 60 120 180 240
Lateral Displacement (mm)
-250
-200
-150
-100
-50
0
50
100
150
200
250
Lat
eral
Forc
e (k
N)
-6 -5 -4 -3 -2 -1 0 1 2 3 4 5 6Drif t (%)
Pull
Push
(c) -240 -180 -120 -60 0 60 120 180 240
Lateral Displacement (mm)
-250
-200
-150
-100
-50
0
50
100
150
200
250
Lat
eral
Forc
e (k
N)
-6 -5 -4 -3 -2 -1 0 1 2 3 4 5 6Drif t (%)
Pull
Push
(d)
Figure 3.3: Experimental hysteretic response plots: (a) JH11; (b) JH21; (c) JH12; and (d) JH22
29
-80 -40 0 40 80
Lateral Displacement (mm)
-500
-400
-300
-200
-100
0
100
200
300
400
500L
ater
al F
orc
e (k
N)
-4 -3 -2 -1 0 1 2 3 4Drif t (%)
Pull
Push
(a) -80 -40 0 40 80
Lateral Displacement (mm)
-500
-400
-300
-200
-100
0
100
200
300
400
500
Lat
eral
Forc
e (k
N)
-4 -3 -2 -1 0 1 2 3 4Drif t (%)
Pull
Push
(b)
-120 -80 -40 0 40 80 120
Lateral Displacement (mm)
-500
-400
-300
-200
-100
0
100
200
300
400
500
Lat
eral
Forc
e (k
N)
-6 -5 -4 -3 -2 -1 0 1 2 3 4 5 6Drif t (%)
Pull
Push
(c)
-120 -80 -40 0 40 80 120
Lateral Displacement (mm)
-500
-400
-300
-200
-100
0
100
200
300
400
500
Lat
eral
Fo
rce
(kN
)
-6 -5 -4 -3 -2 -1 0 1 2 3 4 5 6Drif t (%)
Pull
Push
(d)
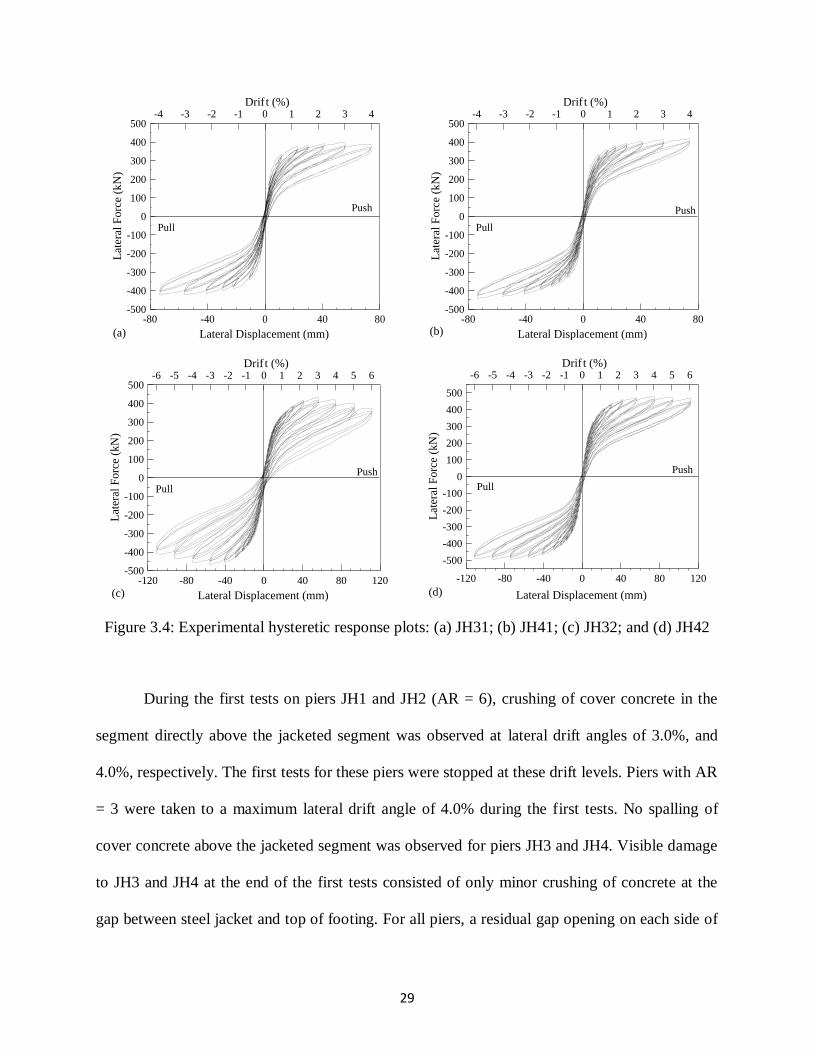
Figure 3.4: Experimental hysteretic response plots: (a) JH31; (b) JH41; (c) JH32; and (d) JH42
During the first tests on piers JH1 and JH2 (AR = 6), crushing of cover concrete in the
segment directly above the jacketed segment was observed at lateral drift angles of 3.0%, and
4.0%, respectively. The first tests for these piers were stopped at these drift levels. Piers with AR
= 3 were taken to a maximum lateral drift angle of 4.0% during the first tests. No spalling of
cover concrete above the jacketed segment was observed for piers JH3 and JH4. Visible damage
to JH3 and JH4 at the end of the first tests consisted of only minor crushing of concrete at the
gap between steel jacket and top of footing. For all piers, a residual gap opening on each side of
30
the section at the pier base (i.e. the compression toe region) existed at the end of testing as a
result of very high compression strains and concrete crushing. Residual pier drift angles at the
end of testing were on the order of 0.1% for piers JH1, JH3, and JH4, while that for JH2 was
0.30%.
The damaged regions at the pier base and above the jacket (piers JH1 and JH2) were
repaired after the first test. Loose concrete was removed, and the regions were scrubbed with a
wire brush, rinsed with water to remove any remaining concrete particles, and then allowed to
dry. The spalled cover concrete above the steel jacket was reinstated by patching the area with a
non-sag polymer-modified, Portland cement mortar. The residual crack at the base of each pier
was grouted using a high-modulus, low-viscosity, high-strength epoxy resin adhesive. After the
spalled regions in piers JH1 and JH2 were repaired, the lower half of the second segment was
wrapped with five layers of fiberglass in an effort to prevent spalling of cover concrete during
the second test. Five layers of the Tyfo Fibrwrap SEH-51 fiber reinforced polymer (FRP)
(Table 3.4) were applied. Each continuous band was installed with a 152 mm [6.0 in] minimum
overlap back onto itself.
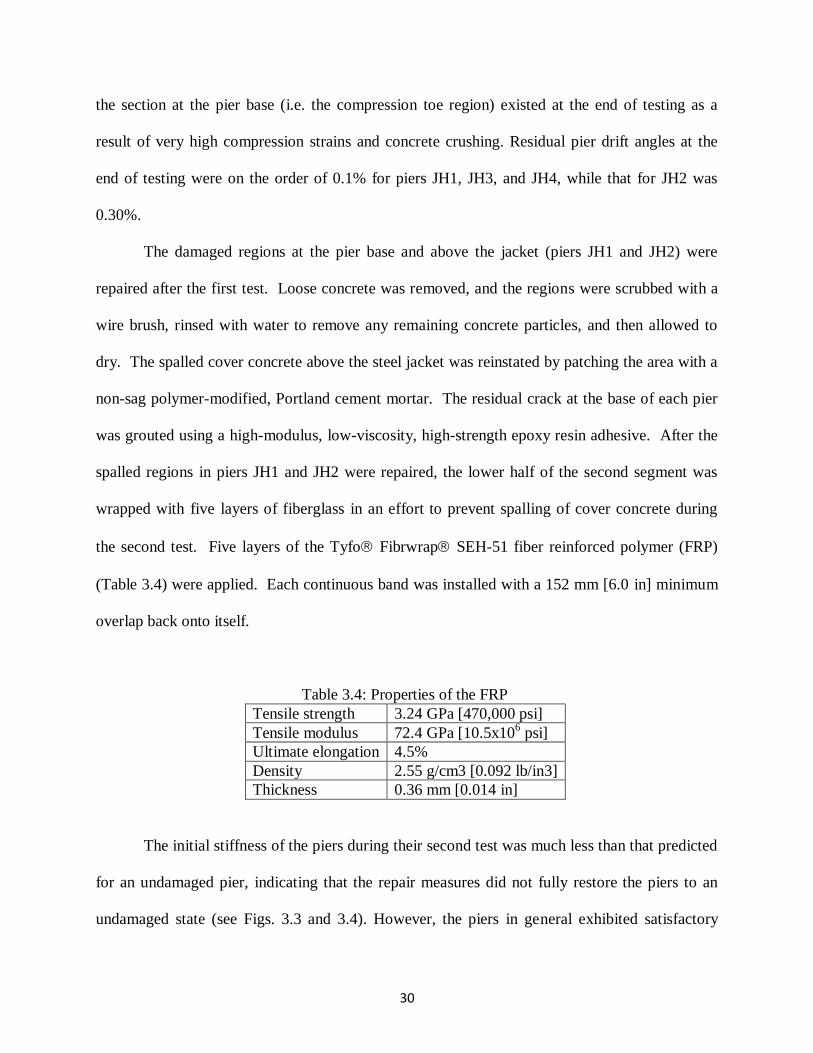
Table 3.4: Properties of the FRP
Tensile strength 3.24 GPa [470,000 psi]
Tensile modulus 72.4 GPa [10.5x10⁶ psi]
Ultimate elongation 4.5%
Density 2.55 g/cm3 [0.092 lb/in3]
Thickness 0.36 mm [0.014 in]
The initial stiffness of the piers during their second test was much less than that predicted
for an undamaged pier, indicating that the repair measures did not fully restore the piers to an
undamaged state (see Figs. 3.3 and 3.4). However, the piers in general exhibited satisfactory

31
lateral strength –deformation behavior. Piers JH1, JH3 and JH4 achieved a maximum drift angle
of 6% while testing of JH2 was terminated at 5% drift angle. The 6% maximum imposed drift
during testing corresponded to the maximum displacement limit of the test setup. Comparing the
second test hysteretic responses (Figs. 3.3 and 3.4 (c) and (d)), it is seen that piers with the higher
jacket confinement level (JH1 and JH4) experienced less damage at their bases, achieved higher
lateral strengths, and showed less stiffness and strength degradation at high drifts. Pier JH1
(AR=6) experienced a 6% decrease in lateral strength going from 5% drift to the maximum
imposed drift, while JH4 (AR=3) did not show any reduction in strength up to the maximum
imposed drift angle level. Specimen JH2 experienced a 20% decrease in strength at maximum
drift angle while JH3 suffered a 13% drop in lateral capacity at 6% drift angle. Residual drift
angles for JH1, JH3, and JH4 at the end of the second testing were about 0.2%, while that for
JH2 was 0.7%. No spalling of cover concrete above the steel jackets was observed during the
second tests on the piers.
3.6 Model Validation
The sizes of the elements chosen for the concrete segments, concrete base, and upper
loading stub were 94, 127, and 130 mm [3.7, 5 and 9 inches], respectively. The slender pier‟s
model includes 1720 continuum elements, 174 beam elements and a total of 3086 nodes, while
the squat piers‟ model includes 1072 continuum elements, 102 beam elements and a total of 1974
nodes.
The passive confining stresses imposed by the steel stirrups, steel tube, and the FRP
sheets on the concrete core during loading alter its stress strain behavior by increasing both its
peak strength and ductility. Through this study, Mander et al.‟s (1988) and Samaan et al.‟s
32
(1998) models were used for developing the stress-strain behavior of concrete confined using
steel and FRP wrapping, respectively.
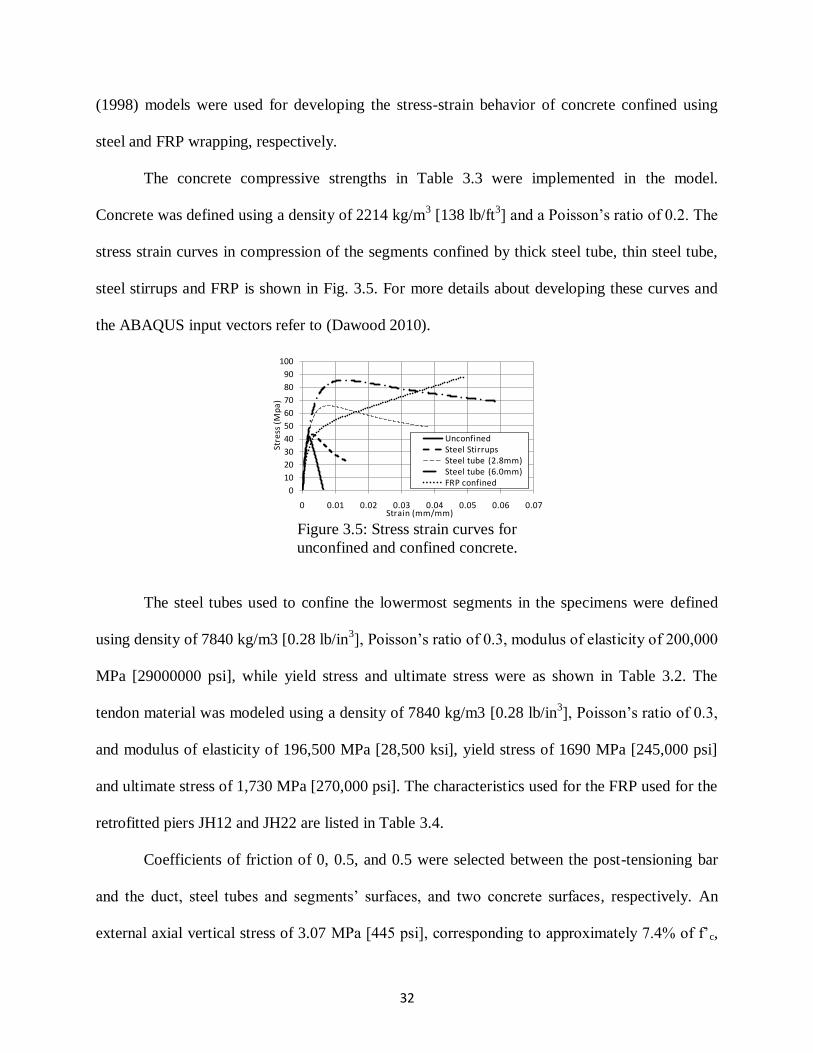
The concrete compressive strengths in Table 3.3 were implemented in the model.
Concrete was defined using a density of 2214 kg/m3 [138 lb/ft
3] and a Poisson‟s ratio of 0.2. The
stress strain curves in compression of the segments confined by thick steel tube, thin steel tube,
steel stirrups and FRP is shown in Fig. 3.5. For more details about developing these curves and
the ABAQUS input vectors refer to (Dawood 2010).
Figure 3.5: Stress strain curves for
unconfined and confined concrete.
The steel tubes used to confine the lowermost segments in the specimens were defined
using density of 7840 kg/m3 [0.28 lb/in3], Poisson‟s ratio of 0.3, modulus of elasticity of 200,000
MPa [29000000 psi], while yield stress and ultimate stress were as shown in Table 3.2. The
tendon material was modeled using a density of 7840 kg/m3 [0.28 lb/in3], Poisson‟s ratio of 0.3,
and modulus of elasticity of 196,500 MPa [28,500 ksi], yield stress of 1690 MPa [245,000 psi]
and ultimate stress of 1,730 MPa [270,000 psi]. The characteristics used for the FRP used for the
retrofitted piers JH12 and JH22 are listed in Table 3.4.
Coefficients of friction of 0, 0.5, and 0.5 were selected between the post-tensioning bar
and the duct, steel tubes and segments‟ surfaces, and two concrete surfaces, respectively. An
external axial vertical stress of 3.07 MPa [445 psi], corresponding to approximately 7.4% of f‟c,
0
10
20
30
40
50
60
70
80
90
100
0 0.01 0.02 0.03 0.04 0.05 0.06 0.07
Stre
ss (
Mp
a)
Strain (mm/mm)
UnconfinedSteel StirrupsSteel tube (2.8mm)Steel tube (6.0mm)FRP confined
33
was applied to the top surface of the piers at the loading stub to represent the service load acting
on the bridge‟s superstructure.
3.7 Analyses results
The FE models were able to capture the behavior of the eight specimens described
previously (Fig. 3.6). While applying the lateral load, the lateral displacement of the pier
increased approximately linearly while all the interface joints between the different segments
remained intact. This linear behavior continued until the normal stress under the heel of the pier
reached zero (neutral axis at the edge of the cross section). Beyond that, the first opening at the
interface joint between the foundation and the bottommost segment was observed and softening
in the stiffness was observed as well. While increasing the lateral load, the neutral axis continued
to move through the pier‟s cross section towards its geometric centroid, and the opening of the
interface joint between the bottommost segment and the foundation increased. Fig. 3.6(b) shows
the discontinuity of the normal strains at the interface joints which was expected once the
interface joints opened. Once the neutral axis reached the geometric centroid of the pier‟s cross
section, more softening in the stiffness of the system occurred rapidly while the post-tensioning
stresses increased rapidly. The same interface joint opening mechanism occurred at the second
interface joint between the first and the second segments. However, the neutral axis did not reach
the geometric centroid of the pier at this interface joint. Fig. 3.7 shows the different bending
stresses and openings at the different interface joints. This behavior is similar to what was
observed during the experimental tests.
34
(a) (b)
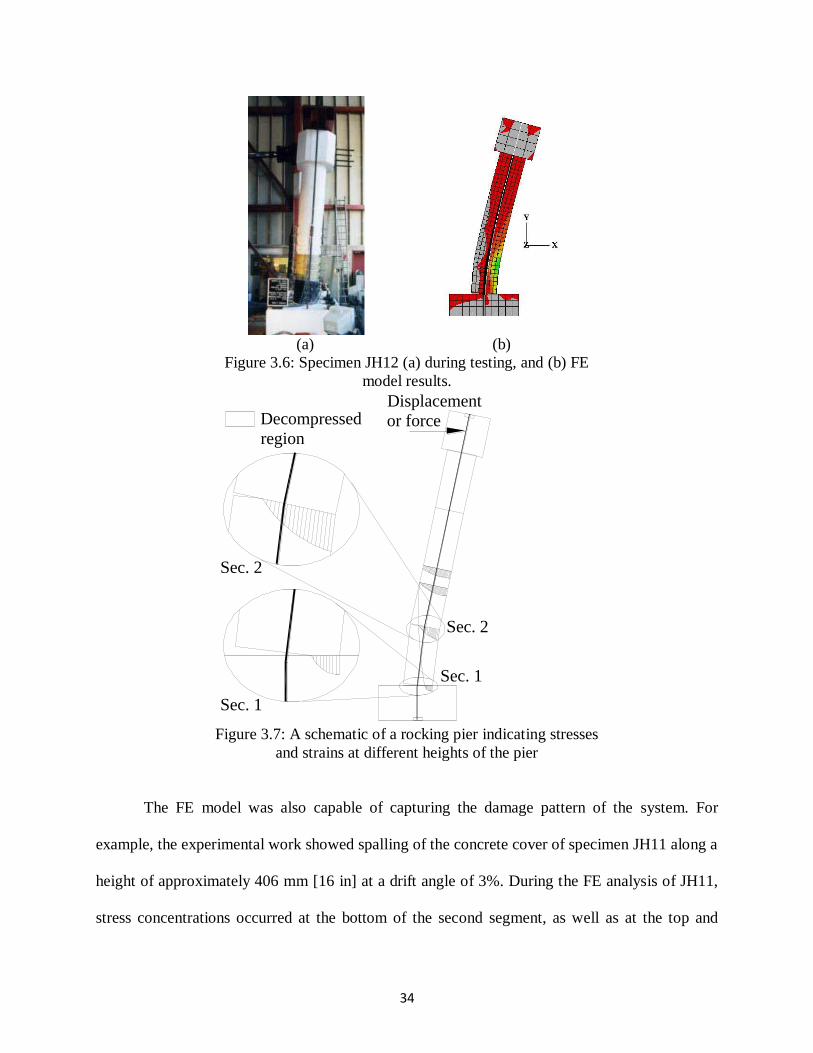
Figure 3.6: Specimen JH12 (a) during testing, and (b) FE
model results.
Figure 3.7: A schematic of a rocking pier indicating stresses
and strains at different heights of the pier
The FE model was also capable of capturing the damage pattern of the system. For
example, the experimental work showed spalling of the concrete cover of specimen JH11 along a
height of approximately 406 mm [16 in] at a drift angle of 3%. During the FE analysis of JH11,
stress concentrations occurred at the bottom of the second segment, as well as at the top and
Displacement
or force
Sec. 1
Sec. 2
Decompressed
region
Sec. 1
Sec. 2

35
bottom of the bottommost segment. At a lateral drift of 3%, since the bottommost segment was
confined using the steel jacket, the segment was able to reach high strains without any potential
concrete crushing. However, the second segment was a conventional RC segment and the strains
in the concrete cover exceeded a potential spalling strain of 0.003 mm/mm along a height of
approximately 533 mm [21 in] (Fig. 3.8(b)). Finally, it is worth noting that during the
experimental work and at lateral drift of 3%, significant concrete crushing was reported. The
analysis showed that the strength degradation of the pier started at a lateral drift of 2.5%.

36
(a) (b)
Figure 3.8: Specimen JH11 at failure (a) experimental, and (b) analytical.
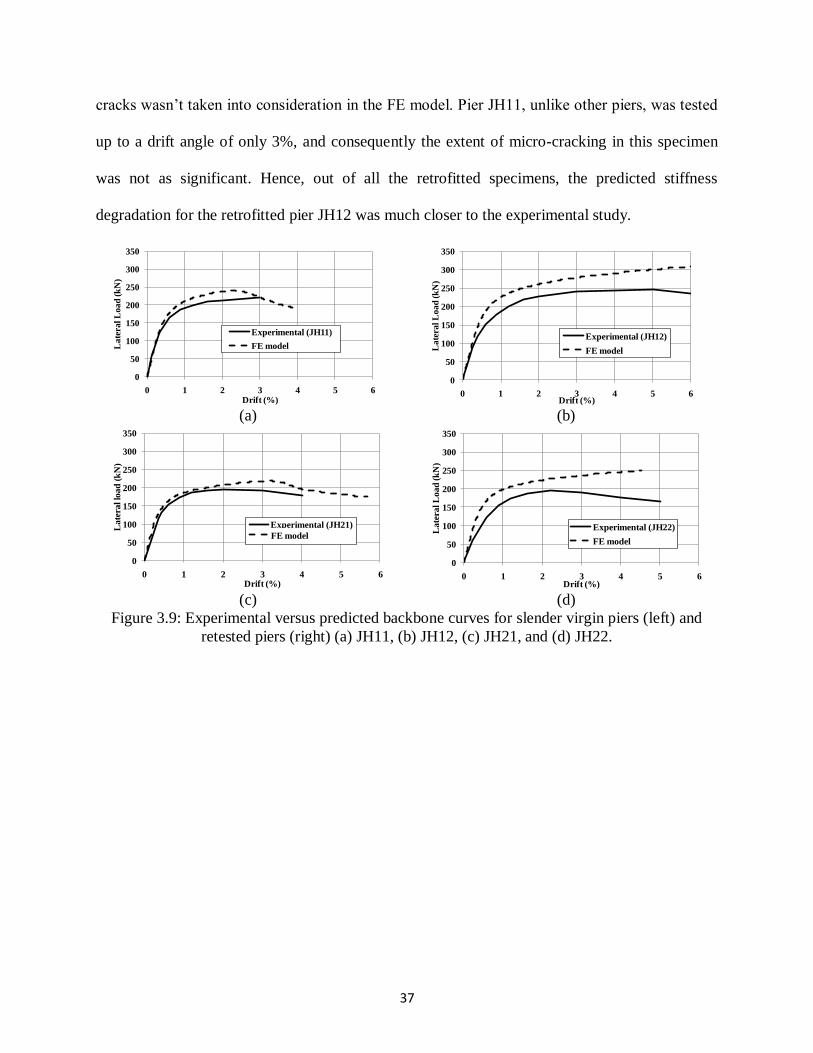
Figs. 3.9 and 3.10 show the predicted lateral forces versus drift angles and the
experimental backbone curves of the slender and squat piers presented in the experimental
section, respectively. As shown in the figures, the model was able to capture the general
nonlinear behavior of all specimens. The model was able to capture the initial tangent stiffness of
all piers. However, the stiffness degradation rate was underestimated for specimens JH12, JH22,
JH32 and JH42. The aforementioned specimens were retests of specimens JH11, JH21, JH31 and
JH41 after retrofitting and applying a higher post-tensioning stress. This shows that the behavior
of the retrofitted piers was affected after the first testing due to micro cracks in the concrete and
the retrofitting was not able to fully recover the concrete stiffness. The effect of these micro
37
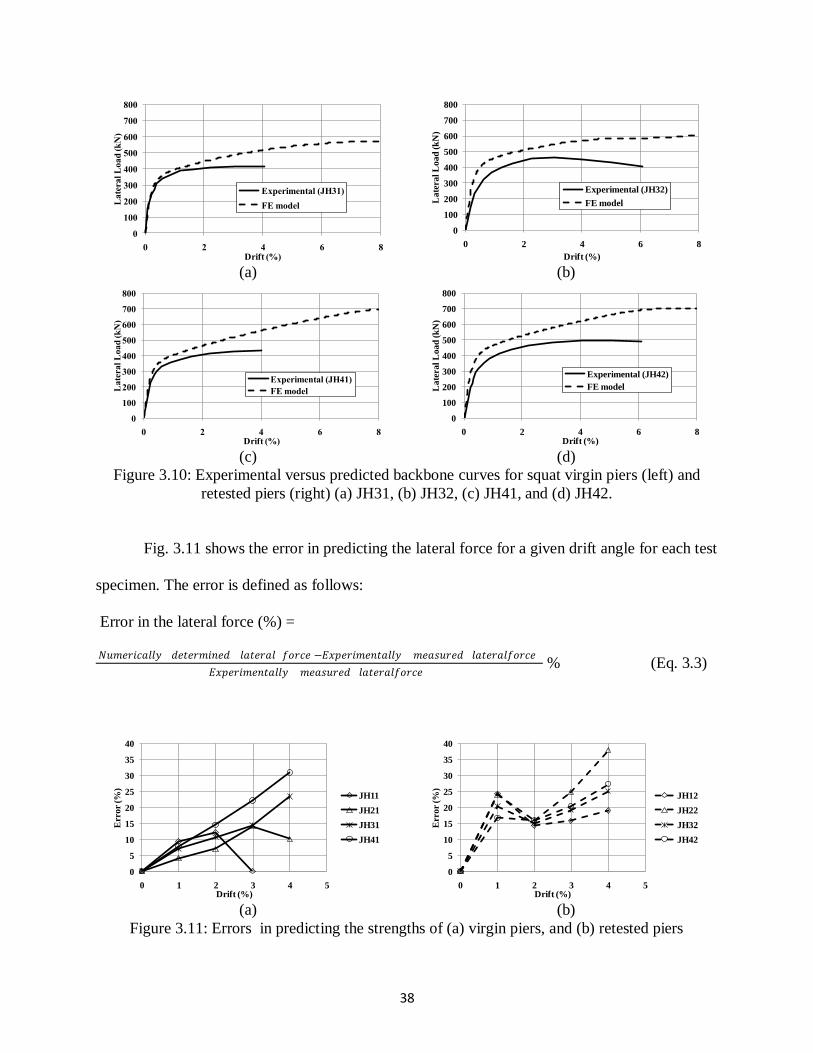
cracks wasn‟t taken into consideration in the FE model. Pier JH11, unlike other piers, was tested
up to a drift angle of only 3%, and consequently the extent of micro-cracking in this specimen
was not as significant. Hence, out of all the retrofitted specimens, the predicted stiffness
degradation for the retrofitted pier JH12 was much closer to the experimental study.
(a) (b)
(c) (d)
Figure 3.9: Experimental versus predicted backbone curves for slender virgin piers (left) and
retested piers (right) (a) JH11, (b) JH12, (c) JH21, and (d) JH22.
0
50
100
150
200
250
300
350
0 1 2 3 4 5 6
La
tera
l L
oa
d (
kN
)
Drift (%)
Experimental (JH11)
FE model
0
50
100
150
200
250
300
350
0 1 2 3 4 5 6
Late
ral L
oad
(k
N)
Drift (%)
Experimental (JH12)
FE model
0
50
100
150
200
250
300
350
0 1 2 3 4 5 6
Late
ral
load
(k
N)
Drift (%)
Experimental (JH21)
HP21
0
50
100
150
200
250
300
350
0 1 2 3 4 5 6
Late
ral L
oad
(k
N)
Drift (%)
Experimental (JH22)
FE model
0
50
100
150
200
250
300
350
0 1 2 3 4 5 6
Late
ral L
oad
(k
N)
Drift (%)
Experimental (JH22)
FE model
38
(a) (b)
(c) (d)
Figure 3.10: Experimental versus predicted backbone curves for squat virgin piers (left) and
retested piers (right) (a) JH31, (b) JH32, (c) JH41, and (d) JH42.
Fig. 3.11 shows the error in predicting the lateral force for a given drift angle for each test
specimen. The error is defined as follows:
Error in the lateral force (%) =
𝑁𝑢𝑚𝑒𝑟𝑖𝑐𝑎𝑙𝑙𝑦 𝑑𝑒𝑡𝑒𝑟𝑚𝑖𝑛𝑒𝑑 𝑙𝑎𝑡𝑒𝑟𝑎𝑙 𝑓𝑜𝑟𝑐𝑒 −𝐸𝑥𝑝𝑒𝑟𝑖𝑚𝑒𝑛𝑡𝑎𝑙𝑙𝑦 𝑚𝑒𝑎𝑠𝑢𝑟𝑒𝑑 𝑙𝑎𝑡𝑒𝑟𝑎𝑙𝑓𝑜𝑟𝑐𝑒
𝐸𝑥𝑝𝑒𝑟𝑖𝑚𝑒𝑛𝑡𝑎𝑙𝑙𝑦 𝑚𝑒𝑎𝑠𝑢𝑟𝑒𝑑 𝑙𝑎𝑡𝑒𝑟𝑎𝑙𝑓𝑜𝑟𝑐𝑒 % (Eq. 3.3)
(a) (b)
Figure 3.11: Errors in predicting the strengths of (a) virgin piers, and (b) retested piers
0
100
200
300
400
500
600
700
800
0 2 4 6 8
Late
ral
Load
(k
N)
Drift (%)
Experimental (JH31)
FE model
0
100
200
300
400
500
600
700
800
0 2 4 6 8
Late
ral
Load
(k
N)
Drift (%)
Experimental (JH32)
FE model
0
100
200
300
400
500
600
700
800
0 2 4 6 8
Late
ral
Loa
d (
kN
)
Drift (%)
Experimental (JH41)
FE model
0
100
200
300
400
500
600
700
800
0 2 4 6 8L
ate
ral
Load
(k
N)
Drift (%)
Experimental (JH42)
FE model
0
5
10
15
20
25
30
35
40
0 1 2 3 4 5
Err
or
(%)
Drift (%)
JH11
JH21
JH31
JH41
0
5
10
15
20
25
30
35
40
0 1 2 3 4 5
Err
or
(%)
Drift (%)
JH12
JH22
JH32
JH42
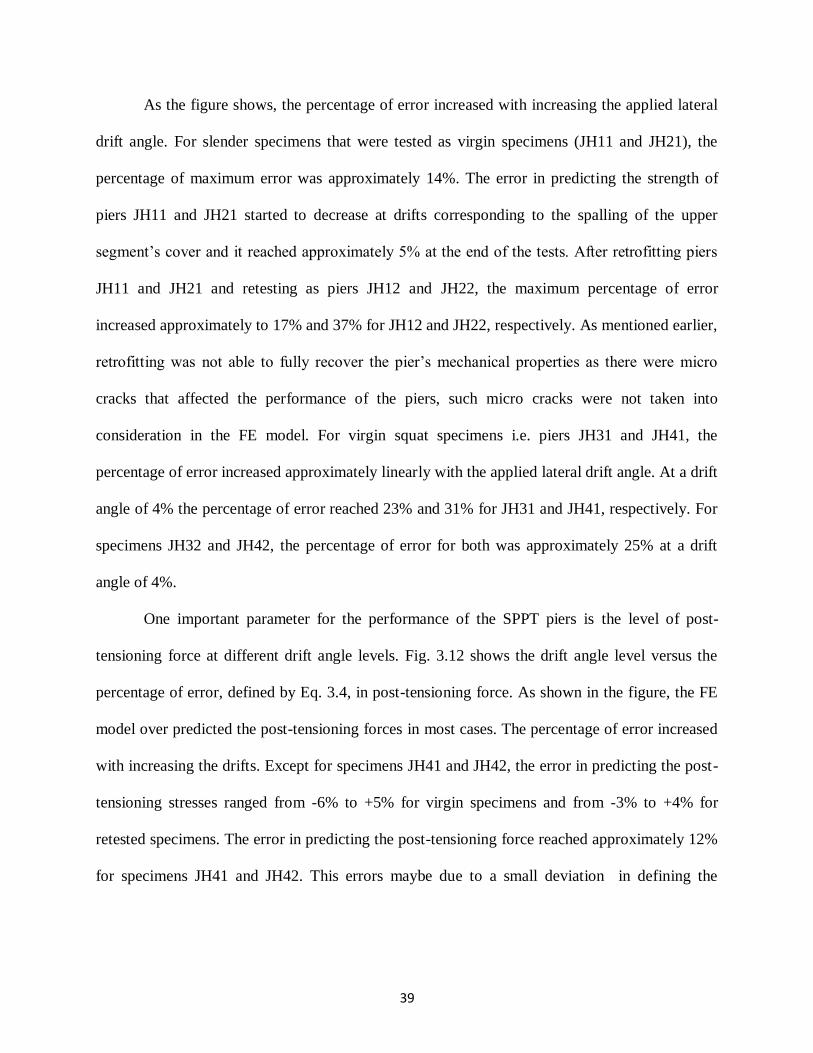
39
As the figure shows, the percentage of error increased with increasing the applied lateral
drift angle. For slender specimens that were tested as virgin specimens (JH11 and JH21), the
percentage of maximum error was approximately 14%. The error in predicting the strength of
piers JH11 and JH21 started to decrease at drifts corresponding to the spalling of the upper
segment‟s cover and it reached approximately 5% at the end of the tests. After retrofitting piers
JH11 and JH21 and retesting as piers JH12 and JH22, the maximum percentage of error
increased approximately to 17% and 37% for JH12 and JH22, respectively. As mentioned earlier,
retrofitting was not able to fully recover the pier‟s mechanical properties as there were micro
cracks that affected the performance of the piers, such micro cracks were not taken into
consideration in the FE model. For virgin squat specimens i.e. piers JH31 and JH41, the
percentage of error increased approximately linearly with the applied lateral drift angle. At a drift
angle of 4% the percentage of error reached 23% and 31% for JH31 and JH41, respectively. For
specimens JH32 and JH42, the percentage of error for both was approximately 25% at a drift
angle of 4%.
One important parameter for the performance of the SPPT piers is the level of post-
tensioning force at different drift angle levels. Fig. 3.12 shows the drift angle level versus the
percentage of error, defined by Eq. 3.4, in post-tensioning force. As shown in the figure, the FE
model over predicted the post-tensioning forces in most cases. The percentage of error increased
with increasing the drifts. Except for specimens JH41 and JH42, the error in predicting the post-
tensioning stresses ranged from -6% to +5% for virgin specimens and from -3% to +4% for
retested specimens. The error in predicting the post-tensioning force reached approximately 12%
for specimens JH41 and JH42. This errors maybe due to a small deviation in defining the
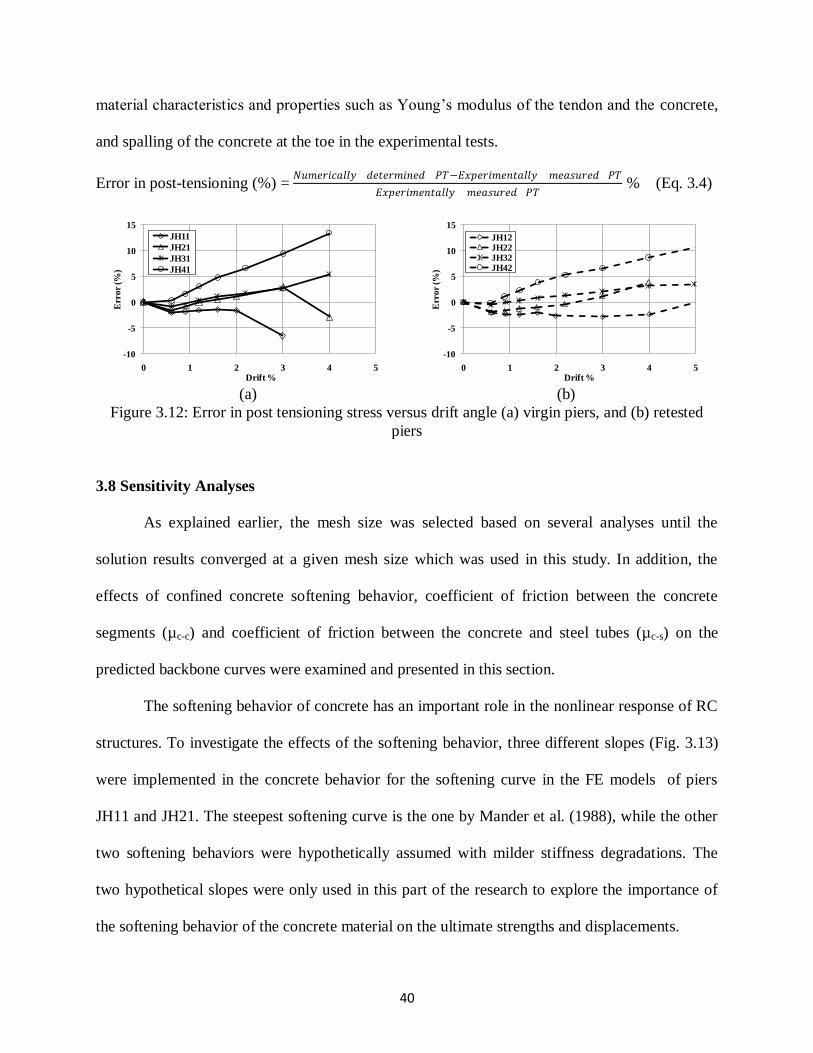
40
material characteristics and properties such as Young‟s modulus of the tendon and the concrete,
and spalling of the concrete at the toe in the experimental tests.
Error in post-tensioning (%) = 𝑁𝑢𝑚𝑒𝑟𝑖𝑐𝑎𝑙𝑙𝑦 𝑑𝑒𝑡𝑒𝑟𝑚𝑖𝑛𝑒𝑑 𝑃𝑇−𝐸𝑥𝑝𝑒𝑟𝑖𝑚𝑒𝑛𝑡𝑎𝑙𝑙𝑦 𝑚𝑒𝑎𝑠𝑢𝑟𝑒𝑑 𝑃𝑇
𝐸𝑥𝑝𝑒𝑟𝑖𝑚𝑒𝑛𝑡𝑎𝑙𝑙𝑦 𝑚𝑒𝑎𝑠𝑢𝑟𝑒𝑑 𝑃𝑇 % (Eq. 3.4)
(a) (b)
Figure 3.12: Error in post tensioning stress versus drift angle (a) virgin piers, and (b) retested
piers
3.8 Sensitivity Analyses
As explained earlier, the mesh size was selected based on several analyses until the
solution results converged at a given mesh size which was used in this study. In addition, the
effects of confined concrete softening behavior, coefficient of friction between the concrete
segments (µc-c) and coefficient of friction between the concrete and steel tubes (µc-s) on the
predicted backbone curves were examined and presented in this section.
The softening behavior of concrete has an important role in the nonlinear response of RC
structures. To investigate the effects of the softening behavior, three different slopes (Fig. 3.13)
were implemented in the concrete behavior for the softening curve in the FE models of piers
JH11 and JH21. The steepest softening curve is the one by Mander et al. (1988), while the other
two softening behaviors were hypothetically assumed with milder stiffness degradations. The
two hypothetical slopes were only used in this part of the research to explore the importance of
the softening behavior of the concrete material on the ultimate strengths and displacements.
-10
-5
0
5
10
15
0 1 2 3 4 5
Err
or
(%)
Drift %
JH11
JH21
JH31
JH41
-10
-5
0
5
10
15
0 1 2 3 4 5
Err
or
(%)
Drift %
JH12JH22JH32JH42
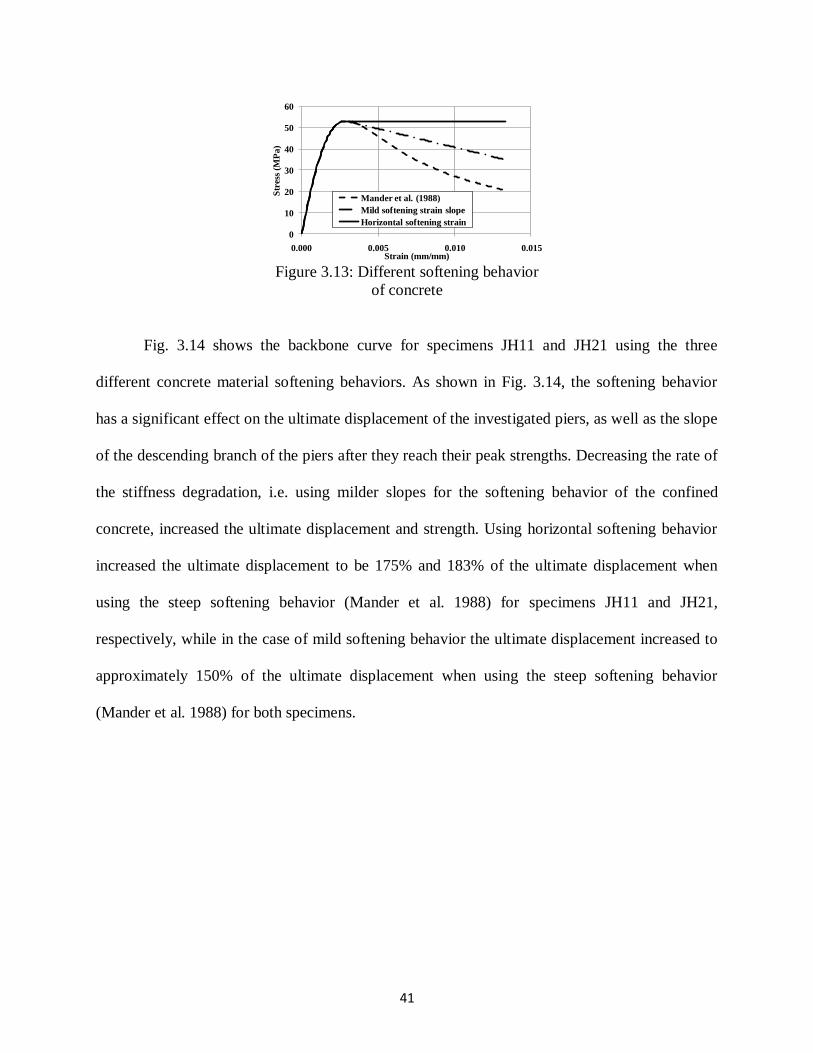
41
Figure 3.13: Different softening behavior
of concrete
Fig. 3.14 shows the backbone curve for specimens JH11 and JH21 using the three
different concrete material softening behaviors. As shown in Fig. 3.14, the softening behavior
has a significant effect on the ultimate displacement of the investigated piers, as well as the slope
of the descending branch of the piers after they reach their peak strengths. Decreasing the rate of
the stiffness degradation, i.e. using milder slopes for the softening behavior of the confined
concrete, increased the ultimate displacement and strength. Using horizontal softening behavior
increased the ultimate displacement to be 175% and 183% of the ultimate displacement when
using the steep softening behavior (Mander et al. 1988) for specimens JH11 and JH21,
respectively, while in the case of mild softening behavior the ultimate displacement increased to
approximately 150% of the ultimate displacement when using the steep softening behavior
(Mander et al. 1988) for both specimens.
0
10
20
30
40
50
60
0.000 0.005 0.010 0.015
Str
ess
(MP
a)
Strain (mm/mm)
Mander et al. (1988)
Mild softening strain slope
Horizontal softening strain
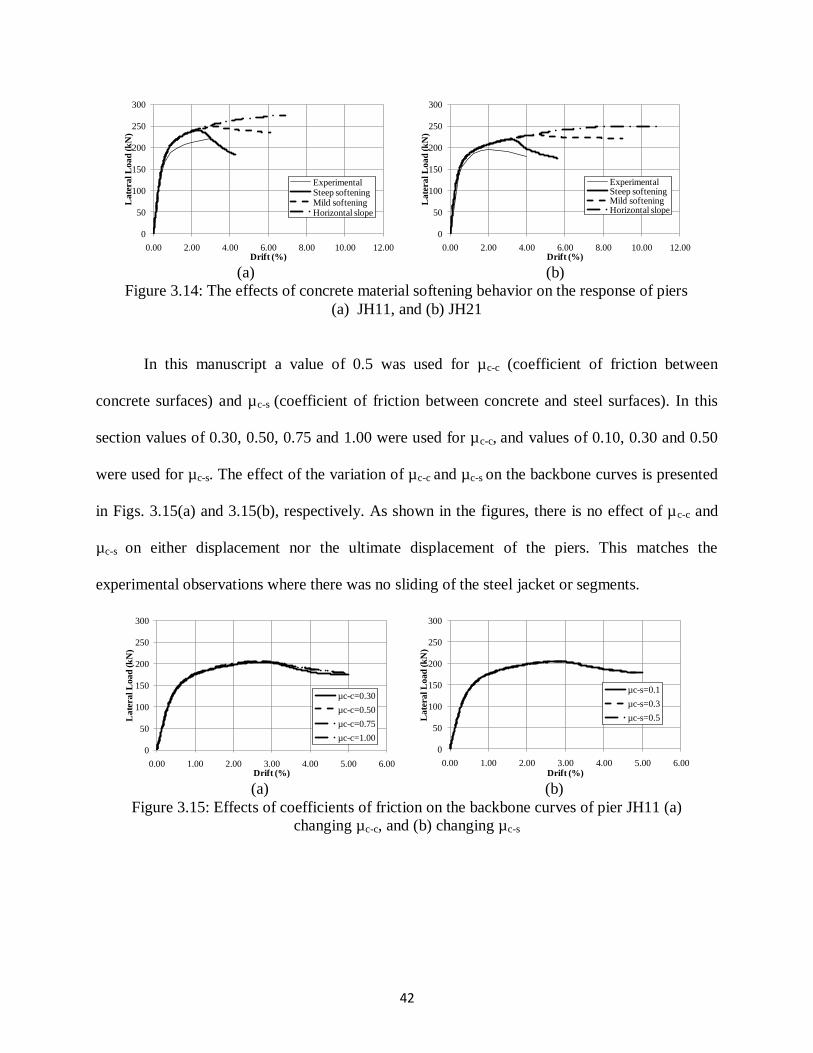
42
(a) (b)
Figure 3.14: The effects of concrete material softening behavior on the response of piers
(a) JH11, and (b) JH21
In this manuscript a value of 0.5 was used for µc-c (coefficient of friction between
concrete surfaces) and µc-s (coefficient of friction between concrete and steel surfaces). In this
section values of 0.30, 0.50, 0.75 and 1.00 were used for µc-c, and values of 0.10, 0.30 and 0.50
were used for µc-s. The effect of the variation of µc-c and µc-s on the backbone curves is presented
in Figs. 3.15(a) and 3.15(b), respectively. As shown in the figures, there is no effect of µc-c and
µc-s on either displacement nor the ultimate displacement of the piers. This matches the
experimental observations where there was no sliding of the steel jacket or segments.
(a) (b)
Figure 3.15: Effects of coefficients of friction on the backbone curves of pier JH11 (a)
changing µc-c, and (b) changing µc-s
0
50
100
150
200
250
300
0.00 2.00 4.00 6.00 8.00 10.00 12.00
La
tera
l L
oa
d (k
N)
Drift (%)
ExperimentalSteep softeningMild softeningHorizontal slope
0
50
100
150
200
250
300
0.00 2.00 4.00 6.00 8.00 10.00 12.00
La
tera
l L
oa
d (k
N)
Drift (%)
ExperimentalSteep softeningMild softeningHorizontal slope
0
50
100
150
200
250
300
0.00 1.00 2.00 3.00 4.00 5.00 6.00
La
tera
l L
oa
d (k
N)
Drift (%)
µc-c=0.30
µc-c=0.50
µc-c=0.75
µc-c=1.00
0
50
100
150
200
250
300
0.00 1.00 2.00 3.00 4.00 5.00 6.00
La
tera
l L
oa
d (
kN
)
Drift (%)
µc-s=0.1
µc-s=0.3
µc-s=0.5

43
3.9 Findings and conclusions
This paper discusses the seismic behavior of the SPPT bridge piers. The piers consist of
precast segments superimposed over each other and sandwiched between a reinforced concrete
foundation and the bridge superstructure. The system is connected by unbonded post-tensioning
tendons passing through ducts made in the segments during casting. The bottommost segments
of the piers were encased in steel tubes to enhance its ductility. A FE model was developed,
implemented and validated against experimental data. The analyses and experimental work
presented in this study revealed that:
The SPPT pier system is able to withstand large lateral drift angles with minimal damage
and minimal residual displacements. The tested piers reached a lateral drift angle of
approximately 4% with minimal damage in the form of spalling. After repairing this
spalling and increasing the applied post-tensioning, the piers were able to reach a lateral
drift greater than 5% before or at failure.
Selection of the appropriate jacket height is a critical design parameter. For specimens
JH1 and JH2, the height of jacket confinement was inadequate, leading to premature
strength degradation of the test piers. A taller jacket would have postponed cover
concrete spalling in the non-jacketed segments, thus reducing the amount of pier damage
requiring repair.
As expected, decreasing the piers‟ aspect ratios from 6 to 3 increased their initial stiffness
and ultimate strength. In addition, increasing the applied post-tensioning force increased
the ultimate strength of the test specimens.
The FE model developed and presented in this paper was able to capture the backbone
curves of the experimentally tested SPPT piers, and therefore could be used for
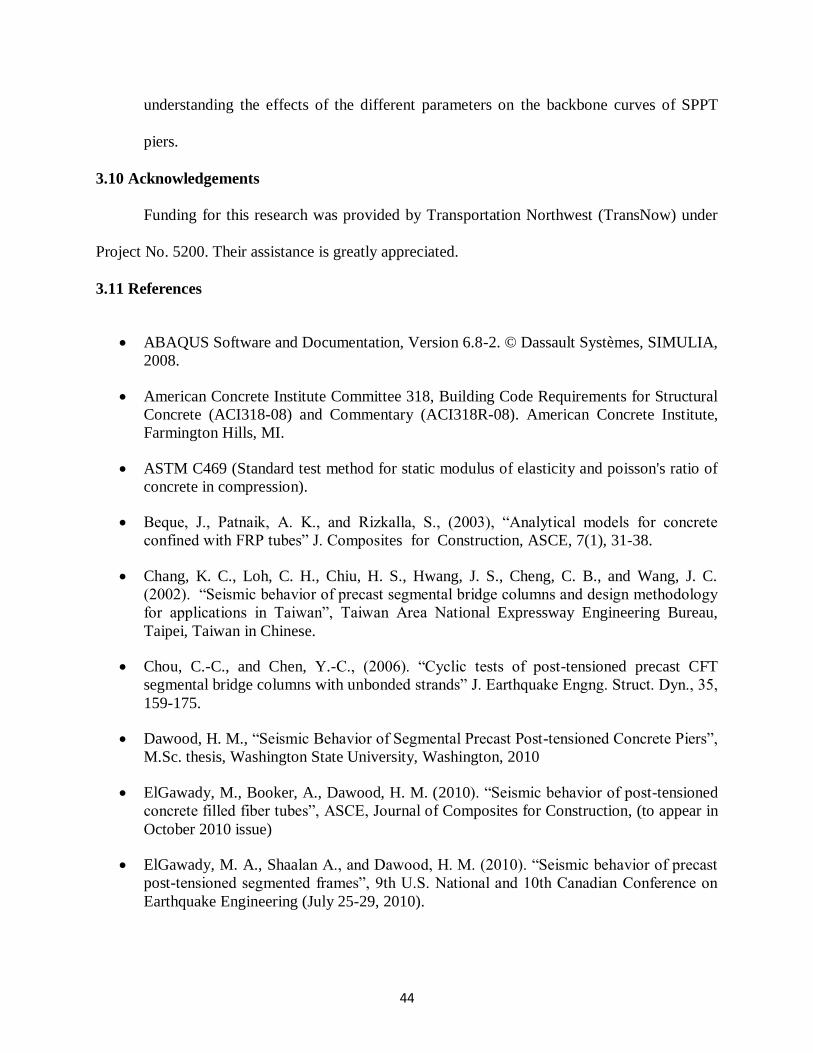
44
understanding the effects of the different parameters on the backbone curves of SPPT
piers.
3.10 Acknowledgements
Funding for this research was provided by Transportation Northwest (TransNow) under
Project No. 5200. Their assistance is greatly appreciated.
3.11 References
ABAQUS Software and Documentation, Version 6.8-2. © Dassault Systèmes, SIMULIA,
2008.
American Concrete Institute Committee 318, Building Code Requirements for Structural
Concrete (ACI318-08) and Commentary (ACI318R-08). American Concrete Institute,
Farmington Hills, MI.
ASTM C469 (Standard test method for static modulus of elasticity and poisson's ratio of
concrete in compression).
Beque, J., Patnaik, A. K., and Rizkalla, S., (2003), “Analytical models for concrete
confined with FRP tubes” J. Composites for Construction, ASCE, 7(1), 31-38.
Chang, K. C., Loh, C. H., Chiu, H. S., Hwang, J. S., Cheng, C. B., and Wang, J. C.
(2002). “Seismic behavior of precast segmental bridge columns and design methodology
for applications in Taiwan”, Taiwan Area National Expressway Engineering Bureau,
Taipei, Taiwan in Chinese.
Chou, C.-C., and Chen, Y.-C., (2006). “Cyclic tests of post-tensioned precast CFT
segmental bridge columns with unbonded strands” J. Earthquake Engng. Struct. Dyn., 35,
159-175.
Dawood, H. M., “Seismic Behavior of Segmental Precast Post-tensioned Concrete Piers”,
M.Sc. thesis, Washington State University, Washington, 2010
ElGawady, M., Booker, A., Dawood, H. M. (2010). “Seismic behavior of post-tensioned
concrete filled fiber tubes”, ASCE, Journal of Composites for Construction, (to appear in
October 2010 issue)
ElGawady, M. A., Shaalan A., and Dawood, H. M. (2010). “Seismic behavior of precast
post-tensioned segmented frames”, 9th U.S. National and 10th Canadian Conference on
Earthquake Engineering (July 25-29, 2010).

45
ElGawady, M., and Shaalan, A., (2010- In review). “Seismic behavior of self-centering
bridge bents”, ASCE, Journal of Bridge Engineering.
Fam, A. Z., and Rizkalla, S. H., (2001), “Confinement model for axially loaded concrete
confined by circular fiber-reinforced polymer tubes” ACI Str. J., 98 (4), 451-461.
Hewes, J.T. “Seismic Design and Performance of Precast Concrete Segmental Bridge
Columns.” Ph.D. Dissertation, University of California, San Diego, La Jolla, California.
2002.
Lee, J., and G. L. Fenves, (1998) “Plastic-Damage Model for Cyclic Loading of Concrete
Structures,” Journal of Engineering Mechanics, vol. 124, no.8, pp. 892–900.
Lee, W. K., and Billington, S. L., (2009) “Modeling Residual Displacements of Concrete
Bridge Columns under Earthquake Loads using Fiber Elements.”, ASCE J. Bridge
Engineering, 15(3): 240-249.
Lubliner, J., J. Oliver, S. Oller, and E. Oñate, (1989) “A Plastic-Damage Model for
Concrete,” International Journal of Solids and Structures, vol. 25, pp. 299–329.
Marriott., D., Pampanin, S., and Palermo, A., (2009). “Quasi-static and pseudo-dynamic
testing of unbonded post-tensioned rocking bridge piers with external replaceable
dissipaters” J. Earthquake Engng. Struct. Dyn., 38, 331-345.
Ou, Y.-C., Chiewanichakorn, M., Aref, A. J., and Lee, G. C. (2007). “Seismic
performance of segmental precast unbonded posttensioned concrete bridge columns.” J.
Str. Eng., 133(11), 1636-1647.
Mander, J. B., Priestley, M. J. N., and Park, R. (1988).„„Theoretical stress-strain model
for confined concrete.‟‟ J. Struct. Eng., 114(8), 1804–1826.
Priestley N., Sritharan S., Conley J., and Pampanin S., (1999) “Preliminary results and
conclusions from the PRESSS five-story precast concrete test building.” PCI Journal, 44
(6):p. 42-76.
Samaan, M., Mirmiran, A., and Shahawy, M. (1998). „„Model of concrete confined by
fiber composite.‟‟ J. Struct. Eng., 124(9), 1025–1031.
Teng, J. G., Jiang, T., Lam, L., and Luo, Y.Z., (2009), “Refinement of a design-oriented
stress strain model for FRP-Confined concrete” J. Composites for Construction, ASCE,
13(4), 269-278.
Wight, G. D. (2006) “Seismic Performance of a Post-tensioned Concrete Masonry Wall
System.”, Ph.D. dissertation, University of Auckland, New Zealand.

46
CHAPTER FOUR
BEHAVIOR OF SEGMENTAL PRECAST POST-TENSIONED BRIDGE PIERS UNDER
LATERAL LOAD: PARAMETRIC STUDY
Haitham Dawood4 Mohamed ElGawady
5§ Joshua Hewes
6
4.1 Abstract
This manuscript discusses the design parameters that potentially affect the lateral seismic
response of segmental precast post-tensioned bridge piers. The piers consist of precast circular
cross section segments stacked one on top of the other with concentric tendons passing through
ducts made in the segments during casting. The bottommost segments of the piers were encased
in steel tubes to enhance ductility and minimize damage. An FE model was used to investigate
different design parameters and how they influence the lateral force – displacement response of
the piers. Design parameters investigated include the initial post-tensioning stress as a percentage
of the tendon yield stress, the applied axial stresses on concrete due to post-tensioning, pier
aspect ratios, construction details, steel tube thicknesses, and internal mild steel rebar added as
energy dissipaters. Based on the data presented, an initial tendon stress in the range of 40-60% of
its yield stress and initial axial stress on concrete of approximately 20% of the concrete
characteristic strength will be appropriate for most typical designs. These design values will
prevent tendon yielding until lateral drift angle reaches approximately 4.5%. Changing the steel
tube thickness, height, or a combination of both proved to be an effective parameter that may be
used to reach a target performance level at a specific seismic zone.
4Graduate Research Assistant, Dept. of Civil and Environmental Engineering, Washington State University, Pullman, WA, [email protected] 5 Assistant Professor, Dept. of Civil and Environmental Engineering, Washington State University, Pullman, WA,
[email protected]; §Corresponding author
6 Assistant Professor, Dept. of Civil and Environmental Engineering, Northern Arizona University,

47
4.2 Keywords
ABAQUS, finite element model, post-tensioned, segmental pier, bridge
4.3 Introduction
This manuscript evaluates the effects of different design parameters on the backbone
lateral force – displacement response of a segmental precast post-tensioned (SPPT) bridge pier.
The standard pier investigated in this paper (see Fig. 4.1(a)) was similar in dimensions to pier
JH11 tested by Hewes (2002) and described in detail by Dawood et al. (2010). The pier consisted
of four concrete segments placed on top of each other and structurally connected using a
concentric unbonded tendon comprised of 27 – 12.7 mm [0.5 in] diameter ASTM A779 Grade
270 (1860 MPa [270 ksi]) low-relaxation steel strands with a total cross-sectional area of 2665
mm2[4.13 in
2]. The pier was circular in cross-section with diameter of 610mm [24 in]. The pier
has an aspect ratio (AR) of 6, where aspect ratio is defined as the distance between point of
application of lateral loading and pier base divided by pier diameter. The unbonded tendon
length was Lt = 4953 mm [195 in]. The pier was investigated under an initial post tensioning
stress corresponding to approximately 45% of the yield strength of the tendons.
(a)
(b)
Figure 4.1: Detailed dimensions for (a) standard pier and (b) pier B
Standard pier Pier (B)
610 mm
914 mm
914 mm
914 mm
914 mm
5055 mm
610 mm
610 mm
914 mm
914 mm
3200 mm610 mm
1675mm1675mmStandard pier Pier (B)
610 mm
914 mm
914 mm
914 mm
914 mm
5055 mm
610 mm
610 mm
914 mm
914 mm
3200 mm610 mm
1675mm1675mm
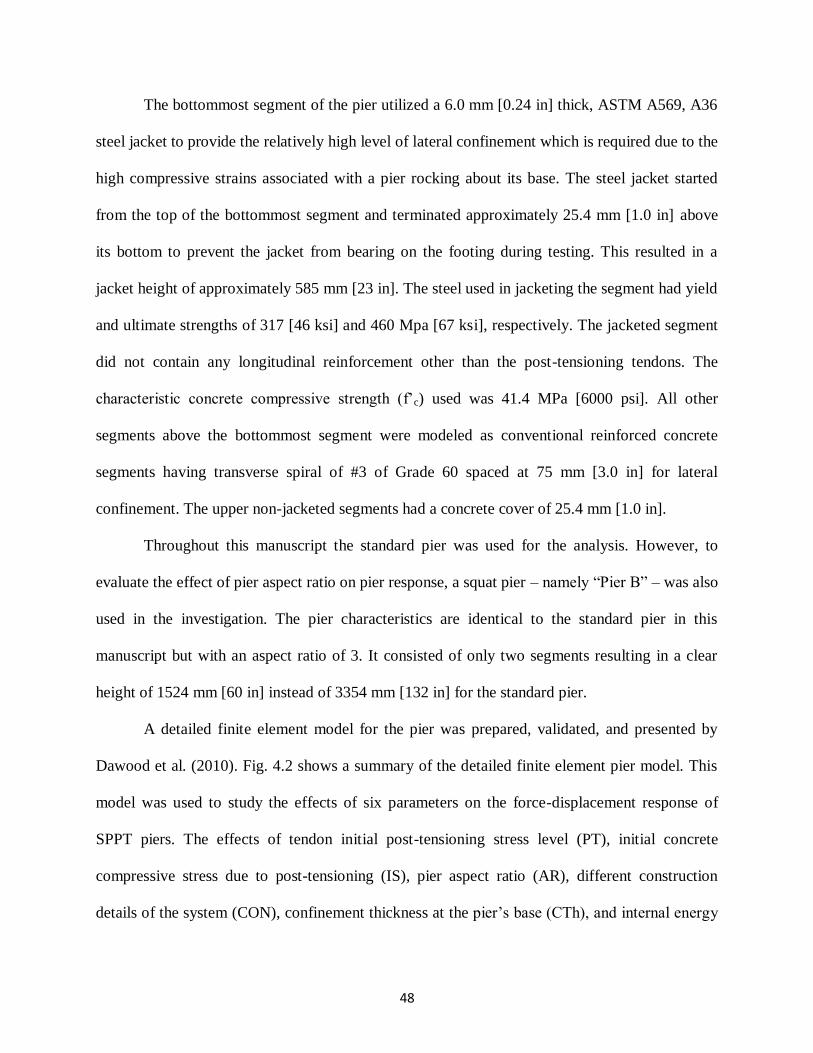
48
The bottommost segment of the pier utilized a 6.0 mm [0.24 in] thick, ASTM A569, A36
steel jacket to provide the relatively high level of lateral confinement which is required due to the
high compressive strains associated with a pier rocking about its base. The steel jacket started
from the top of the bottommost segment and terminated approximately 25.4 mm [1.0 in] above
its bottom to prevent the jacket from bearing on the footing during testing. This resulted in a
jacket height of approximately 585 mm [23 in]. The steel used in jacketing the segment had yield
and ultimate strengths of 317 [46 ksi] and 460 Mpa [67 ksi], respectively. The jacketed segment
did not contain any longitudinal reinforcement other than the post-tensioning tendons. The
characteristic concrete compressive strength (f‟c) used was 41.4 MPa [6000 psi]. All other
segments above the bottommost segment were modeled as conventional reinforced concrete
segments having transverse spiral of #3 of Grade 60 spaced at 75 mm [3.0 in] for lateral
confinement. The upper non-jacketed segments had a concrete cover of 25.4 mm [1.0 in].
Throughout this manuscript the standard pier was used for the analysis. However, to
evaluate the effect of pier aspect ratio on pier response, a squat pier – namely “Pier B” – was also
used in the investigation. The pier characteristics are identical to the standard pier in this
manuscript but with an aspect ratio of 3. It consisted of only two segments resulting in a clear
height of 1524 mm [60 in] instead of 3354 mm [132 in] for the standard pier.
A detailed finite element model for the pier was prepared, validated, and presented by
Dawood et al. (2010). Fig. 4.2 shows a summary of the detailed finite element pier model. This
model was used to study the effects of six parameters on the force-displacement response of
SPPT piers. The effects of tendon initial post-tensioning stress level (PT), initial concrete
compressive stress due to post-tensioning (IS), pier aspect ratio (AR), different construction
details of the system (CON), confinement thickness at the pier‟s base (CTh), and internal energy
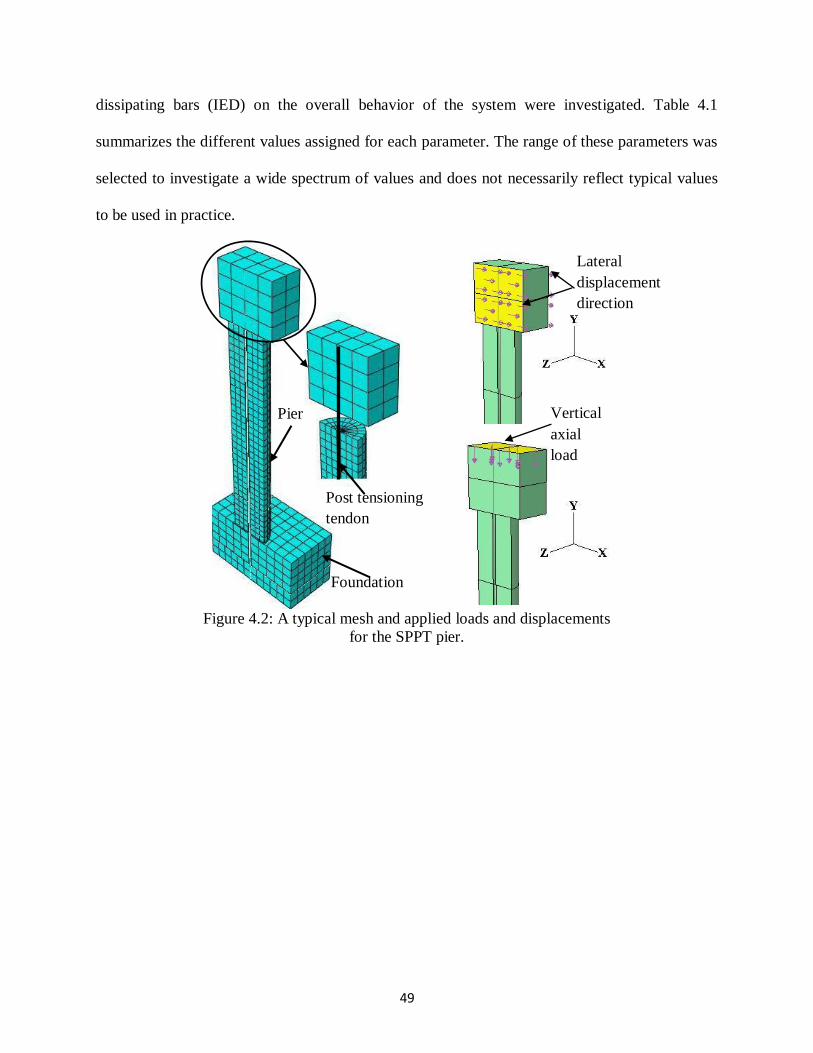
49
dissipating bars (IED) on the overall behavior of the system were investigated. Table 4.1
summarizes the different values assigned for each parameter. The range of these parameters was
selected to investigate a wide spectrum of values and does not necessarily reflect typical values
to be used in practice.
Figure 4.2: A typical mesh and applied loads and displacements
for the SPPT pier.
Post tensioning
tendon
Foundation
Pier
Lateral
displacement
direction
Vertical
axial
load

50
Table 4.1: Different values assigned to each design parameter in the study
Series Parameter 1 2 3 4 5 6 7 8
PT
Initial stress level as a
percentage of tendon‟s yield
stress (%).
30% 40% 45% 50% 60% 70% 80% 90%
IS
Stress on concrete induced by
post-tensioning as a percentage
of f‟c (%)
13% 16% 19% 22% 25% 28% 31% -
AR Aspect ratio of the piers. 3.0 4.5 6.0 7.5 9.0 - - -
CON Different configurations of the
system See Fig. 4.14 - - -
CTh Confinement thickness (mm) 6.0 4.5 3.0 1.5 - - - -
IED
Reinforcement ratio of the
mild steel used as internal
energy dissipaters (%).
0.00 0.25 0.44 1.34 1.75 - - -
4.4 Results and Discussions
4.4.1 Effects of initial post-tensioning level in the tendon
The first parameter investigated in this study – the PT series – was the level of initial
tendon stress. The initial post-tensioning stress ranged from 30% to 90% of the yield strength of
the tendons while changing the cross sectional area from 4000 mm2 [6.2 in
2] to 1300 mm
2 [2.0
in2], respectively, to maintain the axial stresses on the concrete invariant at 7.17 MPa [1040 psi]
which corresponds to 17% of f‟c. Fig. 4.3 shows the lateral drift at the loading point (middle of
the loading stub) versus the measured the lateral resistance of the different piers. The lateral drift
was defined as the ratio of the measured lateral displacement divided by the height of the loading
point above the pier base. As shown in the figure, all the piers reached their ultimate strengths at
a lateral drift angle of approximately 3%. Beyond that, a gradual degradation in the strength
occurred and the analysis ended at a lateral drift angle of 5%. At this drift level, a reduction of
approximately 14% occurred in the strengths of the piers. The analysis truncated due to spalling
and compression failure at the bottom of the second segment.

51
Figure 4.3: The effects of changing the
initial post-tensioning stress in the tendons
while keeping the same stress on concrete
Fig. 4.3 shows that changing the initial post tensioning stress in the tendon while
maintaining constant initial axial stress on the concrete segments does not have a major effect on
the backbone curve of the system. Surprisingly, in no case yielding of the tendon was observed.
Since the post-tensioning tendon was placed in the geometric centroid of the pier, the increase in
the tendon stress due to interface joints opening initiated after significant drift of the pier took
place. Fig. 4.4 shows the lateral drift vs. the peak stress in the tendon for each pier. As shown in
the figure, the increase in the tendon stress started at a lateral drift angle of approximately 1%
and beyond that the increases in the post-tensioning stresses were quite small. The post-
tensioning stresses reached their peak at a lateral drift of 3% when the piers reached their peak
strength. Beyond that both the strengths of the piers and the stresses in the tendons started to
decrease due to damage at the bottom of the second segments.
0
50
100
150
200
250
300
0 1 2 3 4 5 6
Late
ral
Load
(k
N)
Drift (%)
PT-30% PT-40%
PT-45% PT-50%
PT-60% PT-70%
PT-80% PT-90%

52
A second reason for the elastic response of the tendon was the relatively long unbonded
length of the tendon. In the case of a squat pier, the unbonded tendon length will be relatively
small and thus larger incremental tendon strains will occur with increasing the applied lateral
displacement, resulting in potential yielding of the tendon if it was initially stressed to high initial
stress levels. Fig. 4.5 shows the effects of the level of the initial post-tensioning stresses on the
response of Pier B. Only three levels of initial post-tensioning stresses were investigated namely,
40%, 60%, and 80% of the yield stress of the tendon. Fig. 4.6 shows the peak stresses in the
tendon versus the lateral drift angles of Pier B.
Figure 4.5: The effects of changing the
initial post-tensioning stress in the tendons
for squat piers
0
100
200
300
400
500
600
700
0 1 2 3 4 5 6 7 8 9 10
Late
ral
Load
(k
N)
Drift (%)
Pier(B)-PT-40%
Pier(B)-PT-60%
Pier(B)-PT-80%
Figure 4.4: Drifts of different pier vs. the
stresses in the post-tensioning tendons
normalized by its yield stress
0
10
20
30
40
50
60
70
80
90
100
0 1 2 3 4 5
Post
-ten
sion
ing s
tres
s /y
ield
stre
ss(%
)
Drift (%)
PT-30% PT-40% PT-45%PT-50% PT-60% PT-70%PT-80% PT-90%

53
Figure 4.6: Drift of squat piers vs. the
stresses in the post-tensioning tendons
normalized by their yield stress
As shown in Figs. 4.5 and 4.6, increasing the initial post-tensioning stresses to 60% and
80% of the tendon yield stresses resulted in yielding of the tendon at lateral drift angles of 5.5%,
and 2.5%, respectively. In addition, Fig. 4.6 shows that the increase in the tendon stresses started
at small lateral drifts of approximately 0.2% which is significantly smaller than in the case of the
more slender standard pier. Moreover, the rate of the strain increase in the post-tensioning is
higher in the case of the squat piers compared to the slender piers. For small initial stresses of
40% of the yield stress, no yielding of the tendon was observed and the tendon reached a peak
stress of approximately 82% of its yield stress followed by concrete crushing and the analysis
stopped. Such crushing at high drift angle of 7% led to brittle failure as indicated in Fig. 4.5.
For initial tendon stresses of 40% of the yield stress (Fig. 4.5), the pier was able to
develop a peak strength of 650 kN [146 kips] at a lateral drift angle of 7% where the concrete
started to crush rupture and the analysis stopped at a lateral drift angle of 8%. For high initial
stress in the tendons, the piers reached lateral strengths of 580 kN [130 kips] and 480 kN[108
kips] at lateral drift angles of 2.5% and 5.5% for initial post-tensioning stresses of 60 and 80% of
the yield stress. Once the tendon yielded, the pier reached its peak strength and a substantial
decrease in the tangent stiffness of the system occurred. Based on these analyses and within the
0
20
40
60
80
100
120
0 1 2 3 4 5 6 7 8 9 10
Post
-ten
sion
ing s
tres
s /y
ield
stre
ss(%
)
Drift (%)
Pier(B)-PT-40%Pier(B)-PT-60%Pier(B)-PT-80%

54
scope of this study it appears that an initial post-tensioning stress in the tendon that range from
40 to 60% of the tendon yield stress is suitable for design. A squat pier (AR=3) with an initial
post-tensioning stress of 60% of the tendon yield stress would reach yielding of the tendon at a
lateral drift of 5.5%; however, such drift angle is beyond the anticipated level of drift angle for a
typical bridge. Priestley et al. (2007) recommended a drift angle of 4.5% for a bridge at the
collapse prevention limit state.
4.4.2 Effects of initial stresses on the concrete
The second parameter investigated in this study – the IS series – was the level of the
initial axial compressive stress imposed on the concrete due to post-tensioning forces. This was
achieved by maintaining the tendon‟s post-tensioning stress constant at 45% of its yield stress
while changing the tendon cross-sectional area from 1980 mm2
to 4990 mm2 [3.07 in
2 to7.73
in2]. This resulted in axial stresses in the concrete ranging from 5.38 MPa [780 psi] to 12.83MPa
[1860 psi] which corresponds to 13% to 31% of f‟c.
Fig. 4.7 shows the lateral drift angle versus the lateral resistance of the piers with
different initial stresses on the concrete. Increasing the applied axial stresses on the piers
increased the yield strengths, the ultimate strengths, and the post-elastic stiffness of the piers.
However, the increase in the applied initial post-tensioning stress on the concrete resulted in a
reduction in the ultimate drift angles and the drift angle at the maximum lateral load. For small
axial stresses on the concrete segments, the geometric nonlinearity, i.e. the rocking mechanism
was predominant, while for the case of high axial stresses the material nonlinearity was dominant
leading to concrete crushing at smaller drift angles. This resulted in two features in the backbone
curves (Fig. 4.7): 1) the transition between the initial and post-elastic stiffness is abrupt for small
axial stresses compared to high initial stresses; and 2) the slope of the lateral resistance –drift

55
curves beyond the peak strength is relatively sharper for higher concrete initial axial stress
resulting in small ultimate drift angles. This is attributed to the high stresses accumulated by the
rigid body rocking that result in more brittle failure.
Figure 4.7: The effects of increasing the axial
stresses due to post-tensioning forces on
concrete segments
Fig. 4.8 shows the peak stress in the post-tensioning tendon normalized by its yield stress
vs. the lateral drift of the standard piers. As shown in the figure, in no case did tendon yielding
occur. In addition, the rate of increase in the post-tensioning stress was slightly higher for piers
having smaller axial stress on the concrete since piers that were subjected to small axial stress
due to post-tensioning were able to reach deformation higher than other piers subjected to higher
post-tensioning forces (Fig. 4.7). Decreasing the applied axial stress due to post-tensioning made
the rocking response and geometric nonlinearity more dominant compared to the deformation in
the case of high applied axial stress due to post-tensioning.
0
50
100
150
200
250
300
0 1 2 3 4 5 6
Late
ral
Load
(k
N)
Drift (%)
IS-13%
IS-16% IS-19%
IS-22%
IS-31% IS-28%
IS-25%
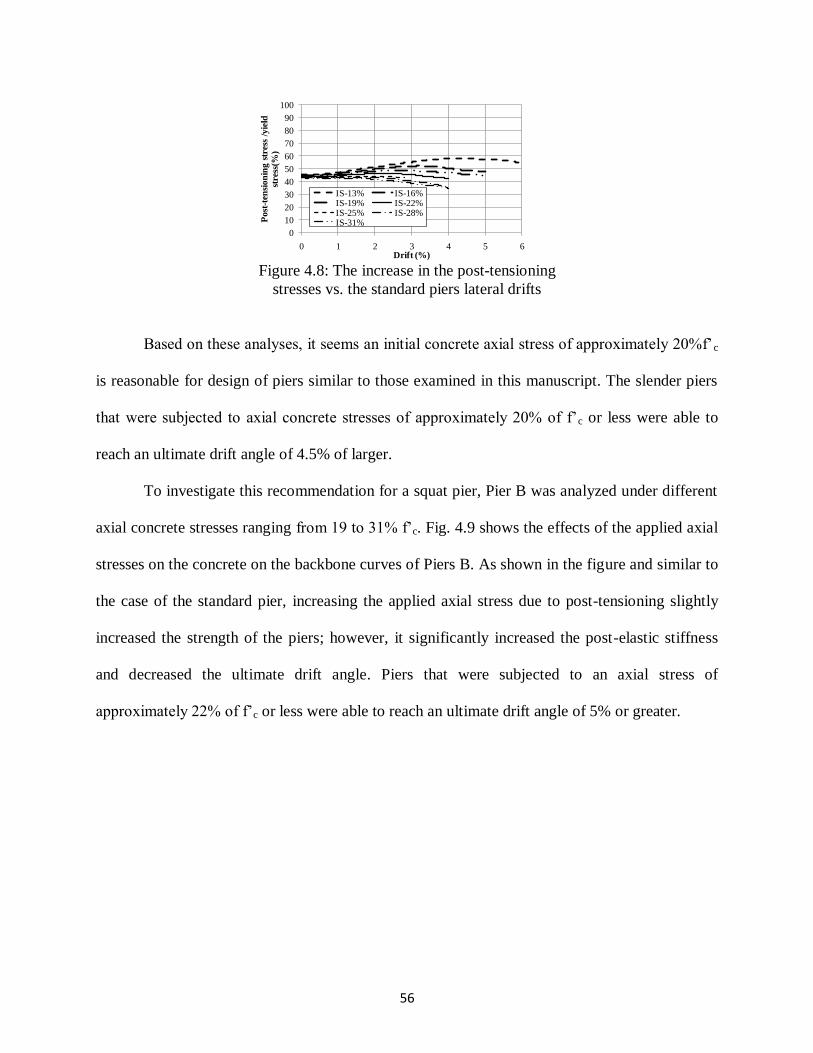
56
Figure 4.8: The increase in the post-tensioning
stresses vs. the standard piers lateral drifts
Based on these analyses, it seems an initial concrete axial stress of approximately 20%f‟c
is reasonable for design of piers similar to those examined in this manuscript. The slender piers
that were subjected to axial concrete stresses of approximately 20% of f‟c or less were able to
reach an ultimate drift angle of 4.5% of larger.
To investigate this recommendation for a squat pier, Pier B was analyzed under different
axial concrete stresses ranging from 19 to 31% f‟c. Fig. 4.9 shows the effects of the applied axial
stresses on the concrete on the backbone curves of Piers B. As shown in the figure and similar to
the case of the standard pier, increasing the applied axial stress due to post-tensioning slightly
increased the strength of the piers; however, it significantly increased the post-elastic stiffness
and decreased the ultimate drift angle. Piers that were subjected to an axial stress of
approximately 22% of f‟c or less were able to reach an ultimate drift angle of 5% or greater.
0
10
20
30
40
50
60
70
80
90
100
0 1 2 3 4 5 6
Post
-ten
sion
ing s
tres
s /y
ield
stre
ss(%
)
Drift (%)
IS-13% IS-16%IS-19% IS-22%IS-25% IS-28%IS-31%

57
Figure 4.9: The effects of increasing the
axial stresses on concrete segments for Pier
B
Fig. 4.10 shows the variation of peak stresses in the tendons versus the lateral drift for
Pier B for the different applied axial stresses on the concrete segments. As shown in the figure,
in no case did yielding of the tendon occur.
Figure 4.10: The increase in the post-
tensioning stresses vs. piers type B lateral
drifts
4.4.3 Effects of pier aspect ratio
The third parameter investigated in this manuscript was the effects of increasing the
aspect ratio – AR series – of the piers from 3 to 9 by adding one more segment from one pier to
the other as shown in Fig. 4.11.
0
100
200
300
400
500
600
700
0 1 2 3 4 5 6 7 8
Late
ral
Load
(k
N)
Drift (%)
Pier(B)-IS-19%
Pier(B)-IS-22%
Pier(B)-IS-31%
0
20
40
60
80
100
120
0 1 2 3 4 5 6 7 8
Post
-ten
sion
ing s
tres
s /y
ield
stre
ss(%
)
Drift (%)
Pier(B)-IS-19%
Pier(B)-IS-22%
Pier(B)-IS-31%

58
Figure 4.11: Layout of the piers having
different aspect ratios
Fig. 4.12 shows the lateral resistance of the different piers versus the lateral drift angle
measured at the loading point. Increasing the aspect ratio of the piers from 3 to 9 decreased the
initial stiffness as well as the ultimate drift angle (Fig. 4.12(a)) and increased to lesser extent the
ultimate displacement (Fig. 4.12(b)). Failure of squat piers was more abrupt compared to slender
piers since in the squat piers more stress concentration and damage occurred at the bottom of the
second segment compared to slender piers. The slope of the post-elastic stiffness increased with
decreasing the pier aspect ratio.
(a) (b)
Figure 4.12: The effect of changing the piers‟ aspect ratio on the backbone curves
AR-3.0 AR-4.5 AR-6.0 AR-7.5 AR-9.0
0
100
200
300
400
500
600
700
0 2 4 6 8 10
Late
ral
Load
(k
N)
Drift (%)
AR-3.0AR-4.5AR-6.0AR-7.5AR-9.0
0
100
200
300
400
500
600
700
0 50 100 150 200 250
Late
ral L
oad
(k
N)
Displacement (mm)
AR-3.0AR-4.5AR-6.0AR-7.5AR-9.0
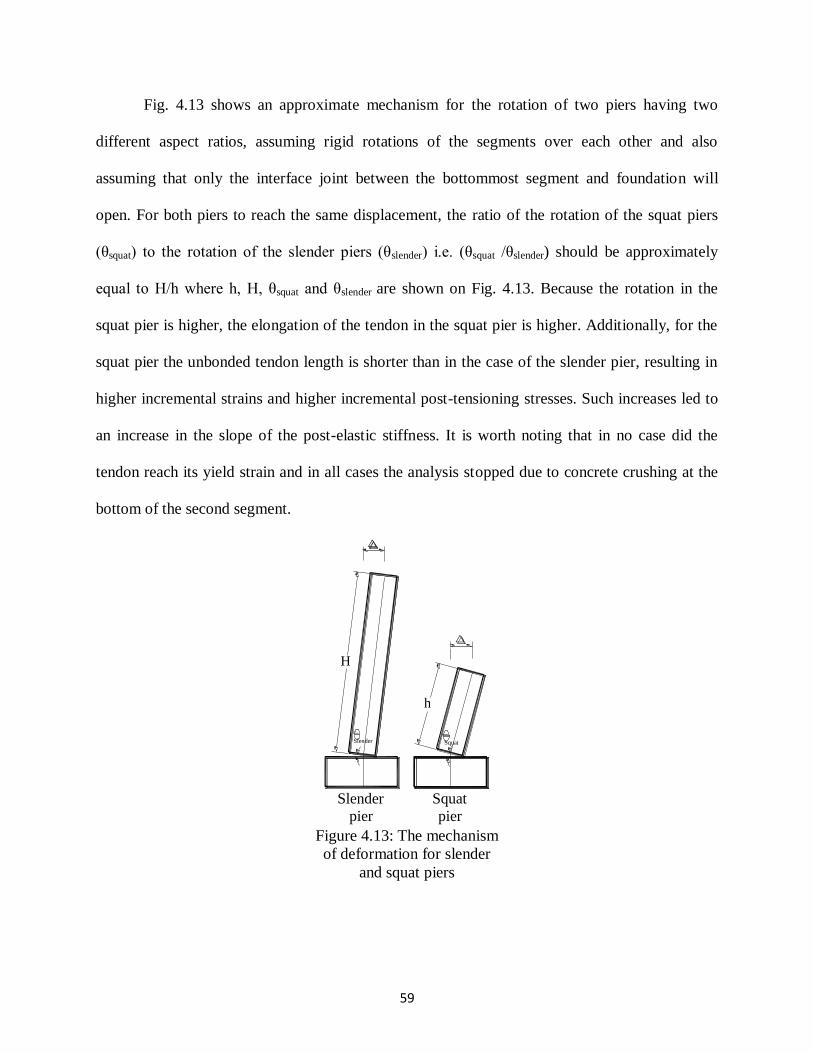
59
Fig. 4.13 shows an approximate mechanism for the rotation of two piers having two
different aspect ratios, assuming rigid rotations of the segments over each other and also
assuming that only the interface joint between the bottommost segment and foundation will
open. For both piers to reach the same displacement, the ratio of the rotation of the squat piers
(θsquat) to the rotation of the slender piers (θslender) i.e. (θsquat /θslender) should be approximately
equal to H/h where h, H, θsquat and θslender are shown on Fig. 4.13. Because the rotation in the
squat pier is higher, the elongation of the tendon in the squat pier is higher. Additionally, for the
squat pier the unbonded tendon length is shorter than in the case of the slender pier, resulting in
higher incremental strains and higher incremental post-tensioning stresses. Such increases led to
an increase in the slope of the post-elastic stiffness. It is worth noting that in no case did the
tendon reach its yield strain and in all cases the analysis stopped due to concrete crushing at the
bottom of the second segment.
Figure 4.13: The mechanism
of deformation for slender
and squat piers
H
h
Slender Squat
Slender
pier
Squat
pier

60
4.4.4 Effects of construction details
The fourth parameter investigated –CON series –was the effect of different construction
details on the behavior of the pier system. As shown in Fig. 4.14, case CON-1 was a pier
constructed similar to the standard pier. Pier CON-2 represents a different construction scenario
where the bottommost two segments in the pier CON-1 were replaced by a single segment cast
monolithically while maintaining the steel confinement height and thickness unchanged from
those used for pier CON-1. In the case of pier CON-3, the three lowest segments were cast
monolithically while maintaining the same steel confinement configuration. Pier CON-4 had
construction details similar to pier CON-1 except that the two lower segments of pier CON-4
were both confined by steel tubes having a thickness of 6 mm [0.24 in]. In Fig. 4.14, the hatched
areas represent segments confined by external steel tubes.
Figure 4.14: Configuration of each pier of CON
series
Fig. 4.15 represents the backbone curves for the different piers of series CON. As shown
in the figure, the ultimate displacement of the pier CON-2 is approximately 140% of that of the
pier CON-1. In the case of pier CON-1, the pier failed due to stress concentration at the interface
between the lowest two segments resulting in spalling and crushing of the concrete at the second
Base Base Base Base
HeadHeadHeadHead
CON-1 CON-2 CON-3 CON-4
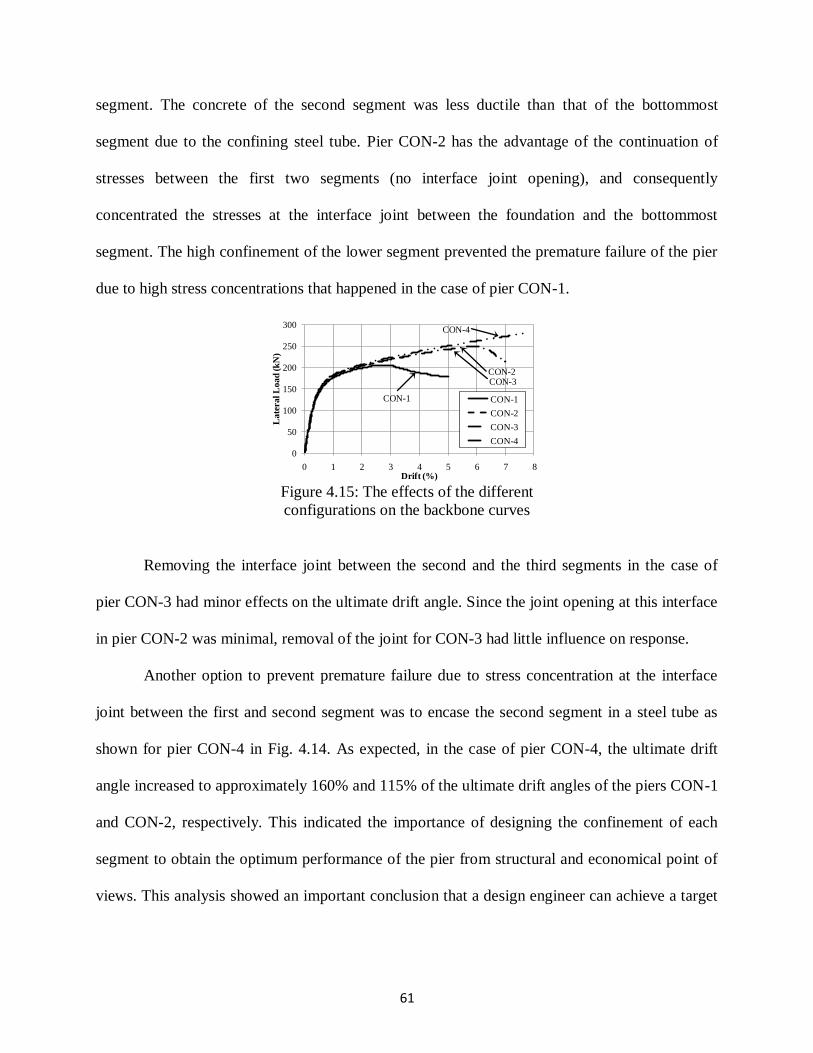
61
segment. The concrete of the second segment was less ductile than that of the bottommost
segment due to the confining steel tube. Pier CON-2 has the advantage of the continuation of
stresses between the first two segments (no interface joint opening), and consequently
concentrated the stresses at the interface joint between the foundation and the bottommost
segment. The high confinement of the lower segment prevented the premature failure of the pier
due to high stress concentrations that happened in the case of pier CON-1.
Figure 4.15: The effects of the different
configurations on the backbone curves
Removing the interface joint between the second and the third segments in the case of
pier CON-3 had minor effects on the ultimate drift angle. Since the joint opening at this interface
in pier CON-2 was minimal, removal of the joint for CON-3 had little influence on response.
Another option to prevent premature failure due to stress concentration at the interface
joint between the first and second segment was to encase the second segment in a steel tube as
shown for pier CON-4 in Fig. 4.14. As expected, in the case of pier CON-4, the ultimate drift
angle increased to approximately 160% and 115% of the ultimate drift angles of the piers CON-1
and CON-2, respectively. This indicated the importance of designing the confinement of each
segment to obtain the optimum performance of the pier from structural and economical point of
views. This analysis showed an important conclusion that a design engineer can achieve a target
0
50
100
150
200
250
300
0 1 2 3 4 5 6 7 8
Late
ral
Load
(k
N)
Drift (%)
CON-1
CON-2
CON-3
CON-4
CON-1
CON-2 CON-3
CON-4

62
displacement performance point using either an appropriate segment height, appropriate
confinement configuration, or a combination of the two.
4.4.5 Effects of confinement thickness
The fifth parameter investigated in this study – series CTh – was the effect of changing
the confinement ratio of the bottommost segment on the backbone behavior of the system. The
volumetric reinforcement ratios chosen ranged from 3.9% to 1% which corresponds to a steel
tube thickness of 6.0 mm [0.24 in] to 1.5mm [0.06 in]. These thicknesses were used for
confinement in two different scenarios: the first scenario (Fig. 4.16(a)) where only the
bottommost segment was confined; the second scenario where the two bottommost segments
(Fig. 4.16(b)) were confined. As shown in the figure, the confinement volumetric reinforcement
ratio had minimal effect in the case of confining only the lower segment since failure occurred
mainly at the second segment due to concrete cover spalling. On the other hand, increasing the
confinement thickness of the two bottommost segments enhanced the ductility and increased the
ultimate displacement by approximately 100% when the confinement thickness increased from
1.5mm [0.06 in] to 6.0mm [0.24 in]. Increasing the confinement thickness had no effect on the
yield lateral strength but increased the post yield stiffness. This shows that the confinement
volumetric reinforcement ratio and height are very important parameters to fulfill the required
performance level in a given seismic zone.

63
(a) (b)
Figure 4.16: The effects on the backbone curves of the different confinement
thicknesses for; a) the lower segment only, and b) the lower two segments
4.4.6 Effects of adding internal energy dissipaters
The last parameter investigated in this study was the effect of adding ten mild steel rebar
as internal energy dissipaters (IED) to the interface joint between the base and the bottommost
segment as well as at the interface between the bottommost segment and the second segment.
During earthquake ground motion such mild steel bars would yield increasing the energy
dissipation of the system. The rebar had nominal diameter ranging from 0 (i.e. no IED) to 25 mm
[#8] with all the rebar extended 305mm [12 in] on each side of the interface joints. The rebar
length was selected to represent one-half the height of the bottommost segment. Fig. 4.17 shows
the backbone curves for the different piers having the internal rebar.
Figure 4.17: The effects of the IED on the
backbone curves
0
50
100
150
200
250
300
0 1 2 3 4 5 6 7 8
Late
ral
Load
(k
N)
Drift (%)
CTh-6.0mmCTh-4.5mmCTh-3.0mmCTh-1.5mm
0
50
100
150
200
250
300
0 1 2 3 4 5 6 7 8
Late
ral
Loa
d (
kN
)
Drift (%)
CTh-6.0mmCTh-4.5mmCTh-3.0mmCTh-1.5mm
0
50
100
150
200
250
300
0 1 2 3 4 5 6
Late
ral
Loa
d (
kN
)
Drift (%)
IED#0
IED#3
IED#4
IED#7
IED#8

64
As shown in the figure, adding internal mild steel rebar, as energy dissipaters, increased
the ultimate strength. However, failure of the piers having such rebar was quite brittle with
limited drift angle capacity. Adding the rebar changed the mode of failure from compression
controlled, for pier IED#0- without internal rebar, to anchorage failure in the rebar due to the
limited development length (Fig. 4.18).
Figure 4.18: High stress concentrations in the
segments due to the insufficient development
length of the IED bar
In general, increasing the rebar size decreased the ultimate drift angle but increased the
ultimate strength of the piers. Fig. 4.19 shows the relationship between pier lateral drift angle
versus the normalized tensile stress in the rebar located at the extreme tension side of the pier.
The normalized tensile stress is defined as the stress in the rebar normalized by its yield stress.
The figure shows that in the case of small rebar diameters, i.e. #3 and #4, the mild bars reached
their yield strength before the failure of the pier occurs. However, the rebar were not able to
develop their over-strength stresses. For large rebar diameters i.e. #7 and #8 the mild rebar didn‟t
reach their yield stress. However, there was softening in the behavior of the rebar. This softening
High tensile
stress
concentrations

65
is attributed to anchorage failure of the rebar. Yielding of the rebar potentially will lead to higher
energy dissipation, high residual displacement, and more concrete damage. However, the rebar
should be well designed to avoid brittle anchorage failure.
Figure 4.19: The effects of different IED rebar
diameters on normalized stresses on the rebar
4.5 Findings and Conclusions
This paper discusses the seismic behavior of the SPPT bridge pier system. The piers
consist of precast segments stacked on each other and sandwiched between a reinforced concrete
foundation and the bridge superstructure. The system is connected by unbonded post-tensioning
tendons passing through ducts made in the segments during casting. The bottommost segments
of the piers were encased in steel tubes to enhance its ductility. A FE model was used to
investigate different design parameters and how they affect the backbone curves of a given pier.
Different parameters including: initial post-tensioning stresses as a percentage of the tendon
yield stress, the applied axial stresses on concrete due to post-tensioning, the piers aspect ratios,
construction details, confinement thicknesses, and adding internal mild steel rebar as energy
dissipaters are discussed in this manuscript. The analyses revealed that:
Increasing the post-tensioning stresses in the tendon by decreasing its cross sectional area
while keeping the same axial stress on the concrete will not have significant effects on
relatively slender piers. In this case tendons will not likely yield. On the other hand,
-40
-20
0
20
40
60
80
100
120
140
0.0 0.5 1.0 1.5 2.0 2.5
Str
ess
/ yie
ld s
tres
s (%
)
Drift(%)
IED#3IED#4IED#7IED#8

66
increasing the initial post-tensioning stresses in the tendons of squat piers will potentially
lead to yielding of the tendon during a major earthquake excitation which will decrease
both the pier‟s tangent stiffness and the ultimate strength. Based on the data analyzed in
this manuscript, it seems that an initial tendon stress of 45% of its yield stress will be
appropriate for design purposes. Using this initial post-tensioning stress will not lead to
yielding of the tendon until a lateral drift angle of approximately 4.5%.
Increasing the initial axial stresses on concrete segments by increasing the post-
tensioning forces significantly increased the yield and ultimate strengths, but reduced the
ultimate drift angles. Based on the data analyzed in this manuscript, an initial axial stress
on the concrete of approximately 20% of f‟c seems appropriate for design purposes.
Increasing the aspect ratio of the piers led to a decrease of the initial stiffness and post-
elastic stiffness as well as the yield lateral load. On the other hand, increasing the aspect
ratio led to a less brittle descending branch of the backbone curves.
Encasing the concrete segments in steel tubes significantly increased the ductility of the
SPPT piers. However, the confinement volumetric ratio and height are critical parameters
that can be tailored to fit different seismic demands.
Adding internal energy dissipaters to the piers led to an increase in the ultimate strength
and post elastic stiffness. Using small reinforcement ratios resulted in yielding of the
rebar potentially leading to high energy dissipation and residual displacement. On the
other hand, using high reinforcement ratios resulted in elastic response of the rebar
potentially leading to small energy dissipation and residual displacements. However,
adequate development length should be provided to avoid concrete brittle failure.

67
4.6 Acknowledgements
Funding for this research was provided by Transportation Northwest (TransNow) under
Project No. 5200. Their assistance is greatly appreciated.
4.7 References
ABAQUS Software and Documentation, Version 6.8-2. © Dassault Systèmes, SIMULIA,
2008.
ASTM A569/A569M-98, (Standard Specification for Steel, Carbon (0.15 Maximum,
Percent), Hot-Rolled Sheet and Strip Commercial)
ASTM A779 / A779M – 05, (Standard Specification for Steel Strand, Seven-Wire,
Uncoated, Compacted, Stress-Relieved for Prestressed Concrete)
Chou, C.-C., and Chen, Y.-C., (2006). “Cyclic tests of post-tensioned precast CFT
segmental bridge columns with unbonded strands” J. Earthquake Engng. Struct. Dyn., 35,
159-175.
Dawood, H. M., “Seismic Behavior and Design of Segmental Precast Post-tensioned
Concrete Piers”, M.Sc. thesis, Washington State University, Washington, 2010
Dawood, H., ElGawady, M., and Hewes, J., “Behavior of Segmental Precast Post-
Tensioned Bridge Piers Under Lateral Loads: Experimental and Modeling”, Journal of
Bridge Engineering, 2010 (in review).
ElGawady, M., Booker, A., Dawood, H. M. (2010- In press). “Seismic behavior of post-
tensioned concrete filled fiber tubes”, ASCE, Journal of Composites for Construction.
Hewes, J.T. “Seismic Design and Performance of Precast Concrete Segmental Bridge
Columns.” Ph.D. Dissertation, University of California, San Diego, La Jolla, California.
2002.
Priestley, M.J.N.,Calvi, G. M., and Kowalsky, M. J., “Displacement Based Seismic
Design of Structures,” IUSS Press, Pavia, Italy,2007, 720pp.

68
CHAPTER FIVE
FINITE ELEMENT MODEL CALIBRATION AGAINST SPPT SYSTEM DEVELOPED
IN WASHINGTON STATE UNIVERSITY AND PARAMETRIC STUDY
5.1 Introduction
The aim of this chapter is to calibrate the finite element model described in chapter (3)
against the experimental study conducted on a segmental precast post-tensioned (SPPT) pier
system developed at WSU. The chapter contains a brief description of the experimental studies
conducted by Booker (2008) and ShaAlan (2009) at WSU. The implementation of the FE model
to fit the different parameters used in these studies is described and followed by a comparison
between the output of the FE model and the two experimental studies. Finally, a parametric study
is presented.
5.2 Piers Tested by Booker (2008)
Two SPPT concrete piers tested by Booker (2008) were used in the FE model‟s
calibration. These piers were tested under cyclic loading induced by an actuator attached to a
steel loading frame (Fig. 5.1). The two piers have the characteristics presented in Table 5.1 and
shown in Fig. 5.2.
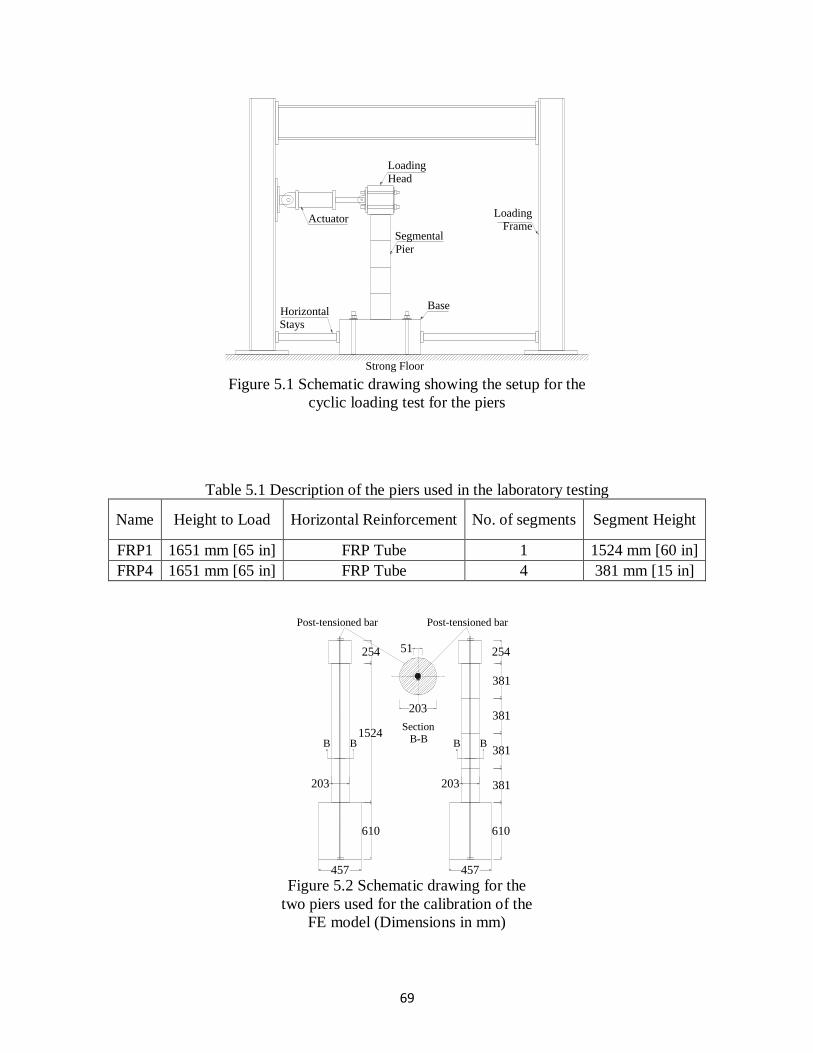
69
Figure 5.1 Schematic drawing showing the setup for the
cyclic loading test for the piers
Table 5.1 Description of the piers used in the laboratory testing
Name Height to Load Horizontal Reinforcement No. of segments Segment Height
FRP1 1651 mm [65 in] FRP Tube 1 1524 mm [60 in]
FRP4 1651 mm [65 in] FRP Tube 4 381 mm [15 in]
Figure 5.2 Schematic drawing for the
two piers used for the calibration of the
FE model (Dimensions in mm)
Actuator
HorizontalStays
Segmental
Pier
Strong Floor
Base
LoadingFrame
Loading
Head
Post-tensioned bar
203
381
381
381
381
610
457
254
203
51
B B
SectionB-B
Post-tensioned bar
203
1524
610
457
254
B B

70
5.3 Bents Tested by Shaalan (2009)
Two SPPT concrete bents tested by Shaalan (2009) were used in the FE model‟s
calibration. The schematic drawings showing the setup for the cyclic loading test and the bents
configuration are shown in Figs. 5.3 and 5.4, respectively. Table 5.3 shows the description of the
tested frames.
Figure 5.3 Schematic drawing showing the setup for the cyclic
loading test for the bents
Table 5.2 Description of the bents used in the laboratory testing
Name Height to Load Horizontal Reinforcement No. of segments Segment Height
F-FRP1 1334 mm [52.5 in] FRP Tube 1 1143 mm [45 in]
F-FRP3 1334 mm [52.5 in] FRP Tube 3 381 mm [15 in]
Actuator
HorizontalStays
Segmental
Pier
Strong Floor
Base
LoadingFrame
RC Beam 2 Loading
Channels

71
Figure 5.4 Schematic drawing for the tested
frames
5.4 Finite Element Model Implementation
The specimens studied by Booker (2008) and Shaalan (2009) were constructed by
sandwiching segments between the foundation and superstructure of the pier (represented by a
loading stub for the piers and by a reinforced concrete beam for the bents) by an unbonded post-
tensioned bar. The segments were plain concrete directly poured in glass fiber reinforced
polymer (GFRP) tubes to confine the concrete‟s core and work as permanent formwork for the
segments. In the case of the bents, a reinforced concrete beam was post-tensioned to the top of
both piers to make the two piers behave as one bent (Fig. 5.5).
The passive confining stresses imposed by the GFRP tubes on the concrete core during
loading alter its stress-strain behavior by increasing both its peak strength and ductility. Through
this study, Samaan et al.‟s (1998) model was used for developing the stress-strain behavior of the
pier‟s core. On the other hand, the model developed by Mander el al. (1988) was used to develop
the stress strain curve of the reinforced concrete beam.
F-FRP1 F-FRP3

72
The characteristic compressive strengths (f‟c) of the concrete used for casting the
segments and the reinforced concrete beam were 13.8 MPa [2000 psi] and 22.08 MPa [3200 psi],
respectively. Concrete was defined using a density of 2214 kg/m3 [138 lb/ft
3] and a Poisson‟s
ratio of 0.2. The stress strain curves in compression for the concrete segments and the reinforced
concrete beam is shown in Fig. 5.6.
(a) (b)
Figure 5.5: Typical mesh used for the FE model of: a) piers, and b) bents.
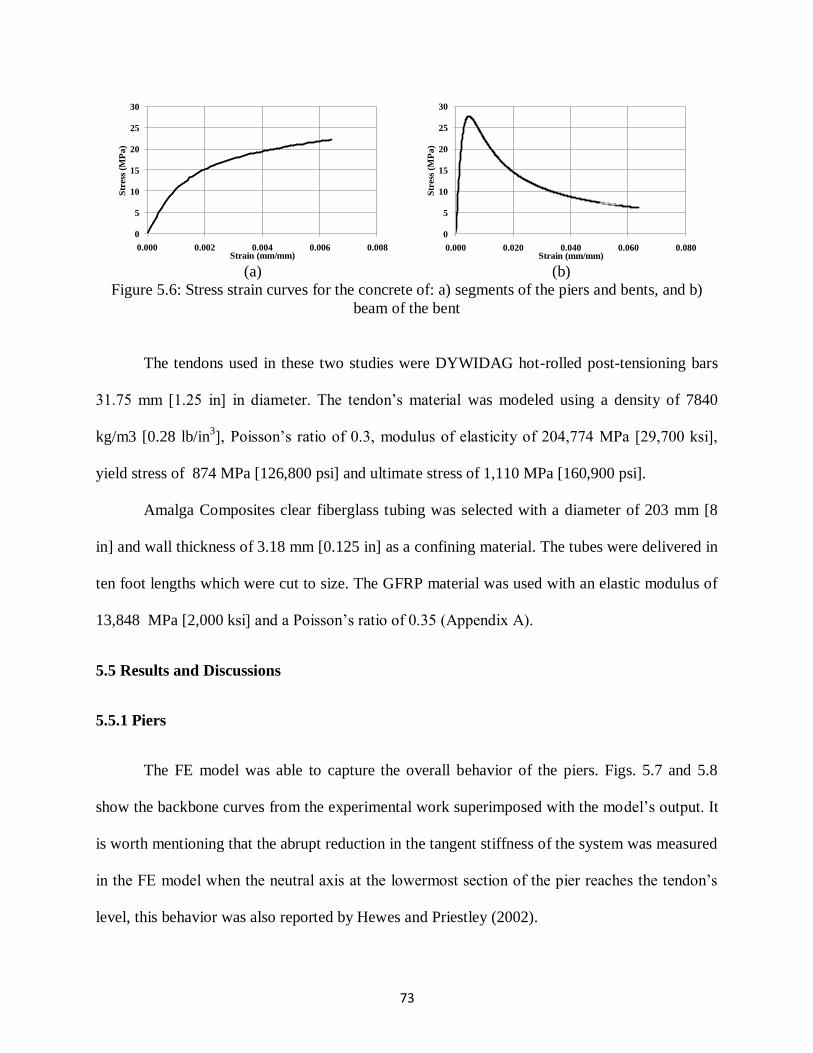
73
(a) (b)
Figure 5.6: Stress strain curves for the concrete of: a) segments of the piers and bents, and b)
beam of the bent
The tendons used in these two studies were DYWIDAG hot-rolled post-tensioning bars
31.75 mm [1.25 in] in diameter. The tendon‟s material was modeled using a density of 7840
kg/m3 [0.28 lb/in3], Poisson‟s ratio of 0.3, modulus of elasticity of 204,774 MPa [29,700 ksi],
yield stress of 874 MPa [126,800 psi] and ultimate stress of 1,110 MPa [160,900 psi].
Amalga Composites clear fiberglass tubing was selected with a diameter of 203 mm [8
in] and wall thickness of 3.18 mm [0.125 in] as a confining material. The tubes were delivered in
ten foot lengths which were cut to size. The GFRP material was used with an elastic modulus of
13,848 MPa [2,000 ksi] and a Poisson‟s ratio of 0.35 (Appendix A).
5.5 Results and Discussions
5.5.1 Piers
The FE model was able to capture the overall behavior of the piers. Figs. 5.7 and 5.8
show the backbone curves from the experimental work superimposed with the model‟s output. It
is worth mentioning that the abrupt reduction in the tangent stiffness of the system was measured
in the FE model when the neutral axis at the lowermost section of the pier reaches the tendon‟s
level, this behavior was also reported by Hewes and Priestley (2002).
0
5
10
15
20
25
30
0.000 0.002 0.004 0.006 0.008
Str
ess
(MP
a)
Strain (mm/mm)
0
5
10
15
20
25
30
0.000 0.020 0.040 0.060 0.080
Str
ess
(MP
a)
Strain (mm/mm)

74
Figure 5.7: Experimental versus predicted
backbone curves for the singly segmented
pier
Figure 5.8: Experimental versus predicted
backbone curves for the multi segmented
pier
Figs. 5.7 and 5.8 show that the FE model was able to capture the initial stiffness of the
piers. On the other hand, the FE model over estimated the lateral load at which the stiffness is
reduced. An indepth study was performed to understand which factors affects this load, the major
factor was found to be the post-tensioning load. The foundation surface was not well leveled
during the casting, to overcome this problem a grout layer was used to assure a well leveled
surface. This grout layer showed severe damage while testing the piers in the lab. The grout
behavior can be explained as follows. At the beginning of the lateral loading, the grout behaved
without suffering any damage so it did not affect the system‟s behavior. At high lateral drift
angles the damage propagated, resulting in a softer behavior. The softened grout layer affected
0
5
10
15
20
25
30
0 5 10 15 20 25 30
Late
ral L
oad
(k
N)
Drift (%)
Experimental
FE Model
0
5
10
15
20
25
30
0 5 10 15 20
Late
ral L
oad
(k
N)
Drift (%)
Experimental
FE Model
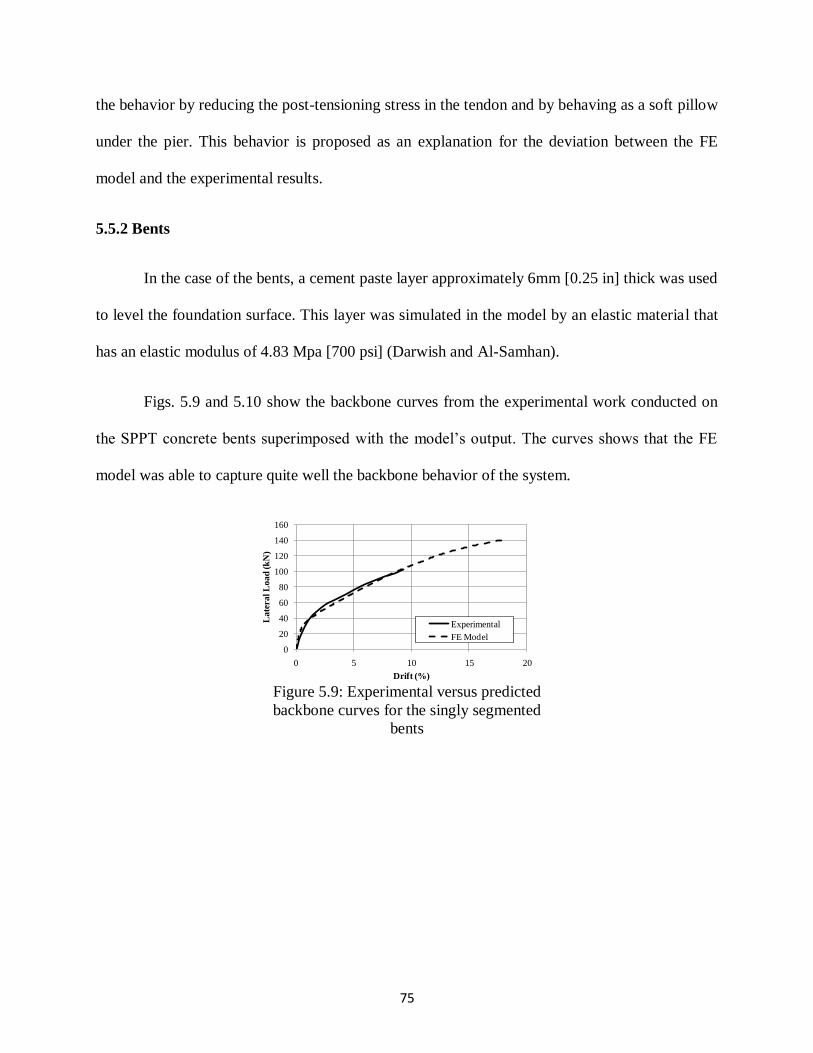
75
the behavior by reducing the post-tensioning stress in the tendon and by behaving as a soft pillow
under the pier. This behavior is proposed as an explanation for the deviation between the FE
model and the experimental results.
5.5.2 Bents
In the case of the bents, a cement paste layer approximately 6mm [0.25 in] thick was used
to level the foundation surface. This layer was simulated in the model by an elastic material that
has an elastic modulus of 4.83 Mpa [700 psi] (Darwish and Al-Samhan).
Figs. 5.9 and 5.10 show the backbone curves from the experimental work conducted on
the SPPT concrete bents superimposed with the model‟s output. The curves shows that the FE
model was able to capture quite well the backbone behavior of the system.
Figure 5.9: Experimental versus predicted
backbone curves for the singly segmented
bents
0
20
40
60
80
100
120
140
160
0 5 10 15 20
La
tera
l L
oa
d (
kN
)
Drift (%)
Experimental
FE Model

76
Figure 5.10: Experimental versus predicted
backbone curves for the multi segmented
bents
5.6 Parametric Study
The model described above was used to study the effects of different design parameters
on the backbone curves of the previously described SPPT piers. The piers in this parametric
study have f‟c = 41.4 MPa [6000 psi] and a FRP confining tube thickness = 19 mm [0.75 in]. The
FRP characteristics were similar to those used in FRP1 and FRP4. Two series of piers were
investigated in this parametric study: series “L” are piers having large diameter of 1220 mm [48
in] while series “S” are piers having a diameter of 610 mm [24 in]. The post-tensioning tendons
had yield diameters of 176 mm [6.92 in] and 93 mm [3.68 in] for “S” and “L” series,
respectively. The piers had heights ranging from 1830 mm [72 in] to 9145 mm [360 in]. All the
piers were subjected to external gravity load corresponding to an axial stresses normalized by f‟c
(DL) of 7%, unless otherwise mentioned. The piers were subjected to variable post-tensioning
forces corresponding to axial stresses, normalized by f‟c, (PT) ranging from 10% to 30%. The
increases in the applied post-tensioning forces were achieved by increasing the stresses in the
tendons from 20% to 60% of the yield stresses of the tendons, respectively.
5.6.1 Effects of applied post-tensioning force
Fig. 5.11 shows the effects of changing the applied post-tensioning force on the backbone
curves of three different piers of the S-series. The piers have three different aspect ratios (AR) of
0
20
40
60
80
100
120
140
0 5 10 15 20
La
tera
l L
oa
d (
kN
)
Drift (%)
Experimental
FE Model

77
3, 6, and 9. As shown in the figure, increasing PT from 10% to 30% increased the piers yield
strengths. For a given aspect ratio, increasing the post-tensioning stresses in the tendon led to
early yielding of the tendon. Yielding of the tendon is characterized by softening in the backbone
curve due to degradation in the lateral strength and stiffness. Under earthquake excitation,
yielding of the tendon leads to losses in the post-tensioning forces. However, for all cases
presented in the figure, the earliest yielding in a tendon occurred at a drift angle of approximately
7% for pier having an AR = 3 and PT = 30%. A typical bridge pier would reach a drift angle of
approximately 6% under the maximum credible earthquake.
(a)
(b)
(c)
Figure 5.11: Effects of changing the applied post-tensioning forces on the
backbone curves of piers having aspect ratios of (a) 3, (b) 6, and (c) 9
(Note the different scales in the graphs)
5.6.2 Effects of load combination
Fig. 5.12 shows the backbone curves for three piers of S series having AR of 3, 6, and 9.
The three piers have axial stresses due to the applied gravity load and post-tensioning force,
normalized by f‟c, of 25%. However, two different load combinations were investigated. Case I
0
200
400
600
800
1000
1200
0 5 10 15 20
Late
ral
Load
(k
N)
Drift (%)
PT=10%
PT=15%
Pt=20%
PT=30%
0
100
200
300
400
500
600
0 5 10 15 20 25
Late
ral
Load
(k
N)
Drift (%)
PT=10%
PT=15%
Pt=20%
PT=30%
0
50
100
150
200
250
300
350
400
0 5 10 15 20 25 30
Late
ral
Load
(k
N)
Drift (%)
PT=10%
PT=15%
Pt=20%
PT=30%
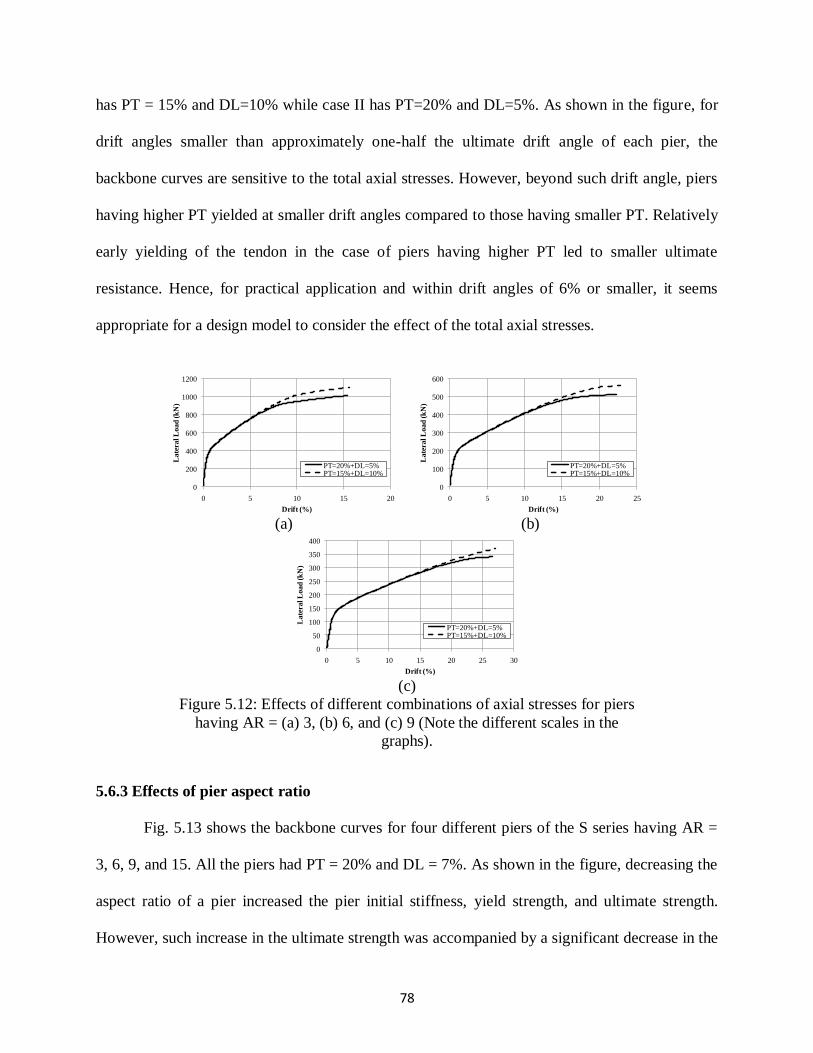
78
has PT = 15% and DL=10% while case II has PT=20% and DL=5%. As shown in the figure, for
drift angles smaller than approximately one-half the ultimate drift angle of each pier, the
backbone curves are sensitive to the total axial stresses. However, beyond such drift angle, piers
having higher PT yielded at smaller drift angles compared to those having smaller PT. Relatively
early yielding of the tendon in the case of piers having higher PT led to smaller ultimate
resistance. Hence, for practical application and within drift angles of 6% or smaller, it seems
appropriate for a design model to consider the effect of the total axial stresses.
(a)
(b)
(c)
Figure 5.12: Effects of different combinations of axial stresses for piers
having AR = (a) 3, (b) 6, and (c) 9 (Note the different scales in the
graphs).
5.6.3 Effects of pier aspect ratio
Fig. 5.13 shows the backbone curves for four different piers of the S series having AR =
3, 6, 9, and 15. All the piers had PT = 20% and DL = 7%. As shown in the figure, decreasing the
aspect ratio of a pier increased the pier initial stiffness, yield strength, and ultimate strength.
However, such increase in the ultimate strength was accompanied by a significant decrease in the
0
200
400
600
800
1000
1200
0 5 10 15 20
Late
ral
Load
(k
N)
Drift (%)
PT=20%+DL=5%PT=15%+DL=10%
0
100
200
300
400
500
600
0 5 10 15 20 25
Late
ral
Load
(k
N)
Drift (%)
PT=20%+DL=5%PT=15%+DL=10%
0
50
100
150
200
250
300
350
400
0 5 10 15 20 25 30
Late
ral
Load
(k
N)
Drift (%)
PT=20%+DL=5%PT=15%+DL=10%

79
pier deformation capacity. In addition, yielding of the tendons occurred at small drift angles for
squat piers. Yielding of the tendon occurred at drift angles ranged from 10% for AR = 3 to 30%
for AR = 15.
5.6.4 Effects of Pier size
Fig. 5.14 shows the backbone curves for two piers: one pier from the S series and the
other one from the L series. Both piers have the same aspect ratio of 3. The piers were
investigated under PT = 10% and 30%. The applied lateral load of the piers was normalized by
the cross sectional area of the pier. As shown in the figure, for the same axial stress both piers
have the same shear stresses for a given drift angle until opening of the interface joints at the
bases of the piers. However, once the interface joints opened, the shear stresses for the smaller
pier are higher than those of the larger pier at a given drift angle. Finally, the smaller pier
reached yielding of the tendon at smaller drift compared to the larger pier. The tendon yielded at
drift angles that ranged from approximately 7% for PT = 30% to 10% at PT = 10%. The
corresponding values for large piers are 10% and 15%, respectively.
(a) (b)
Figure 5.13: Effects of piers aspect ratios on the backbone curves of
lateral drift angle vs. a) lateral load; and b) lateral load normalized by the
cross sectional area
0
200
400
600
800
1000
1200
0 10 20 30 40
La
tera
l L
oa
d (k
N)
Drift (%)
AR=3.00AR=6.00AR=9.00AR=15.00
0.0
0.5
1.0
1.5
2.0
2.5
3.0
3.5
4.0
0 10 20 30 40
La
tera
l S
tres
s (N
/mm
2)
Drift (%)
AR=3.00
AR=6.00
AR=9.00
AR=15.00
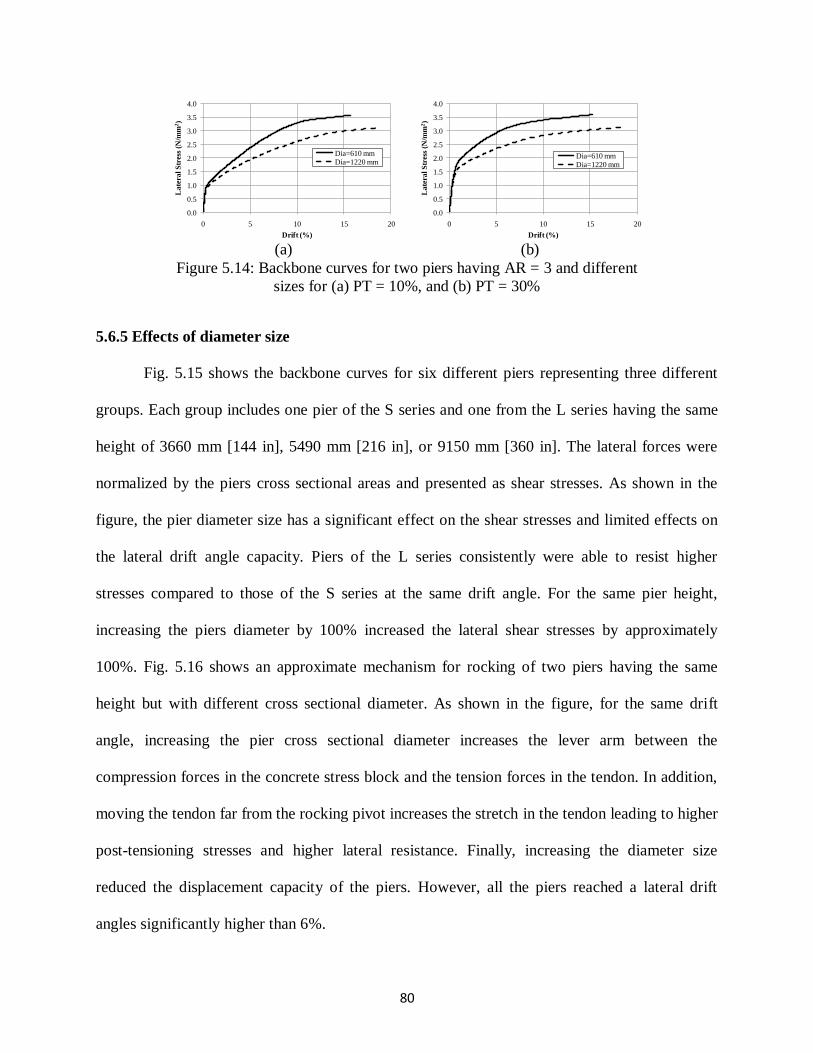
80
(a)
(b)
Figure 5.14: Backbone curves for two piers having AR = 3 and different
sizes for (a) PT = 10%, and (b) PT = 30%
5.6.5 Effects of diameter size
Fig. 5.15 shows the backbone curves for six different piers representing three different
groups. Each group includes one pier of the S series and one from the L series having the same
height of 3660 mm [144 in], 5490 mm [216 in], or 9150 mm [360 in]. The lateral forces were
normalized by the piers cross sectional areas and presented as shear stresses. As shown in the
figure, the pier diameter size has a significant effect on the shear stresses and limited effects on
the lateral drift angle capacity. Piers of the L series consistently were able to resist higher
stresses compared to those of the S series at the same drift angle. For the same pier height,
increasing the piers diameter by 100% increased the lateral shear stresses by approximately
100%. Fig. 5.16 shows an approximate mechanism for rocking of two piers having the same
height but with different cross sectional diameter. As shown in the figure, for the same drift
angle, increasing the pier cross sectional diameter increases the lever arm between the
compression forces in the concrete stress block and the tension forces in the tendon. In addition,
moving the tendon far from the rocking pivot increases the stretch in the tendon leading to higher
post-tensioning stresses and higher lateral resistance. Finally, increasing the diameter size
reduced the displacement capacity of the piers. However, all the piers reached a lateral drift
angles significantly higher than 6%.
0.0
0.5
1.0
1.5
2.0
2.5
3.0
3.5
4.0
0 5 10 15 20
Late
ral
Str
ess
(N/m
m2)
Drift (%)
Dia=610 mm
Dia=1220 mm
0.0
0.5
1.0
1.5
2.0
2.5
3.0
3.5
4.0
0 5 10 15 20
Late
ral
Str
ess
(N/m
m2)
Drift (%)
Dia=610 mm
Dia=1220 mm

81
(a)
(b)
(c)
Figure 5.15: Backbone curves for piers from the S series (dashed line) and L series(solid line)
having heights of (a) 3660, (b) 5490, and (c) 9150 mm
Figure 5.16: An approximate mechanism for
rocking of two piers having the same height
but with different cross sectional diameter
5.6.6 Effects of confinement
Figs. 5.17 and 5.18 show the backbone curves for four piers: two from the S series and
two from the L series. All piers have a height of 5487 mm [216 in]. The piers were subjected to
0
0.5
1
1.5
2
2.5
3
3.5
0 5 10 15 20 25
Late
ral
Str
ess
(N/m
m2)
Drift (%)
AR=3.00
AR=6.00
0
0.5
1
1.5
2
2.5
0 5 10 15 20 25 30
La
tera
l S
tres
s (N
/mm
2)
Drift (%)
AR=4.50
AR=9.00
0
0.2
0.4
0.6
0.8
1
1.2
1.4
0 10 20 30 40
Late
ral
Str
ess
(N/m
m2)
Drift (%)
AR=7.50
AR=15.00
H HD1 D2
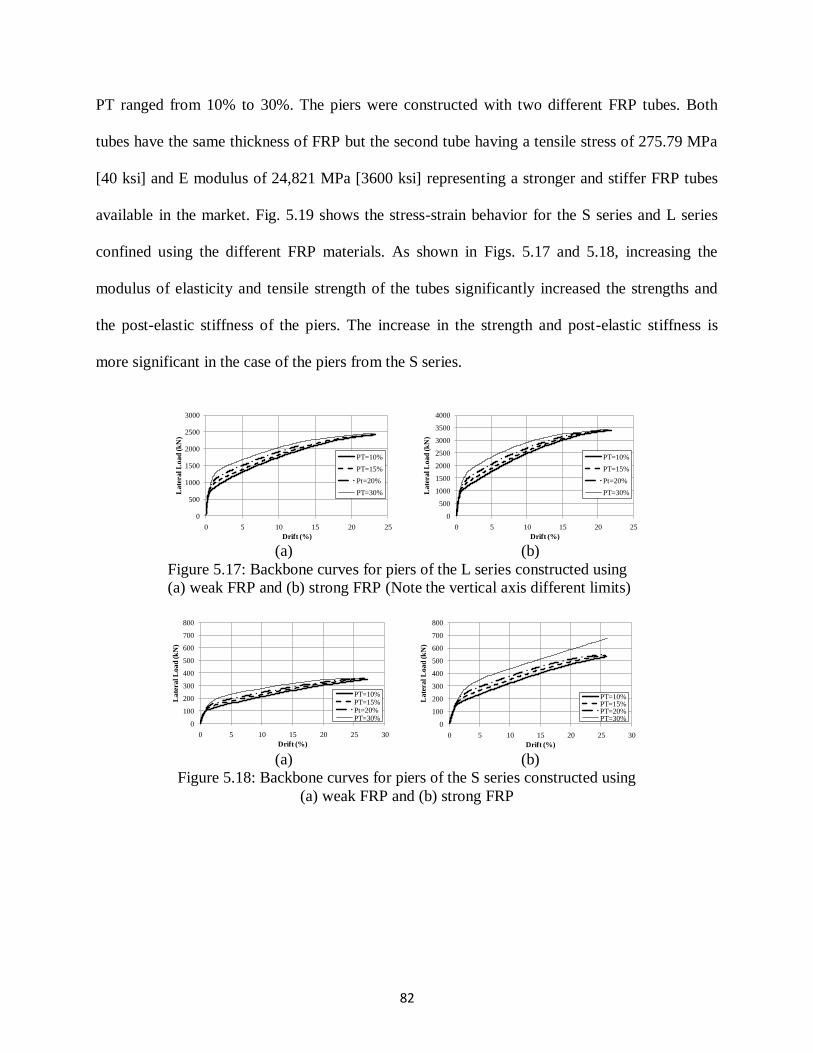
82
PT ranged from 10% to 30%. The piers were constructed with two different FRP tubes. Both
tubes have the same thickness of FRP but the second tube having a tensile stress of 275.79 MPa
[40 ksi] and E modulus of 24,821 MPa [3600 ksi] representing a stronger and stiffer FRP tubes
available in the market. Fig. 5.19 shows the stress-strain behavior for the S series and L series
confined using the different FRP materials. As shown in Figs. 5.17 and 5.18, increasing the
modulus of elasticity and tensile strength of the tubes significantly increased the strengths and
the post-elastic stiffness of the piers. The increase in the strength and post-elastic stiffness is
more significant in the case of the piers from the S series.
(a)
(b)
Figure 5.17: Backbone curves for piers of the L series constructed using
(a) weak FRP and (b) strong FRP (Note the vertical axis different limits)
(a) (b)
Figure 5.18: Backbone curves for piers of the S series constructed using
(a) weak FRP and (b) strong FRP
0
500
1000
1500
2000
2500
3000
0 5 10 15 20 25
Late
ral
Load
(k
N)
Drift (%)
PT=10%
PT=15%
Pt=20%
PT=30%
0
500
1000
1500
2000
2500
3000
3500
4000
0 5 10 15 20 25
Late
ral
Load
(k
N)
Drift (%)
PT=10%
PT=15%
Pt=20%
PT=30%
0
100
200
300
400
500
600
700
800
0 5 10 15 20 25 30
La
tera
l L
oa
d (k
N)
Drift (%)
PT=10%PT=15%Pt=20%PT=30%
0
100
200
300
400
500
600
700
800
0 5 10 15 20 25 30
La
tera
l L
oa
d (
kN
)
Drift (%)
PT=10%PT=15%PT=20%PT=30%

83
(a)
(b)
Figure 5.19: The stress-strain relationships for piers from the S and L
series confined using (a) weak FRP and (b) strong FRP tubes
5.7 Conclusions
This chapter introduces the implementation of different material behaviors in the
previously developed FE model to be able to capture the backbone behavior of SPPT concrete
piers and bents tested in Washington State University. This investigation revealed that:
The FE model was able to capture the backbone behavior of both SPPT concrete piers
and bents quite well.
The grout layer behaved quite well at the beginning of testing, but after that the damage
induced by high stress concentrations on it made it softer. This led to reduction in the
post-tensioning stresses in the tendon.
The grout layer used to level the foundation surface, in the case of piers, affected the
lateral load at which the tangent stiffness of the system reduces.
The cement paste as well affected the initial and post-elastic tangent stiffnesses of the
SPPT concrete bents.
Including the cement paste layer in the FE model proved its efficacy as the FE model was
then able to capture the bent‟s behavior very well.
0
10
20
30
40
50
60
70
80
90
0.000 0.005 0.010 0.015 0.020 0.025
Str
ess
(MP
a)
Strain (mm/mm)
Diameter= 610mm
Diameter=1220mm
0
10
20
30
40
50
60
70
80
90
0.000 0.005 0.010 0.015 0.020 0.025
Str
ess
(MP
a)
Strain (mm/mm)
Diameter= 610mm
Diameter=1220mm
84
Based on the results of the presented parametric study:
The level of the applied post-tensioning forces has a significant effect on the backbone of
SPPT-CFFT piers. Increasing the applied post-tensioning increased the yield strength of
the piers. However, increasing the post-tensioning stresses in the tendons combined with
decreasing the pier‟s height led to yielding of the tendon at relatively small drifts.
For the parameters chosen for this study and within the feasible drift angle for a pier, the
analysis was more sensitive to the total applied axial loads than to the ratio of the applied
post-tensioning to gravity loads.
Increasing the piers‟ aspect ratios decreased the initial stiffness, ultimate strength, and
yield strength but increased the deformation capacity. In addition, tendons in squat piers
tend to yield at small drift angles compared to relatively slender piers.
The analysis showed that the pier size played an important role in the behavior of the
piers once the interface joint opened. However, before the interface joint opening, the
performance of the piers depended on the piers‟ aspect ratios.
For the same pier height, increasing the pier diameter size significantly increased the pier
shear stress capacity but had minimal effect on the pier deformation capacity.
Increasing the tensile strength and E-modulus of the confining tube significantly
improved the strength and post-elastic stiffness of the piers. However, it did not have
significant effect on the deformation capacity of the piers.
5.8 References
Booker, A. J. (2008). „„Performance of continous and segmented post-tensioned concrete
filled fiber tubes.‟‟ M.Sc. thesis, Washington State Univ., WA, USA

85
Darwish, S.M., and Al-Samhan, A., (2008). "The effect of cement stiffness and tibia tray
material on the stresses developed in artificial knee." Journal of Adhesion, 28, 120-125.
Hewes, J. T., and Priestley N. (2002). “Seismic design and performance of precast
concrete segmental bridge columns.” Report No. SSRP-2001/25, Univ. of California at
San Diego.
Mander, J. B., Priestley, M. J. N., and Park, R. (1988).„„Theoretical stress-strain model
for confined concrete.‟‟ J. Struct. Eng., 114(8), 1804–1826.
Samaan, M., Mirmiran, A., and Shahawy, M. (1998). „„Model of concrete confined by
fiber composite.‟‟ J. Struct. Eng., 124(9), 1025–1031.
Shaalan, A. (2009). „„Performance of re-centering moment resisting frames composed of
continous and segmented precast post-tensioned concrete columns confined by FRP
tubes‟‟ M.Sc. thesis, Washington State Univ., WA, USA
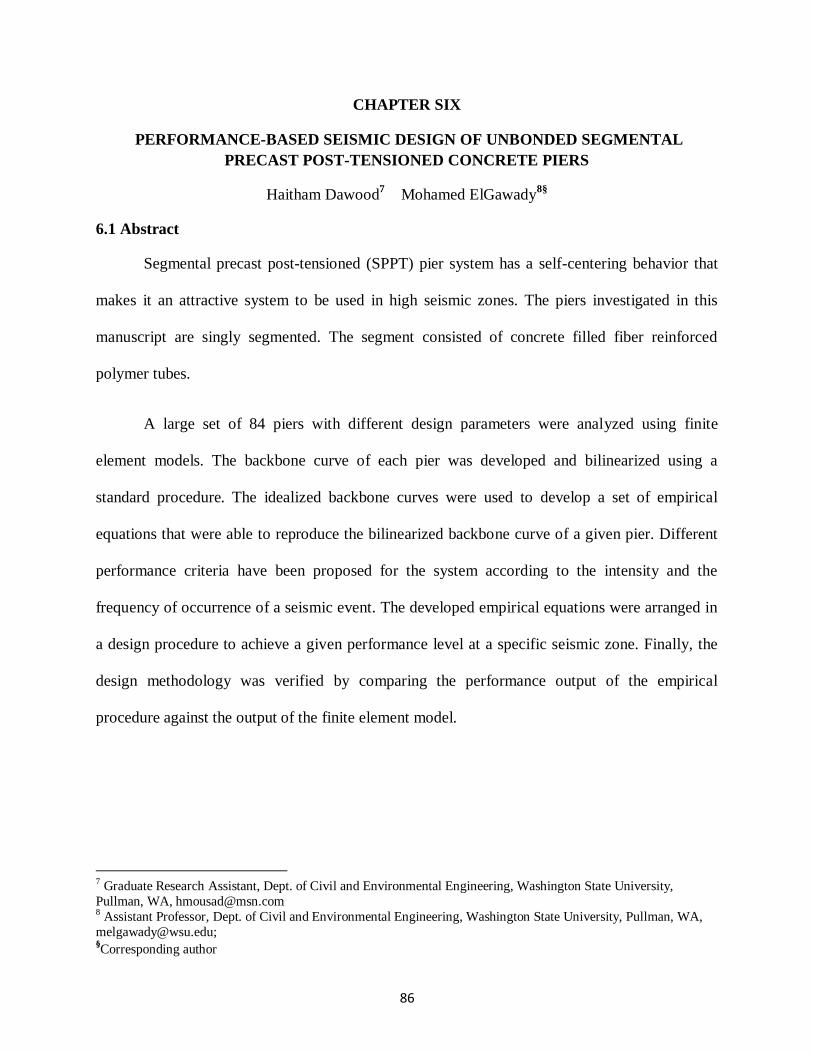
86
CHAPTER SIX
PERFORMANCE-BASED SEISMIC DESIGN OF UNBONDED SEGMENTAL
PRECAST POST-TENSIONED CONCRETE PIERS
Haitham Dawood7 Mohamed ElGawady
8§
6.1 Abstract
Segmental precast post-tensioned (SPPT) pier system has a self-centering behavior that
makes it an attractive system to be used in high seismic zones. The piers investigated in this
manuscript are singly segmented. The segment consisted of concrete filled fiber reinforced
polymer tubes.
A large set of 84 piers with different design parameters were analyzed using finite
element models. The backbone curve of each pier was developed and bilinearized using a
standard procedure. The idealized backbone curves were used to develop a set of empirical
equations that were able to reproduce the bilinearized backbone curve of a given pier. Different
performance criteria have been proposed for the system according to the intensity and the
frequency of occurrence of a seismic event. The developed empirical equations were arranged in
a design procedure to achieve a given performance level at a specific seismic zone. Finally, the
design methodology was verified by comparing the performance output of the empirical
procedure against the output of the finite element model.
7 Graduate Research Assistant, Dept. of Civil and Environmental Engineering, Washington State University,
Pullman, WA, [email protected] 8 Assistant Professor, Dept. of Civil and Environmental Engineering, Washington State University, Pullman, WA,
[email protected]; §Corresponding author
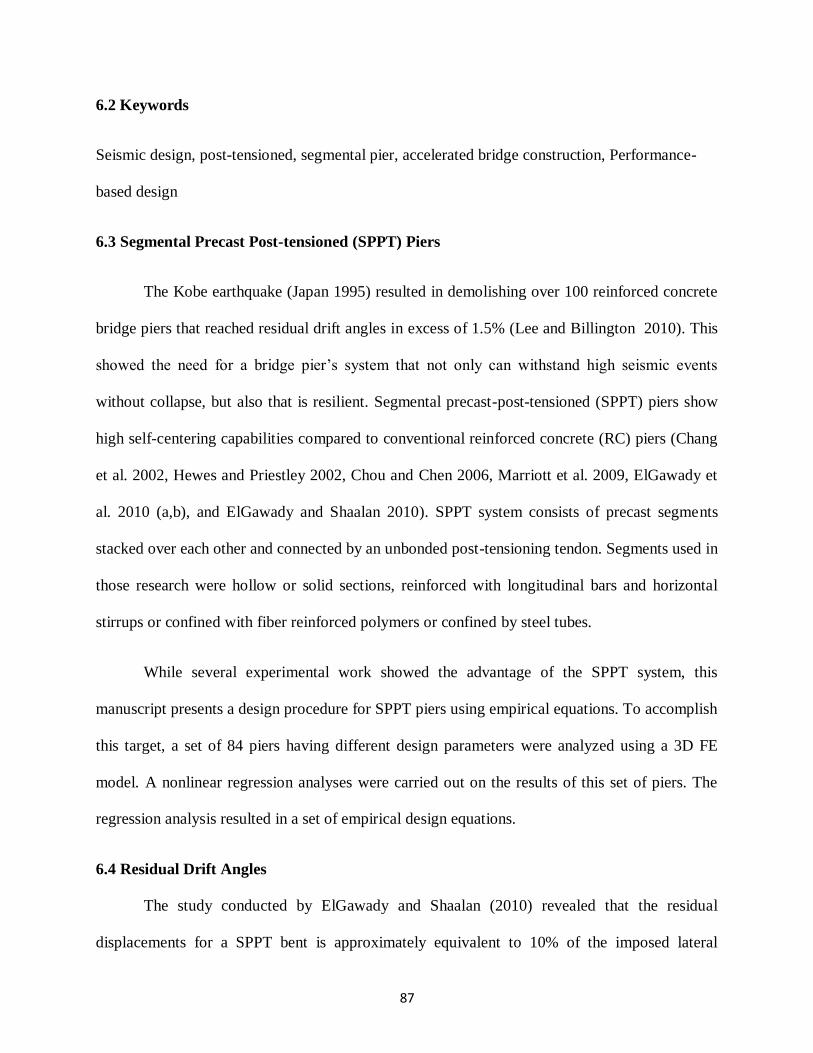
87
6.2 Keywords
Seismic design, post-tensioned, segmental pier, accelerated bridge construction, Performance-
based design
6.3 Segmental Precast Post-tensioned (SPPT) Piers
The Kobe earthquake (Japan 1995) resulted in demolishing over 100 reinforced concrete
bridge piers that reached residual drift angles in excess of 1.5% (Lee and Billington 2010). This
showed the need for a bridge pier‟s system that not only can withstand high seismic events
without collapse, but also that is resilient. Segmental precast-post-tensioned (SPPT) piers show
high self-centering capabilities compared to conventional reinforced concrete (RC) piers (Chang
et al. 2002, Hewes and Priestley 2002, Chou and Chen 2006, Marriott et al. 2009, ElGawady et
al. 2010 (a,b), and ElGawady and Shaalan 2010). SPPT system consists of precast segments
stacked over each other and connected by an unbonded post-tensioning tendon. Segments used in
those research were hollow or solid sections, reinforced with longitudinal bars and horizontal
stirrups or confined with fiber reinforced polymers or confined by steel tubes.
While several experimental work showed the advantage of the SPPT system, this
manuscript presents a design procedure for SPPT piers using empirical equations. To accomplish
this target, a set of 84 piers having different design parameters were analyzed using a 3D FE
model. A nonlinear regression analyses were carried out on the results of this set of piers. The
regression analysis resulted in a set of empirical design equations.
6.4 Residual Drift Angles
The study conducted by ElGawady and Shaalan (2010) revealed that the residual
displacements for a SPPT bent is approximately equivalent to 10% of the imposed lateral

88
displacement on that bent. The residual drift angles of the SPPT piers studied by Hewes and
Priestley (2002) were on the order of 0.10%, except for one specimen which reached 0.3%.
Investigation of the work done by Hewes and Priestley (2002) showed that the residual
displacements represent approximately 4% to 5% of the maximum imposed lateral displacement.
To be conservative, in this study a residual displacement of 10% of the imposed lateral
displacement was adopted. This assumption maybe revised in the future when more experimental
data become available.
6.5 Summary of the Finite Element Model
ABAQUS/Standard version 6.8-2, a general purpose finite element code, was selected as
a basic platform for developing a 3D finite element (FE) model for this study. The model was
presented in detail by Dawood et al. (2010(a)) and verified against three different experimental
studies (Dawood et al. (2010(a)), ElGawady and Dawood (2010) and Dawood 2010).
In this manuscript, the SPPT system consisted of one precast segment sandwiched
between foundation and superstructure. All piers in this study consisted of concrete filled glass
fiber reinforced polymer (GFRP) tubes without any rebars. The system is connected by
unbonded post-tensioning tendons passing through ducts made in the segments during casting.
The model was built up using 3D continuum elements for concrete and fiber components and 3D
beam elements for the post-tensioning tendons (Fig. 6.1).
89
Figure 6.1: FE model for a SPPT pier used in this study
The concrete damaged plasticity model (Lubliner et al. 1989 and Lee and Fenves 1998)
was used to model the concrete material behavior while the classic metal plasticity model was
used for the tendon‟s material. The fiber tube was modeled as an elastic orthotropic material. The
ends of the tendon were embedded in the loading stub (that represents the superstructure) and the
foundation to simulate the tendon‟s anchorage. The tendon was subjected to a stress type initial
condition to simulate its post-tensioning. By neglecting the sliding of the foundation and by
assuming a rigid soil underneath the foundation, the bottom surface of the foundation was
constrained in the three motional directions. A typical pier loading stages were: a) tendon‟s post-
tensioning; b) application of a vertical external gravity load; and c) application of a
monolithically increasing lateral load.
Fig. 6.2 shows the deformed shape of a pier due to the application of the lateral loads. As
shown in the figure, the pier attained its lateral deformation through opening of the interface joint
Pier
Post-tensioning
tendon
Loading stub
Foundation

90
at the base. The FE model successfully captured the overall behavior of the system (i.e., the
backbone behavior, stress concentrations at the pier‟s toe and failure modes). More details about
the model description, its implementation and validation procedures along with an in-depth
parametric studies are presented by Dawood et al. (2010 a, b).
Figure 6.2: Deformed shape of
the pier
6.6 Study Description
The previously described FE model was used to investigate the behavior of a large matrix
of 84 piers having different design parameters, namely, height, diameter, effective post-
tensioning load, and external gravity load. The values studied for each parameter are listed in
table 6.1. The piers were built up using plain concrete with a characteristic compressive strength
(f‟c) of 41.4 MPa [6000 psi] cast directly in glass fiber reinforced polymer (GFRP) confining
tubes 19 mm [0.75in] thick (Table 6.2). The investigated piers have heights ranging from
1830mm [72 in] to 9144mm [360 in] and cross sectional diameter of either 1220 mm [48 in] or
91
610 mm [24 in]. This resulted in piers having aspect ratios of 3 to 15. The stress on the concrete
induced by the gravity load normalized by its f‟c (DL) ranged from 5% to 10%. While, the stress
on the concrete induced by the post-tensioning force normalized by its f‟c (PT) ranged from 10%
to 30%.
Table 6.1: Different investigated parameters for the SPPT
piers
Height Diameter PT DL
1830 mm [72 in] 1220 mm [48 in] 10% 5%
3660 mm [144 in] 610 mm [24 in] 15% 7%
5490 mm [216 in] - 20% 10%
9144 mm [360 in] - 30% -
Table 6.2: Material Properties of the GFRP tubes
Flexural Modulus Longitudinal 13790 MPa [2,000 ksi]
Tensile Strength Longitudinal 634 MPa [9.2 ksi]
Poisson‟s Ratio 0.35
Throughout this study, Samaan et al.‟s (1998) model was used for developing the stress-
strain behavior of concrete confined by GFRP. Fig. 6.3 shows the developed stress strain curves
for the concrete of piers with different diameters. As shown in the figure, although the GFRP and
concrete were identical in both cases, the confining effect increased as the diameter of the cross
section decreased. The concrete was defined using a density of 2214 kg/m3 [0.08 lb/in
3],
Young‟s modulus of 25,414MPa [3686 ksi] and a Poisson‟s ratio of 0.2.

92
Figure 6.3: Compressive stress strain
relationship obtained from Samaan et al.
(1998) to model the GFRP confined concrete
of the piers
The post-tensioning tendon used in the investigation had an equivalent nominal diameter
of either 176 mm [6.92 in] or 93 mm [3.68 in] which resulted in a reinforcement ratio of 2.00%
and 2.35% for piers having cross sectional diameters of 1220 mm [48 in] and 610 mm [24 in],
respectively. These diameters were selected such that the post-tensioning stress in the tendons
were 20% (25%), 30% (38%), 40% (51%) and 60% (76%) of their ultimate (yield) strength. The
axial stresses in the piers cross sections due to these applied post-tensioning forces (PT) were
10%, 15%, 20% and 30% of f‟c, respectively. The post-tensioning tendon was defined with a
Young‟s modulus of 204,774 MPa [29,700ksi], Poisson‟s ratio of 0.3, yield stress of 874 MPa
[126.8 ksi] and ultimate stress of 1110 MPa [160.9 ksi].
6.7 Performance levels
The performance-based seismic design of a structure necessitates specifying performance
criteria for each seismic hazard level. Two performance levels were proposed by Kwan and
Billington (2003), namely functional and survival, and Wight et al. (2007), namely serviceability
and ultimate, for the design of unbonded post-tensioned piers and masonry walls, respectively.
However, there is no consensus on the different performance levels and its criteria for
0
10
20
30
40
50
60
0.000 0.002 0.004 0.006 0.008 0.010 0.012 0.014
Str
ess
(MP
a)
Strain (mm/mm)
Diameter= 610mm
Diameter=1220mm
93
unbounded post-tensioned structural elements. For the SPPT system investigated in this study,
the following performance levels were adopted.
6.7.1 Performance criteria for the serviceability level
The serviceability performance point is associated with the smallest among: a) drift angle
when the concrete reaches its theoretical ultimate confined strain (εn); b) drift angle at which the
stress in the tendon reaches 90% of its yield stress; c) drift angle corresponding to 70% of the
pier‟s ultimate drift angle; and d) drift angle of 2%. The drift angle is defined as the ratio
between the measured lateral displacement at the point of load application and the height of this
point of load application above the pier‟s foundation.
Criterion „a‟ was chosen to insure that no toe crushing will occur, similar criterion was
adopted by Wight et al. (2007) for rocking masonry walls. Currently, the available models for
predicting the stress-strain behavior of confined concrete are quite conservative in predicting the
ultimate strain (e.g., Mander et al. 1988, Samaan et al. 1998, Fam and Rizkalla 2001, Beque et al.
2003, and Teng et al. 2009). Hence, a rocking pier should be able to resist lateral loads well
beyond those causing the confined concrete to reach its theoretical ultimate strains. In addition,
experimental work showed that rocking piers suffered minimal, easy repairable, damage with
minimal residual crack widths when they were subjected to lateral loads causing the confined
concrete, at their toes, to reach its theoretical ultimate strain.
Criterion „b‟ was chosen as a fraction of the yielding stress of the tendon to give a margin
of safety against yielding. Wight et al. (2007) adopted similar criterion for rocking masonry
walls. Kurama (1997) and Kwan and Billington (2003) used 100% of Fy as a criterion for the
serviceability performance level. However, yielding of tendons lead to loss in the applied post-
tensioning forces, stiffness degradation, and reduction in the self-centering capability of the
94
SPPT system. Hence, the authors of this manuscript believe in having a margin of safety against
yielding of the post-tensioning tendons.
Criterion „c‟ was adopted by Kwan and Billington (2003) to provide the piers with a
sufficient margin of safety against brittle failure. Criterion „d‟ was proposed also to ensure a
sufficient margin of safety against brittle failure and to ensure minimal residual drift angle.
For rocking structures, criteria „a‟ and „b‟ may occur just before or after the collapse-
prevention performance level. This indicated the importance of criteria „c‟ and „d‟.
6.7.2 Performance criteria for the collapse-prevention level
The collapse-prevention performance point is associated with the smallest drift angle
among: a) drift angle at which the post-tensioning tendons yield; b) drift angle level of 4.5%; and
c) drift angle that cause a residual drift angle of 1.0%.
Criterion „a‟ was chosen to avoid tendons yielding as discussed before (Kurama 1997 and
Kwan and Billington 2003). Criterion „b‟ was adopted from Priestley et al. (2007) for bridges.
Criterion „c‟ was adopted from Kwan and Billington (2003).
6.8 Equivalent viscous damping
Equivalent viscous damping is an essential parameter that affects the behavior of a
structural system under seismic excitations. Hewes and Priestley (2002) reported an average
equivalent viscous damping of approximately 5% up to a drift angle of 3% with higher values
associated with low confinement due to the damage increase; then, it increased due to spalling of
concrete cover of the reinforced concrete segments. Chou and Chen (2006) reported that the
equivalent viscous damping was 6.5% on average for SPPT piers with a minimum value that was

95
approximately 6%. ElGawady et al. (2010) reported an average equivalent viscous damping of
5% for single segmented pier similar to those investigated in this study. For this study, a
constant 5% equivalent viscous damping was assumed for all drift levels as the concrete core
was externally confined with the GFRP so no concrete cover spalling would occur before the
rupture of the GFRP and collapse of the system.
6.9 Study Procedure
This study provides a simplified design procedure for SPPT piers, consisting of CFFT
segments, using simplified empirical equations. The use of empirical equations will help a design
engineer to avoid going through the cumbersome FE analysis.
To accomplish this target, the following steps were carried out: a) the serviceability and
collapse-prevention performance levels were determined using the criteria discussed before; b)
the backbone curves obtained from the results of the FE models of the 84 piers were bilinearized
following FEMA 356, in this case the performance displacement for serviceability and collapse-
prevention were used as Δu in the FEMA procedure (Fig. 6.4) (i.e., for each pier two bilinearized
backbone curves were prepared); c) each parameter in the bilinear backbone curve (i.e. Ke, Δy,
Fy, Δu, Fu and α (Fig. 6.4)) was studied separately and a nonlinear regression analyses were
carried out to develop an empirical equation for the prediction of each parameter; d) an empirical
equation for predicting the post-tensioning stresses in the tendon, at different drift levels, was
derived;

96
Figure 6.4: Backbone curve along with its
bilinearized form (FEMA 356)
e) a simplified systematic procedure was derived for the design of SPPT pier system
using the developed empirical equations. Once the empirical equations were developed, the
errors in predicting the parameters corresponding to the bilinear system were calculated using
Eq. 6.1.
Error in calculating parameter A (%) =
𝐴𝑓𝑟𝑜𝑚 𝑡ℎ𝑒 𝑒𝑚𝑝𝑖𝑟𝑖𝑐𝑎𝑙 𝑒𝑞𝑢𝑎𝑡𝑖𝑜𝑛 −𝐴𝑓𝑟𝑜𝑚 𝑡ℎ𝑒 𝑏𝑖𝑙𝑖𝑛𝑒𝑎𝑟 𝑎𝑝𝑝𝑟𝑜𝑥𝑖𝑚𝑎𝑡𝑖𝑜𝑛
𝐴𝑓𝑟𝑜𝑚 𝑡ℎ𝑒 𝑏𝑖𝑙𝑖𝑛𝑒𝑎𝑟 𝑎𝑝𝑝𝑟𝑜𝑥𝑖𝑚𝑎𝑡𝑖𝑜𝑛 % (Equation 6.1)
6.10 Collapse-prevention and Serviceability Performance levels
6.10.1 Effective stiffnesses (KCP-e and KS-e)
The nonlinear regression analyses of the data of the 84 piers showed that the effective
stiffness is a function in (EI/H); where, E: is the modulus of elasticity of the pier‟s concrete
(kN/mm2); I: is the moment of inertia of the pier‟s cross section (mm
4); and H is the height of the
pier (mm). The effective stiffness was found to be inversely proportional to PT. Eq. 6.2 was
Backbone curve
Bilinear
approximation
Equal areas
y u
yF
uF
eK
eK
y0.6F
α

97
found to best predict the effective stiffness for both, the collapse prevention (KCP-e) and
serviceability (KS-e) performance levels.
KCP-e (kN/mm) = KS-e (kN/mm) =1.82
𝑃𝑇0.3 3𝐸𝐼
𝐻3 (Equation 6.2)
The mean (µ), standard deviation (σ), and coefficient of variation (Cv) of the errors in
computing the effective stiffness of the system for the 84 piers using Eq. 6.1 is shown in Table
6.3. As shown in the table, Eq. 6.2 predicts quite well KCP-e and KS-e. The µ of the error in
predicting KCP-e was +1.0% and +3.2% with σ of 10.5% and 9.6% when using all piers and 72
piers, respectively. On the other hand, the µ of the error in predicting KS-e was -2.3% and -0.1%
with σ of 10.2% and 9.1% when using all piers and 72 piers, respectively
6.10.2 Yield loads (FCP-y and FS-y)
For a rocking structure, the apparent yielding of the structure is different from yielding of
the unbounded tendon and occurs well before the tendons‟ yield (Kwan and Billington 2003). In
this manuscript, the yield load (FCP-y) will be used to refer to the apparent yielding of the
structure and was defined as the lateral load at which the stiffness of the pier reduces abruptly by
a factor α (Fig. 6.4). Fig. 6.5 shows the relationship between the design parameters of the piers
vs. the yield loads of the piers (kN). The load combination is represented by the horizontal axis
and is defined as two percentages separated by a dash; the first (left, PT) is the stress on the
concrete induced by the post-tensioning; and the second (right, DL) is the stress on the concrete
induced by the gravity load. Both were normalized by the concrete‟s f‟c. In the figure, piers with
the same dimensions are assigned a specific marker type and a code for each dimension is shown
under the figure (e.g., H5490-D0610 is a pier with a height of 5490 mm and a diameter of 610
mm).

98
(a) (b)
Figure 6.5: The yield load associated with
each specific pier for a) collapse-
prevention performance level; and b)
serviceability performance level
Fig. 6.5 shows that FCP-y and FS-y are directly proportional to the value of the combination
of loads acting on the pier. For piers with the same diameter, increasing the height decreases FCP-
y and FS-y. On the other hand, for piers with the same height, increasing the diameter increases
FCP-y and FS-y. Based on the previously mentioned observations, Eqs. 3 and 4 were developed
through a nonlinear regression analysis.
FCP-y (kN) = 𝐷2.8𝑃𝑇0.4𝐷𝐿0.2
400 𝐻 (Equation 6.3)
FS-y (kN) = 𝐷2.8𝑃𝑇0.4𝐷𝐿0.2
480 𝐻 (Equation 6.4)
Where D is the diameter of the pier (mm).
The error associated with using Eqs. 3 and 4 to get FCP-y and FS-y for each pier is
computed using Eq. 6.1 and is presented in Table 6.3. The µ of the error in predicting FCP-y was -
7.5% and -6.4% with σ of 4.9% and 3.8% when using all piers and 72 piers, respectively. On the
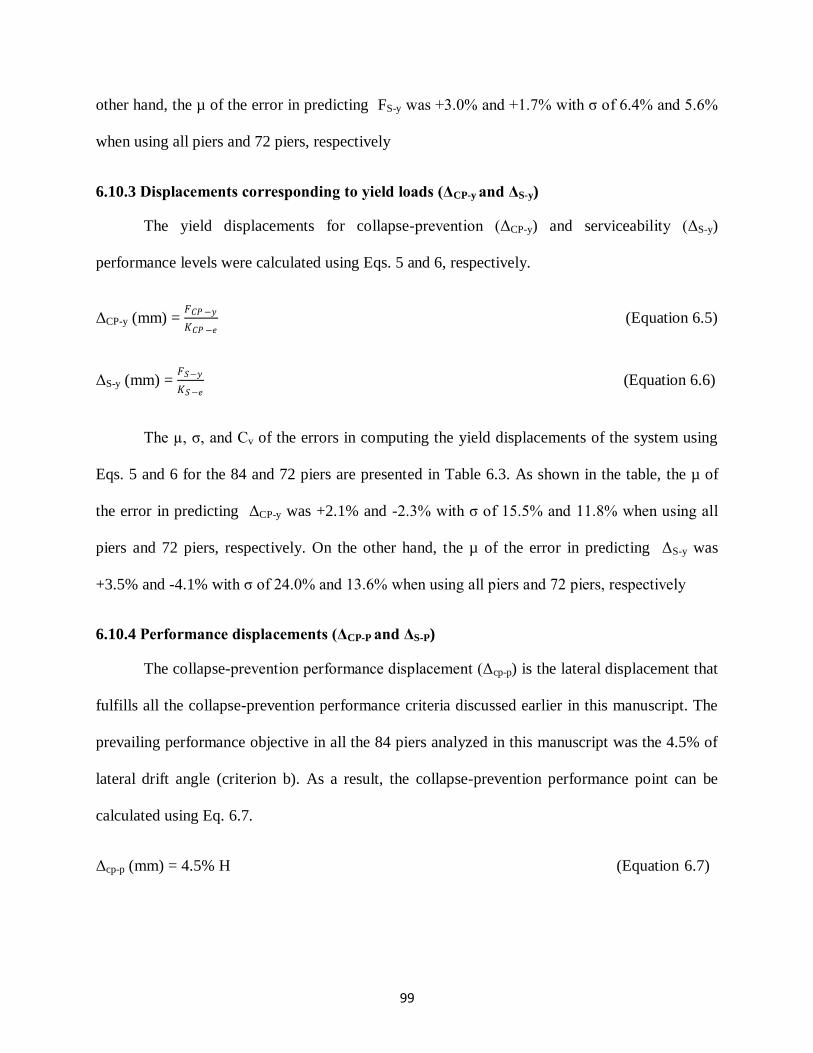
99
other hand, the µ of the error in predicting FS-y was +3.0% and +1.7% with σ of 6.4% and 5.6%
when using all piers and 72 piers, respectively
6.10.3 Displacements corresponding to yield loads (ΔCP-y and ΔS-y)
The yield displacements for collapse-prevention (ΔCP-y) and serviceability (ΔS-y)
performance levels were calculated using Eqs. 5 and 6, respectively.
ΔCP-y (mm) = 𝐹𝐶𝑃 −𝑦
𝐾𝐶𝑃 −𝑒 (Equation 6.5)
ΔS-y (mm) = 𝐹𝑆−𝑦
𝐾𝑆−𝑒 (Equation 6.6)
The µ, σ, and Cv of the errors in computing the yield displacements of the system using
Eqs. 5 and 6 for the 84 and 72 piers are presented in Table 6.3. As shown in the table, the µ of
the error in predicting ΔCP-y was +2.1% and -2.3% with σ of 15.5% and 11.8% when using all
piers and 72 piers, respectively. On the other hand, the µ of the error in predicting ΔS-y was
+3.5% and -4.1% with σ of 24.0% and 13.6% when using all piers and 72 piers, respectively
6.10.4 Performance displacements (ΔCP-P and ΔS-P)
The collapse-prevention performance displacement (Δcp-p) is the lateral displacement that
fulfills all the collapse-prevention performance criteria discussed earlier in this manuscript. The
prevailing performance objective in all the 84 piers analyzed in this manuscript was the 4.5% of
lateral drift angle (criterion b). As a result, the collapse-prevention performance point can be
calculated using Eq. 6.7.
Δcp-p (mm) = 4.5% H (Equation 6.7)

100
The serviceability performance displacement (ΔS-P) is the lateral displacement that fulfills
all the serviceability performance criteria discussed earlier in this manuscript. Criteria “d”
dominated the performance of all the 84 piers; hence, Eq. 6.8 can be used to calculate the the
performance displacement at the serviceability performance level.
ΔS-P (mm) = 2.0% H (Equation 6.8)
6.10.5 Performance loads (FCP-P and FS-P)
The performance loads are the lateral loads corresponding to ΔCP-P and ΔS-P for the
collapse-prevention (FCP-P) and serviceability (FS-P) performance levels, respectively. Fig. 6.6
shows that the performance loads (Fcp-p & FS-p) for each pier analyzed in this manuscript. The
figure shows that the performance loads like the yield loads, are directly proportional to the load
combination imposed on the pier as well as the pier‟s diameter. Also, it is inversely proportional
to the pier‟s height. From the nonlinear regression analysis, Eqs. 9 and 10 were derived for
predicting the collapse-prevention and the serviceability performance loads, respectively.
Fcp-p (kN) = 𝐷3.0𝑃𝑇0.2𝐷𝐿0.1
40 𝐻1.3 (Equation 6.9)
FS-p (kN) = 3 𝐷3.0𝑃𝑇0.3𝐷𝐿0.1
1000 𝐻1.1 (Equation 6.10)

101
(a) (b)
Figure 6.6: The performance load
associated with each specific pier: a)
collapse-prevention, and b) serviceability
performance levels
The errors in predicting FCP-P and FS-P for all specimens using Eqs. 9 and 10 are shown in
Table 6.3. As shown in the table, the µ of the error in predicting FCP-P was +1.6% and -0.1%
with σ of 6.1% and 4.5% when using all piers and 72 piers, respectively. On the other hand, the µ
of the error in predicting FS-P was -0.9% and -5.3% with σ of 13.5% and 6.1% when using all
piers and 72 piers, respectively
6.11 Error in predicting the bilinearized backbone curves
Eqs. 1, 3, 5, 7, and 9 as well as Eqs. 1, 4, 5, 8, and 10 were used to develop empirical
bilinearized backbone curves for the considered 84 piers at collapse-prevention and
serviceability performance levels. To assess the overall accuracy of this empirical approach, the
error in predicting the bilinearized lateral resistance of each pier at each lateral drift angle was
calculated using Eq. 6.1 and plotted in Fig. 6.7. The figures show the error calculated for the 84
piers (thin gray lines) superimposed with the line representing the mean error (continuous black
line) and the lines representing the mean error plus or minus the standard deviation (µ±σ)
(dotted black lines).

102
(a) (b)
Figure 6.7: The lateral drift angle vs. the error in predicting the pier‟s strength: a) collapse-
prevention performance level, and b) serviceability performance level.
In the case of collapse-prevention performance level, the error in predicting the lateral
strength of the piers using the set of empirical equations ranged from -20% to +15%. The figure
shows that, the mean (µ) error in predicting the lateral strength for all the studied piers ranged
from -1.1% to -7.0% for all drift angles. The standard deviation (σ) ranged from 2.8% to 6.4%.
This resulted in a (µ±σ) that ranges from -11.8% to +5.3% and a (µ±2σ) that ranges from -
16.6% to +11.7%. Assuming that the piers represents a normally distributed community, then
68% of the piers have an error in predicting its strength ranging from -11.8% to +5.3% , and
95% of the piers have an error ranging from -16.6% to +11.7%.
In the case of serviceability performance level, the error in predicting the lateral strength
for all piers at all drifts ranged from -23% to +19% with µ ranging from -4.1% to 1.8% and σ
ranging from 6.0% to 9.9%. This resulted in 68% of the piers have an error range (µ±σ) from -
12.5% to 7.8% and 95% of the piers have an error range (µ±2σ) from -22.3% to 17.1% when
using the empirical procedure to calculate its lateral strength.
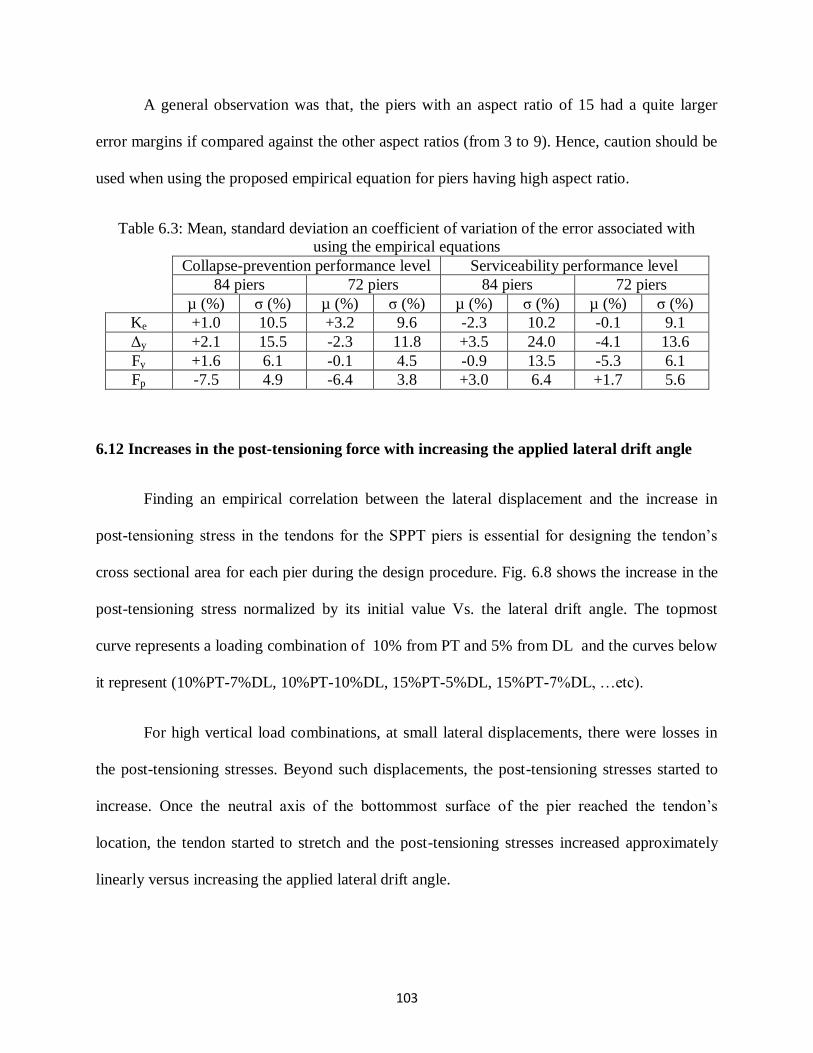
103
A general observation was that, the piers with an aspect ratio of 15 had a quite larger
error margins if compared against the other aspect ratios (from 3 to 9). Hence, caution should be
used when using the proposed empirical equation for piers having high aspect ratio.
Table 6.3: Mean, standard deviation an coefficient of variation of the error associated with
using the empirical equations
Collapse-prevention performance level Serviceability performance level
84 piers 72 piers 84 piers 72 piers
µ (%) σ (%) µ (%) σ (%) µ (%) σ (%) µ (%) σ (%)
Ke +1.0 10.5 +3.2 9.6 -2.3 10.2 -0.1 9.1
Δy +2.1 15.5 -2.3 11.8 +3.5 24.0 -4.1 13.6
Fy +1.6 6.1 -0.1 4.5 -0.9 13.5 -5.3 6.1
Fp -7.5 4.9 -6.4 3.8 +3.0 6.4 +1.7 5.6
6.12 Increases in the post-tensioning force with increasing the applied lateral drift angle
Finding an empirical correlation between the lateral displacement and the increase in
post-tensioning stress in the tendons for the SPPT piers is essential for designing the tendon‟s
cross sectional area for each pier during the design procedure. Fig. 6.8 shows the increase in the
post-tensioning stress normalized by its initial value Vs. the lateral drift angle. The topmost
curve represents a loading combination of 10% from PT and 5% from DL and the curves below
it represent (10%PT-7%DL, 10%PT-10%DL, 15%PT-5%DL, 15%PT-7%DL, …etc).
For high vertical load combinations, at small lateral displacements, there were losses in
the post-tensioning stresses. Beyond such displacements, the post-tensioning stresses started to
increase. Once the neutral axis of the bottommost surface of the pier reached the tendon‟s
location, the tendon started to stretch and the post-tensioning stresses increased approximately
linearly versus increasing the applied lateral drift angle.

104
(a)
(b) (c)
(d) (e)
(f) (g)
Figure 6.8: The relationship between the lateral drift angle (%) vs. the stress in the post-
tensioning tendon‟s normalized by its initial stress for piers; a) H1830-D0610; b) H3660-D1220;
c) H3660-D0610; d) H5490-D1220; e)H5490-D0610; f)H9144-D1220; and g)H9144-D0610

105
For piers subjected to relatively small vertical load combinations. The piers behaved
more as a rigid block. For small lateral displacements, the post-tensioning force was
approximately constant. Once the opening at the interface joint between the pier and the
foundation reached the location of the tendon the post-tensioning force increased approximately
linear with increasing the lateral displacement. It is worth noting that the same behavior was
observed by Yamashita and Sanders (2009) for segmental post-tensioned hollow core piers.
The different graphs presented in Fig. 6.8, shows that the rate of stress increase is directly
proportional to the stress induced by the post-tensioning stress on the concrete. On the other
hand, the stress induced on the concrete by the applied gravity load does not seem to
significantly affect that slope. For piers with the same height, those with smaller diameters have
much milder rate of increase of the post-tensioning stress. For piers with the same diameter,
increasing the height decreases the post-tensioning stress rate of increase. Upon these
observations, a nonlinear regression analysis was carried out and resulted in Eq. 6.11 that
represents the stress in the post-tensioning tendons as a function of lateral drift angles.
𝜎 𝑃𝑇 = σ𝑖 ∶ 𝛥 ≤ 𝛥0
σ𝑖 1 + 104𝐷0.78
𝑃𝑇1.4𝐻2 𝛥 − 𝛥0 ∶ 𝛥 > 𝛥0
(Equation 6.11)
Where, Δ is the lateral displacement of the pier (mm); σPT is the final stress in the post-
tensioning tendon at a lateral displacement Δ; σi is the effective post-tensioning stress in the
tendon before subjecting the pier to lateral loading; Δ0 is the lateral displacement (mm) at which
the post-tensioning stress in the tendon starts to increase (Eq. 6.12).
𝛥0(mm) = 𝐻1.9𝑃𝑇1.7𝐷𝐿0.6
105 𝐷0.9 (Equation 6.12)
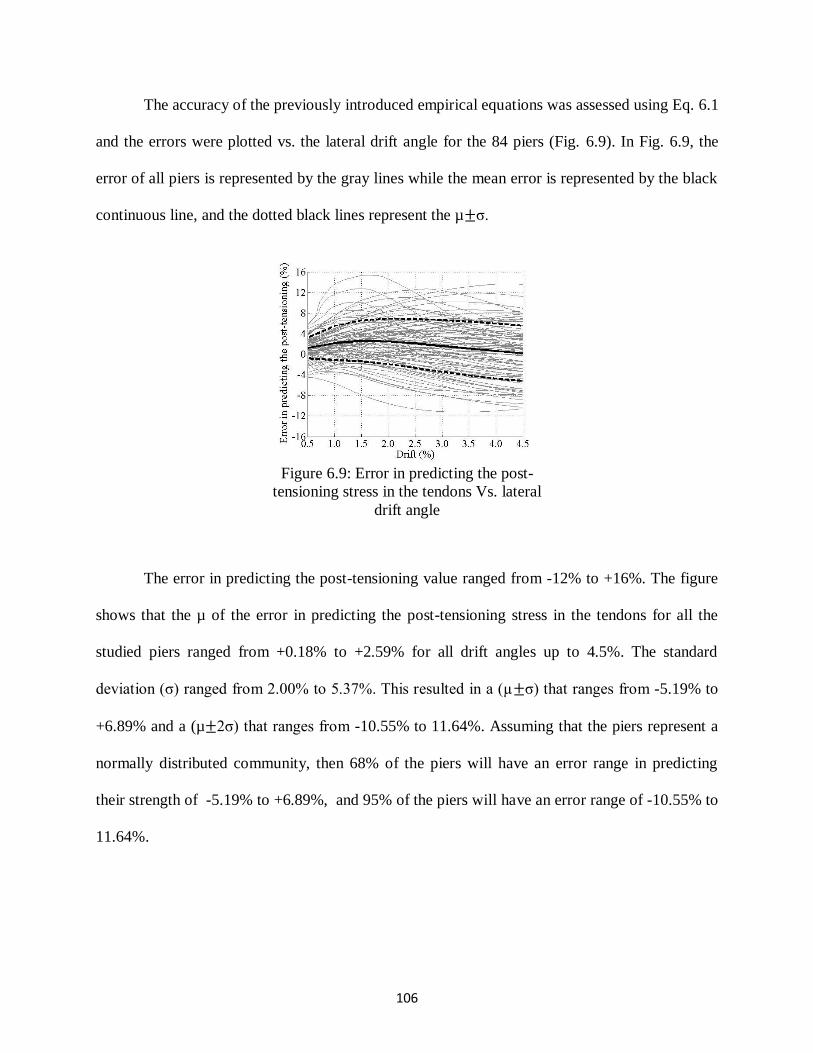
106
The accuracy of the previously introduced empirical equations was assessed using Eq. 6.1
and the errors were plotted vs. the lateral drift angle for the 84 piers (Fig. 6.9). In Fig. 6.9, the
error of all piers is represented by the gray lines while the mean error is represented by the black
continuous line, and the dotted black lines represent the µ±σ.
Figure 6.9: Error in predicting the post-
tensioning stress in the tendons Vs. lateral
drift angle
The error in predicting the post-tensioning value ranged from -12% to +16%. The figure
shows that the µ of the error in predicting the post-tensioning stress in the tendons for all the
studied piers ranged from +0.18% to +2.59% for all drift angles up to 4.5%. The standard
deviation (σ) ranged from 2.00% to 5.37%. This resulted in a (µ±σ) that ranges from -5.19% to
+6.89% and a (µ±2σ) that ranges from -10.55% to 11.64%. Assuming that the piers represent a
normally distributed community, then 68% of the piers will have an error range in predicting
their strength of -5.19% to +6.89%, and 95% of the piers will have an error range of -10.55% to
11.64%.

107
6.13 Design Procedure
Fig. 6.10 shows a flow chart diagram of the proposed design procedure for the SPPT
piers. The procedure can be summarized in the following steps:
1) Two uniform hazard acceleration spectra (period vs. spectral acceleration) are obtained
according to the location of the bridge.
2) The two uniform hazard spectra (5% damping) are then converted into uniform hazard
displacement spectra (period vs. spectral displacement) using Eq. 6.13 (e.g. Priestley et al. 2007),
Sd(T)= 𝑇2
4𝜋2 Sa(T) (Equation 6.13)
Where T is the period of the structure in seconds; Sd(T) is the spectral displacement at a period of
T seconds; and Sa(T) is the spectral acceleration at a period T.
3) Given the height of the pier, the performance lateral displacements for the two
performance levels (ΔCP-P) and (ΔS-P) can be calculated using Eqs. 5 and 6, respectively;
4) The uniform hazard displacement spectra (step 2), along with ΔCP-P and ΔS-P, are used
to obtain the target periods of the pier at the collapse-prevention (TCP-P) and serviceability (TS-P)
performance levels (Fig. 6.11).
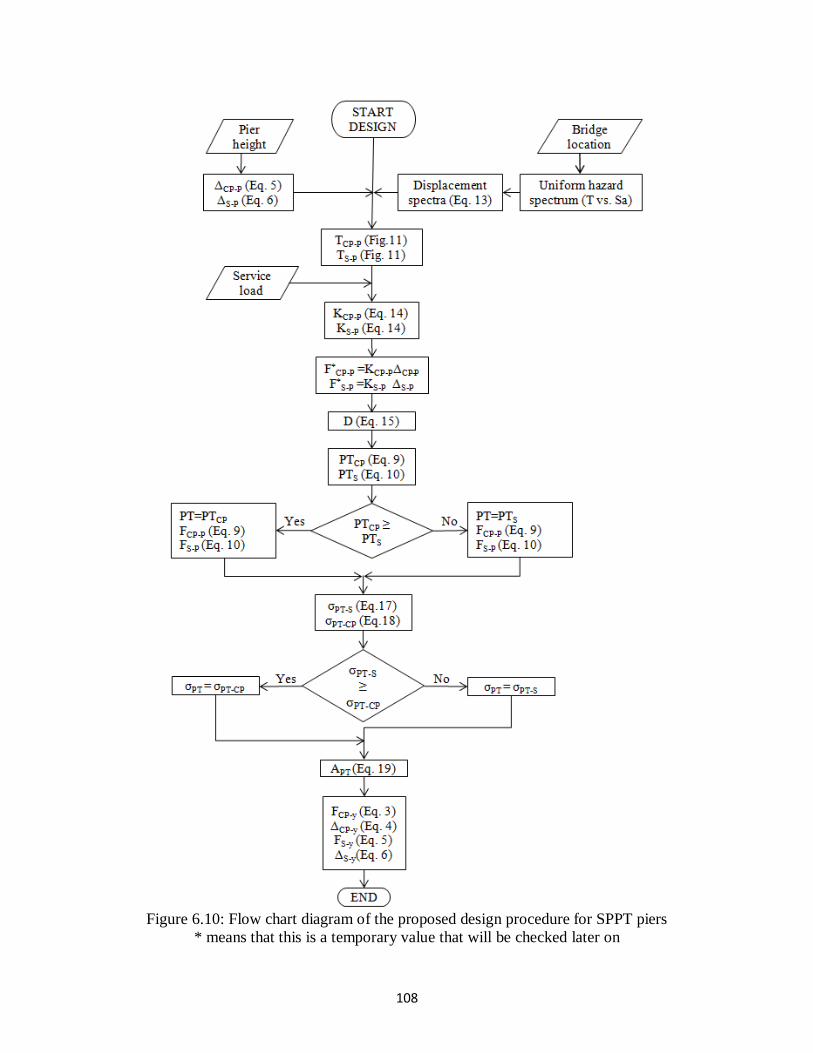
108
Figure 6.10: Flow chart diagram of the proposed design procedure for SPPT piers
* means that this is a temporary value that will be checked later on
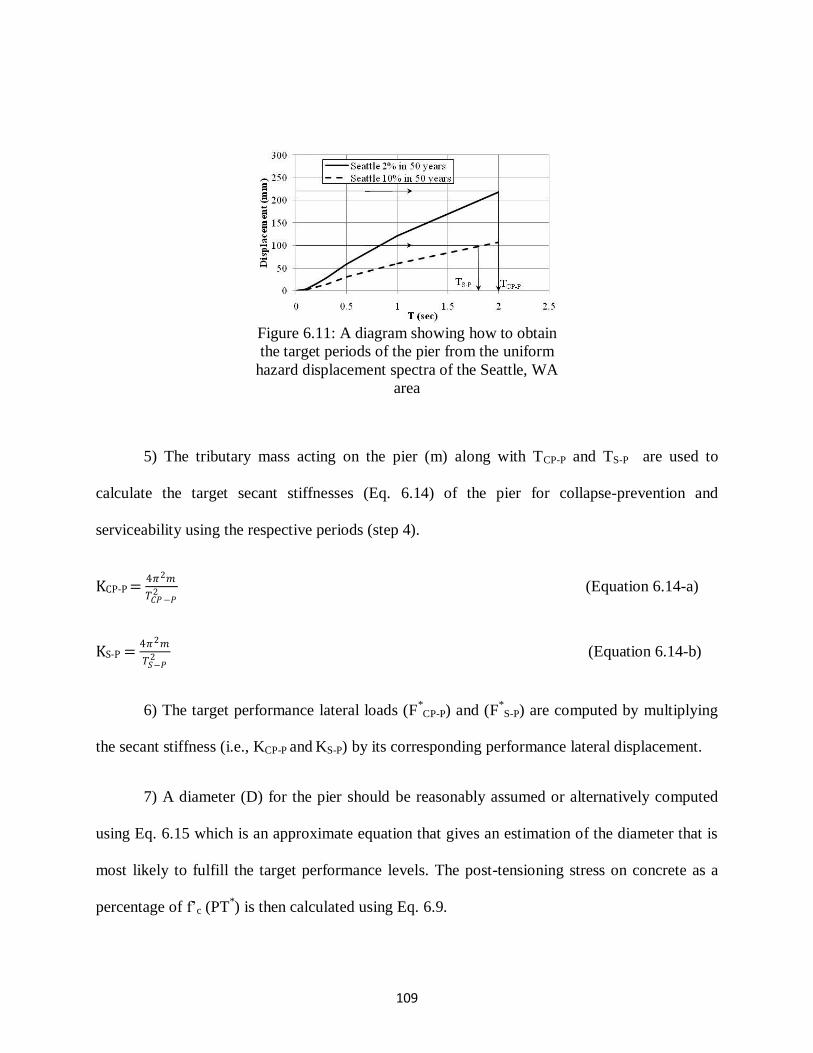
109
Figure 6.11: A diagram showing how to obtain
the target periods of the pier from the uniform
hazard displacement spectra of the Seattle, WA
area
5) The tributary mass acting on the pier (m) along with TCP-P and TS-P are used to
calculate the target secant stiffnesses (Eq. 6.14) of the pier for collapse-prevention and
serviceability using the respective periods (step 4).
KCP-P = 4𝜋2𝑚
𝑇𝐶𝑃−𝑃2 (Equation 6.14-a)
KS-P = 4𝜋2𝑚
𝑇𝑆−𝑃2 (Equation 6.14-b)
6) The target performance lateral loads (F*CP-P) and (F
*S-P) are computed by multiplying
the secant stiffness (i.e., KCP-P and KS-P) by its corresponding performance lateral displacement.
7) A diameter (D) for the pier should be reasonably assumed or alternatively computed
using Eq. 6.15 which is an approximate equation that gives an estimation of the diameter that is
most likely to fulfill the target performance levels. The post-tensioning stress on concrete as a
percentage of f‟c (PT*) is then calculated using Eq. 6.9.
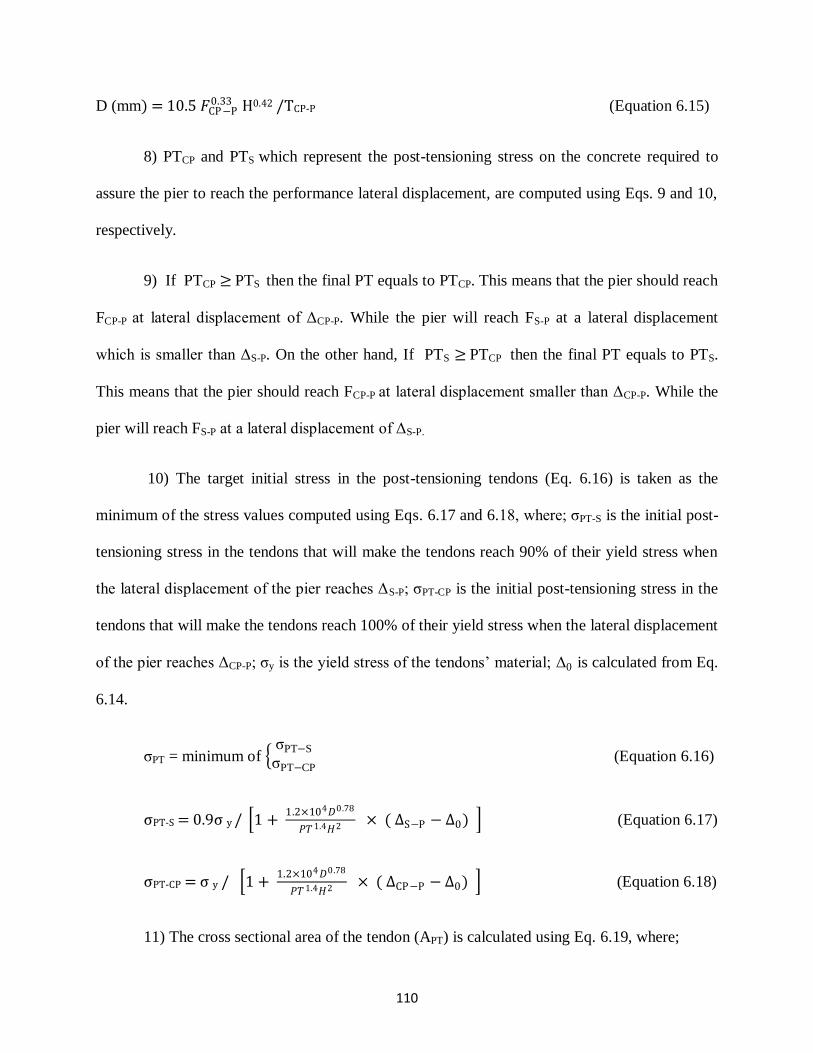
110
D (mm) = 10.5 𝐹CP−P0.33 H0.42 /TCP-P (Equation 6.15)
8) PTCP and PTS which represent the post-tensioning stress on the concrete required to
assure the pier to reach the performance lateral displacement, are computed using Eqs. 9 and 10,
respectively.
9) If PTCP ≥ PTS then the final PT equals to PTCP. This means that the pier should reach
FCP-P at lateral displacement of ΔCP-P. While the pier will reach FS-P at a lateral displacement
which is smaller than ΔS-P. On the other hand, If PTS ≥ PTCP then the final PT equals to PTS.
This means that the pier should reach FCP-P at lateral displacement smaller than ΔCP-P. While the
pier will reach FS-P at a lateral displacement of ΔS-P.
10) The target initial stress in the post-tensioning tendons (Eq. 6.16) is taken as the
minimum of the stress values computed using Eqs. 6.17 and 6.18, where; σPT-S is the initial post-
tensioning stress in the tendons that will make the tendons reach 90% of their yield stress when
the lateral displacement of the pier reaches ΔS-P; σPT-CP is the initial post-tensioning stress in the
tendons that will make the tendons reach 100% of their yield stress when the lateral displacement
of the pier reaches ΔCP-P; σy is the yield stress of the tendons‟ material; Δ0 is calculated from Eq.
6.14.
σPT = minimum of σPT−S
σPT−CP
(Equation 6.16)
σPT-S = 0.9σ y / 1 + 1.2×10⁴𝐷0.78
𝑃𝑇1.4𝐻2 × ( ΔS−P − Δ0) (Equation 6.17)
σPT-CP = σ y / 1 + 1.2×10⁴𝐷0.78
𝑃𝑇1.4𝐻2 × ( ΔCP−P − Δ0) (Equation 6.18)
11) The cross sectional area of the tendon (APT) is calculated using Eq. 6.19, where;

111
APT = 𝜋𝐷2×𝑃𝑇×𝑓𝑐
′
4 𝜎𝑃𝑇 (Equation 6.19)
12) If required, FCP-y, FS-y, ΔCP-y, and ΔS-y are computed using Eqs. 3, 4, 5, and 6,
respectively.
6.14 Findings and Conclusions
This manuscript presents a design procedure for segmental precast post-tensioned
concrete filled fiber reinforced polymer tubes (CFFT). The piers consisted of a single precast
segment sandwiched between the foundation and the superstructure with an unbonded post-
tensioning tendon passing through ducts located in the centroid of the segment. A series of 84
piers having different design parameters were analyzed using a finite element model. Criteria for
two performance levels for the SPPT pier system were proposed. A set of empirical equations,
capable of predicting the bilinearized backbone curve of the piers, had been developed using the
results of the FE models of 84 piers. Those empirical equations had been arranged to form a
design procedure for the SPPT pier system to fulfill the two performance levels. The analyses
conducted in this manuscript revealed that:
The developed empirical equations were able to predict the bilinearized backbone curve of
the SPPT piers with good accuracy.
The yield and performance lateral loads were found to be inversely proportional to the pier‟s
height and directly proportional to the piers diameters, stress induced on the concrete from
the post-tensioning load and the external bridge gravity load.
Within the scope of the investigated parameters, the performance of the piers was governed
by the preset lateral drift angles of 4.5% and 2.0% for collapse-prevention and serviceability
performance levels with no yielding in the tendons or crushing in the concrete.

112
The developed empirical equations to predict the lateral displacement vs. change in post-
tensioning stresses were able to capture the behavior of the tendons. The rate of increase in
post-tensioning stress was found to be directly proportional to the diameter of the pier and
inversely proportional to the pier‟s height and the post-tensioning stress on the concrete. On
the other hand, the displacement at which the increase in post-tensioning stress start was
inversely proportional to the pier‟s diameter and directly proportional to the pier‟s height,
post-tensioning and serviceability axial load stress acting on the pier.
The presented set of design equations represents the first design procedure for SPPT piers having
concrete filled fiber tubes segments that can be elaborated in the future. The design methodology
was developed based on the data collected from 84 piers with different design parameters
including the dimensions and the load combinations that acts on the pier. However, other
parameters such as different distribution of post-tensioning tendons, f‟c of the concrete and
confinement properties should be taken into consideration in future studies. Also, while the FE
model was validated against three sets of experimental data (Dawood et al. 2010(a), ElGawady
and Dawood 2010, and Dawood 2010), the FE model and equations were not validated against
dynamic tests. However, no such data is available in the literature yet.
6.15 References
ABAQUS Software and Documentation, Version 6.8-2. © Dassault Systèmes, SIMULIA,
2008.
Beque, J., Patnaik, A. K., and Rizkalla, S., (2003), “Analytical models for concrete confined
with FRP tubes” J. Composites for Construction, ASCE, 7(1), 31-38.
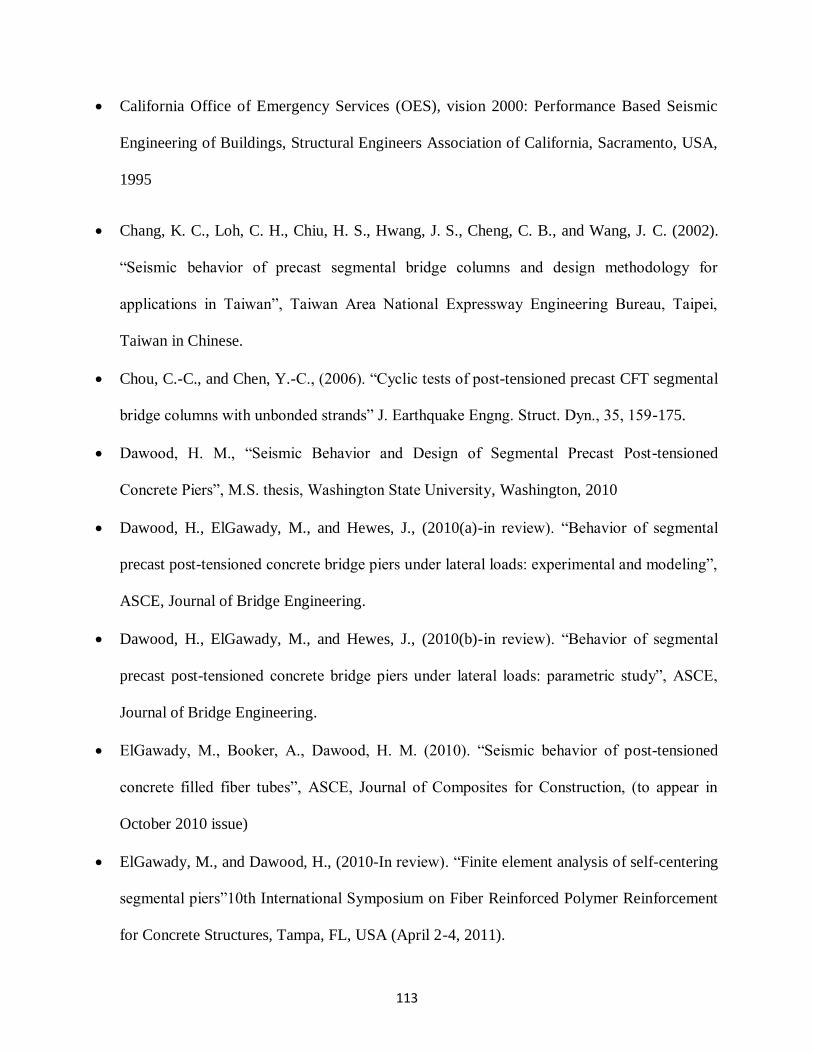
113
California Office of Emergency Services (OES), vision 2000: Performance Based Seismic
Engineering of Buildings, Structural Engineers Association of California, Sacramento, USA,
1995
Chang, K. C., Loh, C. H., Chiu, H. S., Hwang, J. S., Cheng, C. B., and Wang, J. C. (2002).
“Seismic behavior of precast segmental bridge columns and design methodology for
applications in Taiwan”, Taiwan Area National Expressway Engineering Bureau, Taipei,
Taiwan in Chinese.
Chou, C.-C., and Chen, Y.-C., (2006). “Cyclic tests of post-tensioned precast CFT segmental
bridge columns with unbonded strands” J. Earthquake Engng. Struct. Dyn., 35, 159-175.
Dawood, H. M., “Seismic Behavior and Design of Segmental Precast Post-tensioned
Concrete Piers”, M.S. thesis, Washington State University, Washington, 2010
Dawood, H., ElGawady, M., and Hewes, J., (2010(a)-in review). “Behavior of segmental
precast post-tensioned concrete bridge piers under lateral loads: experimental and modeling”,
ASCE, Journal of Bridge Engineering.
Dawood, H., ElGawady, M., and Hewes, J., (2010(b)-in review). “Behavior of segmental
precast post-tensioned concrete bridge piers under lateral loads: parametric study”, ASCE,
Journal of Bridge Engineering.
ElGawady, M., Booker, A., Dawood, H. M. (2010). “Seismic behavior of post-tensioned
concrete filled fiber tubes”, ASCE, Journal of Composites for Construction, (to appear in
October 2010 issue)
ElGawady, M., and Dawood, H., (2010-In review). “Finite element analysis of self-centering
segmental piers”10th International Symposium on Fiber Reinforced Polymer Reinforcement
for Concrete Structures, Tampa, FL, USA (April 2-4, 2011).

114
ElGawady, M. A., Shaalan A., and Dawood, H. M. (2010). “Seismic behavior of precast
post-tensioned segmented frames”, 9th U.S. National and 10th Canadian Conference on
Earthquake Engineering (July 25-29, 2010).
ElGawady, M., and Shaalan, A., (2010- in review). “Seismic behavior of self-centering
bridge bents”, ASCE, Journal of Bridge Engineering.
Fam, A. Z., and Rizkalla, S. H., (2001), “Confinement model for axially loaded concrete
confined by circular fiber-reinforced polymer tubes” ACI Str. J., 98 (4), 451-461.
FEMA 356 (2000). "Prestandard and Commentary for the Seismic Rehabilitation of
Buildings". Federal Emergency Management Agency. Washington, District of Columbia.
Hewes, J. T., and Priestley N. (2002). “Seismic design and performance of precast concrete
segmental bridge columns.” Report No. SSRP-2001/25, Univ. of California at San Diego.
Kurama, Y. C. (1997). “Seismic analysis, behavior, and design of unbonded post-tensioned
precast concrete walls.” PhD dissertation, Dept. of Civil and Environmental Engineering,
Lehigh University, Bethlehem, Pa.
Kwan,W.-P., and Billington, S. L. (2003). „„Unbonded posttensioned concrete bridge piers. I:
Monotonic and cyclic analyses.‟‟ J. Bridge Eng.,8(2), 92–101.
Lee, WK and Billington, SL (2010) “Residual Displacement Prediction for Structural
Concrete Columns under Earthquake Loading,” ASCE J. Bridge Engineering, 15(3): 240-
249.
Lee, J., and G. L. Fenves, (1998) “Plastic-Damage Model for Cyclic Loading of Concrete
Structures,” Journal of Engineering Mechanics, vol. 124, no.8, pp. 892–900.
Lubliner, J., J. Oliver, S. Oller, and E. Oñate, (1989) “A Plastic-Damage Model for
Concrete,” International Journal of Solids and Structures, vol. 25, pp. 299–329.
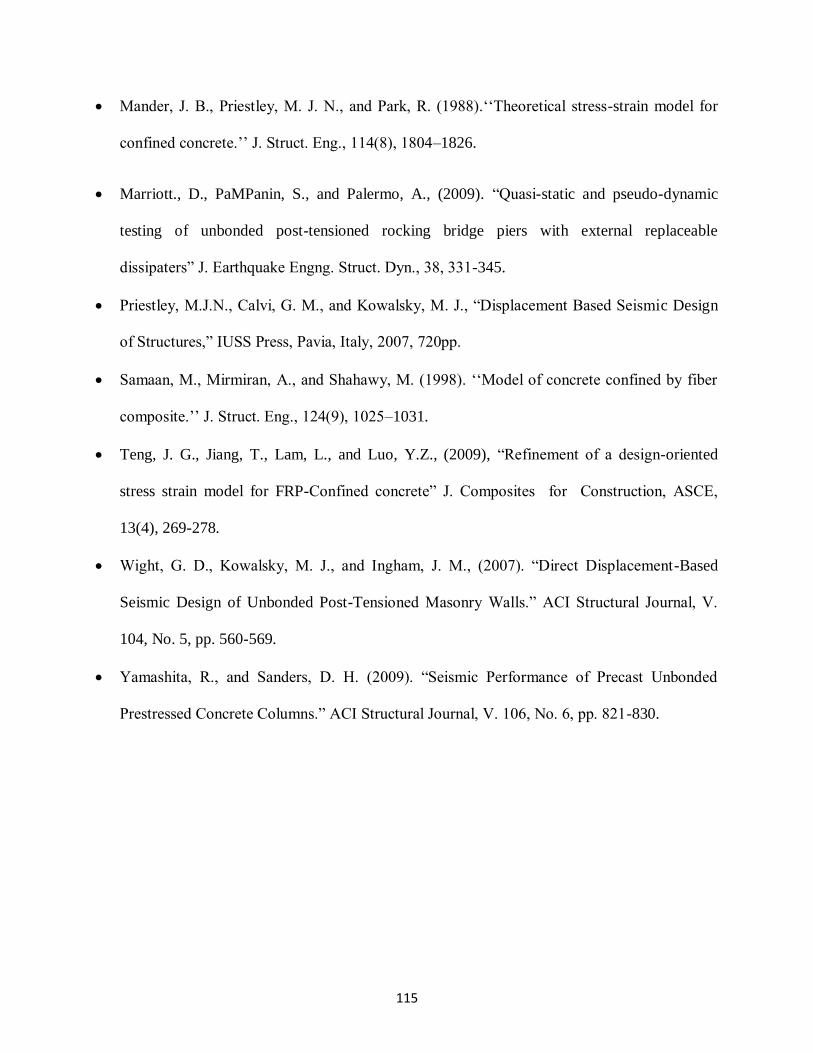
115
Mander, J. B., Priestley, M. J. N., and Park, R. (1988).„„Theoretical stress-strain model for
confined concrete.‟‟ J. Struct. Eng., 114(8), 1804–1826.
Marriott., D., PaMPanin, S., and Palermo, A., (2009). “Quasi-static and pseudo-dynamic
testing of unbonded post-tensioned rocking bridge piers with external replaceable
dissipaters” J. Earthquake Engng. Struct. Dyn., 38, 331-345.
Priestley, M.J.N., Calvi, G. M., and Kowalsky, M. J., “Displacement Based Seismic Design
of Structures,” IUSS Press, Pavia, Italy, 2007, 720pp.
Samaan, M., Mirmiran, A., and Shahawy, M. (1998). „„Model of concrete confined by fiber
composite.‟‟ J. Struct. Eng., 124(9), 1025–1031.
Teng, J. G., Jiang, T., Lam, L., and Luo, Y.Z., (2009), “Refinement of a design-oriented
stress strain model for FRP-Confined concrete” J. Composites for Construction, ASCE,
13(4), 269-278.
Wight, G. D., Kowalsky, M. J., and Ingham, J. M., (2007). “Direct Displacement-Based
Seismic Design of Unbonded Post-Tensioned Masonry Walls.” ACI Structural Journal, V.
104, No. 5, pp. 560-569.
Yamashita, R., and Sanders, D. H. (2009). “Seismic Performance of Precast Unbonded
Prestressed Concrete Columns.” ACI Structural Journal, V. 106, No. 6, pp. 821-830.

116
APPENDIX
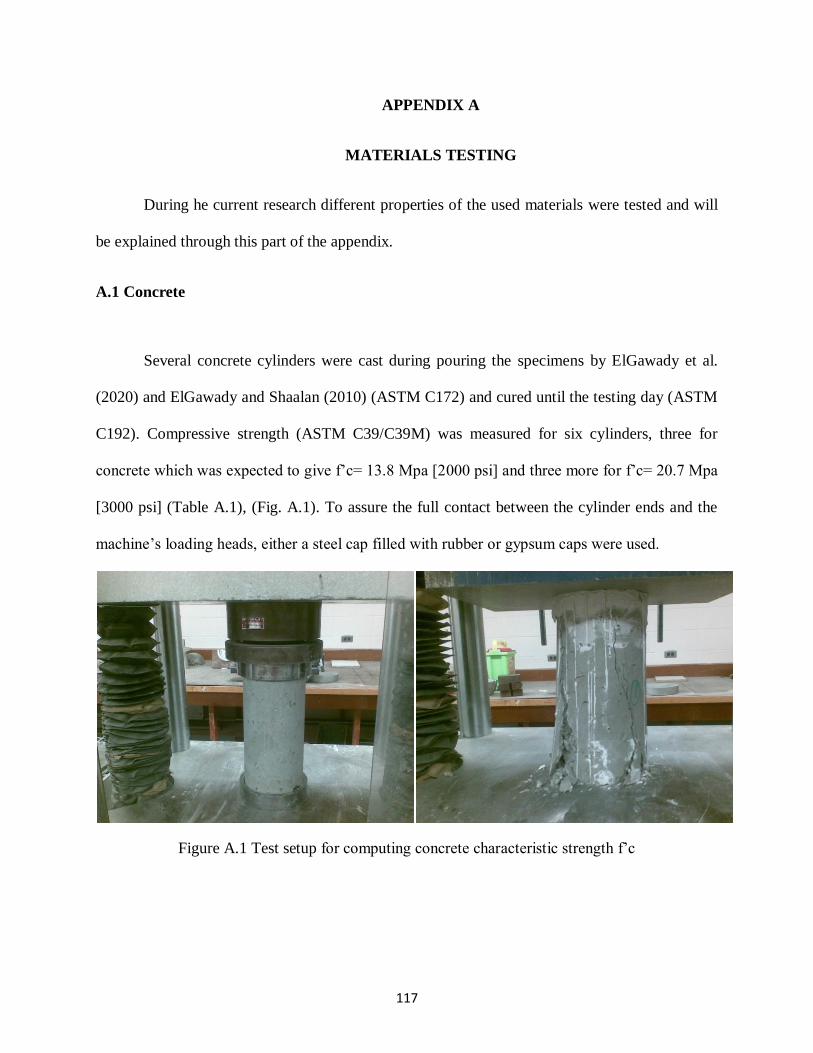
117
APPENDIX A
MATERIALS TESTING
During he current research different properties of the used materials were tested and will
be explained through this part of the appendix.
A.1 Concrete
Several concrete cylinders were cast during pouring the specimens by ElGawady et al.
(2020) and ElGawady and Shaalan (2010) (ASTM C172) and cured until the testing day (ASTM
C192). Compressive strength (ASTM C39/C39M) was measured for six cylinders, three for
concrete which was expected to give f‟c= 13.8 Mpa [2000 psi] and three more for f‟c= 20.7 Mpa
[3000 psi] (Table A.1), (Fig. A.1). To assure the full contact between the cylinder ends and the
machine‟s loading heads, either a steel cap filled with rubber or gypsum caps were used.
Figure A.1 Test setup for computing concrete characteristic strength f‟c
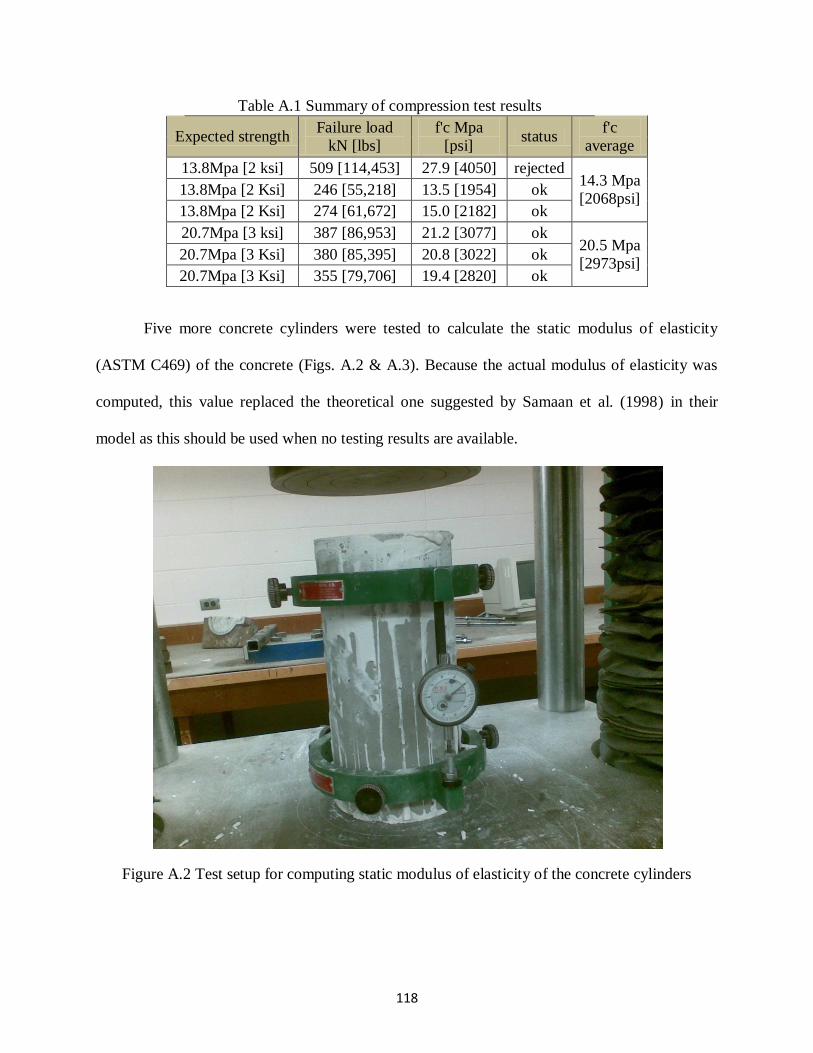
118
Table A.1 Summary of compression test results
Expected strength Failure load
kN [lbs]
f'c Mpa
[psi] status
f'c
average
13.8Mpa [2 ksi] 509 [114,453] 27.9 [4050] rejected 14.3 Mpa
[2068psi] 13.8Mpa [2 Ksi] 246 [55,218] 13.5 [1954] ok
13.8Mpa [2 Ksi] 274 [61,672] 15.0 [2182] ok
20.7Mpa [3 ksi] 387 [86,953] 21.2 [3077] ok 20.5 Mpa
[2973psi] 20.7Mpa [3 Ksi] 380 [85,395] 20.8 [3022] ok
20.7Mpa [3 Ksi] 355 [79,706] 19.4 [2820] ok
Five more concrete cylinders were tested to calculate the static modulus of elasticity
(ASTM C469) of the concrete (Figs. A.2 & A.3). Because the actual modulus of elasticity was
computed, this value replaced the theoretical one suggested by Samaan et al. (1998) in their
model as this should be used when no testing results are available.
Figure A.2 Test setup for computing static modulus of elasticity of the concrete cylinders

119
Figure A.3 Stress strain curves from the cylinders tests along with the equations of the trend lines
For information about testing results of the concrete cylinders of the concrete used in the
piers studied in chapters (3) and (4) refer to Hewes (2002).
A.2 Post-tensioning bars
The stress-strain curve used in chapter (5) of this manuscript is supplied by a certified test
report provided by the DYWIYDAG Company which was done by North Star Steel Minnesota
on 02/11/2003 (Fig. A.4). The post-tensioning bars in chapters (3 and 4) were used as reported
by Hewes (2002).
y = 1,975,352x + 27
0
200
400
600
800
1000
1200
0 0.0002 0.0004 0.0006
Str
ess(
psi
)
Strain (in/in)
f'c= 2000 psi
y = 2,167,030x + 21
0
200
400
600
800
1000
1200
0 0.0002 0.0004 0.0006
Str
ess(
psi
)
Strain (in/in)
f'c= 3000 psi

120
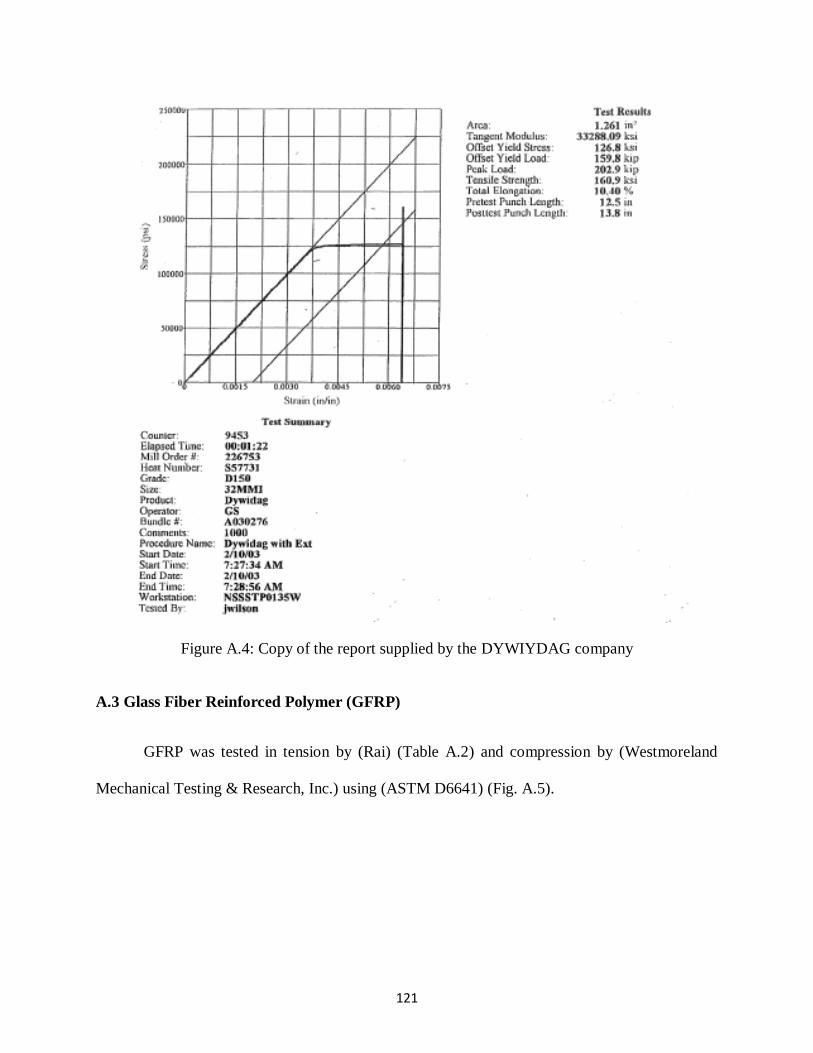
121
Figure A.4: Copy of the report supplied by the DYWIYDAG company
A.3 Glass Fiber Reinforced Polymer (GFRP)
GFRP was tested in tension by (Rai) (Table A.2) and compression by (Westmoreland
Mechanical Testing & Research, Inc.) using (ASTM D6641) (Fig. A.5).
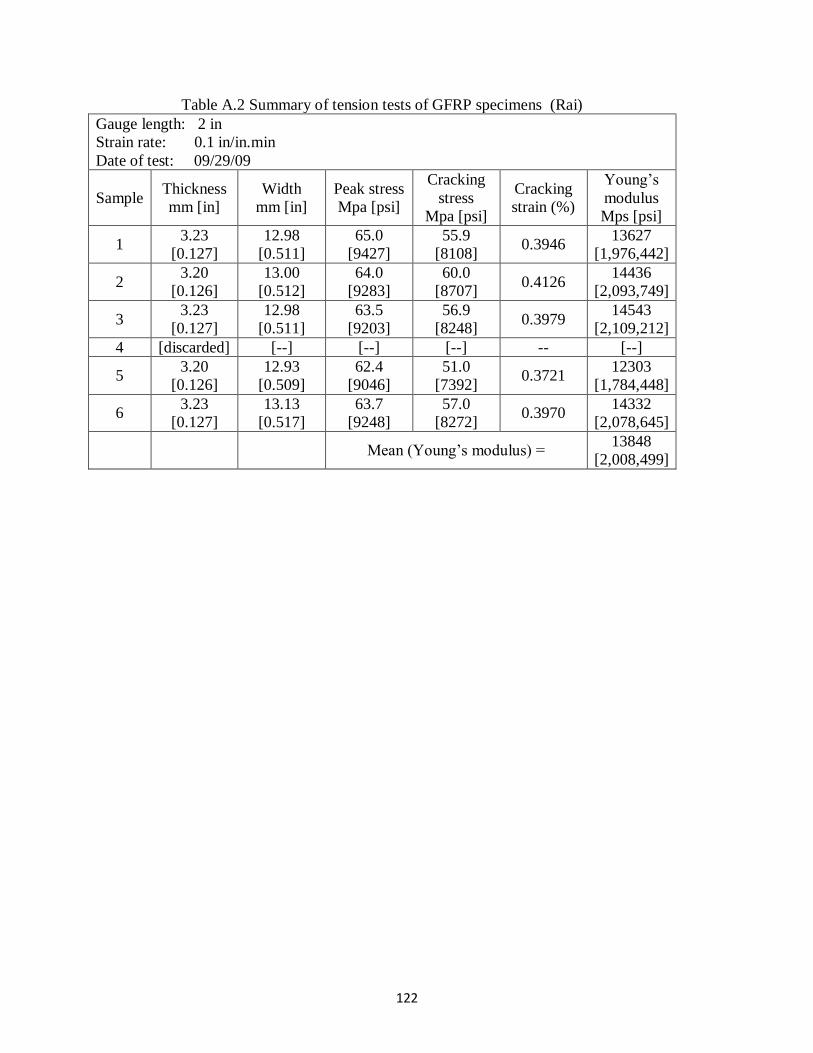
122
Table A.2 Summary of tension tests of GFRP specimens (Rai)
Gauge length: 2 in
Strain rate: 0.1 in/in.min
Date of test: 09/29/09
Sample Thickness
mm [in]
Width
mm [in]
Peak stress
Mpa [psi]
Cracking
stress
Mpa [psi]
Cracking
strain (%)
Young‟s
modulus
Mps [psi]
1 3.23
[0.127]
12.98
[0.511]
65.0
[9427]
55.9
[8108] 0.3946
13627
[1,976,442]
2 3.20
[0.126]
13.00
[0.512]
64.0
[9283]
60.0
[8707] 0.4126
14436
[2,093,749]
3 3.23
[0.127]
12.98
[0.511]
63.5
[9203]
56.9
[8248] 0.3979
14543
[2,109,212]
4 [discarded] [--] [--] [--] -- [--]
5 3.20
[0.126]
12.93
[0.509]
62.4
[9046]
51.0
[7392] 0.3721
12303
[1,784,448]
6 3.23
[0.127]
13.13
[0.517]
63.7
[9248]
57.0
[8272] 0.3970
14332
[2,078,645]
Mean (Young‟s modulus) = 13848
[2,008,499]

123

124
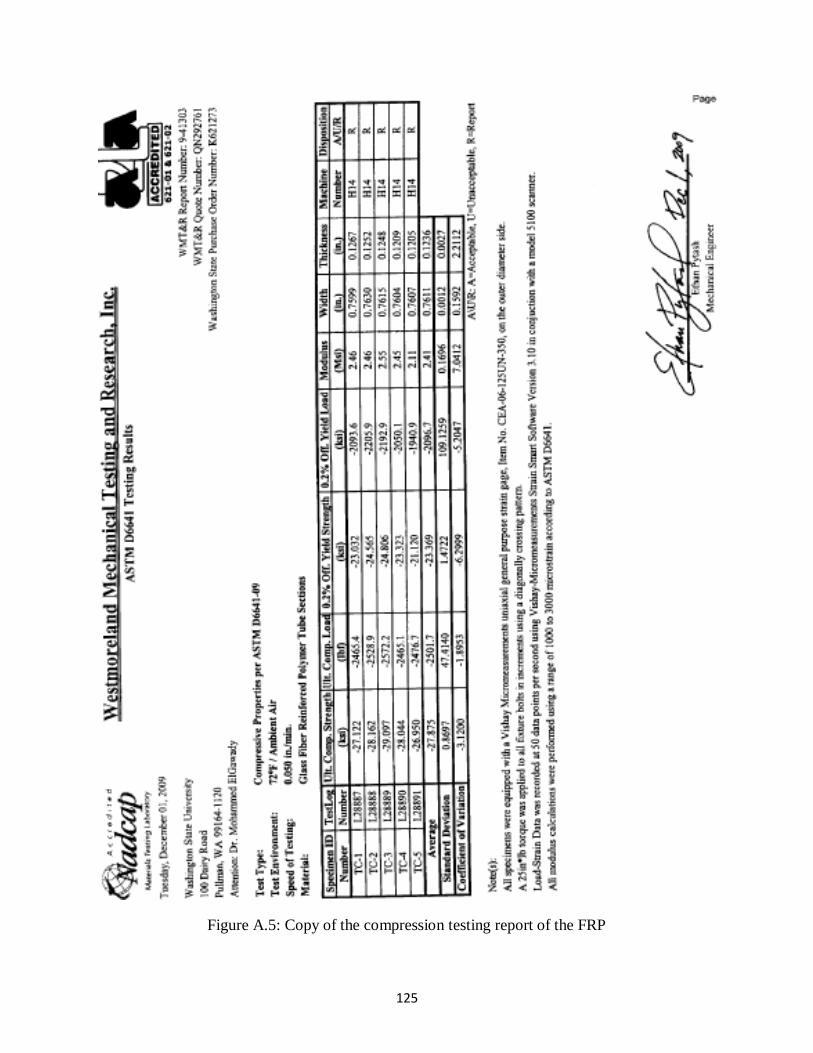
125
Figure A.5: Copy of the compression testing report of the FRP
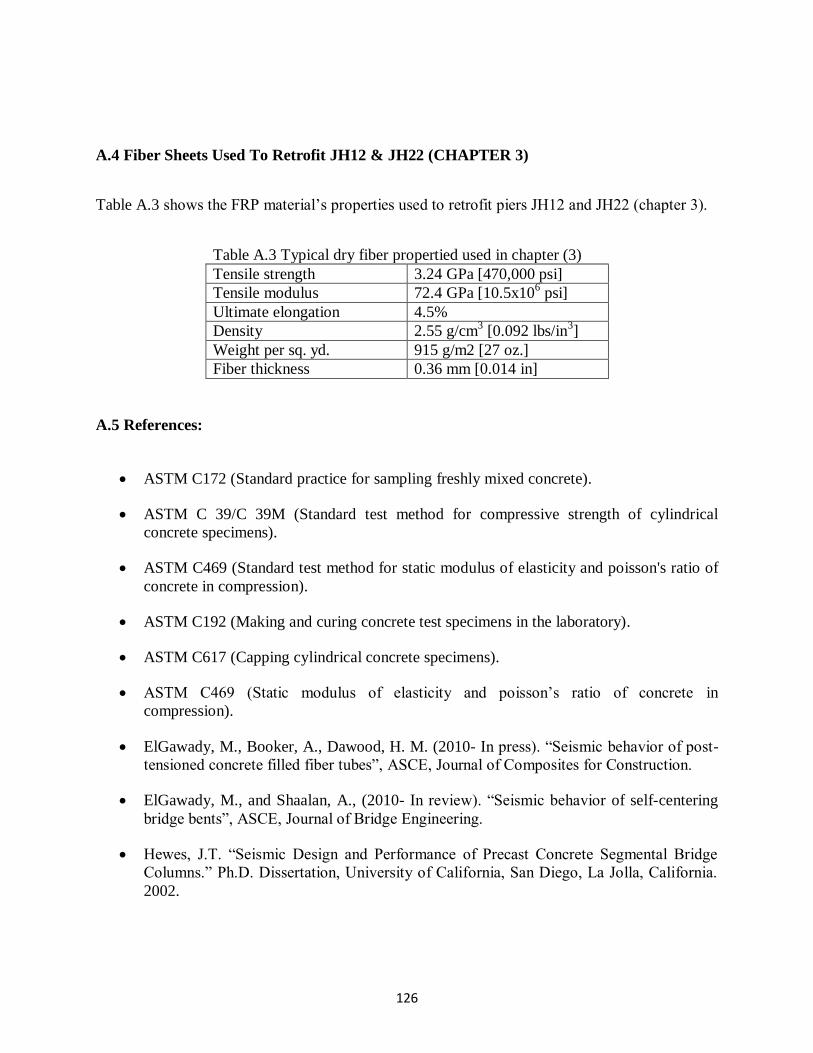
126
A.4 Fiber Sheets Used To Retrofit JH12 & JH22 (CHAPTER 3)
Table A.3 shows the FRP material‟s properties used to retrofit piers JH12 and JH22 (chapter 3).
Table A.3 Typical dry fiber propertied used in chapter (3)
Tensile strength 3.24 GPa [470,000 psi]
Tensile modulus 72.4 GPa [10.5x10⁶ psi]
Ultimate elongation 4.5%
Density 2.55 g/cm3 [0.092 lbs/in
3]
Weight per sq. yd. 915 g/m2 [27 oz.]
Fiber thickness 0.36 mm [0.014 in]
A.5 References:
ASTM C172 (Standard practice for sampling freshly mixed concrete).
ASTM C 39/C 39M (Standard test method for compressive strength of cylindrical
concrete specimens).
ASTM C469 (Standard test method for static modulus of elasticity and poisson's ratio of
concrete in compression).
ASTM C192 (Making and curing concrete test specimens in the laboratory).
ASTM C617 (Capping cylindrical concrete specimens).
ASTM C469 (Static modulus of elasticity and poisson‟s ratio of concrete in
compression).
ElGawady, M., Booker, A., Dawood, H. M. (2010- In press). “Seismic behavior of post-
tensioned concrete filled fiber tubes”, ASCE, Journal of Composites for Construction.
ElGawady, M., and Shaalan, A., (2010- In review). “Seismic behavior of self-centering
bridge bents”, ASCE, Journal of Bridge Engineering.
Hewes, J.T. “Seismic Design and Performance of Precast Concrete Segmental Bridge
Columns.” Ph.D. Dissertation, University of California, San Diego, La Jolla, California.
2002.