Embed Size (px)
Citation preview

Jim Davis
Jeff Metersky
CHAINalytics
Segmentation in Demand Planning for Enhanced Forecast Accuracy

Jim Davis, CPIM
Director, Demand Planning & Customer Service at Colgate-Palmolive (Global Customer Service & Logistics)
Jim currently serves as Director of Demand Planning and Customer Service at Colgate-Palmolive. Jim has more than 34 years of supply chain experience at Colgate including manufacturing, planning, customer service and logistics. Prior to joining Colgate’s global supply chain team, he lead the US Customer Service and Logistics organization.
His current responsibilities include global process ownership for demand planning and customer supply chain collaboration.
Jim holds a Bachelor of Science in Industrial Engineering from Lehigh University and an MBA in Operations Management from Fairleigh Dickinson University.

Jeff Metersky
Vice President, S&OP Practice Chainalytics
Jeff is a co-founder of Chainalytics and Vice President of the Sales & Operations Planning Practice. His global consulting experience – which spans more than 100 clients across a variety of industries – is focused on supply chain design and analysis, inventory strategy and optimization, demand planning, and cost-to-serve analytics.
Jeff has authored multiple articles and is frequently cited by leading industry publications and analysts. In 2006, Jeff was recognized as a “Pro to Know” by Supply & Demand Chain Executive.
Jeff holds a Bachelor of Science in Industrial Engineering from The University of Illinois and a Master of Business Administration in Materials and Logistics Management from Michigan State University.

Applying Segmentation to Evaluating Forecast Accuracy

Forecasts Drive the Majority of Demand & Supply Planning Decisions in Most Manufacturers
Product Flow
Forecasts
Of
Product
SalesOrders
to
Suppliers,
& forecasts
of orders
Deployments
To Field
Distribution
Centers
Production
Schedules
Production
Plans
&
• Financial Planning typically uses aggregated forecasts
• Demand Planning relies on a mix of aggregate and SKU-specific
forecasts
• Supply Chain management mostly uses quite detailed forecasts:
o SKU / Shipping location / day or week
Customer
orders
Inventory
& POS
Data
VMI service of
Retailer DC’s
&
DSD service
to stores
Plant ship to
Retailer DC’s
Financial Planning
Marketing and Promotion Planning
Production Staff
Planning
Outbound
Trans
Planning
DC Staff
Planning

Improving Item-Location Forecast Accuracy Drives Operational Efficiency
Company
Channels
Sales Regions
Customers
Ship-To’s
Categories
Brands
Product Groups
Items
Networks
Echelon Levels
Locations
Time Buckets
Yearly
Quarterly
Monthly
Weekly

Today’s Demand Planning Environment
(1) Supply Chain Insights 5/13 Survey of 92 Companies
(2) IBF Research Summer 2011
Supply Chain Pain Points(1)
Demand and Supply Variability
Top Pain of Supply Chain
Leaders…and its increasing
2000-2004
2005-2009
1 Month
Lag
2 Months
Lag
4 Months
Lag
1 Month
Lag
2 Months
Lag
4 Months
Lag
1 Month
Lag
2 Months
Lag
4 Months
Lag
Consumer Products
Food and Beverage
Industrial Products
75%
72% 72%
76%
72%73%
74%
68%
74%
74%
72%
68%
74%
77%
74%
79%
69%
67%
Demand Planning
performance improvements
are mixed…mostly down/flat
SKU level Forecast Accuracy(2)

Traditional Benchmarking has Not Provided a Path for Improvement
63%
81%79%
77%
83%
54%
43%40%
30%
40%
50%
60%
70%
80%
90%
100%
0 0.5 1 1.5 2 2.5 3 3.5 4 4.5 5
Lag 0 Lag 1 Lag 2 Lag 3
Forecast Accuracy (FCA)
• Can I really improve this much?
• If so, where and how can I improve?
• Questionnaire-based
• Participants self-report forecast accuracy as
they measure it
• Forecasting process checklist
• Attempt to define best practice
• Limited root-cause and comparative analysis
Conventional Surveys

There Must be a Better Way: Sales & Operations Variability Consortium (SOVC)
Industry: Non-Durable Consumer Product Goods, Food & Beverage
Geography: US Customer Demand
Members: 40+ Participants
Item-Locations: 300,000+
What is our underlying demand uncertainty?
Is our forecast accuracy and bias reasonable compared to competitors and peers using common metrics?
What is causing our challenges in forecasting?
How well do we forecast, relative to that inherent uncertainty?
Does the way we compute error distort comparisons?
How do we prioritize improvement opportunities?
Are we better at forecasting some types of products than others?
What are the underlying drivers of error, such as product portfolio, customer order patterns, economic cycles, seasonality,
new product launches, etc.?
Food & Beverage
51%Personal Care 30%
Home Care 12%
Pet Care 7%

What is Segmentation?
Process of dividing a large unit into various small units which have more or less similar or related characteristics
How can this help me improve demand planning?

81%
61%
54%
2.9%
5.6%
18.7%
% o
f U
nit
s Sh
ipp
ed
in P
atte
rnStable Trending Seasonal/Uplift Intermittent
Launch/End Other FCA Bias
Member 2 Member 3Member 1
Demand Pattern Mix Influences Forecast Accuracy
My planning world is more dynamic!

Forecastability of Demand Patterns
Stable Range
Round Uplift
Trend Up
Trend Down
Sharp Uplift
Phase Out
Phase In
Intermittent Consecutive
Intermittent Non-Consecutive
We
ekly
Fo
reca
ste
rs
Monthly Forecasters
Easi
er
to
Fore
cast
Har
de
rto
Fo
reca
st
Harder to Forecast
Easiest to Forecast
I have the most difficult patterns to forecast.

Member 3 FCA
54%
72.6% High Variability
0.7% Low Variability
0.7% High Velocity, Low Variability
54.7% High Velocity, High Variability S
hip
Qty
Low
Ite
m
Loc
0.0% 0.5%3.0%
1.4% 3.1% 11.5%
Low Medium High
0.0% 0.0% 0.7%
1.8% 24.6%
Medium
Ite
m
Loc
Velocity
Va
ria
bil
ity
Sh
ip
Qty 4.7% 13.2% 54.7%
High
Ite
m
Loc
26.5% 23.9% 30.0%
Sh
ip
Qty 0.3%
Demand Variability and Velocity Influence Forecast Accuracy
Sh
ip
Qty
Low
Ite
m
Loc
18.2% 30.3%16.0%
15.6% 4.0% 2.5%
Low Medium High
2.6% 12.4% 74.8%
2.6% 5.1%
Medium
Ite
m
Loc
Velocity
Va
ria
bil
ity
Sh
ip
Qty 0.4% 0.0% 0.1%
High
Ite
m
Loc
13.2% 0.1% 0.1%
Sh
ip
Qty 2.0%
Member 1 FCA
81%
0.5 % High Variability
89.8 % Low Variability
74.8% High Velocity, Low Variability
0.1% High Velocity, High Variability
My demand is way more
variable.

High-Velocity,Low-Variability
Medium-Velocity,Low-Variability
High-Velocity,Medium-Variability
Low-Velocity,Low-Variability
High-Velocity,High-Variability
Low-Velocity,Medium-Variability
Medium-Velocity,High-Variability
Low-Velocity,High-Variability
Medium-Velocity,Medium-Variability
We
ekly
Fo
reca
ste
rs
Monthly Forecasters
Easi
er
to
Fore
cast
Har
de
rto
Fo
reca
st
Harder to Forecast
Easiest to Forecast
Forecastability of Demand Variability & Velocity
I have the most difficult
variability to forecast

Lag
Nearly 1,600 Benchmarks of
Forecast Accuracy & Bias
Monthly
Net
wor
kLo
catio
n
Weekly
Segmentation Framework for Benchmarking Product Portfolio Characteristics Drive Performance

Benchmarking Based on Forecastability Index “What should my business’ accuracy be?”
30%
40%
50%
60%
70%
80%
90%
0.3 0.4 0.5 0.6 0.7 0.8 0.9 1.0
Ove
rall
Ite
m-L
oca
tio
n F
CA
S&OVC Forecastability Index
Monthly Forecasters Lag 1
Expected Under Over
I’m over performing!

Improvement Opportunities & Setting Realistic Targets
Finally,
Differentiated
Accuracy Targets
Based on Reality

Colgate-Palmolive’s Demand Planning
Segmentation Strategy

Who is Colgate-Palmolive?
Started in 1806 in the U.S.
$17+ Billion in global sales
35,000 People worldwide
Operations in over 80 countries
Selling products in 225 countries
Four core categories:
Oral Care
Personal Care
Home Care
Pet Nutrition

Pet Nutrition Home Care
Personal Care Oral Care
Business Challenges
Rapidly evolving retail environment in developed and developing markets
Greater demands for customized products and new product innovations
Increasing competitive pressures in global and local markets
Volatile demand with less lead time
Managing information flow across multiple networks
Limited planning resources challenged to manage demand

Effective demand planning across Colgate’s cross functional team is critical to overcoming
these challenges.

Demand planning segmentation is the tool that has allowed us to
drive effectiveness.

What is Segmentation in Colgate Demand Planning?
A process that splits a portfolio up into SKU segments that have similar demand characteristics
SKUs with the same demand characteristics can be forecasted using similar approaches

Segmentation Objectives
Manage portfolio complexity
Identify variability or volatility in demand
Prioritize and focus planning activities and resources
Leverage statistical models
Increase Demand Plan Accuracy and Effectiveness
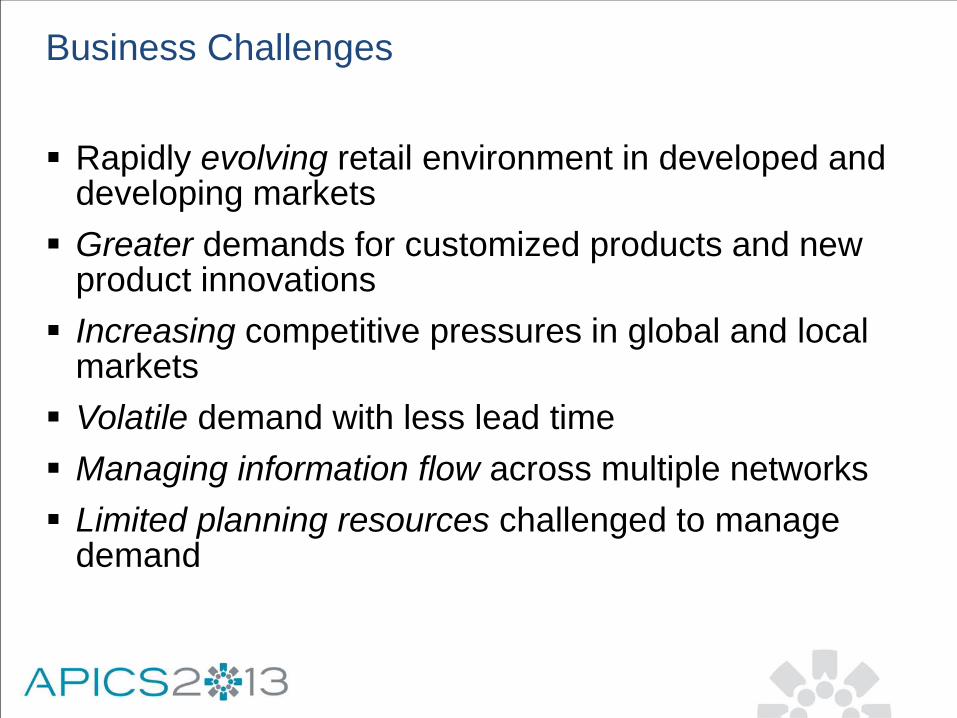
Not Every SKU Behaves the Same Way
Channel of Distribution and Retail Environment
Item Usage (Impulse vs. Everyday)
Seasonality
Volatility of Demand
Volume or Velocity
≠

Our approach to segmenting SKUs is based on criteria that considers…
Volatility & Volume
SKU Segmentation

HIGH
LOW
Volume LOW HIGH
High Priority SKUs
LOW VOLUME
HIGH VOLATILITY
Up to 50% of SKUs
< 10% of Volume
HIGH VOLUME
LOW VOLATILITY
10 to 20% of SKUs
Up to 40% of Volume
LOW VOLUME
LOW VOLATILITY
~10% of SKUs
10% of Volume
HIGH VOLUME
HIGH VOLATILITY
< 20% of SKUs
Up to 40% of Volume Volatility
Threshold CV < 40%
Segmentation Matrix Volatility (CV%) vs. Volume

Segmentation Matrix Volatility (CV%) vs. Volume
HIGH
LOW
Volume LOW HIGH
LOW VOLUME
HIGH VOLATILITY
Hard to Predict
Low Impact Items
HIGH VOLUME
LOW VOLATILITY
Easy to Plan/Forecast
High Impact Items
LOW VOLUME
LOW VOLATILITY
Easy to Stat Forecast
Low Impact Items
HIGH VOLUME
HIGH VOLATILITY
Hard to Predict
High Impact Items Volatility
Threshold CV < 40%

HIGH
LOW
Volume LOW HIGH
LOW VOLUME
HIGH VOLATILITY
Use Inventory Strategies to
Manage Volatility
HIGH VOLUME LOW VOLATILITY
Model Baseline
Volume and Collaborate on Uplifts
LOW VOLUME
LOW VOLATILITY
Use Statistical Models & Manage
by Exception
Focus Efforts & Collaboration on High Volume & Volatility SKUs
Customer Inputs CPFR
Focus Collaborative Demand Planning
Efforts & Resources

Segmentation Works!
U.S. business decreased Demand Planning Error (weighted MAPE) by over 5%
Global subsidiaries that have applied Segmented Demand Planning:
DPA
Inventory Coverage

Keys to Success
Segment your category SKU portfolio to:
Improve accuracy
Increase DP efficiencies
Need cross functional understanding of benefits to drive ownership and focus
Start by prioritizing high volume SKUs with higher volatility and lower DPA
Focus organization on quick wins!

0%
5%
10%
15%
20%
25%
30%
35%
40%
45%
50%
0% 5% 10% 15% 20% 25% 30% 35%
Dem
and P
lannin
g E
rror
Volatility
Opportunity to
Improve DPA
Error aligned with
Volatility in Demand
Demand Planning Error vs. Volatility Focus on Higher Volume & Volatility SKUs with High Error

Keys to Success
Leverage statistical forecasting
Stable demand
Baselines for higher volatility SKUs
Evaluate lower volume and higher volatility SKUs
Rationalize where possible
Cover with safety stock
Move to make-to-order
Next Steps
Expand global roll-out and application
Leverage Chainalytics’ SOVC analysis to expand segmentation
Increase stat modeling to cover some predictable demand “volatility”
Fully implement integrated DP segmentation tools in SAP APO

Questions & Answers

Jim Davis [email protected] Jeff Metersky [email protected]