Embed Size (px)
Citation preview

Segmentation for Credit BasedDelinquency Models White PaperMay 2006
Overview
The objective of segmentation is to define a set of sub-populations that, when modeled
individually and then combined, rank risk more effectively than a single model tested on the overall
population. Typically, the performance improvement is measured across the entire
population, but the litmus test is the improvement in performance as measured at the individual
creditor portfolio level. The credit-based delinquency model development process offers
perhaps the ultimate flexibility in segmentation options resulting from large sample sizes and variety
of individuals across the entire risk spectrum. This paper outlines the role of segmentation in the
improvement of credit-based delinquency models and presents innovative methodologies for the
segmentation process.
The Role of Segmentation
How does segmentation improve scoring system performance? The premise of segmentation is that
the credit characteristics (independent variables) have a different relationship with risk (dependent
variable) for different sub-populations. By identifying the appropriate sub-populations, the
characteristics that are most predictive in isolating risk are optimized for that group.
If we consider two perspectives—a sub-prime lender and prime lender—that target individuals with
vastly different risk profiles, the value of segmentation becomes clear. Consider the
characteristic “number of accounts with a worst repayment performance of 90 days past due or more
(severely delinquent/derogatory),” which is an important characteristic in discriminating between
high and low risk individuals.
From the perspective of a sub-prime lender, the number of severely delinquent/derogatory accounts is
a pervasive and defining element of the target population, but not necessarily a good predictor of who
will be lower risk. Further, this characteristic is not likely to have a significant impact on the
accept/decline decision. For individuals with tarnished credit, there may be little difference in risk with
increasing numbers of severely delinquent/derogatory accounts.
From the perspective of a prime lender, the difference in the number of severely delinquent/derogatory
accounts will be a significant factor in ranking risk. For prime populations that may be fairly
homogeneous, the difference between having zero and one severely delinquent/ derogatory account
may be the basis for the accept/decline decision or the difference between the lowest and the highest
interest rate.
Suppose a single model solution is developed that uses the number of severely delinquent/ derogatory
accounts as one of the components to rank order risk. The resulting solution may be effective for
determining whether an account is directed to a sub-prime lender or a prime lender, and effective for
the prime lender in rank ordering risk. It may, however, have little or no value to the sub-prime lender
in rank ordering risk. One potential solution would be to segment the population using the number
of severely delinquent/derogatory accounts and build models on each population separately,
optimizing the relationship of that characteristic to the risk prediction of the respective segment.
Traditional Segmentation Strategies
Many techniques exist for segmenting a population. The previous example relies on using a single
characteristic to define a segment. The use of characteristics is common in segmentation schemes and
typically involves multiple characteristics to define a sub-population, as demonstrated below.
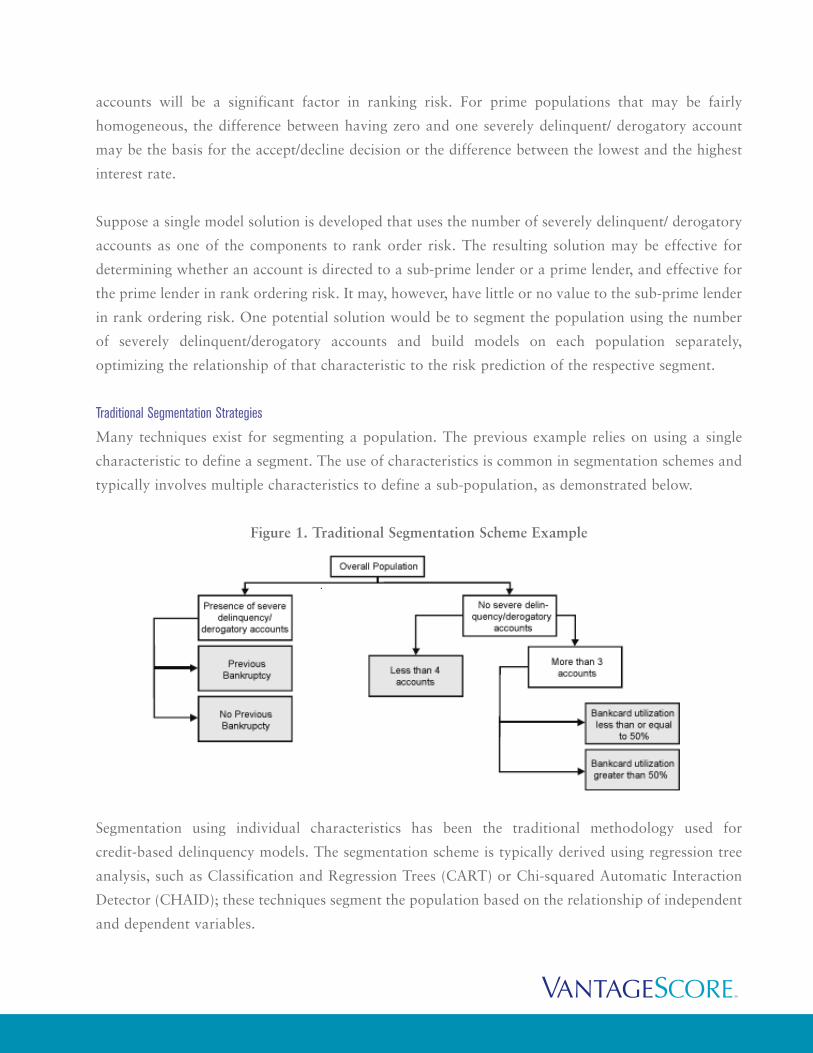
Figure 1. Traditional Segmentation Scheme Example
Segmentation using individual characteristics has been the traditional methodology used for
credit-based delinquency models. The segmentation scheme is typically derived using regression tree
analysis, such as Classification and Regression Trees (CART) or Chi-squared Automatic Interaction
Detector (CHAID); these techniques segment the population based on the relationship of independent
and dependent variables.

Ultimately, using the characteristic-centric, tree-based approach creates a rank ordering system that
results from a number of nodes (tree endpoints) with differing bad rates. However, scoring vendors
have long promoted the value of using statistically derived scores instead of decision trees or manual
processes to rank order individuals.
When viewed from the perspective of the sub-prime and prime lender, the characteristic-based
approach is still sub-optimal because there is no one characteristic that when split one or more times
approximates a lender’s target population. Since there are many factors that influence whether an
individual is sub-prime or prime, evaluating overall risk one characteristic at a time is inefficient
because it requires numerous nodes to assess all of the relevant factors.
Why do traditional credit-based delinquency model vendors use characteristic-based methodologies to
rank order risk for segmentation while they criticize their use for credit decisions? The answer lies in
complacency and lack of innovation. With a historical lack of competition in the tri-CRC,
credit-based delinquency model arena, the incumbent vendors have had no compelling reason to use
advanced methodologies to extract additional predictive power from the rich databases of consumer
credit behavior.
The New Era of Segmentation
Is characteristic-based segmentation dead? No. There is still value in using characteristic-based
segmentation, but it must be used in conjunction with other approaches to produce a robust, powerful
credit-based delinquency model. The new era of segmentation uses scores that group individuals with
similar behaviors along a number of dimensions.
The use of scores to segment the population is consistent with consumer credit markets as higher risk
individuals are directly or indirectly cascaded to non-prime or sub-prime lenders based on decisions
derived from some type of credit score—not by individual credit characteristics. By using a risk-based
segmentation score, individuals are compared to individuals with similar risk profiles; segmenting the
credit population into risk tiers approximates creditors’ target markets and enables effective risk
assessment across the entire credit risk spectrum.
Figure 2 shows the segmentation scheme used by VantageScore. The scheme leverages
characteristic-based segmentation in conjunction with a general risk score and a profile model. The
profile model identifies whether an individual has the profile of someone who will file for bankruptcy
or someone who will default (90+ days past due/charge off).
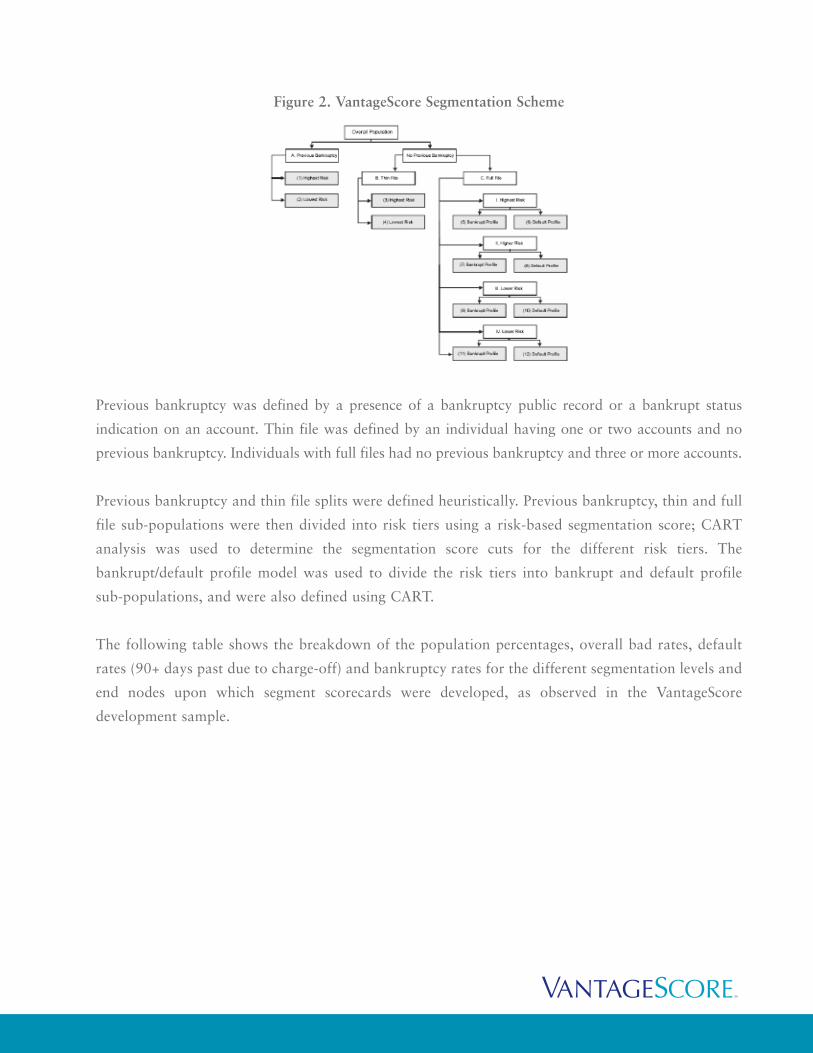
Figure 2. VantageScore Segmentation Scheme
Previous bankruptcy was defined by a presence of a bankruptcy public record or a bankrupt status
indication on an account. Thin file was defined by an individual having one or two accounts and no
previous bankruptcy. Individuals with full files had no previous bankruptcy and three or more accounts.
Previous bankruptcy and thin file splits were defined heuristically. Previous bankruptcy, thin and full
file sub-populations were then divided into risk tiers using a risk-based segmentation score; CART
analysis was used to determine the segmentation score cuts for the different risk tiers. The
bankrupt/default profile model was used to divide the risk tiers into bankrupt and default profile
sub-populations, and were also defined using CART.
The following table shows the breakdown of the population percentages, overall bad rates, default
rates (90+ days past due to charge-off) and bankruptcy rates for the different segmentation levels and
end nodes upon which segment scorecards were developed, as observed in the VantageScore
development sample.
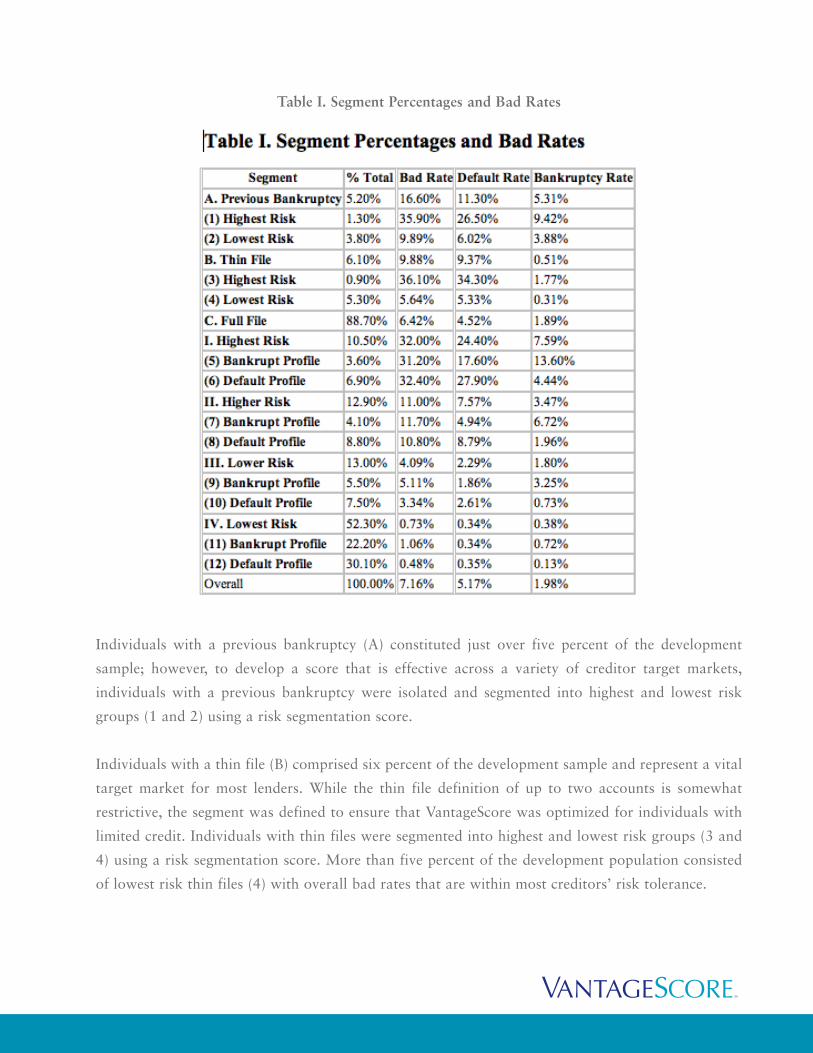
Table I. Segment Percentages and Bad Rates
Individuals with a previous bankruptcy (A) constituted just over five percent of the development
sample; however, to develop a score that is effective across a variety of creditor target markets,
individuals with a previous bankruptcy were isolated and segmented into highest and lowest risk
groups (1 and 2) using a risk segmentation score.
Individuals with a thin file (B) comprised six percent of the development sample and represent a vital
target market for most lenders. While the thin file definition of up to two accounts is somewhat
restrictive, the segment was defined to ensure that VantageScore was optimized for individuals with
limited credit. Individuals with thin files were segmented into highest and lowest risk groups (3 and
4) using a risk segmentation score. More than five percent of the development population consisted
of lowest risk thin files (4) with overall bad rates that are within most creditors’ risk tolerance.
The full file segment (C) comprised eighty-nine percent of the development sample, with the lowest risk
tier constituting over fifty percent of the development sample, and each of the other risk tiers
contributed approximately twelve percent to the development population. The bad rate statistics show
that there is very little difference in the overall bad rates of the bankrupt/default profile pairs by risk
tiers, although the underlying contribution of bankruptcy and default risk is significantly different.
Score Distributions
The following graphs depict:
• Overall score distribution
• Score distribution by
• Previous bankrupt and thin file
• Full file highest and higher risk by segment
• Full file lower and lowest risk by segment
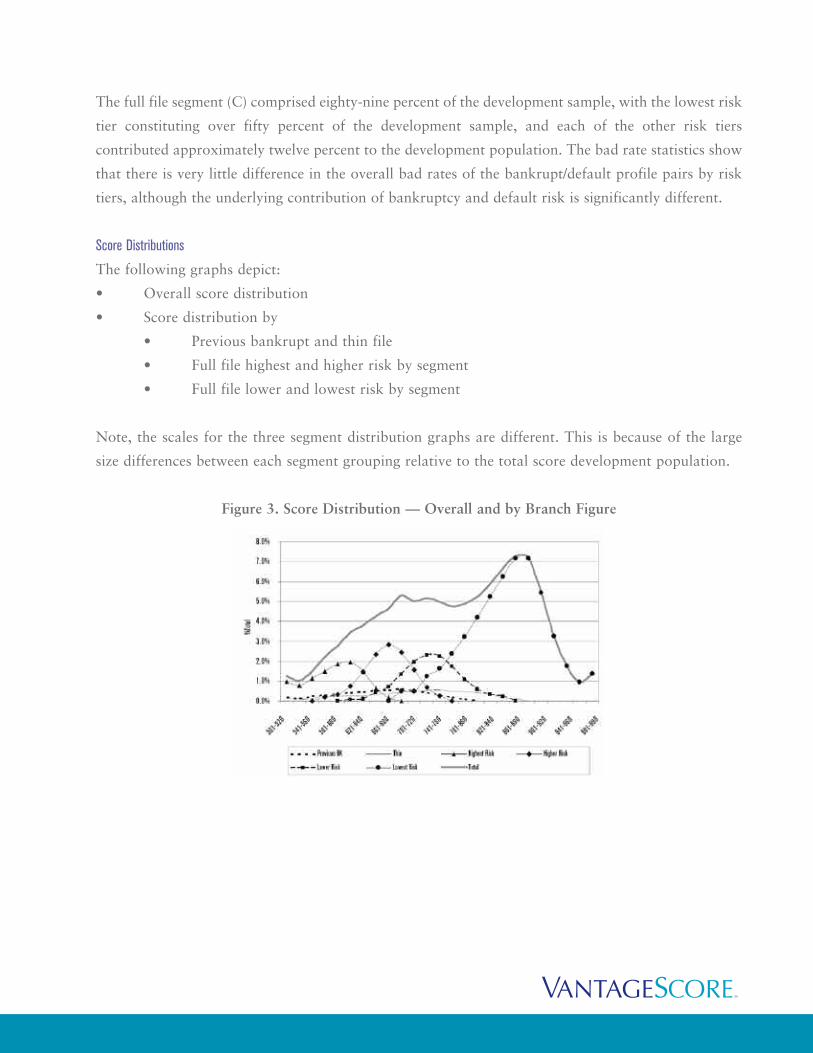
Note, the scales for the three segment distribution graphs are different. This is because of the large
size differences between each segment grouping relative to the total score development population.
Figure 3. Score Distribution — Overall and by Branch Figure
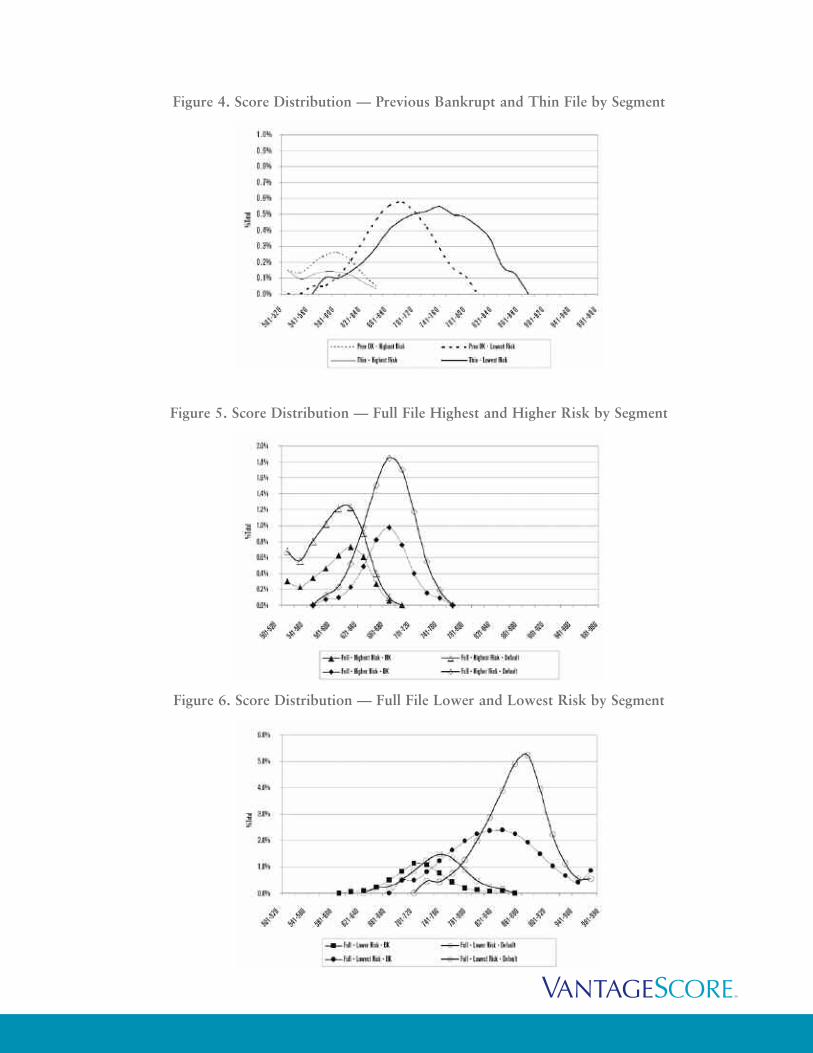
Figure 4. Score Distribution — Previous Bankrupt and Thin File by Segment
Figure 5. Score Distribution — Full File Highest and Higher Risk by Segment
Figure 6. Score Distribution — Full File Lower and Lowest Risk by Segment

Figure 3 shows overlap across each of the segment branches. The order of the distribution peaks
corresponds with the bad rate of each branch, which is apparent for the full file branches (highest,
higher, lower and lowest risk), but less so for the previous bankrupt and thin file branches that have
broad, flat distributions.
For full file branches, the overlap suggests additional discriminating power beyond the
segmentation score, which divided the full file population into mutually exclusive sub-populations. By
creating the homogenous risk tiers, individuals with similar characteristics, as defined by the risk
segmentation score, are further stratified when modeled relative to their peer groups.
The lowest risk groups in the previous bankrupt and thin file branches (Figure 4) represent the bulk
of the previous bankrupt and thin file branches and have broad score distributions that suggest good
stratification of risk.
For the full file segments (Figures 5 and 6), the bankrupt and default segment for each risk tier largely
overlap, as a result of the similar bad rates associated with the bankrupt/default pairs by risk tier. It
is important to note that the maximum scores for each bankrupt/default pair by risk tier is the same,
which will have implications in later discussions regarding adverse action assignment. Despite the
overlapping distribution of the bankrupt/default pairs, the underlying profiles and predictive
characteristics associated with bankrupt and default profiles are vastly different, as highlighted in the
following discussion.
Segment Profiles
The following graphs show the relationship of the bad rate (90+ days past due, charge off or
bankrupt) to several credit characteristics for selected branches of the segmentation tree and for each
segment. The branches of tree plotted on the graphs are the previous bankrupt branch
(segments 1 and 2, highest and lowest risk, respectively) the thin file branch (segments 3 and 4, highest
and lowest risk, respectively) and the full file branches: highest risk (segments 5 and 6, bankrupt and
default profile, respectively), higher risk (segments 5 and 6, bankrupt and default profile,
respectively), lower risk (segments 9 and 10, bankrupt and default profile, respectively), and lowest
risk (segments 11 and 12, bankrupt and default profile, respectively). The graphs illustrate the
similarities and differences between the segments and help establish the need for segmentation.

Figure 7. The Number of 90+ Day Past Due Ratings by Branch
Figure 8. The Number of 90+ Day Past Due Ratings by Segment
Figure 7 shows an increasing linear relationship between the average number of 90+ day past due
trades and the branch bad rates for the full file branches (5 and 6, 7 and 8, 9 and 10, and 11 and 12);
however, the previous bankruptcy branch (1 and 2) lies far to the right of the trend line and the thin
file branch (3 and 4) lies to the to the left of the trend line. Looking at the same characteristic for each
segment (Figure 8), the trend for full file segments remains unchanged and the bankrupt and default
profile segments demonstrate the same relationship to the dependent variable; the previous bankrupt
segments still lie to the right of trend line and the thin file segment remain to the left of the trend line.
The relationships shown above suggest that if a single model were developed on the population and
“Number of 90+ Ratings” was a significant variable, individuals with a previous bankruptcy would
receive a score indicating riskier performance than actually observed since they would be penalized
more than individuals in segments 5 and 6 even though they have a lower bad rate. The opposite is
true of the thin file group such that individuals in the thin file group would be penalized similar to
individuals in segments 9 through 12 even though the risk of the individuals in the thin file group are
far riskier. While it cannot be implied that a single model solution would not work when applied to
individuals with previous bankruptcies or thin files, it does suggest that the solution may be sub-optimal.
Additionally, the interpretation of the score for those two populations would be different than the
interpretation of the score on the full files, such that the risk of individuals with a previous bankruptcy
would be overestimated and the risk of individuals with a thin file would be underestimated.
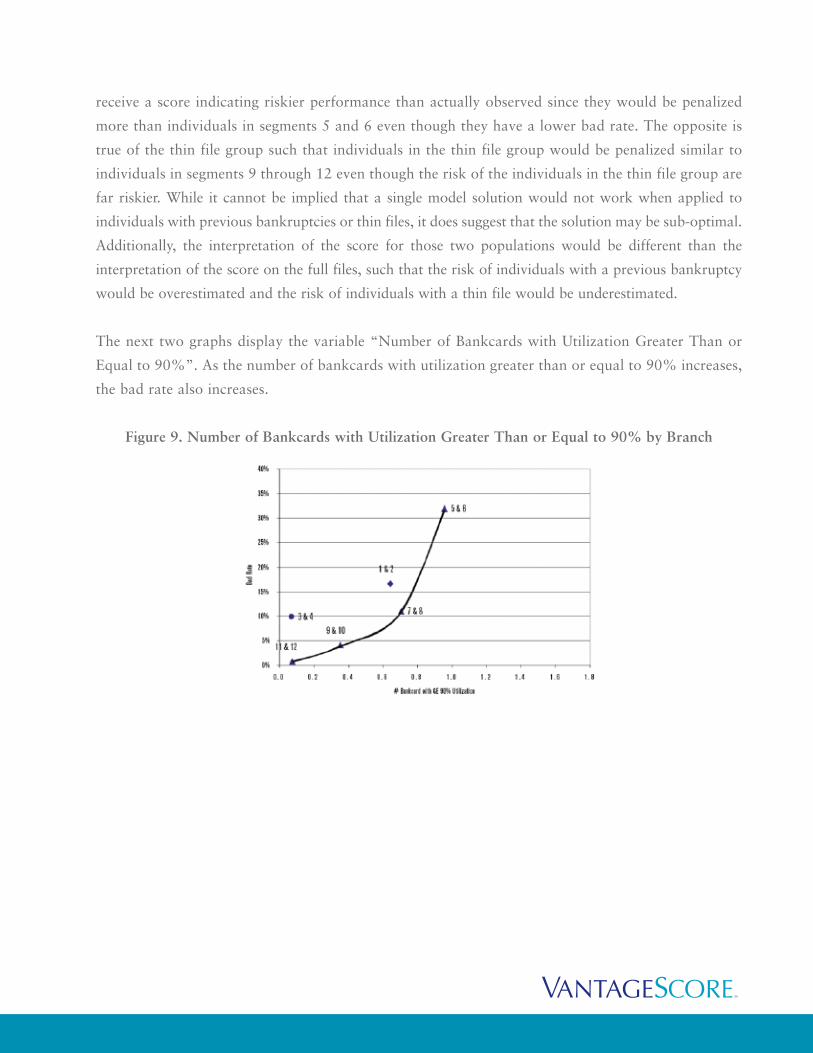
The next two graphs display the variable “Number of Bankcards with Utilization Greater Than or
Equal to 90%”. As the number of bankcards with utilization greater than or equal to 90% increases,
the bad rate also increases.
Figure 9. Number of Bankcards with Utilization Greater Than or Equal to 90% by Branch
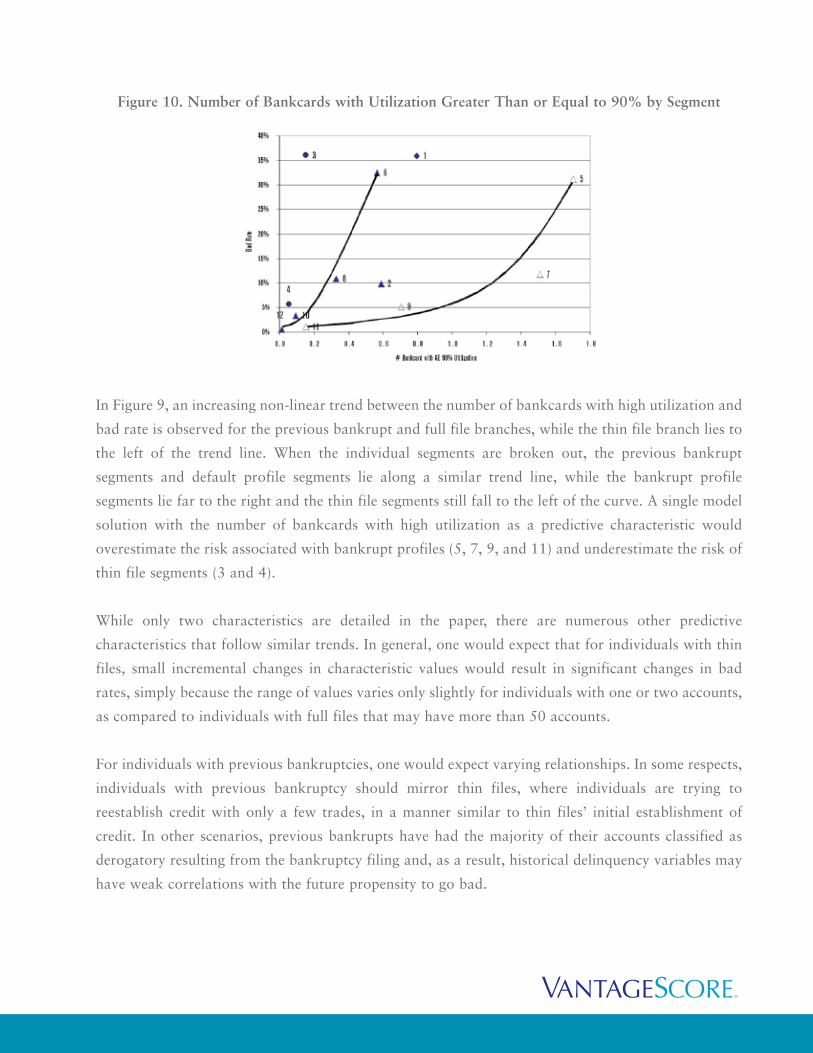
Figure 10. Number of Bankcards with Utilization Greater Than or Equal to 90% by Segment
In Figure 9, an increasing non-linear trend between the number of bankcards with high utilization and
bad rate is observed for the previous bankrupt and full file branches, while the thin file branch lies to
the left of the trend line. When the individual segments are broken out, the previous bankrupt
segments and default profile segments lie along a similar trend line, while the bankrupt profile
segments lie far to the right and the thin file segments still fall to the left of the curve. A single model
solution with the number of bankcards with high utilization as a predictive characteristic would
overestimate the risk associated with bankrupt profiles (5, 7, 9, and 11) and underestimate the risk of
thin file segments (3 and 4).
While only two characteristics are detailed in the paper, there are numerous other predictive
characteristics that follow similar trends. In general, one would expect that for individuals with thin
files, small incremental changes in characteristic values would result in significant changes in bad
rates, simply because the range of values varies only slightly for individuals with one or two accounts,
as compared to individuals with full files that may have more than 50 accounts.
For individuals with previous bankruptcies, one would expect varying relationships. In some respects,
individuals with previous bankruptcy should mirror thin files, where individuals are trying to
reestablish credit with only a few trades, in a manner similar to thin files’ initial establishment of
credit. In other scenarios, previous bankrupts have had the majority of their accounts classified as
derogatory resulting from the bankruptcy filing and, as a result, historical delinquency variables may
have weak correlations with the future propensity to go bad.
Of particular interest is the difference between bankrupt and default profiles. At the risk tier level (full
file branch), the relationship between the number of bankcards with high utilization and bad rate
looks very reasonable and logical; however, upon separating the bankrupt and default profiles, the
underlying relationships are immensely different. The bankrupt and default profiles represent two
entirely different approaches to credit that must be interpreted independently, which is emphasized by
the historic approach of separate models to predict general risk and bankruptcy.
Advanced Segmentation Methodology Benefits
The relative contribution of the segmentation to performance improvement is demonstrated below
where the performance of VantageScore is compared to a single benchmark model (Master Score)
developed on the VantageScore development population.
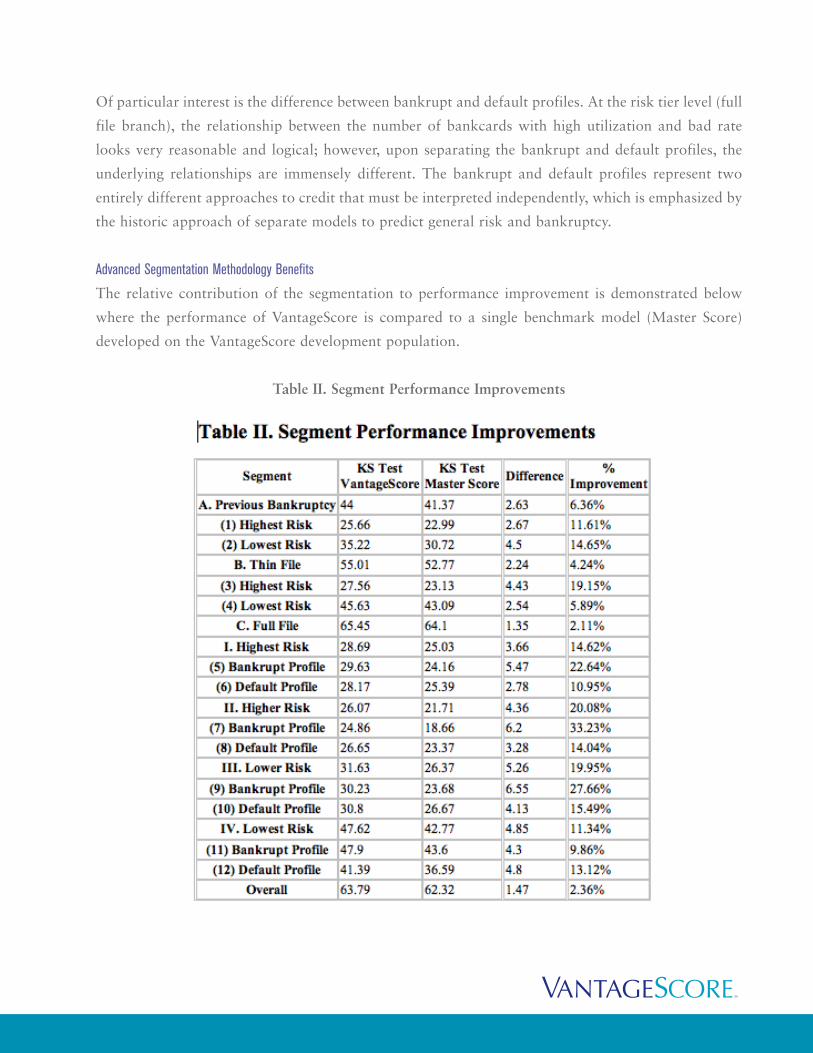
Table II. Segment Performance Improvements
VantageScore showed significant improvement in predictive power over the single model solution as
measured using the Kolmogov-Smirnov (KS) test. Significant improvement was observed on
individuals with previous bankruptcy and thin files, as well as on each of the different risk tiers.
On the full file risk tiers both bankrupt and default profiles’ performance benefited significantly.
Improvement on bankrupt profiles showed lift in KS of 9.86% (lowest risk) to 33.23% (higher risk),
while improvement on default profiles showed lift in KS of 10.95% (highest risk) to 15.49% (lower
risk). Overall, the higher and lower risk groups, which are likely to be around the cuts for many
lenders, demonstrated the most improvement, 20.08% and 19.95%, respectively.
The improvement in performance can be attributed to two factors:
1. Optimal parameter estimation of characteristics at the segment level rather than compromised
parameter estimation at the population level, as articulated in the segment profile discussion.
2. The introduction of additional characteristics that may not be predictive on the entire
population, but help discriminate individuals within the homogenous segments, as
demonstrated by the use of more than 100 variables in the overall solution, compared to the
20 characteristics in the single model benchmark solution.
Performance of VantageScore
The previous section showed two examples of why, conceptually, segmentation can improve a scoring
system’s performance. The proof, however, is how the segmented solution performs at the creditor level.
The performance of VantageScore for each CRC was compared to proprietary risk scores offered
independently by each of the CRCs and included Equifax’s Equifax Risk Score 3.0SM,
Experian-Scorex’s Scorex PLUS for existing accounts and TransUnion’s TransRisk Account
Management 2.0. The performance was measured on existing accounts for several creditors across
five industries: bankcard, retail, finance, automotive and mortgage. Existing accounts were defined as
those open on the observation point.
The performance, as measured by the KS test, was evaluated for each credit reporting company on the
identical set of consumers and performance flags. The scores were tested using two performance definitions:
1. An overall bad definition, including accounts 90+ days past due, charge off or bankruptcy.
2. A bankruptcy definition; each bad definition was contrasted to good accounts that were no
worse than 30 days past due during the outcome period.
To emphasize the power of VantageScore relative to the credit-based delinquency model offerings and
not inter-company comparisons, the KS statistics were ordered by performance; hence there is no
interpretation to the order of the bar and the contributing credit reporting company.
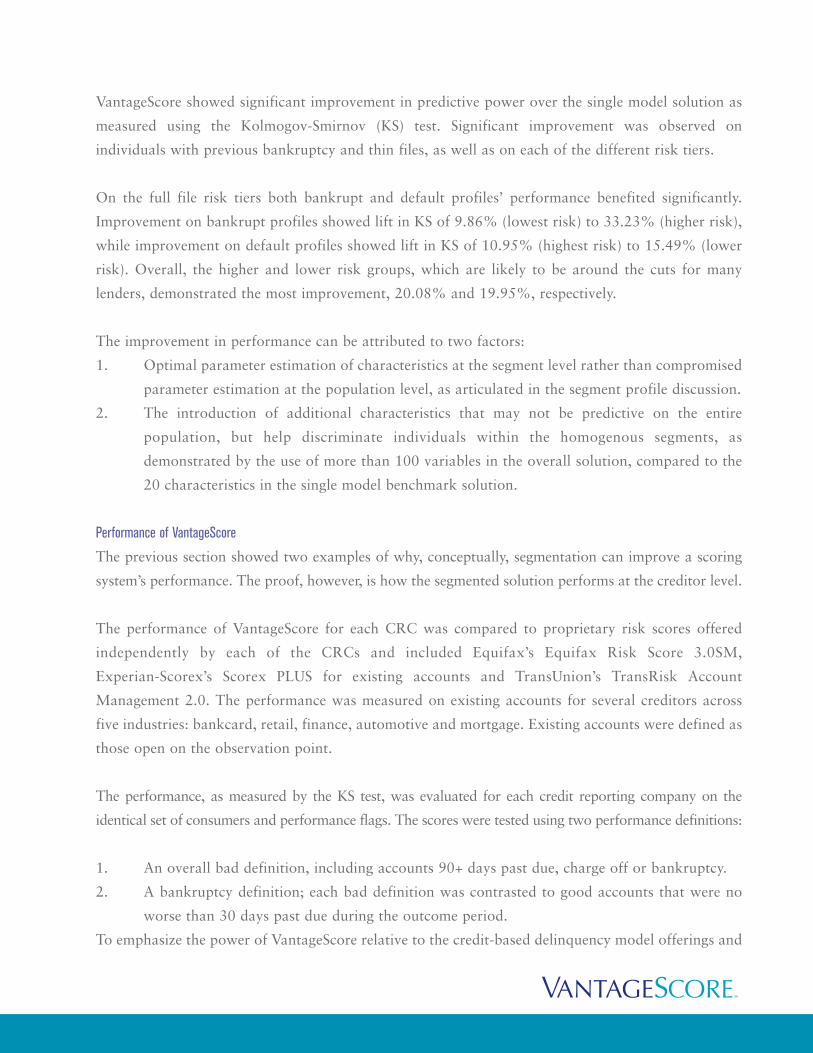
Figures 11 through 16 demonstrate the power of VantageScore on overall bad and bankrupt
performance definitions. While results are displayed for only a limited set of creditors, the results
shown are representative of the performance across a broad range of lenders.
Figure 11. Comparison of VantageScore and Credit-Based Delinquency Models for Bankcard
Portfolios on an Overall Bad Definition
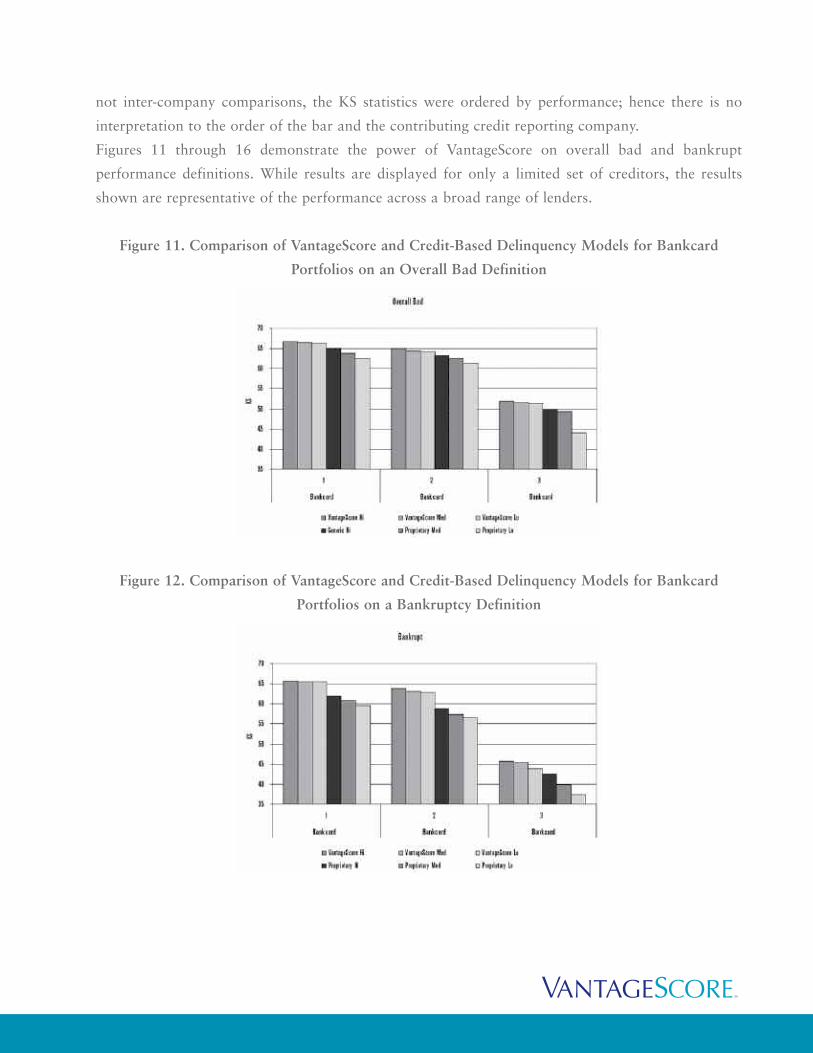
Figure 12. Comparison of VantageScore and Credit-Based Delinquency Models for Bankcard
Portfolios on a Bankruptcy Definition
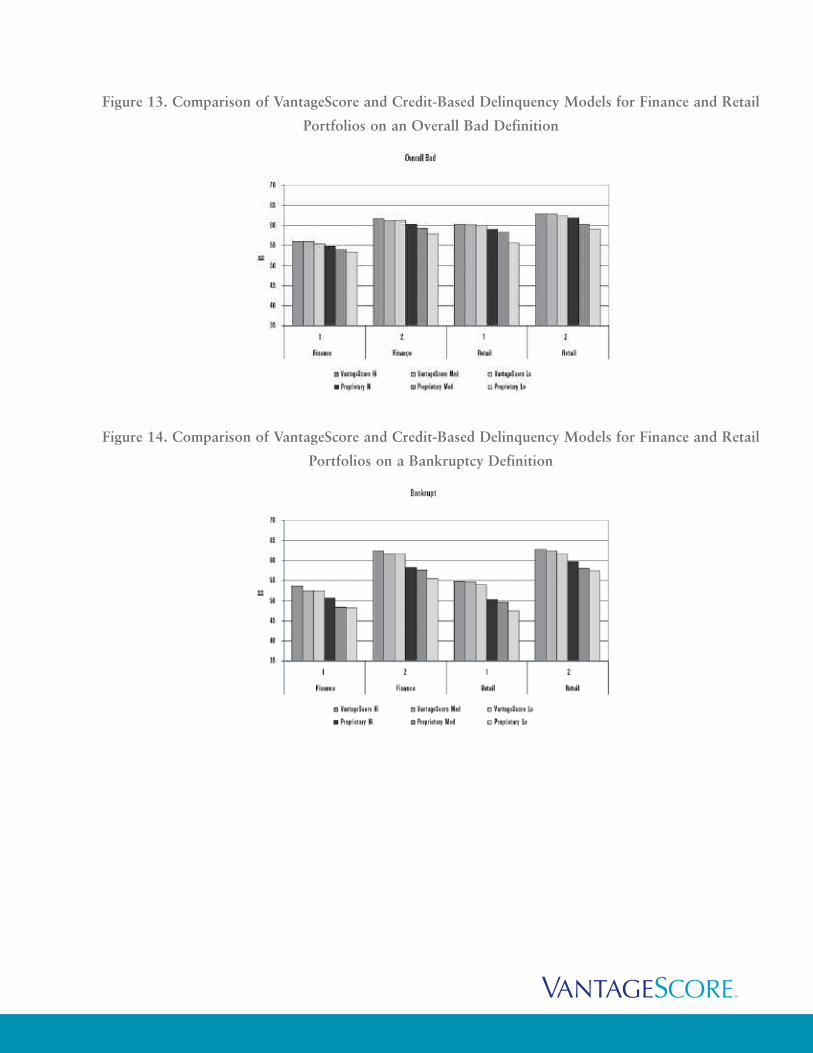
Figure 13. Comparison of VantageScore and Credit-Based Delinquency Models for Finance and Retail
Portfolios on an Overall Bad Definition
Figure 14. Comparison of VantageScore and Credit-Based Delinquency Models for Finance and Retail
Portfolios on a Bankruptcy Definition
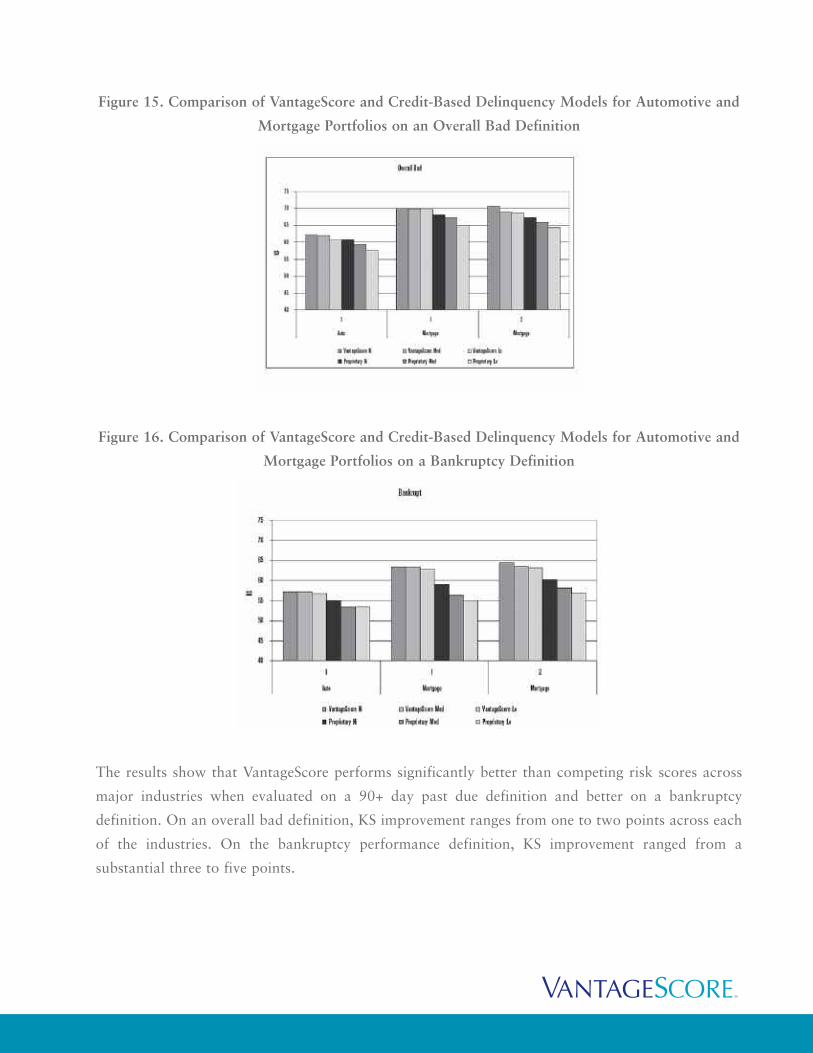
Figure 15. Comparison of VantageScore and Credit-Based Delinquency Models for Automotive and
Mortgage Portfolios on an Overall Bad Definition
Figure 16. Comparison of VantageScore and Credit-Based Delinquency Models for Automotive and
Mortgage Portfolios on a Bankruptcy Definition
The results show that VantageScore performs significantly better than competing risk scores across
major industries when evaluated on a 90+ day past due definition and better on a bankruptcy
definition. On an overall bad definition, KS improvement ranges from one to two points across each
of the industries. On the bankruptcy performance definition, KS improvement ranged from a
substantial three to five points.

The sizeable improvement on the bankruptcy definition can be attributed to the innovative approach
to segmentation through the identification of individuals with bankrupt profiles, where the underlying
data predicts differently. In the past, bankruptcy and default prediction were viewed as competing
outcomes, where individuals with a propensity to file bankruptcy appeared to have more in common
with individuals who looked ‘good’ than those who looked ‘bad’; in the end it plays out to be the
classic segmentation scenario, where the data predicts differently.
While the score predicts bankruptcy significantly better than competing risk scores, it can be
concluded that use of a bankruptcy score in tandem with VantageScore will further improve overall
risk prediction. As a result, it is prudent to test the use of a bankruptcy score in conjunction with
VantageScore.
Adverse Action
At first glance, a credit-based delinquency model that combines characteristics, a risk segmentation
score and profile score would represent a very complicated adverse action methodology. In reality,
however, the assignment of adverse action reason codes, while not simple, is quite logical with an
underlying difference from maximum points methodology.
Adverse action reason codes need to be assigned based on the components that had a negative impact
on an individual’s score, including characteristic-based segment assignment, score-based segment
assignment and the segment score itself. For example, with VantageScore, individuals with a previous
bankruptcy represent a sub-population with a 16.6% bad rate (90+ days past due, charge off or
bankruptcy). Once assigned to the previous bankrupt branch, an individual with a previous
bankruptcy can only achieve a score of approximately 800 out of the maximum 990, meaning there
is a 190 point penalty (990-800) for having a previous bankruptcy. If placed in the highest risk tier of
previous bankrupt branch, the highest possible score is approximately 660, indicating an additional
penalty of 140 points (800-660). Hence, an individual in the previous bankrupt, highest risk segment
should receive adverse action reasons associated with the characteristic-based segment assignment,
segmentation score-based risk tier assignment and the segment model.
An individual’s final score can be summarized by the following equation:
Assignment
• Impact of Risk Tier-Based Segment Assignment
• Impact of Segment Score
• Final Score
Omitted from the equation is reference to the bankrupt/default score because there is no impact on an
individual’s maximum score by being assigned into either the bankrupt or default profile segment.
Referring to Figures 5 and 6, it is observed that the maximum score for bankrupt and default tiers is the
same for each risk band, hence there is no penalty for a bankrupt or default profile segment assignment.
Not all of the segments are subject to the same impacts. For example there is no characteristic-based
adverse action assignment for full file because someone assigned to the full file branch can still achieve
the maximum score. Individuals in the lowest risk tiers are not penalized by the risk tier assignment
and receive no reasons based on the segmentation score.
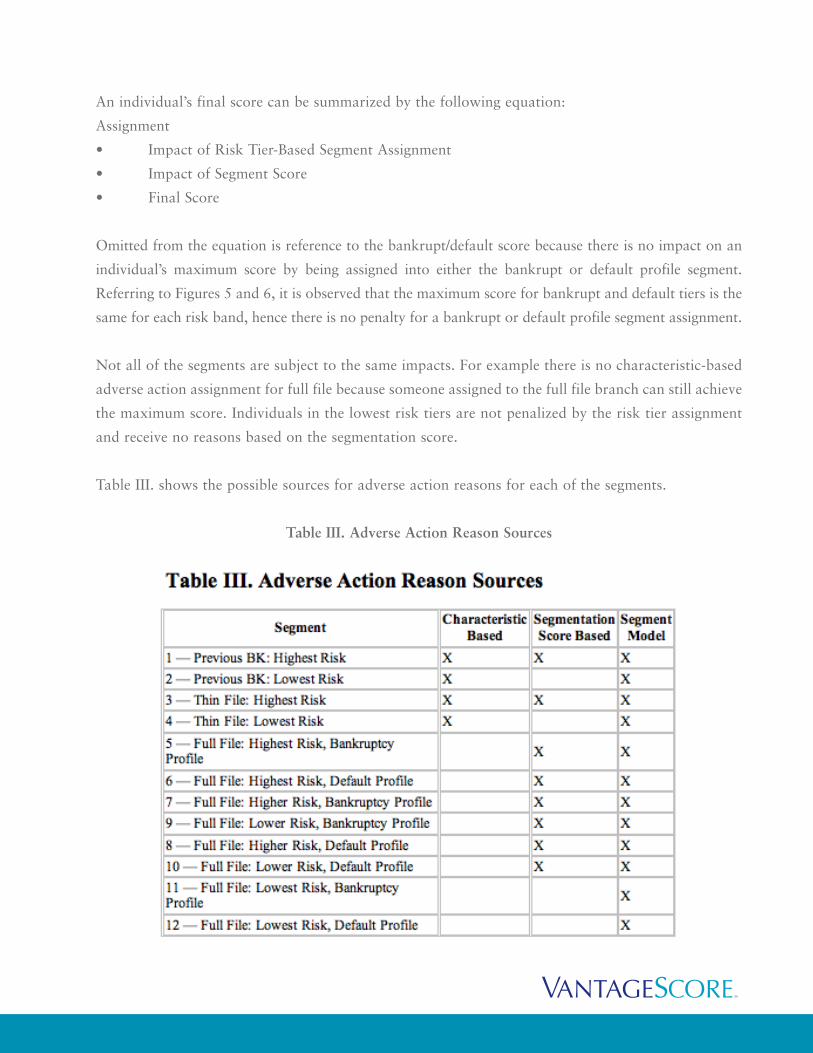
Table III. shows the possible sources for adverse action reasons for each of the segments.
Table III. Adverse Action Reason Sources
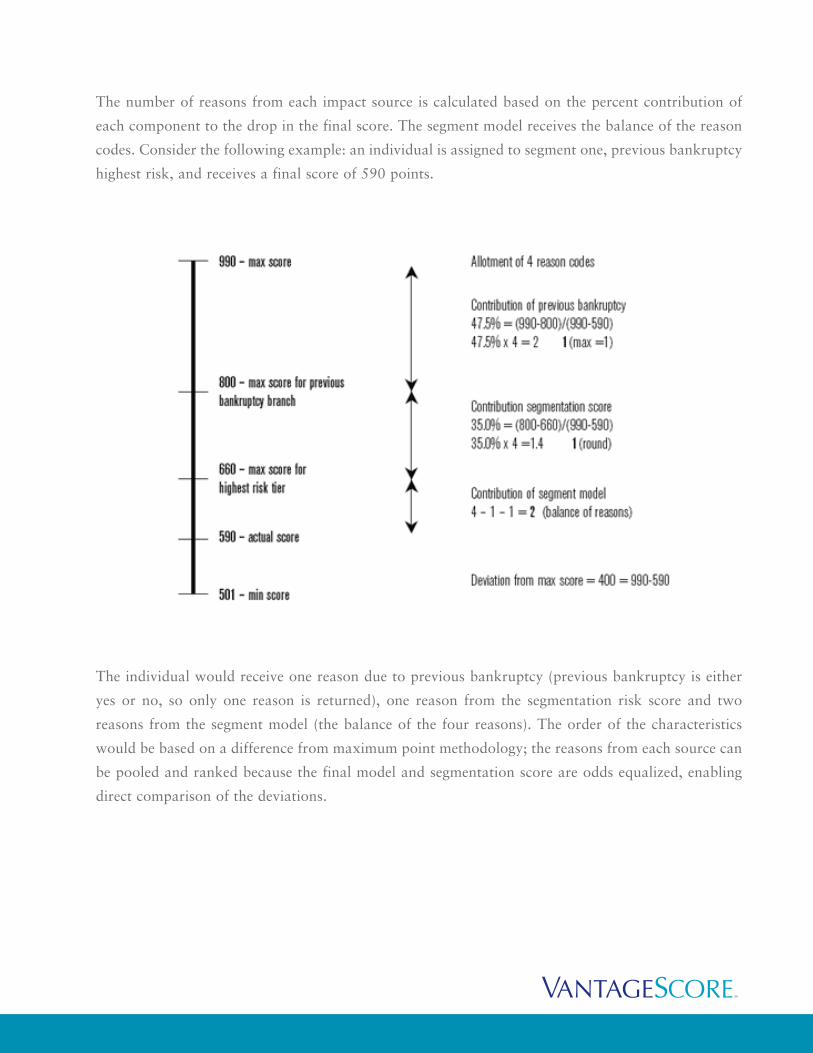
The number of reasons from each impact source is calculated based on the percent contribution of
each component to the drop in the final score. The segment model receives the balance of the reason
codes. Consider the following example: an individual is assigned to segment one, previous bankruptcy
highest risk, and receives a final score of 590 points.
The individual would receive one reason due to previous bankruptcy (previous bankruptcy is either
yes or no, so only one reason is returned), one reason from the segmentation risk score and two
reasons from the segment model (the balance of the four reasons). The order of the characteristics
would be based on a difference from maximum point methodology; the reasons from each source can
be pooled and ranked because the final model and segmentation score are odds equalized, enabling
direct comparison of the deviations.
Conclusion
Segmentation plays a critical role in the development of powerful, robust risk scores. New innovations
in segmentation that leverage risk and profiles scores can provide significant lift in credit-based
delinquency model performance. Characteristic-based segmentation still plays a role in segmentation,
but should be combined with score-based methodologies to maximize scoring system performance.
Improvement in bankruptcy prediction can be achieved via segmentation, but it is still prudent to
access the benefits associated with a stand-alone bankruptcy score to achieve maximum risk
prediction.
Adverse action reasons should be attributed to the different components of the segmentation schemes.
A contribution-based approach using a maximum value methodology provides an accurate,
quantitative system to assign adverse action reasons.
VantageScore leverages the most advanced segmentation methodology of any score in the
marketplace, credit reporting company-based or custom. The benefits of the advanced segmentation
are reflected in the superior performance of VantageScore relative to other commercially available
credit-based delinquency models. This superior performance is observed across multiple industries,
products and lenders.