Embed Size (px)
Citation preview

SEF Working paper: 05/2015
The (mis) allocation of public
spending in a low income country: Evidence from disaster risk
reduction spending in Bangladesh
Azreen Karim and Ilan Noy
School of Economics and Finance Te Kura Ohaoha Pūtea
brought to you by COREView metadata, citation and similar papers at core.ac.uk
provided by ResearchArchive at Victoria University of Wellington

The Working Paper series is published by the School of Economics and Finance to provide staff and research students the opportunity to expose their research to a wider audience. The opinions and views expressed in these papers are not necessarily reflective of views held by the school. Comments and feedback from readers would be welcomed by the author(s). Further enquiries to:
The Administrator School of Economics and Finance Victoria University of Wellington P O Box 600 Wellington 6140 New Zealand Phone: +64 4 463 5353 Email: [email protected]
Working Paper 05/2015
ISSN 2230-259X (Print)
ISSN 2230-2603 (Online)

1
THE (MIS) ALLOCATION OF PUBLIC SPENDING IN A LOW INCOME COUNTRY:
EVIDENCE FROM DISASTER RISK REDUCTION SPENDING IN BANGLADESH
Azreen Karim & Ilan Noy*
School of Economics and Finance Victoria University of Wellington, New Zealand
February, 2015
ABSTRACT: Rational allocation of limited public resources is critical to achieve the stated aims of government programmes. Here, we focus on the regional allocation of public spending for disaster risk reduction in Bangladesh as a case study to identify the rationale that guides public funding allocations. It is well understood that any government’s public spending decision-making is also affected by considerations other than need, and our objective in this paper is to identify all of the directly observable determinants’ of publicly allocated and realized spending at the local government (sub-district) level. We employ the Heckman two-stage selection model with detailed public finance and other data from 483 sub-districts (upazilas) across the country. While some of our results conform with our priors, our estimations surprisingly find that government does not respond to the sub-district’s risk exposure as a factor affecting the DRR financing mechanism. This variable is consistently counter-intuitively negative and statistically significant. The DRR regional allocations do not seem to be determined by risk and exposure, only weakly by vulnerability, nor even by more transparent political economy motivations. This is surprising, as the Bangladesh DRR program is considered a poster-child of DRR investments.
Key words: Public spending, natural disasters, sub-district, Heckman selection JEL codes: Q54, Q56, H76, C34 * Corresponding author: Noy, EQC-MPI Chair in the Economics of Disasters and Professor of Economics, School of Economics and Finance, POB 600, Wellington, New Zealand. [email protected]; Tel. 64-4-463-5737. We thank audiences at the 2015 Western Economic Association Meeting in Wellington, our discussant Rio Yonson, and Dean Hyslop and Paul Raschky.

2
1. Introduction
A burgeoning literature has emerged investigating the efficacy of public spending in
lower income countries. For example, recently Sennoga and Matovu (2013) provided an
investigation of public spending in Uganda, Ramirez (2004) investigated public infrastructure
spending in Mexico, Kruse et al. (2012) examine public health spending in Indonesia, and
Rajkumar and Swaroop (2008) focus on a cross-country statistical analysis of levels of
spending, institutional structures, and relevant outcomes. This literature also uses a wide
variety of methodologies to approach this efficacy question: Sennoga and Matovu (2013) use
general equilibrium modeling, Ramirez (2004) uses a vector error correction empirical model
with impulse response functions, and Kruse et al. (2012) use panel data regression
techniques.
This literature assumes that public spending is indeed geared towards achieving the
relevant favourable outcomes—productivity growth for infrastructure spending, better
health service utilization for health spending, or improved literacy for education spending.
More importantly, this literature implicitly assumes that funding is allocated optimally given
these desired outcomes and the perceived community needs. It is this last assumption that
we examine in this paper. We ask whether we can find evidence that public spending is indeed
allocated rationally according to perceived needs, or whether we can identify other
explanations for the pattern of de facto public spending.
We focus on disaster risk reduction (DRR) spending in Bangladesh for several reasons.
Disaster risk reduction spending has a clearly defined policy aim, and measurable outcomes.
As such, DRR spending is maybe uniquely suited to examine the rationale for the regional
allocation of public resources. Bangladesh has a long history with natural disasters due to its

3
geography and its location on the shores of the Bay of Bengal. Natural hazards in Bangladesh
range from floods and cyclones to river bank erosion and droughts. Flooding associated with
the monsoon season occurs each year. The monsoon rain plays a pivotal role in securing
domestic agricultural production, but can also kill and devastate crops and livelihoods. Along
the coasts, the most destructive cyclones generate storm surges that can inundate vast land
areas, and have in the last few decades killed hundreds of thousands of people. Given all
these; it is obvious that disaster planning and government-led disaster risk reduction (DRR)
has been part of the Bangladeshi government’s economic planning process for a long time.
Bangladesh, it is important to note, is widely perceived as poster-child for successful
spending on DRR by a developing country. In particular, Bangladesh is often mentioned for its
successful early warning programmes for cyclones, which is frequently favourably contrasted
with neighbouring Burma after its catastrophic experience with cyclone Nargis in 2008. Most
recently for cyclone Sidr in 2007, for example, Bangladesh managed to evacuate millions away
from the coast and the storm’s surge (Paul and Dutt, 2010).1 Bangladesh’s successful disaster
risk reduction policies is also mentioned in the context of the management of the annual
monsoon floods (del Ninno et al., 2003).
A demonstration of the crucial role that government safety net policies can play in
DRR is the comparison of the severe flood of 1998 in comparison to an equally severe flood
in 1974.2 In this case, in 1998, the government’s substantial disaster management facilities
and emergency food and financial assistance through better management of targeted
1 For further data and a comparison of Sidr to previous storms, see p. 502 in IPCC (2012). 2 The severity of the 1998 flood has been identified in terms of area affected (affecting two-thirds of the country) and lasted for a prolonged period (from early July till mid-September) in many areas and direct damages were estimated at US$2 billion (Khandker, 2007).

4
programs such as Vulnerable Group Feeding (VGF) and Food For work (FFW), it is claimed,
helped prevent mass starvation and other associated risks compared with the severe flood
impacts of 1974.3
Besides the already mentioned ease of determining the aim of DRR spending in the
Bangladeshi context, its importance is also well established. Ex ante spending choices on
disaster risk management has been advocated for by all the international aid multilaterals, as
DRR’s importance in reducing mortality, morbidity, and risk to livelihoods is undisputed in
Bangladesh, and elsewhere. The most recent example of this emphasis is the Philippines’
decision to initiate a US$293 million national disaster risk reduction and management fund
that is targeted to be used for pre-disaster risk reduction activities. In Bangladesh, as well as
in the Philippines, one of the more important decisions the central government consistently
needs to make is how to allocate DRR program spending across communities to minimize and
mitigate the risks associated with the natural hazards both countries are exposed to.
Our focus here amounts to answering a basic question: ‘what determines public
spending in disaster risk reduction and mitigation in Bangladesh?’ We believe that this
particular question has important implications not only for DRR spending in Bangladesh—as
important as that is—but also to DRR spending elsewhere, and more generally for
government spending in low income countries and its challenges.
We identify the determinants’ of per capita public spending on disaster risk reduction
and mitigation at the local government (sub-district/upazila4) level in Bangladesh. The
3 For discussions and analysis of the impacts of floods in Bangladesh, see Khandker (2007) and Banerjee (2007). 4 Bangladesh is divided into 7 administrative regions (Divisions), 64 districts (Zila) and 483 sub-districts (Upazila). Our primary focus in this investigation includes all 483 sub-districts.

5
objective of this study is to identify the rationale behind the allocation of public spending
based on the stated aims of these DRR safety net programs.
After describing the, admittedly very limited, literature that examines the
determinants of public expenditure, we discuss our data in detail. Section 4 provides relevant
descriptive and summary statistics of the variables we use, while section 5 presents the
methodological framework and justifies our use of the Heckman two-step selection model.
Section 6 examines the estimation results and interprets them. Finally, in Section 7 we
conclude, identify potential caveats, and discuss possible future research.
2. The Determinants of Fiscal Spending?
Oftentimes, natural disasters are perceived as an exogenous shock to the economy
resulting in additional fiscal expenditure or re-adjustment of existing expenditure to finance
rehabilitation and reconstruction activities. The financial aspects of post-disaster fiscal
management has been examined in country-specific policy papers (e.g. Bangladesh after the
1998 flood is examined in Benson and Clay, 2002, while Belize is analysed in Borensztein et
al., 2009). Several cross-country studies have also attempted to measure the average ex post
fiscal costs (in lost revenue and increased expenditures) of a proto-typical disaster (e.g. Noy
and Nualsri, 2011 and Lis and Nickel, 2010) and a global assessment is provided in Hochrainer-
Stigler et al. (2014). Yet, none of these papers examine ex-ante disaster risk financing.
As we have already noted in the introduction, we are not aware of any literature that
attempts to examine the rationale behind central government’s financing to the regions;
neither in the context of disaster risk financing, nor in other contexts. We aim to investigate
the determinants of regional financing for DRR activities and examine whether these flows of

6
funds are conditional upon actual (or perceived) regional hazards, vulnerabilities, other socio-
economic regional attributes, and political affiliations at the local government level.5 Aldrich
(2010) and Takasaki (2011) identify the ability of elites to capture post-disaster reconstruction
spending in India and Samoa, respectively.
The research project most closely related to our own work is Miller and Vela (2014).
They examine the allocation of disaster funding (both preventative and for recovery) for
Peruvian regions (districts in the Bangladesh context), and focus on whether distribution of
public expenditure in both recovery and prevention categories is conditional upon the
occurrence of natural disasters in the recent past and on exposure and vulnerability. The data
they use, their empirical approach, and the questions they ask are all quite different, but
ultimately they also find it difficult to correlate the spending they examine with measureable
risk.
3. What we define as DRR?
We interpret the term DRR spending fairly broadly, given the often repeated insight
that ‘an ounce of prevention is worth a pound of cure’ and the increased awareness that social
and socio-economic vulnerability is as important in determining a disaster’s impact as is the
natural hazard itself. The need for social protection through the provision of social safety nets
has been reiterated in various papers that focus on DRR (e.g. Pelham et al, 2011; Rahman and
Choudhury, 2012; and World Bank, 2010). Relevant examples of disaster safety net6 programs
5 Indirectly, Hodler and Raschky (2014) identify political favoritism in regional allocations by examining the
intensity of nighttime light in regions associated with the political leadership. 6 In this paper, the term ‘Disaster Safety Net’ refers to particular social safety net programs that has embedded structural mechanism to participate in disaster risk reduction activities.

7
incorporated into a country’s DRR policies are Bangladesh’s National Disaster Management
Prevention Strategy and Ethiopia’s Productive Safety Net Program.7
An additional type of DRR activity that we include in our analysis is Investments in
specific infrastructure whose aim is disaster prevention; again this type of DRR spending is
widely recognized in the DRR literature (e.g. World Bank, 2010). For example, the Department
of Disaster Management (DDM) in Bangladesh constructs bridges/culverts (up to 12 meter
long) under its Annual Development Plan – the main aim for this infrastructure is DRR rather
than development or poverty alleviation more broadly.
The connection between the climate and disaster occurrence is obvious, but the
causality from climatic change to disasters has only been emphasized in the past few years,
and most forcefully by the IPCC in their Special Report on Extreme Events (IPCC, 2012).
Another international organization that has emphasized the link between DRR and climate
change adaptation is the United Nations International Strategy for Disaster Risk Reduction
(e.g. UNISDR, 2009).8 We therefore also include an investigation of the US$350 million
allocated by the Government of Bangladesh in fiscal years 2009-2013 to tackle climate change
impacts.
4. The possible determinants of DRR
The future probability of exposure to hazards (and their probable intensity) is proxied
in this paper by past experience of this hazard. In this case, we focus on DRR activities that
7 See Pelham et al (2011) for discussion of these two programs. 8 See also Shamsuddoha et al. (2013).

8
are mostly related to flood exposure, and therefore focus on flood risk. We measure the past
exposure to hazards using details of rainfall record in each region.9
The two other components of disaster risk, after the hazard itself, is the exposure of
the population, and its vulnerability. Socio-economic vulnerability is as important as
geographical exposure in order to more fully understand community-level adaptive capacity.
The past literature has identified indicators of socio-economic vulnerability to natural hazards
and emphasizes the importance of integrating them into national disaster prevention
planning (Cutter et al. 2009; Tapsell et al. 2010). This widely discussed need to insert this
socio-economic perspective into DRR planning motivates our use of socio-economic
indicators.
The political dimension of natural disaster policy has also been receiving attention in
recent years with a primary focus on the evident failure of politicians’ and voters’ to prioritize
prevention over post-event response; see for example Healy and Malhotra (2009) and Garret
and Sobel (2003) on US post-disaster funding, Cole et al. (2012) on India, and Fuchs and
Rodriguez-Chamussy (2014) on Mexico. When funding is awarded ex ante, the evidence
seems to suggest that governments favour spending in regions that are politically aligned with
the party in power (e.g. Cohen and Werker, 2008), and this is the focus of our investigation
into the political economy of fiscal spending on the regions.
9 The risk associated with geological hazards is much more difficult to forecast, and this partly justifies our
choice to focus on Bangladesh, where disaster risk is generally only associated with climatological events
(unlike, for example, Peru) – see, for example, Kerr (2011).

9
5. The Data
The data for this study were collected from various Bangladeshi government sources
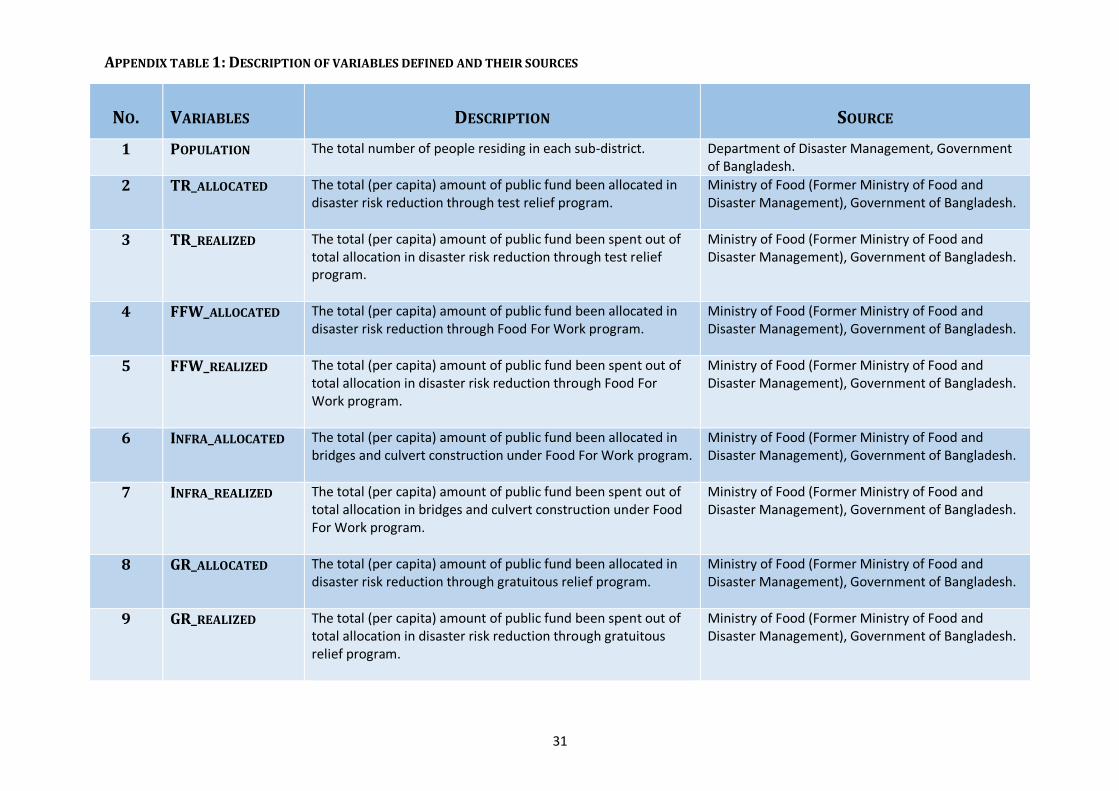
described below, both online and in print. Appendix table 1 provides the precise definition of
all the variables and their data sources.
5.1 DRR Programs in Bangladesh
The disaster risk reduction public spending data at the local government level was
collected from publications of Bangladesh’s Ministry of Food (former Ministry of Food and
Disaster Management) – the information was collected from the Ministry’s web portal where
sub-district (upazila) disaster risk reduction and mitigation funding allocation data from FY
(fiscal year) 2010-11 to FY2013-14 was available. For each year, the dataset records the
‘allocation’ (allocated spending) and ‘expenses’ (realized spending) for the various disaster
safety net programmes - Test Relief (TR), Food For Work (FFW), Gratuitous Relief (GR) and
Vulnerable Group Feeding (VGF). It also records the same information for the DRR
infrastructure programme (bridges and culvert construction) and the climate change fund
(also known as the climate investment fund). These various programs are described below.
The Test Relief (TR) program has been implemented every year since 1975 in rural
areas. This programme is mainly for repairing roads, damaged infrastructure such as schools
and clinics, and other rural activities. It provides employment opportunities by providing 8
kilograms of rice/wheat to every person in return for working 7 hours/day in specific projects
related to disaster risk reduction and mitigation. The Gratuitous Relief (GR) programme
(established in 1973) is designed to provide a maximum of 20 kilograms of rice/wheat to worst
affected poor households with no associated work requirements. Vulnerable Group Feeding

10
(VGF) is another form of gratuitous relief (i.e. without work requirement) and is normally
launched during or after a disaster and attempts to assist people remaining vulnerable to
hunger.
The Food For Work (FFW) program has been implemented since 1975 and is designed
for construction, maintenance, reconstruction and development of rural infrastructure.
Based on government food and monetary support, various rural infrastructural projects
(many of them aimed at reducing vulnerability) are financed under this program during
normal times and in post-disaster scenarios with work requirements. Among these
infrastructure projects, the Department of Disaster Management funds construction of
bridge/culverts (up to 12 meter long) under the Annual Development Programme of the
Bangladesh Government (Bridges and Culverts programme).
Data has been aggregated by adding up allocations in general and special categories
under each DRR programme for each of the 483 sub-districts. We converted the food
allocations in some of these programs into its monetary value using the contemporaneous
(average) market price of rice in Dhaka (wholesale price). We aggregate both food and cash
amount to get total allocation under each particular DRR activity for each sub-district. We
then divide total allocated and realized spending amounts for each program/sub-district by
the size of the population of each corresponding sub-district.
5.2 Rainfall Hazard Data
Due to its geographical location in the South-Eastern part of Hindu-Kush Himalayan
region and being at the confluence of three major rivers – the Ganges, the Brahmaputra and
the Meghna, Bangladesh is an extremely flood-prone. River-bank flooding occurs mostly

11
during the monsoon period (May-October) is the most frequent case.10 High rainfall is
primarily the reason of river-bank floods. Here, we calculate a rainfall-based flood risk
probability index for 483 sub-districts of Bangladesh to examine the sensitivity government
DRR spending to flood risks. The index captures historical rainfall variability to determine local
(sub-district) flood risks. In as much as this index is based on past experiences, it does not
capture the projected future changes that are associated with climatic change.
To develop this index, we collected annual rainfall data for 64 years for 35 weather
stations covering the whole country from the Bangladesh Meteorological Department
(BMD).11 The BMD records daily rainfall data since 1948 for all available weather stations
across the country. We first calculated total monthly rainfall for each year under each weather
station. We next calculated the mean and standard deviation for each month for each sub-
district by matching weather stations with sub-districts.12 We develop two indexes of low-
and high-risk indices. For the low flood risk, we count the number of months over the 64 years
for which we have data with extreme rainfall using two thresholds: monthly rainfall exceeding
15% of average annual rainfall for this sub-district; and monthly rainfall exceeding one
standard deviation above the mean for that month throughout the available time period.13
We calculate the average number of months with extreme rainfall to obtain the
probability of flooding occurring annually in that particular weather station (and consequently
sub-district). The mean probability is 0.93 with 0.16 standard deviation. The second index,
10 Other, less common types of flooding are the flash floods (in hilly areas) and storm surges (along the coast). 11 The available data were for the years 1948-2012. 12 In cases where a sub-district did not have a rainfall measurement station, we used an average of the three nearest stations. 13 The historical coverage of rainfall data in BMD weather stations varies depending upon their establishment year. Therefore, we calculate the average number of months with extreme rainfall by dividing with the total number of rainfall years available to calculate the probability of annual flooding in that particular weather station.

12
high flood risk, is constructed similarly, but in this case the two thresholds are 20% of average
annual rainfall and more than two standard deviation above the monthly mean. For the high-
risk measure, the mean probability is 0.26 with 0.08 standard deviation.
5.3 Other Variables
Population numbers and poverty rates for each the sub-district (annually) were
collated from government circular orders of the Department of Disaster Management. Our
proxy for ‘economic development’ for each sub-district is a composite variable averaging the
shares of the population with access to basic amenities (electricity, safe drinking water, and
sanitation facilities). This data were collected from the 2011 Population and Housing Census
of Bangladesh.
To capture the importance of politics in allocation of funding from the central
government to the regions, we construct a political binary variable that measures whether
the Member of Parliament (MP) representing the sub-district belongs to the main political
party in power. To construct this variable, we divide the 300 electoral constituencies with
respect to 483 sub-districts based upon the electoral delimitation information on the
Bangladesh Gazette (2013). Information regarding election results and the sub-district
representatives has been collected from the Bangladesh Election Commission report of 2008.
According to the Coastal Zone Policy of the Government of Bangladesh (2005), the
zone is divided into ‘exposed coast’ (the area/upazilas that front the sea directly, and ‘interior
coast’ (the area/upazilas that are located behind the exposed coast). Here, we include both
groups to create the ‘coastal belt binary variable’. Another dummy variable has been created
to capture ethnic divisions within the sub-district. Bangladesh, unlike some of its neighbours,

13
is relatively homogenous. We include a variable noting if indigenous ethnic minorities reside
in the sub-district. To create this ethnicity dummy, we use information from the 2011
Population and Housing Census of Bangladesh. We add two more binary variables. The first
identifies the central sub-district in any particular district (in most cases that implies bigger
populations, higher degree of urbanization and more industrialized). The other binary
measures indicate urban sub-districts associated with the two mega-cities in Bangladesh
(Dhaka and Chittagong).
6. Descriptive Statistics and Model Specification
Table 1 reports the descriptive statistics of public spending on DRR in Bangladesh,
including both allocated and realized spending for the fiscal year 2010-11 to 2013-14 for each
of the programmes described earlier. These statistics include mean, standard deviation,
maximum and minimum of allocated and realized spending for Test Relief (TR), Vulnerable
Group Feeding (VGF), Food For Work (FFW), Gratuitous Relief (GR), Infrastructure Spending
(Bridges and Culvert construction under FFW) and Climate Investment Fund (CIF). On average,
TR received the highest amount of funding per capita followed by VGF while the maximum
amount in a single sub-district has been distributed through the VGF program.
Table 2 documents the descriptive statistics of all the independent (RHS) variables.
The mean population size in each sub-district is 0.26 million. The mean probability of low and
high flood-risk assigned to each sub-district is 0.935 and 0.258 respectively. Although the
current ethnic population size is just over 2 million people, 46% of the sub-districts include
some ethnic minorities indicating their dispersal across a wide range of sub-districts. The
political risk dummy indicates that fully 77% of sub-districts are represented by MPs from the

14
ruling party as a consequence of the 2008 general election. 19% of the 483 sub-districts are
in the coastal zone.
We also examine the difference, in the Bangladeshi government’s accounts, between
the allocated vs. realized spending, and whether the two are determined differently. We do
not have a pre-conceived notion of the types of influences that affect the regional allocation
of public spending, but for DRR spending, we assume that these are determined by the
perception of risk, by socio-economic vulnerability, and by political and geographic factors.
Some sub-districts do not receive any funding for some of the DRR programs we
investigate over some fiscal years. Due to this truncation of the data, we employ a two-stage
Heckman selection model to identify the determinants’ of public spending on disaster risk
reduction and mitigation. To construct this two-stage Heckman selection model, we start with
the following premise:
𝑆𝑃𝐸𝑁𝐷𝑖𝑗𝑡𝑥 = 𝑓(𝑟𝑖𝑠𝑘𝑣 , 𝑝𝑜𝑝𝑖𝑡 , 𝑝𝑜𝑣𝑖𝑡 , 𝑑𝑒𝑝𝑖 , 𝐷𝑖) [1]
Public spending (SPEND) in sub-district (i), for program (j), at fiscal year (t), is a function of
several variables. The perceived risk (risk) which is calculated as an index constructed from
past exposure, with low and high thresholds (v). Spending is also a function of the population
(pop) and poverty (pov) rates in the receiving sub-district, and measures of socio-economic
deprivation (dep: measured as access to certain assets – see the data discussion earlier in
section 5). This public spending is also a function of a set of characteristics, measured as binary
variables (vector D), that include political affiliation with the centre, presence of ethnic
minorities, being a district headquarter, belonging to either of the two large metropolitan

15
areas, and a coastal location. The spending variable measures either the allocated or realized
equivalent for each sub-district, fiscal year, and DRR programme (indicated by superscript x).
Our theoretical prior is that these determinants’ should have positive relationship with
sub-district DRR funding allocation. Ceteris paribus, a sub-district with higher perceived risk,
more poverty, less access to assets, more deprivation, more political connections, and a
coastal location should be receiving more DRR funding (either allocated or realized). We are
agnostic regarding several of the other controls, including location as a district headquarter
or as part of the two metropolitan agglomerations, and the presence of ethnic minorities.
Given the truncated nature of this allocation (many sub-districts get nothing), we
estimate the model in two stages. In the first stage, we estimate the probability of getting
funding (𝑆𝑃𝐸𝑁𝐷𝑖𝑗𝑡𝑥 > 0). More formally, the funding selection equation defines the cases
where a particular sub-district has received or been allocated funding in any targeted
program:
𝑧𝑖𝑗𝑡 = {1 𝑖𝑓 𝑆𝑃𝐸𝑁𝐷𝑖𝑗𝑡 > 0
0 𝑖𝑓 𝑆𝑃𝐸𝑁𝐷𝑖𝑗𝑡 = 0 and 𝑧𝑖𝑗𝑡 = 𝛼𝑊𝑖𝑗𝑡 + 𝜀𝑖𝑗𝑡 [2]
Where, 𝑧𝑖𝑗𝑡 is a latent variable indicating funding, and is the dependent variable of the
selection equation [2]. 𝑊𝑖𝑗𝑡 is a vector of covariates, and 𝜀𝑖𝑗𝑡 is the random disturbance term.
The selection variable 𝑧𝑖𝑗𝑡 is binary and we therefore use a probit regression specification to
estimate the first stage selection equation [2]. The second stage specifies the outcome (public
spending) equation where public spending (allocated or realized) is the dependent variable.
The model specification for the second stage equation is as follows:
𝑌𝑖𝑗𝑡 = 𝛽𝑋𝑖𝑗𝑡 + 𝑢𝑖𝑗𝑡 [3]

16
Where 𝑌𝑖𝑗𝑡 is the dependent variable of the outcome equation, 𝑋𝑖𝑗𝑡 is a vector of covariates,
𝛽 is a vector of coefficients and 𝑢𝑖𝑗𝑡 is the random disturbance term. The selection equation
(first stage) includes the population variable which is not included in the outcome equation
(second stage).14
7. Estimation Results
The estimation results for the two-stage Heckman selection model for allocated
spending are documented in tables 3-4. The first two columns show the estimated coefficients
of low and high flood risks along with a set of socio-economic and geo-political controls with
the dependent variable being total allocated spending for per capita disaster risk reduction
spending.15 Columns (3) and (4) present the estimated coefficients for non-obligatory public
funding16 for low- and high- flood risks consecutively, while columns (5) and (6) do the same
for obligatory public funding.17
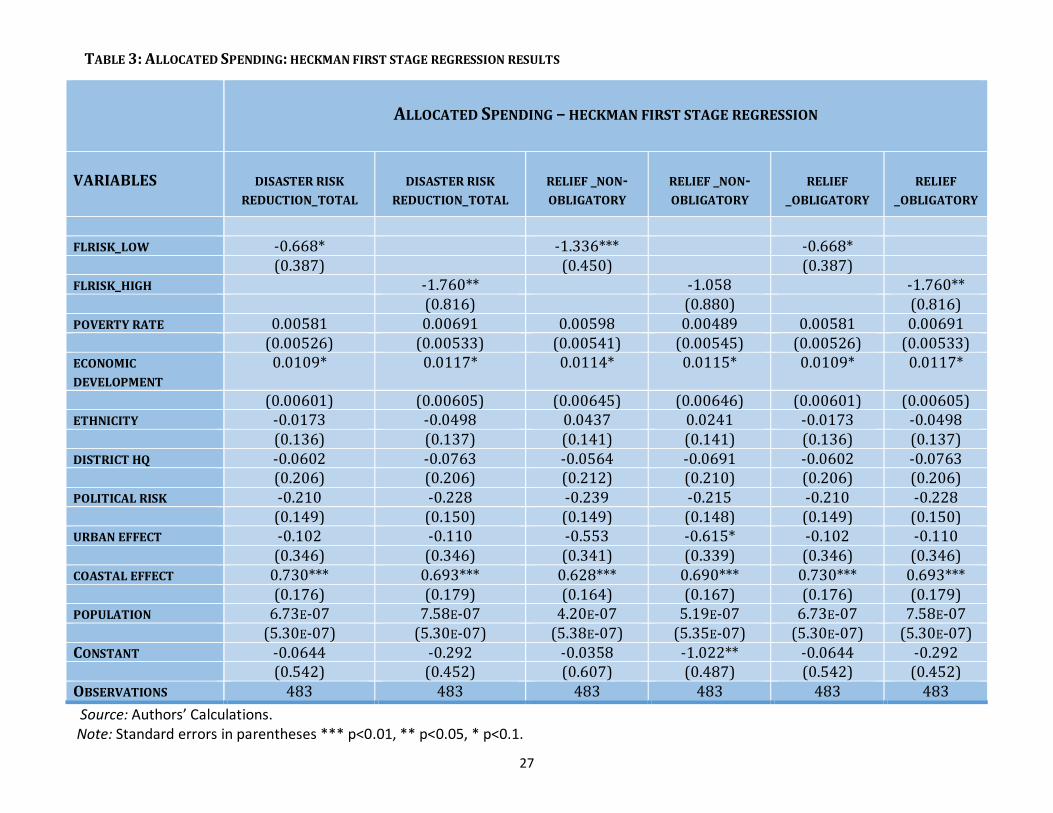
Table 3 reports the results from the first stage selection regression. Among the
independent (RHS) variables; poverty rate, socio-economic status, coastal location, and
population size are found to be sign consistent with our previous predictions. In terms of
statistical significance, coastal location is significant at 1% level in all cases, while economic
development is significant at the 10% level. Interestingly; ethnic minority presence, district
14 Heckman (1979) suggests that the outcome and selection equation are correlated and dependent variable (public spending) of the outcome equation is observed only if the a particular sub-district has received funding in any targeted program which also indicates: ui ~ N (0, σ), εi ~ N (0, 1), corr (ui , εi ) = ρ; where ρ denotes the correlation between errors of the two stages been defined. 15 This refers to the summation of all public funds (per capita) that were allocated for disaster risk reduction in all the previously described programmes except the climate investment fund. We estimated the impacts on the climate fund separately. 16 Non-obligatory per capita public funding are dispersed through targeted safety net programs which do not have work requirements in their structural mechanism. Here, the non-obligatory safety net programs are Gratuitous Relief and Vulnerable Group Feeding. 17 Obligatory public funding are dispersed through programmes which include work requirements. Here, the obligatory programmes are Test Relief, Food For Work and Bridges and Culvert construction.

17
headquarter and urban centre indicator variables all have negative coefficient estimates
(though these are statistically insignificant). The most striking results are for the risk and
political variables. Both perception of low and high flood risk variables appear to have a
counter-intuitive negative relationship with DRR funding allocation with consistent statistical
significance. The political connection to the centre indicator also has a counter-intuitive
negative sign but this estimate is statistically insignificant.
Table 4 presents the second stage estimation where the dependent variable is DRR
per capita allocated funding of the sub-districts which have received funding. The poverty
rate, economic development, and coastal effect again show positive signs (consistently with
our priors) with statistical insignificance. In contrast to our selection estimation, the outcome
for ethnicity and district headquarter showed positive association with DRR funding
allocation. However, as in the first-stage estimations, political connections and flood risks
showed negative association with allocated spending patterns. In particular, a one standard
deviation increase in high flood risk leads to 0.33 standard deviation decrease in predicted
per capita DRR allocated spending compare to 0.38 s.d. decrease in case of low flood risk. This
result is the most intriguing, and we view it as the most important. Taken overall, and in
particular this finding about flood risk measure, our findings suggest there is no evident logic
to the way the Bangladeshi government allocated its DRR funding.
We report the same set of first- and second-stage Heckman selection regressions for
realized funding (rather than allocated funding) in appendix tables 2 and 3 respectively. All
columns in these two tables represent the same set of variables with the dependent variable
being per capita realized funding in DRR. To a large extent, the results are very similar. In
particular, we observe a similar pattern for the two variables we singled out earlier: flood risks

18
and political connection. Again, low and high flood risks tend to show negative relationship
with statistically significant coefficient estimates, while the political connection variable
appears to have a negative association with funding but with statistical significance at 10%
level observed in only one case. A one standard deviation increase in high flood risk leads to
0.39 standard deviation decrease in predicted per capita DRR realized spending compare to
0.38 s.d. decrease in case of low flood risk.
We report Heckman two stage regression results for climate investment fund
separately in tables 5 and 6. The first two columns in table 5 display the determinants of sub-
district wise per capita allocated public spending on climate change. Columns (3) and (4)
portray the impacts on per capita realized public spending for the same set of independent
variables as in columns (1) and (2). In table 5 and among the independent variables; coastal
location, urban centre, and district headquarter shows, once again, sign consistency with our
priors, but with only the coastal location indicator coefficient being highly significant (at 1%
level) in all cases. Poverty rate, socio-economic status, ethnicity and population size are not
similarly consistent. As before, the most intriguing of the reported results are negative
coefficients for flood risk measures and the political connection variable; in this case,
however, the coefficients are not always statistically significantly different from zero.
The second stage regression results for the climate investment fund, in table 6, shows
similar patterns of the earlier table 5. Among the RHS variables; poverty rate, ethnicity, and
the urban centre show sign consistency with no statistical significance. Socio-economic status,
district headquarter, and the coastal location measures show sign inconsistency with the
latter two in contrast with the selection equation results. For the climate investment fund,

19
we no longer observe the counter-intuitive and statistically significant negative coefficients
for flood risks. However, these estimates are also not statistically different from zero.
8. Conclusion
Bangladesh is a low-income country. Its natural disaster risk will not change
dramatically in the near future, though its risk clearly extends beyond the immediate disaster
effects to future impacts associated with climate change. As is true for almost any public
programme of fiscal spending, rational allocation of limited public resources is critical to the
stated aims of the programmes we examine (i.e., enhance households’ coping abilities to
reduce and mitigate disasters risks). Clearly, the effectiveness of prevention spending is
important, and equally obviously the first pre-condition for any effective spending, not
exclusively for DRR, is that this spending is allocated rationally across space.
It is well understood that any government’s public spending decision-making
processes are affected by other considerations rather than need, but the balance between
these competing pressures is not obviously clear. Our objective in this paper is to identify the
determinants’ of publicly allocated and realized spending at the local government (sub-
district) level in Bangladesh. We employ the Heckman two-stage selection model to
empirically estimate the covariates where we assume public spending is a function of the
probability of flood risks, population size, poverty rate, socio-economic development, political
connections, ethnic composition, and details about the geo-location of the sub-district.
While some of our results conform with our priors (where these priors are well
formed), it is surprising to note that the presence of the ruling party’s elected candidates fails
to become a statistically important factor when it is time to attract DRR funding.

20
The most intriguing finding of this study, however, is the response to the sub-district
flood risk probabilities as a factor affecting the DRR financing mechanism. This variable is
consistently counter-intuitively negative and statistically significant. This result, we should
add, is also observed when we do not control for coastal location, when we add other
variables, and when we estimate a simpler linear model.
To summarize, we find little evidence (and some counter-evidence) of any rationale in
the regional funding allocation decisions of the Bangladeshi government. The DRR regional
allocations do not seem to be determined by risk and exposure, and only weakly by
vulnerability. Even obvious and transparent political economy motivations do not seem to
explain much of the variation in inter-regional funding. These funding decisions appear to be
much murkier than we expected them to be. This surprised us, as the Bangladesh DRR
program is considered a poster-child of DRR investments. Of course, our result are about DRR
funding. Whether the same can be said of other types of central government funding in
Bangladesh, or whether this is indeed typical of regional allocations in lower-income countries
are all still open questions that require evidence-based answers.

21
REFERENCES
ADB (2012). People’s Republic of Bangladesh: Capacity Building for Disaster Risk Finance. Asian Development Bank Technical Assistance Report, Project no. 42249.
Aldrich, Daniel (2010). Separate and unequal: post-tsunami aid distribution in Southern India. Social Science Quarterly 91(5):1369-89.
Banerjee, Lopamudra (2007). Effect of Flood on Agricultural Wages in Bangladesh: An Empirical Analysis. World Development 35, 11, pp. 1989–2009.
Bangladesh Gazette (2013). Bangladesh Election Commission. Dhaka. http://www.ecs.gov.bd/NewsFilesEng/101.PDF.
Bangladesh Meteorological Department (BMD). Dhaka. www.bmd.gov.bd.
Benson, Charlotte and Clay, Edward (2002). Bangladesh: Disasters and Public Finance. Disaster Risk Management Working Paper series no. 6. Washington, D.C.: The World Bank. http://documents.worldbank.org/curated/en/2002/11/2432538/bangladesh-disasters-public-finance.
Borensztein, Eduardo, Eduardo Cavallo, Patricio Valenzuela (2009). Debt sustainability under catastrophic risk: the case for government budget insurance. Risk Management and Insurance Review, 12(2), 273-294.
Cohen, C. and Werker, E. D. (2008). The Political Economy of Natural Disasters. Journal of Conflict Resolution, 52(6), 795-819.
Cole, Shawn, Andrew Healy, Eric Werker (2012). Do voters demand responsive governments? Evidence from Indian disaster relief. Journal of Development Economics 97, 167–181.
Cutter, S. L., Emrich, C. T., Webb, J. J., & Morath, D. (2009). Social vulnerability to climate variability hazards: A review of the literature. Final Report to Oxfam America, 1-44.
del Ninno, C., P.A. Dorosh, and L.C. Smith (2003). Public policy, markets and household coping strategies in Bangladesh: Avoiding a food security crisis following the 1998 floods. World Development, 31, 1221-1238.
Department of Disaster Management (DDM). Ministry of Disaster Management and Relief, Government of People’s Republic of Bangladesh, http://www.ddm.gov.bd/.
Election Commission Report (2008). Bangladesh Election Commission. Dhaka. http://www.ecs.gov.bd/MenuExternalFilesEng/304.pdf.
Fuchs, Alan, and Lourdes Rodriguez-Chamussy (2014). Voter response to natural disaster aid: quasi-experimental evidence from drought relief payments in Mexico. World Bank Working Paper 6838.
Garrett, T. and R. Sobel (2003): The political economy of FEMA disaster payments, Economic Inquiry, 41, 496–509.

22
Global Facility for Disaster Reduction and Recovery (2009). Integrating disaster risk reduction into the fight against poverty. UNISDR and World Bank Publications.
Government of Bangladesh (2008). Cyclone Sidr in Bangladesh: Damage, loss and needs assessment for disaster recovery and reconstruction. Dhaka: Government of Bangladesh.
Government of Bangladesh (2010). National Plan for Disaster Management (2010-2015). Dhaka: Disaster Management Bureau, Government of Bangladesh.
Healy, A., & Malhotra, N. (2009). Myopic voters and natural disaster policy. American Political Science Review, 103(03), 387-406.
Heckman J (1979). Sample selection bias as a specification error. Econometrica, 47, pp. 153-61.
Hochrainer-Stigler, Stefan, Reinhard Mechler, Georg Pflug, Keith Williges (2014). Funding public adaptation to climate-related disasters: Estimates for a global fund. Global Environmental Change, 25, 87-96.
Hodler, R. and P. Raschky (2014). Regional Favoritism. Quarterly Journal of Economics, 129(2): 995-1033.
IPCC (2012). Managing the Risks of Extreme Events and Disasters to Advance Climate Change Adaptation. A Special Report of Working Groups I and II of the Intergovernmental Panel on Climate Change [Field, C.B., V. Barros, T.F. Stocker, D. Qin, D.J. Dokken, K.L. Ebi, M.D. Mastrandrea, K.J. Mach, G.-K. Plattner, S.K. Allen, M. Tignor, and P.M. Midgley (eds.)]. Cambridge University Press, Cambridge, UK.
IPCC (2014). Climate Change 2014: Impacts, Adaptation and Vulnerability. Available at http://www.ipcc.ch/report/ar5/wg2/.
International Labour Organization (ILO). Social Security Department. Geneva. http://www.ilo.org/dyn/ilossi/ssimain.schemes?p_lang=en&p_geoaid=50.
Kamaluddin, Abu M. and Kaudstaal, Rob (2003). Delineation of the Coastal Zone. Working paper WP005, Program Development Office for Integrated Coastal Zone Management Plan (PDO-ICZMP), Dhaka.
Kerr, Richard A. (2011). Seismic Crystal Ball Proving Mostly Cloudy Around the World. Science, 332 (6032), 912-913.
Kruse, Ioana, Menno Pradhan, Robert Sparrow, (2012). Marginal benefit incidence of public health spending: Evidence from Indonesian sub-national data. Journal of Health Economics, 31 147– 157.
Khandker, S. R. (2007). Coping with flood: role of institutions in Bangladesh. Agricultural Economics, 36(2), 169-180.
Lis, E.M. and C. Nickel (2010). The impact of extreme weather events on budget balances. International Tax and Public Finance, 17: 378–399.

23
Miller, Sebastian J. and Vela, Mauricio A. (2014). Is Disaster Risk Reduction Spending Driven by the Occurrence of Natural Disasters? Evidence from Peru. Inter-American Development Bank Working Paper Series IDB-WP-500,.
Ministry of Water Resources (MoWR) (2005). Coastal Zone Policy. Ministry of Water Resources, Dhaka, Government of the People’s Republic of Bangladesh.
Munasinghe, Mohan; Clarke, Caroline [editors]; The International Decade for Natural Disaster Reduction (IDNDR) (1995). Disaster prevention for sustainable development: economic and policy issues. Washington, D.C.: The World Bank.
Ministry of Food. Government of People’s Republic of Bangladesh. http://www.mofood.gov.bd.
Noy, Ilan and Nualsri, Aekkanush(2011). Fiscal storms: public spending and revenues in the aftermath of natural disasters. Environment and Development Economics, 16, pp 113-128. doi:10.1017/S1355770X1000046X.
Paul, Bimal K. and Sohini Dutt (2010). Hazard warnings and responses to evacuation orders: the case of Bangladesh's Cyclone Sidr. The Geographical Review, 100.3, 336.
Pelham, L., Clay, E., & Braunholz, T. (2011). Natural disasters: what is the role for social safety nets? SP Discussion Paper No.1102, World Bank Publications.
Population and Housing Census of Bangladesh (2011). Bangladesh Bureau of Statistics. Dhaka. http://www.bbs.gov.bd.
Rahman, H.Z. and Choudhury, L.A. (2012). Social Safety Nets in Bangladesh. PPRC-UNDP Publications.
Rajkumar, Andrew Sunil, Vinaya Swaroop (2008). Public spending and outcomes: Does governance matter? Journal of Development Economics, 86, 96–111.
Ramirez, Miguel D. (2004). Is public infrastructure spending productive in the Mexican case? A vector error correction analysis. J. Int. Trade & Economic Development, 13:2 159–178.
Sennoga, Edward Batte and John Mary Matovu (2013). Public Spending Composition in Uganda and its Implications for Growth and Poverty Reduction. Public Finance Review, 41(2) 227-247.
Shamsuddoha, M., Roberts, E., Hasemann, A., & Roddick, S. (2013). Establishing Links between Disaster Risk Reduction and Climate Change Adaptation in the Context of Loss and Damage. Available at http://indiaenvironmentportal.org.in/files/file/establishing-links-disaster-risk-reduction-n-climate-change-adaptation-in-context-of-loss-n-damage.pdf.
Takasaki, Y. (2011). Do Local Elites Capture Natural Disaster Reconstruction Funds? Journal of Development Studies, 47(9): 1281–1298.
Tapsell, S; McCarthy, S; Faulkner, H & Alexander, M (2010). Social Vulnerability and Natural Hazards. CapHaz-Net WP4 Report, Flood Hazard Research Centre – FHRC, Middlesex University, London.
24
United Nations Capital Development Fund (2011). Effective Financial Mechanisms at the national and local level for Disaster Risk Reduction. Paper written for the mid-term review of the UNISDR Hyogo Framework for Action.
United Nations International Strategy for Disaster Reduction. News Archive. December 30, 2013. http://www.unisdr.org/archive/35997.
UNISDR (2009a). UNISDR terminology on disaster risk reduction. Geneva: UNISDR.
UNISDR (2009b). Adaptation to Climate Change by Reducing Disaster Risks: Country Practices and Lessons. United Nation Publications.
World Bank (2010). Natural Hazards, UnNatural Disasters. World Bank Publications.
Williams, Gareth (2011). The Political Economy of Disaster Risk Reduction. Analysis prepared for UNDPs contribution to the Global Assessment Report on Disaster Risk Reduction 2011.

25
TABLE 1: DESCRIPTIVE STATISTICS A: LEFT-HAND SIDE VARIABLES
Source: Authors’ Calculations. Note: The acronyms used here represents test relief, food for work, infrastructure, gratuitous relief, vulnerable group feeding and climate investment fund respectively. Allocated and realized for each safety net program indicates total (per capita) amount of public fund been allocated and total (per capita) amount of public fund been spent out of total allocation in disaster risk reduction consecutively. The currency unit is in BDT (Bangladeshi Taka) [1 USD = 75.79 BDT].
VARIABLES
OBSERVATION
MEAN
STANDARD DEVIATION
MINIMUM
MAXIMUM
TR_ALLOCATED 483 12.37298 17.5886 0 137.6302
TR_REALIZED 483 9.809799 14.28539 0 95.31361
FFW_ALLOCATED 483 5.443759 13.4828 0 126.3999
FFW_REALIZED 483 3.819665 9.05842 0 90.41516
INFRA_ALLOCATED 483 3.15629 9.593239 0 102.8087
INFRA_REALIZED 483 1.96463 7.554146 0 102.8087
GR_ALLOCATED 483 2.145435 20.45798 0 374.9262
GR_REALIZED 483 1.607032 17.19828 0 374.9262
VGF_ALLOCATED 483 5.799361 42.9692 0 921.9801
VGF_REALIZED 483 5.967508 43.00797 0 921.9801
CIF_ALLOCATED 483 1.28391 5.476021 0 58.71323
CIF_REALIZED 483 0.9925554 4.739405 0 58.46924

26
TABLE 2: DESCRIPTIVE STATISTICS B: RIGHT-HAND SIDE VARIABLES
VARIABLES
OBSERVATION
MEAN
STANDARD DEVIATION
MINIMUM
MAXIMUM
POPULATION 483 255833.4 138584.8 17152 941005
FLRISK_LOW 483 0.9347943 0.156718 0.6818 1.909
FLRISK_HIGH 483 0.2577505 0.078411 0.123 0.7272
POVERTY RATE 483 28.3388 13.23799 1.9 68
ECONOMIC
DEVELOPMENT 483 52.60449 11.12422 8.1 73.5
ETHNICITY 483 0.4637681 0.499203 0 1
DISTRICT HQ 483 0.1325052 0.339391 0 1
POLITICAL RISK 483 .7763975 .4170906 0 1
URBAN EFFECT 483 0.0393375 0.194598 0 1
COASTAL EFFECT 483 0.1904762 0.393084 0 1
Source: Authors’ Calculations.
27
TABLE 3: ALLOCATED SPENDING: HECKMAN FIRST STAGE REGRESSION RESULTS
ALLOCATED SPENDING – HECKMAN FIRST STAGE REGRESSION
VARIABLES
DISASTER RISK
REDUCTION_TOTAL
DISASTER RISK
REDUCTION_TOTAL
RELIEF _NON-OBLIGATORY
RELIEF _NON-OBLIGATORY
RELIEF
_OBLIGATORY
RELIEF
_OBLIGATORY
FLRISK_LOW -0.668* -1.336*** -0.668* (0.387) (0.450) (0.387) FLRISK_HIGH -1.760** -1.058 -1.760** (0.816) (0.880) (0.816) POVERTY RATE 0.00581 0.00691 0.00598 0.00489 0.00581 0.00691 (0.00526) (0.00533) (0.00541) (0.00545) (0.00526) (0.00533) ECONOMIC
DEVELOPMENT 0.0109* 0.0117* 0.0114* 0.0115* 0.0109* 0.0117*
(0.00601) (0.00605) (0.00645) (0.00646) (0.00601) (0.00605) ETHNICITY -0.0173 -0.0498 0.0437 0.0241 -0.0173 -0.0498 (0.136) (0.137) (0.141) (0.141) (0.136) (0.137) DISTRICT HQ -0.0602 -0.0763 -0.0564 -0.0691 -0.0602 -0.0763 (0.206) (0.206) (0.212) (0.210) (0.206) (0.206) POLITICAL RISK -0.210 -0.228 -0.239 -0.215 -0.210 -0.228 (0.149) (0.150) (0.149) (0.148) (0.149) (0.150) URBAN EFFECT -0.102 -0.110 -0.553 -0.615* -0.102 -0.110 (0.346) (0.346) (0.341) (0.339) (0.346) (0.346) COASTAL EFFECT 0.730*** 0.693*** 0.628*** 0.690*** 0.730*** 0.693*** (0.176) (0.179) (0.164) (0.167) (0.176) (0.179) POPULATION 6.73E-07 7.58E-07 4.20E-07 5.19E-07 6.73E-07 7.58E-07 (5.30E-07) (5.30E-07) (5.38E-07) (5.35E-07) (5.30E-07) (5.30E-07) CONSTANT -0.0644 -0.292 -0.0358 -1.022** -0.0644 -0.292 (0.542) (0.452) (0.607) (0.487) (0.542) (0.452) OBSERVATIONS 483 483 483 483 483 483
Source: Authors’ Calculations. Note: Standard errors in parentheses *** p<0.01, ** p<0.05, * p<0.1.

28
TABLE 4: ALLOCATED SPENDING: HECKMAN SECOND STAGE REGRESSION RESULTS
ALLOCATED SPENDING – HECKMAN SECOND STAGE REGRESSION
VARIABLES
DISASTER RISK
REDUCTION_TOTAL
DISASTER RISK
REDUCTION_TOTAL
RELIEF _NON-OBLIGATORY
RELIEF _NON-OBLIGATORY
RELIEF
_OBLIGATORY
RELIEF
_OBLIGATORY FLRISK_LOW -162.3 -262.0 -97.41 (126.5) (382.8) (72.45) FLRISK_HIGH -282.5 -226.3 -126.2 (257.8) (277.3) (128.8) POVERTY RATE 1.651 1.729 1.876 1.667 0.652 0.597 (1.362) (1.298) (2.066) (1.536) (0.780) (0.649) ECONOMIC DEVELOPMENT
0.752 0.804 1.260 1.134 0.362 0.256
(2.104) (1.908) (3.552) (2.814) (1.205) (0.954) ETHNICITY 15.70 12.43 35.07 31.93 -3.257 -5.000 (25.73) (23.76) (35.83) (29.86) (14.73) (11.87) DISTRICT HQ 15.50 15.09 4.756 5.749 12.03 11.08 (34.87) (32.34) (42.29) (37.71) (19.97) (16.16) POLITICAL RISK -39.52 -39.02 -51.82 -46.43 -19.00 -15.95 (39.84) (36.94) (68.66) (52.19) (22.81) (18.46) URBAN EFFECT -35.03 -36.91 -97.73 -97.80 -13.65 -14.88 (59.25) (55.23) (148.6) (128.1) (33.93) (27.60) COASTAL EFFECT 91.51 84.87 110.1 107.9 41.50 34.06 (92.61) (74.96) (153.2) (130.9) (53.03) (37.46) CONSTANT -32.05 -103.1 -107.6 -254.1 10.87 -24.05 (217.3) (204.3) (303.9) (423.3) (124.4) (102.1) LAMBDA 216.9 202.7 228.4 204.4 124.2 101.3 (232.7) (195.6) (358.6) (274.1) (133.2) (97.76) OBSERVATIONS 483 483 483 483 483 483
Source: Authors’ Calculations. Note: Standard errors in parentheses *** p<0.01, ** p<0.05, * p<0.1.

29
TABLE 5: CLIMATE INVESTMENT FUND: HECKMAN FIRST STAGE REGRESSION RESULTS
CLIMATE INVESTMENT FUND - HECKMAN FIRST STAGE REGRESSION
VARIABLES ALLOCATED
SPENDING
ALLOCATED
SPENDING
REALIZED
SPENDING
REALIZED
SPENDING
FLRISK_LOW -0.653 -0.353 (1.011) (0.995) FLRISK_HIGH -1.773 -1.764 (2.096) (2.201) POVERTY RATE -0.00991 -0.0105 -0.00940 -0.00948 (0.00903) (0.00893) (0.00908) (0.00899) ECONOMIC DEVELOPMENT
-0.0191* -0.0181* -0.0212** -0.0198*
(0.00975) (0.00991) (0.0100) (0.0101) ETHNICITY -1.155*** -1.189*** -1.022*** -1.055*** (0.373) (0.376) (0.368) (0.372) DISTRICT HQ 0.191 0.178 0.244 0.236 (0.375) (0.375) (0.379) (0.378) POLITICAL RISK -0.460* -0.480* -0.344 -0.358 (0.277) (0.279) (0.283) (0.287) URBAN EFFECT 0.120 0.119 0.132 0.152 (0.473) (0.469) (0.472) (0.469) COASTAL EFFECT 2.044*** 2.014*** 2.054*** 2.009*** (0.262) (0.266) (0.266) (0.267) POPULATION -1.36e-06 -1.30e-06 -1.19e-06 -1.15e-06 (1.08e-06) (1.07e-06) (1.08e-06) (1.08e-06) CONSTANT 0.604 0.433 0.214 0.277 (1.084) (0.830) (1.079) (0.842) OBSERVATIONS 483 483 483 483
Source: Authors’ Calculations. Note: Standard errors in parentheses *** p<0.01, ** p<0.05, * p<0.1.

30
TABLE 6: CLIMATE INVESTMENT FUND: HECKMAN SECOND STAGE REGRESSION RESULTS
CLIMATE INVESTMENT FUND - HECKMAN SECOND STAGE REGRESSION
VARIABLES ALLOCATED
SPENDING
ALLOCATED
SPENDING
REALIZED
SPENDING
REALIZED
SPENDING
FLRISK_LOW 7.311 28.92
(26.69) (25.74) FLRISK_HIGH 67.83 73.88 (53.90) (60.44) POVERTY RATE 0.208 0.201 0.232 0.223 (0.201) (0.214) (0.186) (0.226) ECONOMIC DEVELOPMENT
-0.163 -0.251 -0.329 -0.274
(0.318) (0.317) (0.357) (0.382) ETHNICITY 5.920 5.936 3.200 5.636 (16.04) (17.06) (14.71) (17.64) DISTRICT HQ -6.950 -6.612 -4.799 -5.124 (5.857) (6.068) (5.345) (6.469) POLITICAL RISK 8.735 9.068 8.268 8.481 (6.698) (7.123) (5.468) (6.791) URBAN EFFECT 3.509 3.966 6.888 5.218 (8.478) (8.574) (7.912) (9.158) COASTAL EFFECT -16.35 -17.99 -10.78 -20.71 (28.15) (28.08) (30.36) (32.97) CONSTANT 32.25 31.07 10.40 31.30 (30.26) (20.98) (33.93) (24.59) LAMBDA -14.71 -16.39 -11.47 -17.28 (17.77) (18.32) (18.71) (21.27) OBSERVATIONS 483 483 483 483
Source: Authors’ Calculations. Note: Standard errors in parentheses *** p<0.01, ** p<0.05, * p<0.1.
31
APPENDIX TABLE 1: DESCRIPTION OF VARIABLES DEFINED AND THEIR SOURCES
NO.
VARIABLES
DESCRIPTION
SOURCE
1 POPULATION The total number of people residing in each sub-district.
Department of Disaster Management, Government of Bangladesh.
2 TR_ALLOCATED The total (per capita) amount of public fund been allocated in disaster risk reduction through test relief program.
Ministry of Food (Former Ministry of Food and Disaster Management), Government of Bangladesh.
3 TR_REALIZED The total (per capita) amount of public fund been spent out of total allocation in disaster risk reduction through test relief program.
Ministry of Food (Former Ministry of Food and Disaster Management), Government of Bangladesh.
4 FFW_ALLOCATED The total (per capita) amount of public fund been allocated in disaster risk reduction through Food For Work program.
Ministry of Food (Former Ministry of Food and Disaster Management), Government of Bangladesh.
5 FFW_REALIZED The total (per capita) amount of public fund been spent out of total allocation in disaster risk reduction through Food For Work program.
Ministry of Food (Former Ministry of Food and Disaster Management), Government of Bangladesh.
6 INFRA_ALLOCATED The total (per capita) amount of public fund been allocated in bridges and culvert construction under Food For Work program.
Ministry of Food (Former Ministry of Food and Disaster Management), Government of Bangladesh.
7 INFRA_REALIZED The total (per capita) amount of public fund been spent out of total allocation in bridges and culvert construction under Food For Work program.
Ministry of Food (Former Ministry of Food and Disaster Management), Government of Bangladesh.
8 GR_ALLOCATED The total (per capita) amount of public fund been allocated in disaster risk reduction through gratuitous relief program.
Ministry of Food (Former Ministry of Food and Disaster Management), Government of Bangladesh.
9 GR_REALIZED The total (per capita) amount of public fund been spent out of total allocation in disaster risk reduction through gratuitous relief program.
Ministry of Food (Former Ministry of Food and Disaster Management), Government of Bangladesh.

32
10 VGF_ALLOCATED The total (per capita) amount of public fund been allocated in disaster risk reduction through vulnerable group feeding program.
Ministry of Food (Former Ministry of Food and Disaster Management), Government of Bangladesh.
11 VGF_REALIZED The total (per capita) amount of public fund been spent out of total allocation in disaster risk reduction through vulnerable group feeding program.
Ministry of Food (Former Ministry of Food and Disaster Management), Government of Bangladesh.
12 CIF_ALLOCATED The total (per capita) amount of public fund been allocated in climate investment fund to combat climate change induced risks.
Ministry of Food (Former Ministry of Food and Disaster Management), Government of Bangladesh.
13 CIF_REALIZED The total (per capita) amount of public fund been spent out of total allocation in climate investment fund to combat climate change induced risks.
Ministry of Food (Former Ministry of Food and Disaster Management), Government of Bangladesh.
14 FLRISK_LOW Also defined as ‘low flood risk’. The number of times each sub-district is likely to incur flood risk each year. The threshold is the number of months each sub-district has total rainfall higher than 15% of average annual rainfall and more than 1 standard deviation above the mean divided by the number of years’ rainfall data has been recorded for each weather station corresponding to each sub-district out of 64 year time span.
Bangladesh Meteorological Department (BMD) rainfall data of 64 years (1948-2012) for 35 weather stations of Bangladesh.
15 FLRISK_HIGH Also defined as ‘high flood risk’. The number of times each sub-district is likely to incur flood risk each year. The threshold is the number of months each sub-district has total rainfall higher than 20% of average annual rainfall and more than 2 standard deviation above the mean divided by the number of years’ rainfall data has been recorded for each weather station corresponding to each sub-district out of 64 year time span.
Bangladesh Meteorological Department (BMD) rainfall data of 64 years (1948-2012) for 35 weather stations of Bangladesh.
16 POVERTY RATE The number of people living below the national poverty line of US$ 2 per day.
Department of Disaster Management, Government of Bangladesh.
17 ECONOMIC
DEVELOPMENT
This is a composite variable averaging the percentage of population under each sub-district to get access to safe drinking water, sanitation facilities and electricity.
Population and Housing Census of Bangladesh, 2011.

33
18 ETHNICITY Dummy variable; 1 if indigenous ethnic minorities resides in any sub-district, 0 otherwise.
Authors’ elaborations using Population and Housing Census of Bangladesh, 2011.
19 DISTRICT HQ Dummy variable; 1 if the sub-district is central (in most cases, bigger population size and main economic centre) in any particular district, 0 otherwise.
Authors’ elaborations.
20 POLITICAL RISK Dummy variable; 1 if the Member of Parliament (MP) is from the main political party in power, 0 otherwise.
Authors’ elaborations using Bangladesh Election Commission Report, 2008 and Bangladesh Gazette (2013).
21 URBAN EFFECT Dummy variable; 1 if the sub-district belongs to the bigger urban cities; Dhaka or Chittagong, 0 otherwise.
Authors’ elaborations.
22 COASTAL EFFECT Dummy variable; 1 if the sub-district belongs to any districts
situated in the coastal belts a, 0 otherwise.
Authors’ elaborations.
Source: Authors’ elaborations. Note: a ‘Coastal Zone’ is most frequently defined as land affected by its proximity to the sea and that part of the sea affected by its proximity to the
land (Kamaluddin and Kaudstaal, 2003). According to the Coastal Zone Policy (2005) of the Government of Bangladesh (GOB), the zone is divided into
‘exposed coast’ (the area/upazilas that embraces the sea directly and is subject to be affected highly by the anticipated sea level rise, also known as
first tier coastal upazilas) and ‘interior coast’ (the area/upazilas that are located behind the exposed coast, can also be sub-divided into second and
third tier coastal upazilas). Here, we consider the first and second tier coastal upazilas to create the ‘coastal effect’ dummy variable.

34
APPENDIX TABLE 2: REALIZED SPENDING: HECKMAN FIRST STAGE REGRESSION RESULTS
REALIZED SPENDING – HECKMAN FIRST STAGE REGRESSION
VARIABLES
DISASTER RISK
REDUCTION_TOTAL
DISASTER RISK
REDUCTION_TOTAL
RELIEF_NON-
OBLIGATORY
RELIEF_NON-
OBLIGATORY
RELIEF_
OBLIGATORY
RELIEF_
OBLIGATORY
FLRISK_LOW -0.732* -1.269*** -0.726* (0.388) (0.448) (0.388) FLRISK_HIGH -1.887** -0.923 -1.582* (0.818) (0.878) (0.815) POVERTY RATE 0.00608 0.00721 0.00591 0.00475 0.00586 0.00654 (0.00526) (0.00533) (0.00541) (0.00546) (0.00525) (0.00532) ECONOMIC DEVELOPMENT
0.00987 0.0107* 0.0130** 0.0131** 0.00908 0.00970
(0.00601) (0.00605) (0.00649) (0.00649) (0.00600) (0.00604) ETHNICITY 0.00491 -0.0300 0.0612 0.0439 0.00713 -0.0227 (0.136) (0.137) (0.141) (0.142) (0.136) (0.137) DISTRICT HQ -0.0443 -0.0618 -0.0498 -0.0619 -0.0809 -0.0973 (0.207) (0.206) (0.211) (0.210) (0.206) (0.206) POLITICAL RISK -0.191 -0.210 -0.256* -0.231 -0.142 -0.151 (0.149) (0.149) (0.149) (0.148) (0.148) (0.149) URBAN EFFECT -0.0910 -0.100 -0.541 -0.602* -0.0764 -0.0914 (0.346) (0.346) (0.341) (0.339) (0.346) (0.346) COASTAL EFFECT 0.737*** 0.699*** 0.575*** 0.641*** 0.762*** 0.741*** (0.176) (0.179) (0.164) (0.167) (0.176) (0.178) POPULATION 7.08E-07 8.00E-07 4.10E-07 5.04E-07 7.73E-07 8.58E-07 (5.30E-07) (5.31E-07) (5.38E-07) (5.35E-07) (5.30E-07) (5.30E-07) CONSTANT -0.00818 -0.266 -0.176 -1.131** -0.0395 -0.356 (0.543) (0.453) (0.608) (0.489) (0.543) (0.452) OBSERVATIONS 483 483 483 483 483 483
Source: Authors’ Calculations. Note: Standard errors in parentheses *** p<0.01, ** p<0.05, * p<0.1.

35
APPENDIX TABLE 3: REALIZED SPENDING: HECKMAN SECOND STAGE REGRESSION RESULTS
REALIZED SPENDING – HECKMAN SECOND STAGE REGRESSION
VARIABLES
DISASTER RISK
REDUCTION_TOTAL
DISASTER RISK
REDUCTION_TOTAL
RELIEF_
NON-OBLIGATORY
RELIEF_
NON-OBLIGATORY
RELIEF_
OBLIGATORY
RELIEF_
OBLIGATORY
FLRISK_LOW -144.2 -242.2 -77.22 (131.9) (380.7) (64.50) FLRISK_HIGH -292.0 -196.5 -123.6 (265.5) (281.5) (108.9) POVERTY RATE 1.665 1.767 1.874 1.681 0.612 0.605 (1.367) (1.307) (2.145) (1.669) (0.668) (0.582) ECONOMIC DEVELOPMENT
0.834 0.904 1.745 1.671 0.243 0.217
(1.960) (1.794) (4.102) (3.413) (0.921) (0.782) ETHNICITY 22.23 18.37 39.15 36.52 0.993 -0.781 (26.47) (24.13) (39.73) (34.43) (13.55) (11.43) DISTRICT HQ 17.06 16.47 6.029 6.977 10.67 10.14 (35.62) (33.08) (43.66) (40.99) (17.75) (15.31) POLITICAL RISK -39.40 -40.08 -57.33 -53.14 -14.69 -14.03 (37.55) (35.14) (75.73) (60.39) (16.92) (14.69) URBAN EFFECT -31.40 -32.29 -100.4 -104.3 -9.222 -10.44 (59.03) (55.39) (152.8) (139.5) (29.93) (25.94) COASTAL EFFECT 93.27 84.62 103.2 106.7 41.59 35.43 (90.62) (73.34) (148.6) (135.8) (44.75) (34.85) CONSTANT -68.70 -121.4 -157.1 -308.3 -6.978 -33.44 (205.1) (195.7) (352.5) (492.6) (100.0) (91.88) LAMBDA 216.7 203.7 234.9 221.4 110.1 95.49 (224.6) (188.6) (374.6) (303.2) (106.5) (83.93) OBSERVATIONS 483 483 483 483 483 483
Source: Authors’ Calculations. Note: Standard errors in parentheses *** p<0.01, ** p<0.05, * p<0.1.