Embed Size (px)
Citation preview

R.C.S. Luxembourg B 168.502
SEF Société d’Investissement à Capital Variable à compartiments multiples
Annual report including audited financial statements as at December 31, 2018


SEF
Annual report including audited financial statements as at December 31, 2018
No subscription can be received on the basis of financial statements. Subscriptions are only valid on the basis of the current Prospectus, the Key Investor Information Document, accompanied by the latest annual report including audited financial statements and the latest unaudited semi-annual report if it is more recent than the financial statements.
1

SEF
Table of contents
2
Organisation of the SICAV 4
General information 7
Determination of the Net Asset Value of shares 8
Information to shareholders 8
Report of the Board of Directors 9
Report of the réviseur d’entreprises agréé 21
Financial statements
Statement of net assets 24
Statement of operations and changes in net assets 30
Number of shares outstanding and net asset value per share 36
SEF - PLACERUM BALANSERAD
Statement of Investments and other net assets 37
SEF - PLACERUM DYNAMISK
Statement of Investments and other net assets 38
SEF - PLACERUM OPTIMERA
Statement of Investments and other net assets 39
SEF - ASCENSUS BALANSERAD
Statement of Investments and other net assets 41
SEF - ASCENSUS OFFENSIV
Statement of Investments and other net assets 42
SEF - ASCENSUS TREND
Statement of Investments and other net assets 43
SEF - LHV PERSIAN GULF FUND
Statement of Investments and other net assets 44
SEF - KUYLENSTIERNA & SKOG EQUITIES
Statement of Investments and other net assets 46
SEF - ENTROPICS CAT BOND FUND
Statement of Investments and other net assets 48

SEF
Table of contents (continued)
3
SEF - EME EUROPEAN BEST IDEAS
Statement of Investments and other net assets 50
SEF - PENSER DYNAMISK ALLOKERING
Statement of Investments and other net assets 52
SEF - KAVALJER MULTI Statement of Investments and other net assets 55
SEF - FIRST ALLOKERING
Statement of Investments and other net assets 57
SEF - FIRST SMB
Statement of Investments and other net assets 59
SEF - AKTIV FINANS EGAS DYNAMIC PORTFOLIO
Statement of Investments and other net assets 60
SEF - CASE POWER PLAY
Statement of Investments and other net assets 61
SEF - KRAFT GLOBAL
Statement of Investments and other net assets 62
SEF - INDEPENDENT INVESTMENTBOLAGSFOND
Statement of Investments and other net assets 64
Notes to the financial statements 66
Unaudited Appendix 79
SEF
4
Organisation of the SICAV
REGISTERED OFFICE SEF, 65, Boulevard Grande-Duchesse Charlotte L-1331 LUXEMBOURG, Grand-Duchy of Luxembourg
BOARD OF DIRECTORS
Chairman Ms TIINA NORBERG, Global Head of Securities Services - Swedbank AB (publ), Landsvägen 40, SE-105 34 STOCKHOLM, Sweden
Directors Ms ÖZGÜL GÜLBEY, Head of Legal and Conducting Officer, Swedbank Management Company S.A., 65 Boulevard Grande-Duchesse Charlotte, L-1331 LUXEMBOURG, Grand-Duchy of Luxembourg
Mr CARL-JOHAN JOHANSSON, Head of Financial Risks, Change Management, Swedbank AB (publ), Landsvägen 40, SE-105 34 STOCKHOLM, Sweden
Ms AET RÄTSEPP, Head of Fund Services - Swedbank AS, Liivalaia 8, 15040 TALLINN, Estonia
MANAGEMENT COMPANY AND DOMICILIARY AGENT
SWEDBANK MANAGEMENT COMPANY S.A., 65, Boulevard Grande-Duchesse Charlotte, L-1331 LUXEMBOURG, Grand-Duchy of Luxembourg
BOARD OF DIRECTORS OF THE MANAGEMENT COMPANY
Chairman Mr BERND SCHUSTA, Consultant, Neuhausstrasse 34, D-61440 OBERURSEL, Germany
Directors Ms ÖZGÜL GÜLBEY, Head of Legal and Conducting Officer, Swedbank Management Company S.A., 65 Boulevard Grande-Duchesse Charlotte, L-1331 LUXEMBOURG, Grand-Duchy of Luxembourg
Ms ANN-CHARLOTTE LAWYER, Head of Swedbank Management Company S.A. and Conducting Officer, Swedbank Management Company S.A., 65, Boulevard Grande-Duchesse Charlotte, L-1331 LUXEMBOURG, Grand-Duchy of Luxembourg
CONDUCTING OFFICERS OF THE MANAGEMENT COMPANY
Ms ÖZGÜL GÜLBEY, Head of Legal and Conducting Officer, Swedbank Management Company S.A., 65, Boulevard Grande-Duchesse Charlotte, L-1331 LUXEMBOURG, Grand-Duchy of Luxembourg
Ms ANN-CHARLOTTE LAWYER, Head of Swedbank Management Company S.A. and Conducting Officer, Swedbank Management Company S.A., 65, Boulevard Grande-Duchesse Charlotte, L-1331 LUXEMBOURG, Grand-Duchy of Luxembourg
Mr FRANCOIS WATELET, Conducting Officer, Swedbank Management Company S.A., 65, Boulevard Grande-Duchesse Charlotte, L-1331 LUXEMBOURG, Grand-Duchy of Luxembourg
Mr MARIO ZARDONI, Conducting Officer, Swedbank Management Company S.A., 65, Boulevard Grande-Duchesse Charlotte, L-1331 LUXEMBOURG, Grand-Duchy of Luxembourg (until March 31, 2018)
REVISEUR D’ENTREPRISES AGREE / CABINET DE REVISION AGREE
DELOITTE AUDIT, Société à responsabilité limitée, 560, Rue de Neudorf, L-2220 LUXEMBOURG, Grand-Duchy of Luxembourg

SEF
5
INVESTMENT MANAGER In respect of SEF - PLACERUM BALANSERAD, SEF - PLACERUM DYNAMISK and SEF -PLACERUM OPTIMERA
PLACERUM KAPITALFÖRVALTNING AB, Skolgatan 64C SE-903 29 UMEÅ, Sweden
In respect of SEF - ASCENSUS BALANSERAD, SEF - ASCENSUS OFFENSIV and SEF - ASCENSUS TREND
UNITED SECURITIES AB, P.O. Box 7561 SE-103 93 STOCKHOLM, Sweden
In respect of SEF - LHV PERSIAN GULF FUND
AS LHV VARAHALDUS, Tartu mnt 2 10145 TALLINN, Estonia
In respect of SEF - KUYLENSTIERNA & SKOG EQUITIES
KUYLENSTIERNA & SKOG S.A., 26, Rue Philippe II L-2340 LUXEMBOURG, Grand-Duchy of Luxembourg
In respect of SEF - ENTROPICS CAT BOND FUND
ENTROPICS ASSET MANAGEMENT AB, P.O. Box 5198 SE-102 44 STOCKHOLM, Sweden
In respect of SEF - EME EUROPEAN BEST IDEAS
EME PARTNERS AB, EPICENTER, MÄSTER SAMUELSGATAN 36, SE-111 57 STOCKHOLM, SWEDEN
In respect of SEF - PENSER DYNAMISK ALLOKERING
ERIK PENSER BANK AB, P.O. Box 7405 SE-103 91 STOCKHOLM, Sweden
In respect of SEF - MIMER SVERIGE (absorbed on April 3, 2018), SEF - GAIA GLOBAL (absorbed on April 3, 2018)
MONYX ASSET MANAGEMENT, P.O. Box 55989 SE-102 16 STOCKHOLM, Sweden
In respect of SEF - KAVALJER MULTI
KAVALJER AB, Järnvägsgatan 36 SE-131 54 NACKA, Sweden
In respect of SEF – AKTIV FINANS EGAS DYNAMIC PORTFOLIO
AKTIV FINANS VÄRDEPAPPERSBOLAG I SVERIGE AB, Platensgatan 9C SE-582 20 LINKÖPING, Sweden
In respect of SEF – CASE POWER PLAY
CASE KAPITALFÖRVALTNING AB, P.O. Box 5352 SE-102 49 STOCKHOLM, Sweden
In respect of SEF – FIRST ALLOKERING and SEF - FIRST SMB
FIRST FONDENE AS, Munkedamsveien 45E, NO-0250 Oslo, Norway

SEF
6
In respect of SEF - KRAFT GLOBAL (launched on May 22, 2018)
KRAFT FINANS AS, Trim Towers, Larsamyrå 18 NO-4313 SANDES, Norway
In respect of SEF - INDEPENDENT INVESTMENTBOLAGSFOND (launched on May 14, 2018)
INDEPENDENT INVESTMENT GROUP SWEDEN AKTIEBOLAG, Nygatan 35 SE-582 19 LINKÖPING, Sweden
ADMINISTRATOR / DEPOSITARY BANK / PAYING AGENT IN LUXEMBOURG / REGISTRAR AND TRANSFER AGENT
SWEDBANK AB (publ) Luxembourg Branch, 65, Boulevard Grande Duchesse Charlotte L-1331 LUXEMBOURG, Grand-Duchy of Luxembourg
DISTRIBUTOR SWEDBANK AB (publ), Landsvägen 40, SE-105 34 STOCKHOLM, Sweden
In respect of SEF – FIRST ALLOKERING and SEF – FIRST SMB
FIRST FONDENE AS, Munkedamsveien 45E, NO-0250 Oslo, Norway
PAYING AGENT IN SWEDEN
SWEDBANK AB (publ), Landsvägen 40, SE-105 34 STOCKHOLM, Sweden
LEGAL ADVISORS CLIFFORD CHANCE, 10, Boulevard Grande Duchesse Charlotte L-1331 LUXEMBOURG, Grand-Duchy of Luxembourg

SEF
7
General information
SEF (the "SICAV") was incorporated in the Grand Duchy of Luxembourg on April 25, 2012. It is organized as a variable capital investment company (société d’investissement à capital variable: "SICAV") under the amended Law of August 10, 1915 relating to commercial companies and Part I of the Law of December 17, 2010, relating to undertakings for collective investment in transferable securities, as amended. It is established for an undetermined duration from the date of incorporation.
The main objective of the SICAV is to provide a range of sub-funds combined with active professional management to diversify investment risk and satisfy the needs of investors seeking income, capital conservation and longer term capital growth.
At the date of the report, the following sub-funds are offered to investors:
SEF - PLACERUM BALANSERAD SEF - PLACERUM DYNAMISK SEF - PLACERUM OPTIMERA SEF - ASCENSUS BALANSERAD SEF - ASCENSUS OFFENSIV SEF - ASCENSUS TREND SEF - LHV PERSIAN GULF FUND SEF - KUYLENSTIERNA & SKOG EQUITIES SEF - ENTROPICS CAT BOND FUND SEF - EME EUROPEAN BEST IDEAS SEF - PENSER DYNAMISK ALLOKERING SEF - KAVALJER MULTI SEF - FIRST ALLOKERING SEF - FIRST SMB SEF - AKTIV FINANS EGAS DYNAMIC PORTFOLIO SEF - CASE POWER PLAY SEF - KRAFT GLOBAL (launched on May 22, 2018) SEF - INDEPENDENT INVESTMENTBOLAGSFOND (launched on May 14, 2018)
SEF - ASCENSUS BALANSERAD (Class A and Class I), SEF - ASCENSUS OFFENSIV (Class A and Class I) and SEF - ASCENSUS TREND (Class A and Class I) have been launched on
April 5, 2013.
SEF - PLACERUM BALANSERAD (Class A and Class I), SEF - PLACERUM DYNAMISK (Class A and Class I) and SEF - PLACERUM OPTIMERA (Class A and Class I) have been launched on January 10, 2013. The Class I of SEF – PLACERUM OPTIMERA has been liquidated on October 25, 2018.
SEF - ENTROPICS CAT BOND FUND (Class A) has been launched on February 23, 2015. Class I has been launched on April 3, 2017.
SEF - KUYLENSTIERNA & SKOG EQUITIES (Class A and Class P) has been launched on March 2, 2015.
SEF - LHV PERSIAN GULF FUND (Class A) has been launched on April 9, 2015. SEF - PENSER DYNAMISK ALLOKERING (Class A) has been launched on September 15, 2015.
SEF - EME EUROPEAN BEST IDEAS (Class A, Class I – EUR, Class I – SEK and Class P) has been launched on November 2, 2015.
SEF - MIMER SVERIGE (Class A) and SEF - GAIA GLOBAL (Class A) have been launched on November 19, 2015 and absorbed on April 3, 2018. SEF - KAVALJER MULTI (Class A and Class I) has been launched on May 20, 2016 (merger). Class P has been launched on June 7, 2018.

SEF
8
SEF - AKTIV FINANS EGAS DYNAMIC PORTFOLIO (Class A) has been launched on July 5, 2016. SEF - CASE POWER PLAY (Class A) has been launched on December 28, 2016. Class P has been launched on May 30, 2017 and has been liquidated on September 3, 2018. SEF - FIRST ALLOKERING (Class A, Class I and Class J) has been launched on March 2, 2017. SEF - FIRST SMB (Class A) has been launched on March 2, 2017. SEF - KRAFT GLOBAL (Class A and Class B) has been launched on May 22, 2018. SEF - INDEPENDENT INVESTMENTBOLAGSFOND (Class A) has been launched on May 14, 2018. The Class A and B are reserved to Retail Investors or to Investors duly authorised by the Investment Manager of the relevant sub-fund, depending on the sub-fund. The Class I and the Class J are reserved to Institutional Investors. The Class P is reserved to Institutional Investors, to Retail Investors, to Institutional Investors on behalf of Retail Investors or to Eligible Pension Plans, depending on the sub-fund.
The registered office of the SICAV is at 65, Boulevard Grande-Duchesse Charlotte L-1331 LUXEMBOURG. The Articles of Incorporation of the SICAV were published in the Mémorial C, Recueil des Sociétés et Associations, dated May 14, 2012. The Articles of
Incorporation have been deposited with the Register of the Tribunal d’Arrondissement of Luxembourg where they are available for inspection and where copies thereof can be obtained.
The financial year of the SICAV starts on January 1 and ends on December 31 of each year.
Determination of the Net Asset Value of shares
The Net Asset Value of each sub-fund is expressed in the denomination currency of the respective sub-fund as per share figure, and shall be determined on any Valuation Date by SWEDBANK AB (publ) Luxembourg Branch by dividing the value of the net assets of the sub-fund, being the value of the assets of that sub-fund less its liabilities, on the valuation date, by the number of shares outstanding.
Information to shareholders .
Net Asset Value
The Net Asset Value, the issue and redemption prices are available to the public at the registered office of the SICAV.
Financial Statements
Audited annual reports and unaudited semi-annual reports are published and made available to the shareholders free of charge at the SICAV’s registered office.
Other Information
All notices to shareholders are available at the SICAV’s registered office, and are published, if required, in a newspaper in Luxembourg and in the Mémorial C.
Any other financial information to be published concerning the SICAV including any suspension of the net asset value, is made available to the public at the SICAV’s registered office.

SEF
9
Report of the Board of Directors
The combined Net Asset Value of SEF as at December 31, 2018 was EUR 531,523,810.05.
SEF - PLACERUM BALANSERAD
SEF – Placerum Balanserad invests in a mix of equity and fixed income instruments. The proportion invested in each asset class changes over time due to market conditions. The proportion of equities can vary between 0-75% of the portfolio, meaning that Placerum Balanserad can reduce the exposure to the equity market in the event of equity market stress.
Placerum Balanserad, Class A and I, had a return of -4.1% and -5.0 % respectively in 2018.
Equity markets ended 2018 with sharp declines as investors started to question global growth prospects. There are reasons for this. Growth in the world´s second largest economy, China, continued to slow during the year and the trade war with USA seems to make things even worse. Europe´s largest economy, Germany, also showed signs of weakness, while the US so far seems more resilient, although there are worries that the Federal Reserve’s rate hikes eventually will slow down the US economy. With regard to the credit markets, spreads widened towards the end of 2018, as a result of the deteriorating risk sentiment and the end of the European Central Bank´s Quantitative Easing program. Credits also ended 2018 in negative territory.
Balanserad had a neutral (40%) equity position at the beginning of the year with an overweight in Asia, a market that performed extremely well in 2017. During 2018 Asia reversed its former gains and the position was reduced in two steps to a neutral position. Before the summer, equities were reduced from neutral to underweight, and hedge fund holdings were increased. During the large correction at yea-end, Placerum Balanserad gained from the equity underweight, but at the same time the hedge funds performed terribly in Q4, leading to a disappointing portfolio performance given the optimised equity vs. fixed income position during the correction.
The investment manager expects volatility to stay elevated in 2019, as a result of bleak growth prospects and political uncertainties. Therefore, a conservative approach will be maintained during the first half of 2019. On a positive note, rates seem to stay low, which is clearly positive for equities and credits. The investment manager believes this will prevent markets from crashing, as larger corrections will be considered as investment opportunities for investors holding cash or low yielding fixed income instruments, thus pushing up prices.
SEF - PLACERUM DYNAMISK
SEF - Placerum Dynamisk invests in equity instruments. The equity exposure can however vary between 0-100 percent, meaning that Placerum Dynamisk´s risk level can be reduced significantly in the event of market stress.
Placerum Dynamisk, Class A and I, had a return of -4.6 % and -5.6 % respectively in 2018.
Equity markets ended 2018 with sharp declines as investors started to question global growth prospects. There are reasons for this. Growth in the world´s second largest economy, China, continued to slow during the year and the trade war with USA seems to make things even worse. Europe´s largest economy, Germany, also showed signs of weakness, while the US so far seems more resilient, although there are worries that the Federal Reserve’s rate hikes eventually will slow down the US economy.
Placerum Dynamisk had a neutral (90%) equity position at the beginning of the year with an equity overweight in Asia, a market that performed extremely well in 2017. During 2018 Asia reversed its former gains and the position was reduced in two steps to a neutral position. Before the summer, equities were reduced from neutral to underweight, and the exposure to US equity was increased. During the large correction at the end of 2018, Placerum Dynamisk gained from the equity underweight and the appreciation of SEK against USD, somewhat compensating for the underperformance of Asia holdings during H1.

SEF
10
Report of the Board of Directors (continued)
SEF - PLACERUM DYNAMISK (continued)
The investment manager expects volatility to stay elevated in 2019, as a result of bleak growth prospects and political uncertainties. Therefore, a conservative approach will be maintained during the first half of 2019. On a positive note, rates seem to stay low, which is clearly positive for equities and credits. The investment manager believes this will prevent markets from crashing, as larger corrections will be considered as investment opportunities for investors holding cash or low yielding fixed income instruments, thus pushing up prices.
SEF - PLACERUM OPTIMERA
SEF - Placerum Optimera invests in government bonds, corporate bonds and hedge funds. Return target in today’s low interest rate environment is 2-3 percent a year.
Placerum Optimera, Class A, had a return of -1.5 % in 2018.
2018 was a weak year for credits, fixed income instruments and hedge funds. During the year the Federal Reserve in the US hiked its policy rate another four times, pushing the 10-year rate above 3% - levels not seen since 2011. This put pressure on interest rate risk sensitive instruments such as US government bonds and investment grade bonds, which posted negative returns during the year. High yield instruments were less affected by the higher interest rates, but were hit by the deteriorated sentiment towards the end of 2018, that widened credit spreads considerably. Hedge funds also had troubles coping with the sudden increase in volatility during Q4, leading to losses for the asset class in general, and long-short strategies in particular.
As with many peers, Placerum Optimera had a weak Q4, when the deteriorating risk sentiment took a toll on the performance. Placerum Optimera was down 2% in Q4, primarily due to poor performance in one of the hedge funds that lost nearly 15% during the period. This position was trimmed throughout Q4 and was finally excluded from Optimera in December. This debacle aside, rest of the portfolio performed rather well due to a moderate spread widening among Nordic corporate bonds compared to EUR and USD names.
Going forward we expect volatility to stay elevated as a result of bleak growth prospects and political uncertainties. However, rates seem to stay low for long which is clearly positive for credits. We also don´t expect default rates to rise significantly in 2019. The hunt for yield will continue and we therefore expect a decent year for credit markets.
SEF - ASCENSUS BALANSERAD
Ascensus Balanserad, Class A and I, had a return of -2.7 % and -2.8 % respectively in 2018.
During 2018 the volatility in the global financial markets increased. After a positive development during the first weeks of 2018, the global equity markets plummeted in February, primarily due to perceived or actual rate hikes by central banks. However, reported strong earnings development as well as analyst forecasts contributed to recovery in the global equity markets after the correction. The focus of the global financial markets to some extent shifted to mixed signals from GDP, developments in large regions such as China, Europe and the US. The GDP development was slightly weaker than expected, and thus, reflected in equity valuations. Combined with increased geo-political tensions, where US and China initiated trade tariffs and an escalating war of words led to substantially higher volatility from September. Towards year-end the equity markets plummeted and the volatility increased sharply. The negative loop was fueled by the Federal Reserve in the US’ quite firm stance on continued interest rate increases.

SEF
11
Report of the Board of Directors (continued)
SEF - ASCENSUS BALANSERAD (continued)
The market view of the investment manager was quite neutral during the year, due to various mixed signals and indications about the general economic development, thus the exposure of Ascensus Balanserad has remained neutral with a 50/50 exposure to equity and fixed income. During 2018 Ascensus Balanserad was somewhat biased towards US equities, as the USD exposure provides a hedge from a Swedish investor’s point of view. The fixed income exposure has to as substantial degree relied on investments into alternative investments with a bias towards fixed income exposure, which had a fair development during 2018. Exposure to credits was reduced in favour of money market exposure. No currency hedging was made on the sub-fund level.
SEF - ASCENSUS OFFENSIV
SEF – Ascensus Offensiv, Class A and I, had a return of -4.4 % and -4.5 % respectively in 2018.
During 2018 the volatility in the global financial markets increased. After a positive development during the first weeks of 2018, the global equity markets plummeted in February, primarily due to perceived or actual rate hikes by central banks. However, reported strong earnings development as well as analyst forecasts contributed to recovery in the global equity markets after the correction. The focus of the global financial markets to some extent shifted to mixed signals from GDP, developments in large regions such as China, Europe and the US. The GDP development was slightly weaker than expected, and thus, reflected in equity valuations. Combined with increased geo-political tensions, where the US and China initiated trade tariffs and an escalating war of words led to substantially higher volatility from September. Towards year-end the equity markets plummeted and the volatility increased sharply. The negative loop was fueled by the Federal Reserve in the US’ quite firm stance on continued interest rate increases.
Ascensus Offensiv, a global equity fund with Swedish equity bias, has during 2018 been almost fully invested in the global equity markets, besides cash and cash equivalents for liquidity purposes, and a minor fixed income exposure, in major part of the year. However, during the fall, Ascensus Offenvis’ exposure to the equity markets was decreased due to increased market volatility. During 2018 Ascensus Offensiv was somewhat biased towards US equities, as the USD exposure provides a hedge from a Swedish investor’s point of view. No currency hedging was made on the sub-fund level.
SEF - ASCENSUS TREND
SEF – Ascensus Trend, Class A and I, had a return of -3.6 % and -3.7 % respectively in 2018.
During 2018 the volatility in the global financial markets increased. After a positive development during the first weeks of 2018, the global equity markets plummeted in February, primarily due to perceived or actual rate hikes by central banks. However, reported strong earnings development as well as analyst forecasts contributed to recovery in the global equity markets after the correction. The focus of the global financial markets to some extent shifted to mixed signals from GDP, developments in large regions such as China, Europe and the US. The GDP development was slightly weaker than expected, and thus, reflected in equity valuations. Combined with increased geo-political tensions, where the US and China initiated trade tariffs and an escalating war of words led to substantially higher volatility from September. Towards year-end the equity markets plummeted and the volatility increased sharply. The negative loop was fueled by the Federal Reserve in the US’ quite firm stance on continued interest rate increases.
The market view of the investment manager was quite neutral during the year, due to various mixed signals and indications about the general economic development, and thus Ascensus Trend’s investments have been quite close to and exposure of 75/25 in equity versus fixed income. During 2018 Ascensus Trend was somewhat biased towards US equities, as the USD exposure provides a hedge from a Swedish investor’s point of view. The fixed income exposure has to as substantial degree relied on investments into alternative investments with a bias towards fixed income. Exposure to credits was reduced in favour of money market exposure. No currency hedging was made on sub-fund level.

SEF
12
Report of the Board of Directors (continued)
SEF - LHV PERSIAN GULF FUND
LHV Persian Gulf Fund invests in public equity in the Gulf Cooperation Council (GCC) member states - the United Arab Emirates, Qatar, Saudi Arabia, Oman, Kuwait and Bahrain. Since the GCC countries’ currencies are pegged to USD, or heavily dependent of it, LHV Persian Gulf Fund fully hedges its EUR/USD currency risk, in order to convert the underlying assets’ investment returns to euros.
SEF – LHV Persian Gulf Fund had a return of -5.5 % in 2018.
During a large part of 2018 the Middle Eastern markets in the GCC, and as a result LHV Persian Gulf Fund, moved sideways. With the global equity slump during the last three months of the year, however, the fund ended the year with a -5.5 % return. During 2018 the investment manager gained foreign investor approval to achieve direct access to Saudi Arabia’s equity market, meaning that the fund no longer needed to use participatory notes and could access all shares trading on the Tadawul Stock Exchange directly. This increased the investment universe and decreased access costs for Saudi Arabia. As a result of this, the exposure to Saudi Arabia increased from 10% in June 2018 to 26% in December 2018. During 2018 a positive decisions was taken to upgrade Saudi Arabia to the Emerging Market indices and the implementation of this decision is planned in multiple steps throughout 2019, both by FTSE and MSCI. This should drive billions of dollars of foreign investor inflows into the Saudi Arabian equity market. Although Saudi Aramco was expected to launch an IPO in 2018, this did not come to fruition – however, the government has not scrapped its plans altogether, and it is likely that, despite the delay, the company will still be listed at a later date.
Brent oil price started the year at $66.9 and rallied up to $86.7 by early October. However, all of those gains and even more was lost during the slump of the last couple of months of 2018, as oil price finished the year at $53.8. A decision taken by the US to implement more lenient sanctions on Iran than initially expected also played its role in creating a short-term oversupply in the oil market, and resulted in swift fall of the oil price, despite OPEC’s quick reaction to curtail production in order to keep supply and demand in balance. We have seen the oil price now recover to over $60 in the beginning of 2019 and we expect the comfortable price range to be around $60-$80 for large global oil producing countries.
Share price valuations in the region are very compelling – the investments that LHV Persian Gulf Fund held at the end of 2018 were on average trading at 7.8x forward looking earnings, 1.1x book value, and were offering 5.0% trailing dividend yield. Main theme that should drive investor interest toward the GCC region in 2019 is the implementation of Saudi Arabia index inclusion into FTSE and MSCI Emerging Market indices, that takes place in multiple steps throughout the year. There is also potential for Kuwait to be upgraded to MSCI Emerging Market index in mid-2019 creating additional foreign investor interest.
SEF - KUYLENSTIERNA & SKOG EQUITIES
SEF – Kuylenstierna & Skog Equities, Class A and I, had a return of -9.3 and -8.9 respectively, in 2018.
Stock markets started out quite strongly in 2018 but turned negative at the end of January and kept moving sideways until summer, though with quite big movements. Expectations on company reports were high after a long period of strong markets. Most companies, however, managed to defend their valuations. Instead, concerns regarding wage increases, an accelerating inflation, and rising interest rates changed the sentiment. The interest rate on US 10-year government bonds rose above 3%. In Sweden, the krona weakened, from February and for the remainder of the year, the EUR traded above SEK 10. New tariffs on steel and aluminium did not help markets, and instead the risk of a global trade war, increased. The relations between US and China, but also between US and the EU, worsened.

SEF
13
Report of the Board of Directors (continued)
SEF - KUYLENSTIERNA & SKOG EQUITIES (continued)
During summer, a bit more positive news came from the US and Europe. However, many of the tech companies in the US performed badly when their ability to continue to grow and generate profits was questioned.
In September, markets again lost momentum and in October, stock markets fell sharply. Concerns about a global economic slowdown, normalisation of monetary policies, rising interest rates in the US, Brexit, the Italian budget, protests in France, new tariffs between China and the US and uncertainty about the automotive industry all contributed to the negative sentiment. In November, the markets calmed down but fell sharply again in December.
Virtually all major markets ended up with negative performance during 2018. One of the big losers was the DAX index that lost, excluding dividends, 18 %. The DAX was closely followed by the Spanish and Italian indices. The Swedish OMX30 index declined 11 %, excluding dividends. The Asian indices also had a bad year with the Shanghai and Shenzhen markets falling around 30%.
In the beginning of 2018 the fund was invested approximately 92% into equities. During the year, the equity ratio has been fluctuating, and at the end of 2018 it was 91%. In December, the geographical equity breakdown was 27% in the US, 15% in Europe ex. Sweden, and 30% in Sweden. 16% was allocated into the Asian stock markets.
The investment manager assesses that the decline at the end of 2018 was too big. The investment manager expects weaker growth rates in 2019 compared to 2018, but not a global recession. Central banks are likely to continue raising interest rates and reducing quantitative easing but at a rate that is not too bad for growth. If the belief that the world economy does not enter recession but growth continues at a moderate pace is correct, recent declines have lowered valuations and the stock market looks reasonably valued. The investment manager does not believe that inflation will be picking up sharply anytime soon and the investment alternatives to equities are few.
SEF - ENTROPICS CAT BOND FUND
SEF – Entropics Cat Bond Fund’s aim is to deliver good risk adjusted returns, with low or no correlation to traditional asset classes, by investing in catastrophe bonds (cat bonds). Cat bonds are securities that transfer insurance risks, mainly concerning natural catastrophes, to the capital markets.
SEF – Entropics Cat Bond Fund, Class A, and I, a return of -3.6 % and -3.2 %, respectively, in 2018.
As the fund’s assets are mainly denominated in USD, returns were strongly affected by differences between the interest rates in the United States and Sweden, for those classes that are hedged to Swedish Krona. Over the year, the total currency effect was -2.57 %. The Eurekahedge ILS Advisers Index is ILS Advisers (USD) returned -3.50% in 2018.
2018 was the second consecutive loss year on the cat bond market, and about 80% of the losses were attributable to historical events in 2017 for which the claims settlement processes continued throughout the year and into 2019. The reminder of the losses was caused by one wildfire event in California, the hurricanes Michael and Florence, and the typhoons Jebi and Trami in Japan. The prolonged claim settlement processes following the 2017 events have not caused larger losses than would have been the case if the initial loss estimates by primary insurers had been correct. The processes have, however, contributed to increased market volatility and some uncertainty regarding the accuracy of preliminary loss estimates.

SEF
14
Report of the Board of Directors (continued)
SEF - ENTROPICS CAT BOND FUND (continued)
Furthermore, the insurers underestimate of losses contributed to the continued pricing pressure on the cat bond and ILS markets in 2018. As the extent of the loss events in 2017 has been clarified, the market has hardened with considerably higher premiums towards the end of 2018 and in early 2019. This was further emphasized by the departure of opportunistic investors trying to apply timing strategies to cat bond investments, as these strategies proved difficult to execute on the market.
To date in 2019, the market has been characterized by increasing risk premiums by 15 – 20%.
During 2018 Entropic Asset management A’s leadership role in the application of responsible investments to cat bonds and insurance-linked securities has continued to develop. Going into 2019, Entropics is undertaking an update of the investment policy to explicitly address the UN’s sustainable development goals, and will implement this in the future reporting. The investment manager has also in 2018 seen the first competitor adopt a similar strategy, proving that other managers start to understand the importance of responsible investments also in alternative investment strategies. Entropics is committed to maintaining its leadership role and will continue to develop policies and strategies in this respect.
SEF – EME EUROPEAN BEST IDEAS
It was a tough 2018 for European equities and as an European equity investor the investment manager had to navigate a challenging landscape for a number of reasons:
European growth concerns. There were signs of slower growth over the course of 2018, even though most economies on the continent were still expanding at or above trend levels towards the end of the year.
Factor trends. It is increasingly apparent, in the view of the investment manager, that machine / algorithmically-driven investment activities and those aligned to factor risks are having an increasingly marked impact on equity movements over the short-term (as transpired in the second half of 2018). While these factor-driven moves can be painful, we feel that increased factor trading and dynamic risk management to factor models by fundamental investors is creating greater market inefficiency, and therefore may lead to very interesting opportunities for long-term investors.
China. There are two aspects to this issue: firstly that US-China trade tensions could lead to a decline in global economic activity with knock on impacts for Europe; secondly, that China and emerging markets more broadly are increasingly important to the earnings of European companies - with circa 50% of the revenues of European companies now derived from outside of developed Europe, and over one third coming from emerging markets. There were some signs that the Chinese economy decelerated towards the end of 2018, with a contraction in business confidence and consumer durable goods such as autos. The investment manager therefore believes it would not be irrational to link this to the negative moves in sectors like European autos.
Geopolitical concerns. In particular concerns over populist governments in a number of European countries such as Italy, Hungary and the UK (Brexit) engaging in erratic and potentially harmful economic policies. We think that such populistic governments tend to raise the cost of equity for the country concerned as well as dampening the general sentiment.
Quantitative Easing (QE) to Quantitative Tightening (QT). This shift in central bank policy is very hard to map out through any kind of transmission mechanism from central bank balance sheet adjustments to equity market variations, but the investment manager believes it has been a prevalent impact on sentiment and has therefore impacted market valuation expectations in late 2018.

SEF
15
Report of the Board of Directors (continued)
SEF – EME EUROPEAN BEST IDEAS (continued)
SEF – EME European Best Ideas, Class A, I-EUR, I-SEK and P, had a return of -7.7 %, -7.9 %, -7.6 % and -7.9 %, respectively, in 2018. The fund’s benchmark index, MSCI Europe Net Return EUR expressed in SEK, had a return of -7.5 %
Despite the concerns going into 2019 the investment manager believes European stock valuations, dividend yield and corporate earnings look attractive. While macroeconomic and political headwinds could weigh on earnings potential next year, he still believes European companies should be able to post stable profit growth. European stocks have lagged the US market since the global financial crisis and a ‘catch-up’ trade with US equities is likely to take place and largely be earnings driven. Given the range of possible outcomes, it is clear, in the view of the investment manager, that an unusually high degree of selectivity is required by European equity investors in 2019 in order to reap benefits.
SEF - PENSER DYNAMISK ALLOKERING
2018 added increased levels of volatility to global equity markets, with downward trajectories during both the beginning and end of the year. Swedish equities closed at -7.03 % while global equites closed at -9.53 %, corresponding to a decrease of -0.82 % for the year when measured in SEK due to the continuing weakening against the dollar.
Positive return contribution came from fixed income instruments, while the other asset classes, such as Swedish and global equities and alternative investments (hedge funds) provided negative return contribution.
SEF - Penser Dynamisk Allokering, Class A had a return of -3.7 % in 2018.
The year initially contained increased focus on the US tax package, expected to provide a positive effect on profit levels. However, after some time the level of inflation attracted more focus, causing an upward shift in interest rates. As February approached, global equity markets experienced levels of volatility not seen since 2008, as inflation expectations spurred expectations of increasing interest rates. The volatility eventually came down, as markets shifted focus towards the strong underlying global economy. Towards the end of the first quarter, the geopolitical tensions caused by president Trumps steel and aluminum tolls increased as the conflict in Syria covered headlines.
USD against SEK has experienced a strong upward trajectory throughout the year, in line with Erik Penser Bank’s view that the US economy has shifted upwards, while that of Sweden and the rest of Europe has shifted downward. This is a result of differences in interest rate levels, inflation, consumer confidence and flows. This view led Erik Penser Bank to directly position the portfolio towards negative momentum in European equity markets, by shorting the EUROSTOXX 50 via an ETF giving short exposure to the index.
Throughout the year, instruments within the alternative investments asset class, i.e. hedge funds, have shown both weaker performance as well as less preferable portfolio characteristics, through increasing positive correlation with other asset classes. Instead of including these instruments in the portfolio, we turned to our own strategies, such as exposure towards increasing inflation in US and Europe. Further, our analysis of the market development during the end of the year concluded an interesting connection with US tax regulation for fund managers and investors within the alternatives sector (hedge funds). Compared to previous regulation, investors will no longer be able to deduct costs associated with 1) losses and management costs and 2) costs from potential leverage. Additionally, the hedge fund industry has not performed well during the last decade. The aggregated result was an enormous outflow of funds from hedge funds, causing a perfect negative spiral.

SEF
16
Report of the Board of Directors (continued)
SEF - PENSER DYNAMISK ALLOKERING (continued)
Top performers at the end of the year were all Swedish shares. At the top we find Ericsson that continuously bet consensus estimates throughout the year. On second place we have one of Europe’s leading healthcare companies Capio AB, a position that was sold off during July after a take-over bid from the French healthcare company Ramsay Générale de Santé, benefitting from the increased liquidity and share price. Astra Zeneca comes in third, while Telia and real estate company Balder round off our top 5 best performers.
SEF - KAVALJER MULTI
SEF – Kavaljer Multi is an actively managed mixed fund, whose objective is to provide a stable growth with a low to medium risk. The amount of equities can vary between 40-80 %, debt securities between 20-40 % and alternative investments between 0-20%. Investments are made in various asset classes, such as debt securities and shares in big and small companies, where business risk is considered to be low to medium. Other alternative asset classes may occur. The fund has global investment opportunities. Investments can be done through direct investments in these securities and in regulated investment funds, including exchange traded funds (ETFs). The Fund may use derivatives. 2018 was characterized by large movements in the equity markets. Major focus of the financial markets during the year was mainly fear for recession and the never-ending Brexit debate. Weaker global GDP growth and continued interest rate hikes by the US central bank and concerns about trade war contributed to a gloomy picture of the economic outlook during 2018. Nevertheless, the investment manager sees the risk of recession as small, though he foresees very low interest rates as a result of low underlying inflationary pressures. The European Central Bank has maintained unchanged interest rates during 2018, following weaker than expected economic signals. A significant stimulus is necessary to maintain inflation according to the ECB, which expects interest rates to remain at current levels until late 2019. In Sweden, inflation is weak, so the investment manager expects few interest rate hikes in the future. The Riksbank raised the interest rate in December to -0,25%. Swedish ten-year government bond rate decreased moderately in 2018 from 0.8% at the beginning of the year to 0.6% at the end of the year. SEF – Kavaljer Multi, Class A, I, and P, had a return of -13.0 %, -12.5 % and -17.2 % respectively, in 2018. Class P was launched on the 7 June, 2018. Kavaljer Multi performed in line with global indices. Kavaljer Multi have been overweight to equities, especially in Scandinavia and Europe. Interest bearing investments are in SEK. During the year, the investment manager has increased the exposure to Nordic equities, and increased the weight to medium and small companies in the portfolio where lower valuation and better growth opportunities as anticipated. In the short term the financial markets focus on the continued Brexit negotiations and whether the US and China succeed in getting an agreement. Low valuations and rising corporate profits in 2019, in combination with low interest rates, indicate a positive stock market climate in 2019. Even the expected average yield, which is 4%, at the same time as the 5-year interest rate is negative, points to the shares' advantage. Therefore, the investment manager still sees equity investments as more attractive compared to interest bearing investments.

SEF
17
Report of the Board of Directors (continued)
SEF - FIRST ALLOKERING
SEF – FIRST Allokering is an actively managed balanced fund, investing in global as well as Norwegian equity and credit markets. The Fund is actively managed along two dimensions: allocation between asset classes and stock picking in equity and credit portfolios. The funds equity share can vary between 0 and 100% but will in most instances be within the boundaries of 30-70%.
2018 was characterized by high volatility in the financial markets, especially in the last quarter. Fear of trade wars and declining growth rates in the global economy was among the most important factors influencing markets negatively. Oil prices fell from over 80 USD per barrel to below 50 USD over a 3 month period and several equity markets saw drawdowns of 20%.
The risk of the Fund was reduced in the latter part of 2018 as the share of equities and high yield was cut back. Even though allocation contributed modestly to relative performance in 2018, stock picking more than offset this positive effect. FIRST Allokering’s benchmark consists of 4 different equity and fixed income indices (weighted together according to the fund’s strategic strategy: 15% Norwegian equities, 35% global equities, 30% bonds and 20% money market).
SEF – FIRST Allokering, Class A, I,and J had a return of -7.5 %, -7.2 % and -6.9 % respectively, in 2018.
Valuation of risky assets was generally above average and the economic cycle is maturing (even though we see no immediate risk of recession in the US). Markets probably was a bit ahead of fundamentals in Q4 2018, but the investment manager finds it prudent to have a cautious approach to overall risk in the portfolio in 2019. This means, depending on developments in markets and fundamentals, the investment manager intends to reduce risk by reducing allocation to equities going forward.
SEF - FIRST SMB
SEF – FIRST SMB is an actively managed fund, typically with 25-35 holdings in Norwegian companies. The Fund is actively managed and focuses on stock picking in small and mid-sized companies.
2018 was characterized by high volatility in the financial markets, especially in the last quarter. Fear of trade wars and declining growth rates in the global economy was among the most important factors influencing markets negatively. Oil prices fell from over 80 USD per barrel to below 50 USD over a 3 month period and several equity markets saw drawdowns of 20%.
Small cap equities are often considered more risky and the fund’s benchmark (Olso Børs Small Cap Index – OSESX) lost 13.9 % in value in 2018 as Q4 saw declines of almost 20 %.
SEF – FIRST SMB, Class A had a return of -13.9 % in 2018 and its benchmark had a return of -13.9 %.
Risk in the Fund was reduced in the latter part of 2018 as the Fund concentrated on quality companies within the OSESX. FIRST SMB does not hold any international positions outside Norway, but holds some mid cap stocks outside the fund’s benchmark to add further liquidity and quality to the portfolio. The small cap universe in Norway is normally valued with a discount to large cap equities but not to the extent that we see today.
SEF
18
Report of the Board of Directors (continued)
SEF - AKTIV FINANS EGAS DYNAMIC PORTFOLIO
EGAS Dynamic is a sub fund that has a broad, global asset allocation mandate. The asset allocation is determined by a systematic quantitative model that derives signals for all major asset classes that are subsequently implemented in the fund through liquid instruments such as equities, bonds, ETFs and money market instruments.
SEF - Aktiv Finans EGAS Dynamic Portfolio, Class A, had a return of -9.1 % in 2018.
With effective date 14 January 2019 SEF - Aktiv Finans EGAS Dynamic Portfolio, Class A, was absorbed by Swedish registered UCITS World Equity Replication Fund RC A with ISIN SE0006881389.
SEF – CASE POWER PLAY
The first negative trading year since 2011 is now a fact. The Federal Reserve gradually raised short-term interest rates during 2018m and the long-term rates also rose and eventually peaked at around 3.25 % for the US 10-year. This made the strong stock markets softer and the somewhat overpriced and heavily index weighing tech companies such as Facebook and Apple fell rapidly towards the end of the year. This chain of events finally also caused the stock markets in Europe and Sweden to fall.
SEF – Case Power Play, Class A, had a return of -6.6 % in 2018 and the benchmark (SIXPRX) had a return of -4.4 %.
The largest holdings were Elekta, SAAB, BillerudKorsnäs, ABB and Investor. Elekta will have a very interesting 2019 since the company now has received the CE approval in the US for its revolutionary new machine Unity that combines X-ray with MR scanning.
2019 has started with a strong recovery after the weak development towards the end of 2018. Concerns about the trade war between the US and China will continue. Also, the peculiar Brexit process in England continues to disturb the markets. The economic growth began to level out in 2018 and this stagnation will continue throughout 2019. The rise in markets since 2008 has much been driven by the extreme flow of cheap funny money from our central banks. This has now been reversed from not only the Federal Reserve, the European Central Bank has also ceased its vast purchasing of bonds. The interest rates will continue to be miniscule in Europe for at least the next year, however the trend is no longer in a downwards direction.
SEF - KRAFT GLOBAL
The fund is an actively managed global value fund. The investment manager defines value as cheap stocks, i.e. invests in stocks that are fundamentally undervalued in absolute or/and relative terms. Investment are picked based on the company’s ability to create cash flow to shareholders over a business cycle, hence we try to evaluate the company’s potential upon an estimate for normalized results.
SEF - Kraft Global was launched on 22 May, 2018.
SEF – Kraft Global, Class A and B, had a return of -25.0 % and -24.8 %, respectively, in 2018.
During the second half of 2018 the fund experienced headwinds as a result of cheap companies becoming even cheaper, as well as expensive companies becoming more expensive. The market largely did not emphasize normalized earnings, which meant that meant that cyclical stocks fell significantly.
SEF
19
Report of the Board of Directors (continued)
SEF - KRAFT GLOBAL (continued)
Kraft Global holds a lot of cyclical exposure, as the investment manager sees that part of the market as having significant potential. As things developed, the fund’s holdings increased the top line of more than 10 percent during 2018, which gives us comfort that the companies are fundamentally improving. As the global valuations differences between cheap stocks and expensive stocks, according to Bernstein Research, is now the widest in more than 70 years, and as the investment manager considers having accessed the “cheap end”, he is confident that the fund will deliver higher returns in the years to come.
The months of October and December were particularly challenging for the fund due to fears of a global recession. The investment manager thinks that this fear was highly overblown. The holdings in stocks based on income from oil service and metals collapsed and was the main reason for the underperformance. The investment manager considers the market for metals and oil as being tight due to limited supply, resulting from several years of underinvestment in those industries. For 2019 and onwards the investment manager is optimistic for a significant rebound for such companies.
The portfolio is priced below 1 times book and 10 times earnings, which evidences the value style. Since the portfolio also has a good growth profile, the value creation potential is immense. The investment manager identifies good value investments in all sectors, but to a lesser extent within stable earners and technology sectors, were Kraft Global is underweight. The investment manager strives for a sector balance and has an absolute rule of maximum 20 percent in a single if the 11 Gics sectors within the MSCI World Index.
SEF - INDEPENDENT INVESTMENTBOLAGSFOND
SEF - Independent Investmentbolagsfond is a sub-fund that invests in the global equity market. The fund aims to create long-term growth of the invested capital by selecting shares focusing on global investment companies, conglomerates and companies with strong brands using both fundamental and technical analysis.
2018 has been a difficult year. 2018 started uneasily, but then it took off and during the summer the markets reached the top of the year. In October, however, the troubles took off seriously, and the year ended with high volatility. The main concern of the market during the year was the Brexit agreement, the trade conflict between the US and China, the economic upswing and concerns about interest rate hikes.
SEF - Independent Investmentbolagsfond was launched on 14 May, 2018.
SEF – Independent Investmentbolagsfond, Class A had a return of -4.3 % in 2018.
The investment manager is very pleased with this year's result. Independent Investmentbolagsfond had a good start after launch, and it has performed better than relevant global indices. The fund will be continued to be managed with a combination of technical analysis and focused stock picking.
What will happen in 2019? The market is currently very difficult to navigate. We should normally be in a strong season as winter markets often perform much better than summer. This year, however, we have not seen any of this. On the positive side we see a good business climate with low interest rates and good corporate profits, and a lot of negative expectations have already been priced in. Of course, on the negative side there is Brexit, trade conflict, economic upswing, interest rate hikes, and more.
As the real impact of Brexit and trade conflicts become clearer, the market should stabilize. Another exciting year awaits us!

SEF
20
Report of the Board of Directors (continued)
SEF - INDEPENDENT INVESTMENTBOLAGSFOND (continued)
On the 20 March 2019 the Investment Manager was changed from Independent Investment Group Sweden AB to EME Partners AB, and the fund was renamed to SEF – Investmentbolagsfond.
SEF – GAIA GLOBAL
SEF – Gaia Global, Class A, had a return of 0.45 % in 2018. The fund was absorbed by Luxembourg UCITS Monyx Fund – Monyx Strategi Offensiv on the 3 April, 2018.
SEF – MIMER SVERIGE
SEF – Mimer Sverige, Class A, had a return of -4.5 % in 2018. The fund was absorbed by Luxembourg UCITS Monyx Fund – Monyx Svenska Aktier on the 3 April, 2018.

Deloitte.
To the Shareholders of
SEF
65, Boulevard Grande-Duchesse Charlotte
L-1331 Luxembourg
REPORT OF THE REVISEUR D'ENTREPR/SES AGREE
Opinion
Deloitte Audit Soc1ete a responsabilite limitee
S60, rue de Neudorf L-2220 Luxembourg B.P. 1173 L-1011 Luxembourg
Tel: +352 451 451 www.delo1tte.lu
We have audited the financial statements of SEF (the "SICAV") and of each of its sub-funds, which comprise the
Statement of Net Assets and the Statement of Investments as at December 31, 2018 and the Statement of Operations
and Changes in Net Assets for the year then ended, and notes to the financial statements, including a summary of
significant accounting policies.
In our opinion, the accompanying financial statements give a true and fair view of the financial position of the SICAV
and of each of its sub-funds as at December 31, 2018, and of the results of its operations and changes in its net assets
for the year then ended in accordance with Luxembourg legal and regulatory requirements relating to the preparation
and presentation of the financial statements.
Basis for Opinion
We conducted our audit in accordance with the Law of 23 July 2016 on the audit profession (Law of 23 July 2016) and
with International Standards on Auditing (ISAs) as adopted for Luxembourg by the Commission de Surveillance du
Secteur Financier (CSSF). Our responsibilities under the Law of 23 July 2016 and ISAs are further described in the
"Responsibilities of the Reviseur d'Entreprises Agree for the Audit of the Financial Statements" section of our report.
We are also independent of the S ICAV in accordance with the International Ethics Standards Board for Accountants'
Code of Ethics for Professional Accountants (IESBA Code) as adopted for Luxembourg by the CSSF together with the
ethical requirements that are relevant to our audit of the financial statements, and have fulfilled our other ethical
responsibilities under those ethical requirements . We believe that the audit evidence we have obtained is sufficient and
appropriate to provide a basis for our opinion.
Other information
The Board of Directors of the SICAV is responsible for the other information. The other information comprises the
information stated in the annual report but does not include the financial statements and our report of the Reviseur
d'Entreprises Agree thereon .
Soc1ete a responsabilite limitee au capital de 35.000 € RCS Luxembourg B 67.895 Autorisation d'etablissement · 10022179
- 21 -

Deloitte. Our opinion on the financial statements does not cover the other information and we do not express any form of
assurance conclusion thereon.
In connection with our audit of the financial statements, our responsibility is to read the other information and, in doing
so, consider whether the other information is materially inconsistent with the financial statements or our knowledge
obtained in the audit or otherwise appears to be materially misstated. If, based on the work we have performed, we
conclude that there is a material misstatement of this other information, we are required to report this fact. We have
nothing to report in this regard .
Responsibilities of the Board of Directors of the SICAV for the Financial Statements
The Board of Directors of the SICAV is responsible for the preparation and fair presentation of the financial statements
in accordance with Luxembourg legal and regulatory requirements relating to the preparation and presentation of the
financial statements, and for such internal control as the Board of Directors of the SICAV determines is necessary to
enable the preparation of financial statements that are free from material misstatement, whether due to fraud or error.
In preparing the financial statements, the Board of Directors of the SICAV is responsible for assessing the SICA V's
ability to continue as a going concern, disclosing, as applicable, matters related to going concern and using the going
concern basis of accounting unless the Board of Directors of the SICAV either intends to liquidate the SICAV or to
cease operations, or has no realistic alternative but to do so.
Responsibilities of the Reviseur d'Entreprises Agree for the Audit of the Financial Statements
The objectives of our audit are to obtain reasonable assurance about whether the financial statements as a whole are
free from material misstatement, whether due to fraud or error, and to issue a report of the Reviseur d'Entreprises
Agree that includes our opinion. Reasonable assurance is a high level of assurance, but is not a guarantee that an
audit conducted in accordance with the Law dated 23 July 2016 and with ISAs as adopted for Luxembourg by the
CSSF will always detect a material misstatement when it exists. Misstatements can arise from fraud or error and are
considered material if, individually or in the aggregate, they could reasonably be expected to influence the economic
decisions of users taken on the basis of these financial statements.
As part of an audit in accordance with the Law dated 23 July 2016 and with ISAs as adopted for Luxembourg by the
CSSF, we exercise professional judgment and maintain professional skepticism throughout the audit. We also:
• Identify and assess the risks of material misstatement of the financial statements, whether due to fraud or error,
design and perform audit procedures responsive to those risks , and obtain audit evidence that is sufficient and
appropriate to provide a basis for our opinion . The risk of not detecting a material misstatement resulting from
fraud is higher than for one resulting from error, as fraud may involve collusion, forgery, intentional omissions,
misrepresentations, or the override of internal control;
- 22 -
Deloitte.
• Obtain an understanding of internal control relevant to the audit in order to design audit procedures that are
appropriate in the circumstances, but not for the purpose of expressing an opinion on the effectiveness of the
SICAV's internal control ;
• Evaluate the appropriateness of accounting policies used and the reasonableness of accounting estimates and
related disclosures made by the Board of Directors of the SICAV;
• Conclude on the appropriateness of the Board of Directors of the SICA V's use of the going concern basis of
accounting and, based on the audit evidence obtained, whether a material uncertainty exists related to events or
conditions that may cast significant doubt on the SICA V's ability to continue as a going concern. If we conclude
that a material uncertainty exists, we are required to draw attention in our report of the Reviseur d'Entreprises
Agree to the related disclosures in the financial statements or, if such disclosures are inadequate, to modify our
opinion. Our conclusions are based on the audit evidence obtained up to the date of our report of the Reviseur
d'Entreprises Agree. However, future events or conditions may cause the SICAV to cease to continue as a going
concern;
• Evaluate the overall presentation, structure and content of the financial statements, including the disclosures,
and whether the financial statements represent the underlying transactions and events in a manner that
achieves fair presentation.
We communicate with those charged with governance regarding, among other matters, the planned scope and timing
of the audit and significant audit findings, including any significant deficiencies in internal control that we identify during
our audit.
Jean-Philippe Bachelet, Reviseur d'Entreprises Agree Partner
Luxembourg, April 26, 2019
- 23 -

SEF
Statement of net assets at December 31, 2018
The accompanying notes form an integral part of these financial statements.
24
COMBINED PLACERUM
BALANSERAD
PLACERUM
DYNAMISK
SEK SEK SEK
ASSETS
Investments, At Cost 5,085,993,281.51 218,212,511.51 228,028,271.12
Unrealized Result on Investments 92,067,673.15 -1,678,853.25 4,572,007.99
Investments, at Market Value (Note 1) 5,178,060,954.66 216,533,658.26 232,600,279.11
Cash at Banks 217,507,886.93 15,348,191.34 15,915,789.16
Net Formation Expenses (Note 1) 224,135.26 0.00 0.00
Tax Reclaims (Note 2) 2,324,757.12 0.00 0.00
Receivable on Sales of Investments 7,575,037.13 0.00 0.00
Receivable on Subscriptions 4,222,881.62 172,255.84 727,942.62
Dividends Receivable 542,254.18 0.00 0.00
Net Unrealized Result on Forward Foreign Exchange Transactions (Note 11)
1,908,470.36 0.00 0.00
Net Unrealized Result on Other OTC Financial Derivative Instruments (Note 12)
574,530.18 0.00 0.00
Net Accrued Interest on Bank Accounts 273.04 0.00 0.00
Accrued Interest on Bonds 3,616,863.83 379,953.03 0.00
Accrued Income (Note 1) 4,440,377.32 102,286.11 139,556.17
Total assets 5,420,998,421.63 232,536,344.58 249,383,567.06
LIABILITIES
Payable on Purchases of Investments 6,146,902.51 0.00 0.00
Payable on Redemptions 3,577,808.68 8,550.74 510,770.10
Accrued Expenses (Note 8) 10,056,326.85 450,727.75 480,539.97
Total liabilities 19,781,038.04 459,278.49 991,310.07
TOTAL NET ASSETS AT DECEMBER 31, 2018 5,401,217,383.59 232,077,066.09 248,392,256.99
TOTAL NET ASSETS AT DECEMBER 31, 2017 6,786,943,578.23 422,265,361.58 360,373,083.65
SEF
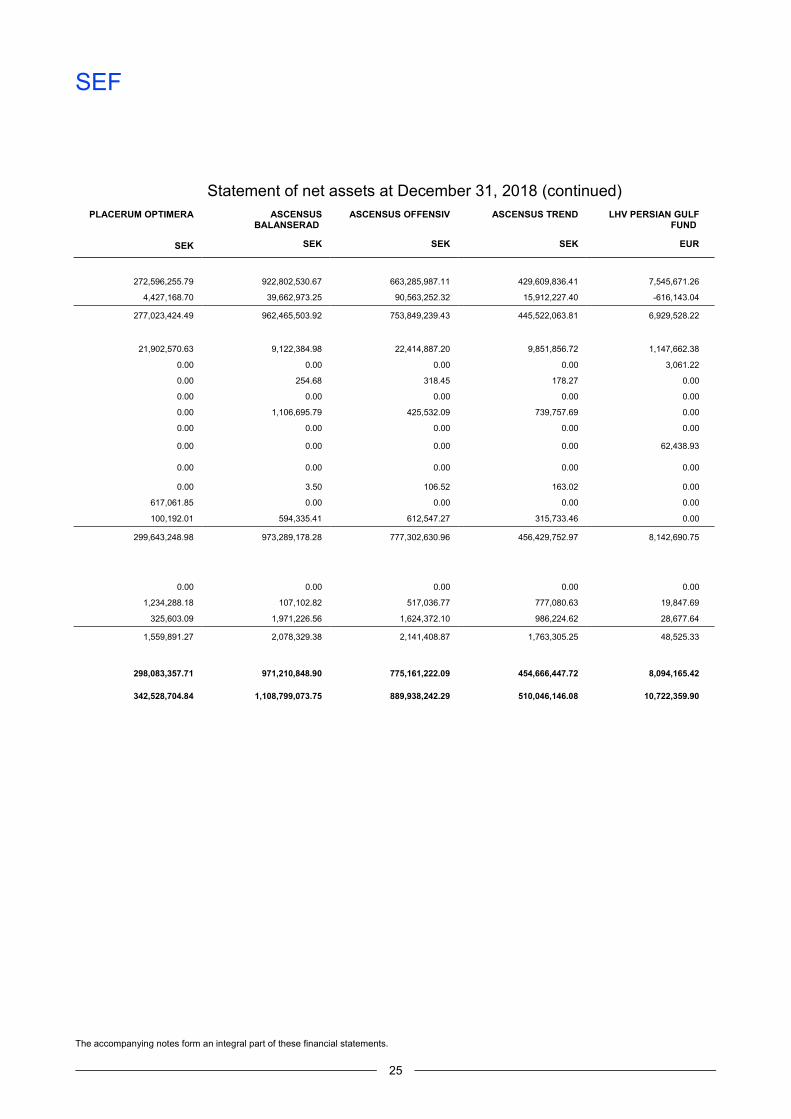
Statement of net assets at December 31, 2018 (continued)
The accompanying notes form an integral part of these financial statements.
25
PLACERUM OPTIMERA ASCENSUS
BALANSERAD
ASCENSUS OFFENSIV ASCENSUS TREND LHV PERSIAN GULF
FUND
SEK SEK SEK SEK EUR
272,596,255.79 922,802,530.67 663,285,987.11 429,609,836.41 7,545,671.26
4,427,168.70 39,662,973.25 90,563,252.32 15,912,227.40 -616,143.04
277,023,424.49 962,465,503.92 753,849,239.43 445,522,063.81 6,929,528.22
21,902,570.63 9,122,384.98 22,414,887.20 9,851,856.72 1,147,662.38
0.00 0.00 0.00 0.00 3,061.22
0.00 254.68 318.45 178.27 0.00
0.00 0.00 0.00 0.00 0.00
0.00 1,106,695.79 425,532.09 739,757.69 0.00
0.00 0.00 0.00 0.00 0.00
0.00 0.00 0.00 0.00 62,438.93
0.00 0.00 0.00 0.00 0.00
0.00 3.50 106.52 163.02 0.00
617,061.85 0.00 0.00 0.00 0.00
100,192.01 594,335.41 612,547.27 315,733.46 0.00
299,643,248.98 973,289,178.28 777,302,630.96 456,429,752.97 8,142,690.75
0.00 0.00 0.00 0.00 0.00
1,234,288.18 107,102.82 517,036.77 777,080.63 19,847.69
325,603.09 1,971,226.56 1,624,372.10 986,224.62 28,677.64
1,559,891.27 2,078,329.38 2,141,408.87 1,763,305.25 48,525.33
298,083,357.71 971,210,848.90 775,161,222.09 454,666,447.72 8,094,165.42
342,528,704.84 1,108,799,073.75 889,938,242.29 510,046,146.08 10,722,359.90

SEF
Statement of net assets at December 31, 2018 (continued)
The accompanying notes form an integral part of these financial statements.
26
KUYLENSTIERNA &
SKOG EQUITIES
ENTROPICS CAT
BOND FUND
EME EUROPEAN
BEST IDEAS
SEK SEK SEK
ASSETS
Investments, At Cost 222,455,719.16 230,673,696.38 69,067,615.29
Unrealized Result on Investments 56,410,979.61 -15,872,345.16 -3,804,295.95
Investments, at Market Value (Note 1) 278,866,698.77 214,801,351.22 65,263,319.34
Cash at Banks 5,075,408.47 20,763,337.10 5,699,732.10
Net Formation Expenses (Note 1) 0.00 0.00 79,552.75
Tax Reclaims (Note 2) 376,513.67 0.00 190,596.97
Receivable on Sales of Investments 0.00 0.00 0.00
Receivable on Subscriptions 48,962.00 0.00 0.00
Dividends Receivable 82,661.53 0.00 171,238.82
Net Unrealized Result on Forward Foreign Exchange Transactions (Note 11)
0.00 4,014,804.28 0.00
Net Unrealized Result on Other OTC Financial Derivative Instruments (Note 12)
0.00 0.00 0.00
Net Accrued Interest on Bank Accounts 0.00 0.00 0.00
Accrued Interest on Bonds 0.00 2,270,565.75 0.00
Accrued Income (Note 1) 8,077.09 0.00 0.00
Total assets 284,458,321.53 241,850,058.35 71,404,439.98
LIABILITIES
Payable on Purchases of Investments 0.00 0.00 0.00
Payable on Redemptions 778.33 0.00 0.00
Accrued Expenses (Note 8) 507,717.23 388,066.45 202,574.82
Total liabilities 508,495.56 388,066.45 202,574.82
TOTAL NET ASSETS AT DECEMBER 31, 2018 283,949,825.97 241,461,991.90 71,201,865.16
TOTAL NET ASSETS AT DECEMBER 31, 2017 405,486,578.60 234,221,913.00 56,059,409.99

SEF
Statement of net assets at December 31, 2018 (continued)
The accompanying notes form an integral part of these financial statements.
27
PENSER DYNAMISK
ALLOKERING
KAVALJER MULTI FIRST ALLOKERING FIRST SMB AKTIV FINANS EGAS
DYNAMIC PORTFOLIO
SEK SEK NOK NOK SEK
320,074,468.18 59,858,163.91 758,548,288.08 189,543,786.66 37,263,447.78
-903,934.56 -5,482,618.33 -15,599,218.96 -15,692,201.38 -2,045,924.40
319,170,533.62 54,375,545.58 742,949,069.12 173,851,585.28 35,217,523.38
7,263,596.49 2,205,372.77 44,902,915.11 7,061,396.54 2,282,389.43
52,551.16 0.00 0.00 0.00 0.00
0.00 140,079.67 171,406.04 862,764.50 553,173.00
0.00 0.00 0.00 7,365,144.69 0.00
0.00 500.00 15,146.00 0.00 0.00
58,318.01 0.00 0.00 0.00 7,483.89
0.00 0.00 -2,796,506.25 0.00 137,190.00
0.00 0.00 558,610.85 0.00 0.00
0.00 0.00 0.00 0.00 0.00
90,933.35 30,055.56 221,968.61 0.00 0.00
10,600.49 0.00 2,486,197.47 0.00 0.00
326,646,533.12 56,751,553.58 788,508,806.95 189,140,891.01 38,197,759.70
0.00 0.00 0.00 5,976,581.45 0.00
2,993.81 0.00 0.00 0.00 0.00
420,301.56 101,281.17 1,177,380.61 485,399.09 233,530.78
423,295.37 101,281.17 1,177,380.61 6,461,980.54 233,530.78
326,223,237.75 56,650,272.41 787,331,426.34 182,678,910.47 37,964,228.92
366,233,210.37 74,934,788.10 954,019,466.32 328,510,034.37 40,097,242.14
SEF
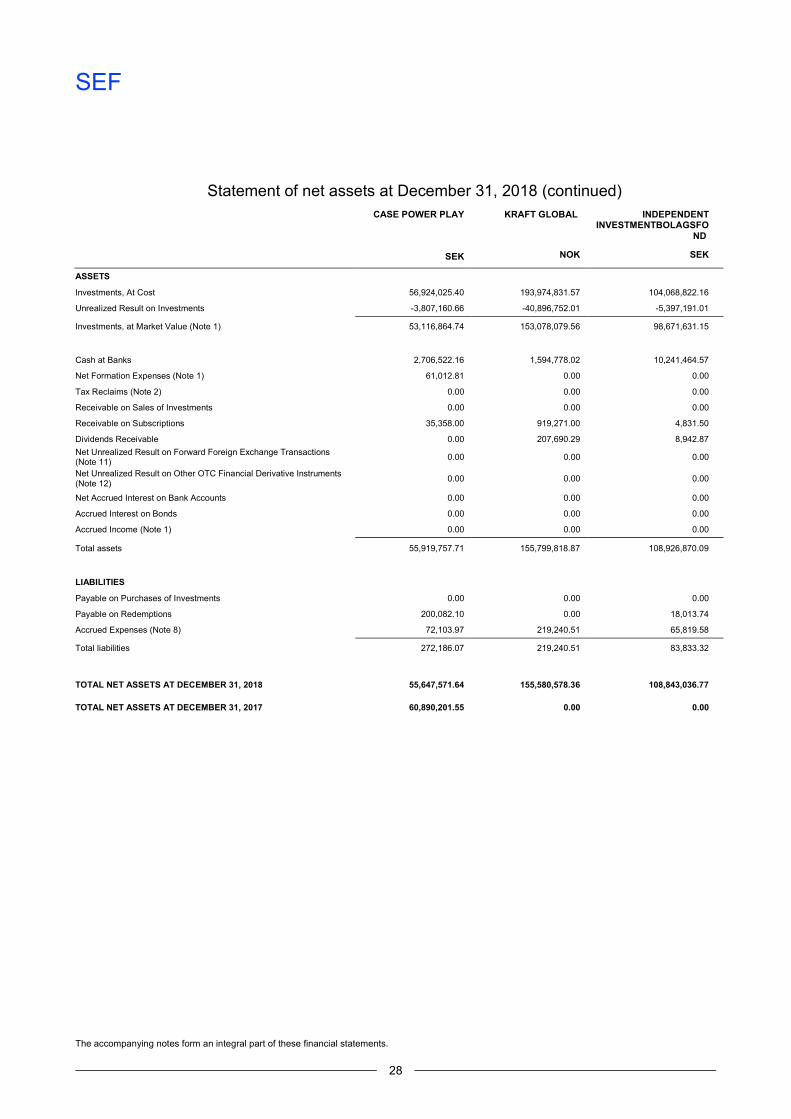
Statement of net assets at December 31, 2018 (continued)
The accompanying notes form an integral part of these financial statements.
28
CASE POWER PLAY KRAFT GLOBAL INDEPENDENT
INVESTMENTBOLAGSFO
ND
SEK NOK SEK
ASSETS
Investments, At Cost 56,924,025.40 193,974,831.57 104,068,822.16
Unrealized Result on Investments -3,807,160.66 -40,896,752.01 -5,397,191.01
Investments, at Market Value (Note 1) 53,116,864.74 153,078,079.56 98,671,631.15
Cash at Banks 2,706,522.16 1,594,778.02 10,241,464.57
Net Formation Expenses (Note 1) 61,012.81 0.00 0.00
Tax Reclaims (Note 2) 0.00 0.00 0.00
Receivable on Sales of Investments 0.00 0.00 0.00
Receivable on Subscriptions 35,358.00 919,271.00 4,831.50
Dividends Receivable 0.00 207,690.29 8,942.87
Net Unrealized Result on Forward Foreign Exchange Transactions (Note 11)
0.00 0.00 0.00
Net Unrealized Result on Other OTC Financial Derivative Instruments (Note 12)
0.00 0.00 0.00
Net Accrued Interest on Bank Accounts 0.00 0.00 0.00
Accrued Interest on Bonds 0.00 0.00 0.00
Accrued Income (Note 1) 0.00 0.00 0.00
Total assets 55,919,757.71 155,799,818.87 108,926,870.09
LIABILITIES
Payable on Purchases of Investments 0.00 0.00 0.00
Payable on Redemptions 200,082.10 0.00 18,013.74
Accrued Expenses (Note 8) 72,103.97 219,240.51 65,819.58
Total liabilities 272,186.07 219,240.51 83,833.32
TOTAL NET ASSETS AT DECEMBER 31, 2018 55,647,571.64 155,580,578.36 108,843,036.77
TOTAL NET ASSETS AT DECEMBER 31, 2017 60,890,201.55 0.00 0.00

SEF
29

SEF
Statement of operations and changes in net assets for the Year ended December 31, 2018
The accompanying notes form an integral part of these financial statements.
30
COMBINED PLACERUM BALANSERAD
PLACERUM DYNAMISK
SEK SEK SEK
NET ASSETS AT THE BEGINNING OF THE YEAR 6,786,943,578.23 422,265,361.58 360,373,083.65
INCOME
Dividends, Net 44,674,128.57 0.00 0.00
Interest on Bonds, Net 28,394,087.81 3,161,386.56 0.00
Interest on Bank Accounts, Net 371,592.56 0.00 0.00
Other Income (Note 15) 12,705,867.38 929,360.28 624,679.64
Total Income 86,145,676.32 4,090,746.84 624,679.64
EXPENSES
Depositary Fees (Note 5) 3,049,363.32 151,099.82 136,613.17
Central Administration Fees (Note 5) 7,820,834.75 394,021.23 371,777.60
Audit and Legal Fees 1,375,161.72 74,230.18 74,346.46
Subscription Tax (Note 2) 1,263,250.24 28,213.44 57,531.46
Investment Management Fees (Note 6) 87,715,975.26 5,656,289.26 5,273,153.39
Amortization of Formation Expenses (Note 1) 251,181.42 4,386.39 4,135.84
Interest on Bank Accounts, Net 729,244.66 75,777.99 48,872.99
Transaction Fees (Note 10) 4,494,827.96 34,935.10 37,023.16
Other Expenses 3,289,759.40 113,248.83 107,212.23
Performance Fees (Note 16) 1,891,161.87 0.00 0.00
Management Company Fees (Note 7) 4,123,113.10 169,813.39 158,106.31
Collateral Management Fees 275,903.02 0.00 0.00
Total Expenses 116,279,776.72 6,702,015.63 6,268,772.61
NET INVESTMENT RESULT -30,134,100.40 -2,611,268.79 -5,644,092.97
Net Realized Result on Futures 149,625.00 0.00 0.00
Net Realized Result on Forward Foreign Exchange Transactions -25,761,749.51 0.00 0.00
Net Realized Result on Other OTC Financial Derivative Instruments 6,565,283.24 0.00 0.00
Net Realized Result on Sales of Investments 296,411,400.54 32,305,323.74 25,761,364.65
Net Realized Result on Foreign Exchange 23,236,060.11 1,357,716.73 1,111,967.16
NET REALIZED RESULT FOR THE YEAR 300,600,619.38 33,663,040.47 26,873,331.81
Change in Net Unrealized Result on:
- Forward Foreign Exchange Transactions -2,014,379.74 0.00 0.00
- Other OTC Financial Derivative Instruments 574,530.18 0.00 0.00
- Investments -593,290,778.76 -40,406,612.01 -33,441,565.59
NET CHANGE IN UNREALIZED RESULT FOR THE YEAR -594,730,628.32 -40,406,612.01 -33,441,565.59
NET CHANGE IN NET ASSETS AS A RESULT OF OPERATIONS FOR THE YEAR -324,264,109.34 -9,354,840.33 -12,212,326.75
Proceeds from Shares Subscribed 1,163,885,517.42 127,506,400.47 161,975,015.10
Payments for Shares Redeemed -2,263,632,108.45 -308,339,855.63 -261,743,515.01
Currency Revaluation of Net Assets at Beginning of the Year 38,284,505.73
NET ASSETS AT THE END OF THE YEAR 5,401,217,383.59 232,077,066.09 248,392,256.99
SEF
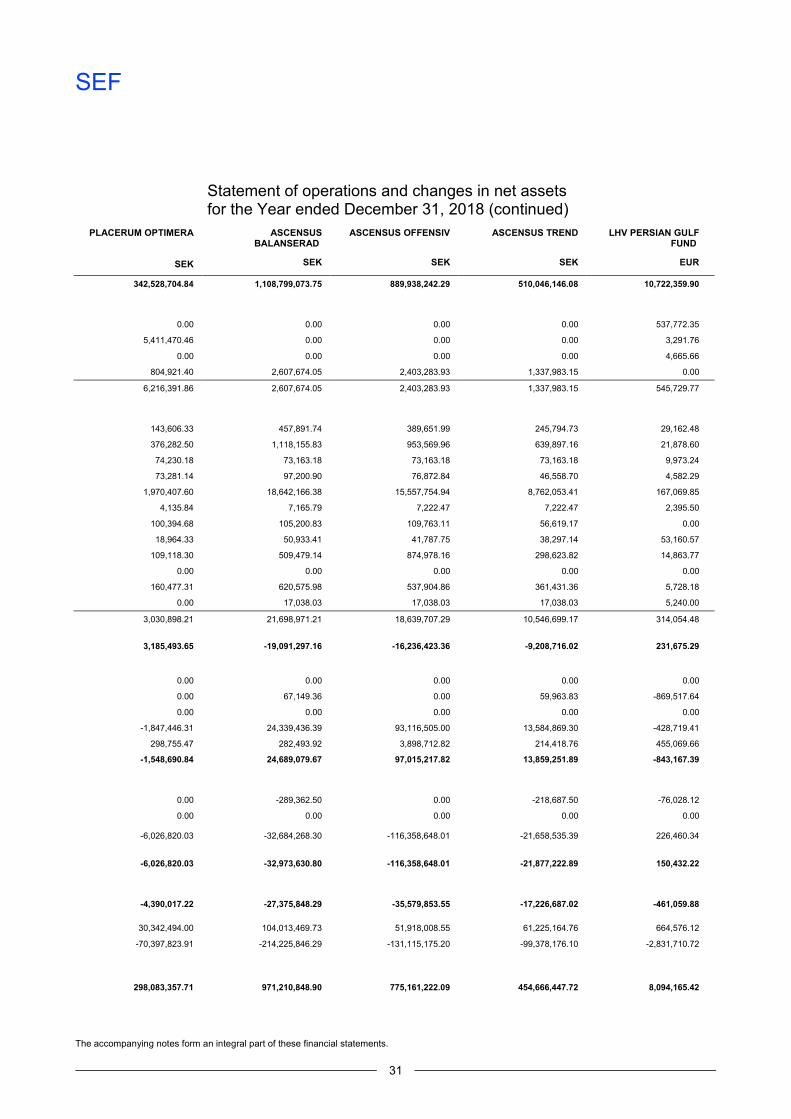
Statement of operations and changes in net assets for the Year ended December 31, 2018 (continued)
The accompanying notes form an integral part of these financial statements.
31
PLACERUM OPTIMERA ASCENSUS BALANSERAD
ASCENSUS OFFENSIV ASCENSUS TREND LHV PERSIAN GULF FUND
SEK SEK SEK SEK EUR
342,528,704.84 1,108,799,073.75 889,938,242.29 510,046,146.08 10,722,359.90
0.00 0.00 0.00 0.00 537,772.35
5,411,470.46 0.00 0.00 0.00 3,291.76
0.00 0.00 0.00 0.00 4,665.66
804,921.40 2,607,674.05 2,403,283.93 1,337,983.15 0.00
6,216,391.86 2,607,674.05 2,403,283.93 1,337,983.15 545,729.77
143,606.33 457,891.74 389,651.99 245,794.73 29,162.48
376,282.50 1,118,155.83 953,569.96 639,897.16 21,878.60
74,230.18 73,163.18 73,163.18 73,163.18 9,973.24
73,281.14 97,200.90 76,872.84 46,558.70 4,582.29
1,970,407.60 18,642,166.38 15,557,754.94 8,762,053.41 167,069.85
4,135.84 7,165.79 7,222.47 7,222.47 2,395.50
100,394.68 105,200.83 109,763.11 56,619.17 0.00
18,964.33 50,933.41 41,787.75 38,297.14 53,160.57
109,118.30 509,479.14 874,978.16 298,623.82 14,863.77
0.00 0.00 0.00 0.00 0.00
160,477.31 620,575.98 537,904.86 361,431.36 5,728.18
0.00 17,038.03 17,038.03 17,038.03 5,240.00
3,030,898.21 21,698,971.21 18,639,707.29 10,546,699.17 314,054.48
3,185,493.65 -19,091,297.16 -16,236,423.36 -9,208,716.02 231,675.29
0.00 0.00 0.00 0.00 0.00
0.00 67,149.36 0.00 59,963.83 -869,517.64
0.00 0.00 0.00 0.00 0.00
-1,847,446.31 24,339,436.39 93,116,505.00 13,584,869.30 -428,719.41
298,755.47 282,493.92 3,898,712.82 214,418.76 455,069.66
-1,548,690.84 24,689,079.67 97,015,217.82 13,859,251.89 -843,167.39
0.00 -289,362.50 0.00 -218,687.50 -76,028.12
0.00 0.00 0.00 0.00 0.00
-6,026,820.03 -32,684,268.30 -116,358,648.01 -21,658,535.39 226,460.34
-6,026,820.03 -32,973,630.80 -116,358,648.01 -21,877,222.89 150,432.22
-4,390,017.22 -27,375,848.29 -35,579,853.55 -17,226,687.02 -461,059.88
30,342,494.00 104,013,469.73 51,918,008.55 61,225,164.76 664,576.12
-70,397,823.91 -214,225,846.29 -131,115,175.20 -99,378,176.10 -2,831,710.72
298,083,357.71 971,210,848.90 775,161,222.09 454,666,447.72 8,094,165.42

SEF
Statement of operations and changes in net assets for the Year ended December 31, 2018 (continued)
The accompanying notes form an integral part of these financial statements.
32
KUYLENSTIERNA & SKOG EQUITIES
ENTROPICS CAT BOND FUND
EME EUROPEAN BEST IDEAS
SEK SEK SEK
NET ASSETS AT THE BEGINNING OF THE YEAR 405,486,578.60 234,221,913.00 56,059,409.99
INCOME
Dividends, Net 5,360,568.00 0.00 1,201,645.82
Interest on Bonds, Net 0.00 14,984,191.55 0.00
Interest on Bank Accounts, Net 0.00 0.00 0.00
Other Income (Note 15) 14,927.23 0.00 0.00
Total Income 5,375,495.23 14,984,191.55 1,201,645.82
EXPENSES
Depositary Fees (Note 5) 214,533.47 169,533.50 85,640.88
Central Administration Fees (Note 5) 574,456.96 357,838.58 475,749.11
Audit and Legal Fees 73,125.97 68,097.18 78,412.62
Subscription Tax (Note 2) 147,975.81 87,540.17 9,583.47
Investment Management Fees (Note 6) 3,677,938.42 2,047,930.09 464,888.72
Amortization of Formation Expenses (Note 1) 3,966.29 0.00 30,748.16
Interest on Bank Accounts, Net 55,738.15 860.12 20,543.80
Transaction Fees (Note 10) 154,129.31 11,760.95 131,761.83
Other Expenses 104,840.49 129,713.99 151,084.46
Performance Fees (Note 16) 0.00 0.00 0.00
Management Company Fees (Note 7) 244,429.38 290,968.28 184,553.21
Collateral Management Fees 0.00 66,115.86 0.00
Total Expenses 5,251,134.25 3,230,358.72 1,632,966.26
NET INVESTMENT RESULT 124,360.98 11,753,832.83 -431,320.44
Net Realized Result on Futures 0.00 0.00 0.00
Net Realized Result on Forward Foreign Exchange Transactions -351,002.34 -19,122,294.50 0.00
Net Realized Result on Other OTC Financial Derivative Instruments 0.00 0.00 0.00
Net Realized Result on Sales of Investments 12,787,351.65 -2,458,378.78 3,787,211.90
Net Realized Result on Foreign Exchange 8,904,939.36 -3,528,097.12 1,108,196.85
NET REALIZED RESULT FOR THE YEAR 21,341,288.67 -25,108,770.40 4,895,408.75
Change in Net Unrealized Result on:
- Forward Foreign Exchange Transactions -463,563.00 1,976,898.86 0.00
- Other OTC Financial Derivative Instruments 0.00 0.00 0.00
- Investments -47,814,904.54 3,440,292.59 -10,775,571.88
NET CHANGE IN UNREALIZED RESULT FOR THE YEAR -48,278,467.54 5,417,191.45 -10,775,571.88
NET CHANGE IN NET ASSETS AS A RESULT OF OPERATIONS FOR THE YEAR -26,812,817.89 -7,937,746.12 -6,311,483.57
Proceeds from Shares Subscribed 42,826,889.21 48,512,320.99 42,495,791.00
Payments for Shares Redeemed -137,550,823.95 -33,334,495.97 -21,041,852.26
Currency Revaluation of Net Assets at Beginning of the Year
NET ASSETS AT THE END OF THE YEAR 283,949,825.97 241,461,991.90 71,201,865.16

SEF
Statement of operations and changes in net assets for the Year ended December 31, 2018 (continued)
The accompanying notes form an integral part of these financial statements.
33
PENSER DYNAMISK ALLOKERING
MIMER SVERIGE GAIA GLOBAL KAVALJER MULTI FIRST ALLOKERING
SEK SEK SEK SEK NOK
366,233,210.37 169,675,732.98 355,952,400.05 74,934,788.10 954,019,466.32
2,666,220.85 1,506,715.00 1,020,630.64 1,652,961.48 19,517,812.23
515,028.25 0.00 0.00 397,641.10 3,783,201.39
0.00 0.00 0.00 0.00 95,576.12
76,536.10 0.00 0.00 0.00 3,796,622.91
3,257,785.20 1,506,715.00 1,020,630.64 2,050,602.58 27,193,212.65
184,442.41 23,300.29 49,143.40 88,979.01 232,618.53
392,854.66 91,216.57 131,588.59 105,884.77 781,955.51
72,462.34 36,969.55 36,969.55 74,190.32 74,571.04
148,583.67 18,484.11 39,785.93 34,351.66 99,119.21
2,451,916.36 632,488.30 1,349,967.76 902,825.72 11,095,537.14
30,743.77 0.00 0.00 0.00 0.00
67,305.22 5,747.26 1,377.32 22,161.96 0.00
329,253.52 77,305.12 180,640.65 49,275.61 723,525.18
77,858.50 45,984.94 45,983.84 136,867.55 104,074.40
1,874,264.79 0.00 0.00 0.00 7,704.71
327,738.27 30,769.76 48,869.68 25,259.39 507,835.67
0.00 0.00 0.00 0.00 50,706.68
5,957,423.51 962,265.90 1,884,326.72 1,439,795.99 13,677,648.07
-2,699,638.31 544,449.10 -863,696.08 610,806.59 13,515,564.58
0.00 0.00 0.00 0.00 0.00
0.00 0.00 0.00 0.00 2,821,424.25
0.00 0.00 0.00 0.00 6,383,369.50
10,029,853.60 1,341,986.94 43,728,761.26 5,683,332.26 39,427,104.24
3,392,497.91 -8,018.82 -3,251,319.58 513,172.14 391,346.35
13,422,351.51 1,333,968.12 40,477,441.68 6,196,504.40 49,023,244.34
0.00 0.00 0.00 0.00 -2,320,356.81
0.00 0.00 0.00 0.00 558,610.85
-24,074,614.52 -9,118,405.71 -37,667,453.13 -15,528,898.44 -119,192,193.63
-24,074,614.52 -9,118,405.71 -37,667,453.13 -15,528,898.44 -120,953,939.59
-13,351,901.32 -7,239,988.49 1,946,292.47 -8,721,587.45 -58,415,130.67
70,058,667.00 4,499,400.79 4,427,463.76 4,471,175.07 41,545,692.93
-96,716,738.30 -166,935,145.28 -362,326,156.28 -14,034,103.31 -149,818,602.24
326,223,237.75 0.00 0.00 56,650,272.41 787,331,426.34

SEF
Statement of operations and changes in net assets for the Year ended December 31, 2018 (continued)
The accompanying notes form an integral part of these financial statements.
34
FIRST SMB AKTIV FINANS EGAS DYNAMIC PORTFOLIO
CASE POWER PLAY
NOK SEK SEK
NET ASSETS AT THE BEGINNING OF THE YEAR 328,510,034.37 40,097,242.14 60,890,201.55
INCOME
Dividends, Net 2,855,767.47 255,507.06 1,791,648.60
Interest on Bonds, Net 0.00 0.00 0.00
Interest on Bank Accounts, Net 191,320.13 0.00 0.00
Other Income (Note 15) 0.00 0.00 1,682.25
Total Income 3,047,087.60 255,507.06 1,793,330.85
EXPENSES
Depositary Fees (Note 5) 79,777.78 60,488.20 9,131.86
Central Administration Fees (Note 5) 463,244.77 73,223.78 144,901.27
Audit and Legal Fees 74,571.04 152,520.92 76,612.59
Subscription Tax (Note 2) 134,929.28 17,029.41 29,597.72
Investment Management Fees (Note 6) 4,917,089.78 806,005.91 612,507.37
Amortization of Formation Expenses (Note 1) 0.00 78,418.99 48,762.43
Interest on Bank Accounts, Net 0.00 27,956.67 20,285.03
Transaction Fees (Note 10) 1,259,578.70 38,545.81 120,216.77
Other Expenses 61,662.81 137,243.36 99,478.62
Performance Fees (Note 16) 8,724.18 0.00 0.00
Management Company Fees (Note 7) 266,774.51 21,783.91 30,625.41
Collateral Management Fees 1,589.40 51,073.27 717.83
Total Expenses 7,267,942.25 1,464,290.23 1,192,836.90
NET INVESTMENT RESULT -4,220,854.65 -1,208,783.17 600,493.95
Net Realized Result on Futures 0.00 0.00 149,625.00
Net Realized Result on Forward Foreign Exchange Transactions -207,099.21 -293,798.93 0.00
Net Realized Result on Other OTC Financial Derivative Instruments 0.00 0.00 0.00
Net Realized Result on Sales of Investments -4,217,780.22 -1,174,247.26 1,958,573.41
Net Realized Result on Foreign Exchange 2,777,514.52 1,236,121.20 253.30
NET REALIZED RESULT FOR THE YEAR -1,647,364.91 -231,924.99 2,108,451.71
Change in Net Unrealized Result on:
- Forward Foreign Exchange Transactions 0.00 137,190.00 0.00
- Other OTC Financial Derivative Instruments 0.00 0.00 0.00
- Investments -23,584,806.60 -2,572,777.37 -6,591,368.40
NET CHANGE IN UNREALIZED RESULT FOR THE YEAR -23,584,806.60 -2,435,587.37 -6,591,368.40
NET CHANGE IN NET ASSETS AS A RESULT OF OPERATIONS FOR THE YEAR -29,453,026.16 -3,876,295.53 -3,882,422.74
Proceeds from Shares Subscribed 8,871,527.65 15,583,100.28 9,811,391.76
Payments for Shares Redeemed -125,249,625.39 -13,839,817.97 -11,171,598.93
Currency Revaluation of Net Assets at Beginning of the Year
NET ASSETS AT THE END OF THE YEAR 182,678,910.47 37,964,228.92 55,647,571.64

SEF
Statement of operations and changes in net assets for the Year ended December 31, 2018 (continued)
The accompanying notes form an integral part of these financial statements.
35
KRAFT GLOBAL INDEPENDENT INVESTMENTBOLAGSF
OND
NOK SEK
0.00 0.00
638,955.23 100,776.46
0.00 0.00
28,434.09 0.00
0.00 0.00
667,389.32 100,776.46
19,610.34 2,548.52
99,424.69 14,781.85
5,072.84 3,838.34
41,794.97 20,524.19
653,321.80 73,910.30
0.00 0.00
0.00 10,640.36
514,872.92 72,171.00
20,268.14 6,126.33
0.00 0.00
37,982.74 16,014.19
0.00 0.00
1,392,348.44 220,555.08
-724,959.12 -119,778.62
0.00 0.00
0.00 0.00
0.00 0.00
1,498,130.28 57,458.56
-22,512.55 -142,865.22
1,475,617.73 -85,406.66
0.00 0.00
0.00 0.00
-40,896,752.01 -5,397,191.01
-40,896,752.01 -5,397,191.01
-40,146,093.40 -5,602,376.29
199,180,527.21 120,773,985.66
-3,453,855.45 -6,328,572.60
155,580,578.36 108,843,036.77

SEF
Number of shares outstanding and net asset value per share
The accompanying notes form an integral part of these financial statements
36
Sub-funds Class - Ccy Number of shares
outstanding
31/12/2018
Net asset value
per share
31/12/2018
Net asset value
per share
31/12/2017
Net asset value
per share
31/12/2016
SEF - PLACERUM BALANSERAD A - SEK 258,189.8817 126.32 131.72 124.60
I - SEK 1,624,342.5027 122.80 129.30 122.59
SEF - PLACERUM DYNAMISK A - SEK 606,946.8639 148.73 155.96 141.83
I - SEK 1,095,494.6493 144.34 152.90 139.62
SEF - PLACERUM OPTIMERA A - SEK 2,756,342.0563 108.14 109.78 108.55
I - SEK - - 108.85 107.83
SEF - ASCENSUS BALANSERAD A - SEK 475,432.5166 127.27 130.78 125.06
I - SEK 7,294,290.2346 124.85 128.50 123.35
SEF - ASCENSUS OFFENSIV A - SEK 51,804.2270 158.79 166.06 151.72
I - SEK 4,924,083.3265 155.75 163.14 149.63
SEF - ASCENSUS TREND A - SEK 116,596.8889 134.95 139.94 131.20
I - SEK 3,316,036.5069 132.37 137.47 129.39
SEF - LHV PERSIAN GULF FUND A - EUR 759,809.8234 10.65 11.27 11.34
SEF - KUYLENSTIERNA & SKOG EQUITIES A - SEK 6,164.4038 142.71 157.42 141.80
P - SEK 1,935,604.6254 146.24 160.50 143.85
SEF - ENTROPICS CAT BOND FUND A - SEK 1,671,853.0983 95.38 98.91 102.87
I - SEK 878,910.6139 93.29 96.42 -
SEF - EME EUROPEAN BEST IDEAS A - SEK 37,746.6403 114.50 124.00 105.03
I - SEK 599,948.9377 103.03 111.49 94.31
I - EUR 2,162.5425 98.51 111.05 96.75
P - SEK 25,377.3357 113.61 123.36 104.77
SEF - PENSER DYNAMISK ALLOKERING A - SEK 310,380.9222 1,051.04 1,091.89 1,052.42
SEF - MIMER SVERIGE (1) A - SEK - - 107.26 100.36
SEF - GAIA GLOBAL (1) A - SEK - - 118.34 109.42
SEF - KAVALJER MULTI A - SEK 481,700.5740 117.10 134.57 124.31
I - SEK 69.6710 124.38 142.16 129.95
P - SEK 2,823.5350 82.82 - -
SEF - FIRST ALLOKERING A - NOK 40,984.7060 1,959.33 2,118.24 -
I - NOK 129,739.0209 2,012.02 2,169.12 -
J - NOK 214,626.4017 2,077.99 2,231.25 -
SEF - FIRST SMB A - NOK 115,371.3764 1,583.40 1,838.00 -
SEF - AKTIV FINANS EGAS DYNAMIC PORTFOLIO A - SEK 402,957.9295 94.21 103.64 99.61
SEF - CASE POWER PLAY A - SEK 554,951.1776 100.27 107.39 99.96
P - SEK - - 94.36 -
SEF - KRAFT GLOBAL (2) A - NOK 92,063.4234 74.96 - -
B - NOK 1,977,198.5492 75.20 - -
SEF - INDEPENDENT INVESTMENTBOLAGSFOND (3) A - SEK 1,136,835.5522 95.74 - -
(1) Absorbed on April 3, 2018 (2) Launched on May 22, 2018 (3) Launched on May 14, 2018

SEF PLACERUM BALANSERAD
Statement of Investments and other net assets at December 31, 2018 (in SEK)
The accompanying notes form an integral part of these financial statements.
37
Description
Number of shares or
nominal value
Market Value (in SEK)
% of NAV
I. TRANSFERABLE SECURITIES ADMITTED TO AN OFFICIAL EXCHANGE LISTING
BONDS
BONDS IN NOK
COLOR GROUP AS 23/11/2023 FRN 4,500,000 4,529,891.20 1.95
ELKEM AB 06/12/2021 FRN 6,000,000 6,170,988.44 2.66
LAERINGSVERKSTEDET AS 4,000,000 4,067,709.88 1.75
TEEKAY LNG PARTNERS 19/05/2020 FRN 10,000,000 10,284,980.74 4.43
25,053,570.26 10.79
BONDS IN SEK
CABONLINE GROUP HOLDING AB 12/06/2020 FRN 7,000,000 7,122,500.00 3.07
GUNNEBO INDUSTRIER AB 5,000,000 5,050,000.00 2.18
HEIMSTADEN FRN 2019 5,000,000 5,031,325.00 2.17
IA HEDIN BIL FRN 22 5,000,000 4,962,500.00 2.14
NORDAX BANK AB 18/03/2025 FRN 10,000,000 10,275,000.00 4.43
NORLANDIA HEALTH CARE FRN 21 6,000,000 5,595,000.00 2.41
NORWEGIAN AIR SHUTTLE 07/08/2020 FRN 6,000,000 5,430,000.00 2.34
RSA INSURANCE GRP PLC FRN PERP 3,000,000 3,075,000.00 1.32
SERNEKE GROUP 01/06/2021 FRN 5,000,000 4,700,000.00 2.03
WEST ATLANTIC 6.500% 2019 5,000,000 4,750,000.00 2.05
55,991,325.00 24.14
TOTAL BONDS 81,044,895.26 34.93
TOTAL TRANSFERABLE SECURITIES ADMITTED TO AN OFFICIAL EXCHANGE LISTING 81,044,895.26 34.93
II. INVESTMENT FUNDS
INVESTMENT FUNDS IN SEK
CARNEGIE WORLDWIDE ASIA FUND - 1A 6,642 9,072,782.57 3.90
HANDELSBANKEN EUROPAFOND INDEX 136,304 14,153,837.13 6.10
HANDELSBANKEN MSCI USA INDEX 43,392 13,849,414.62 5.97
HANDELSBANKEN SVERIGEFOND INDEX 1,687 16,936,958.95 7.30
NORRON SICAV PRESERVE FUND RC - SEK 121,228 14,298,812.05 6.15
SEB PRIME SOLUTIONS NORDIC CROSS STABLE RETURN 200,000 18,814,000.00 8.11
SWEDBANK ROBUR ACCESS SVERIGE 65,477 10,554,854.15 4.55
SWEDBANK ROBUR ACCESS USA 80,022 20,724,165.41 8.93
SWEDBANK ROBUR PENNINGMARKNADSFOND 118,730 11,996,438.12 5.17
130,401,263.00 56.18
TOTAL INVESTMENT FUNDS 130,401,263.00 56.18
III. OTHER TRANSFERABLE SECURITIES
BONDS
BONDS IN SEK
BETSSON 28/11/2019 FRN 5,000,000 5,087,500.00 2.19
5,087,500.00 2.19
TOTAL BONDS 5,087,500.00 2.19
TOTAL OTHER TRANSFERABLE SECURITIES 5,087,500.00 2.19
TOTAL INVESTMENTS 216,533,658.26 93.30
CASH
15,348,191.34 6.61
OTHER NET ASSETS
195,216.49 0.09
TOTAL NET ASSETS 232,077,066.09 100.00

SEF PLACERUM DYNAMISK
Statement of Investments and other net assets at December 31, 2018 (in SEK)
The accompanying notes form an integral part of these financial statements.
38
Description
Number of shares
Market Value (in SEK)
% of NAV
INVESTMENT FUNDS
INVESTMENT FUNDS IN SEK
CARNEGIE WORLDWIDE ASIA FUND - 1A 12,333 16,846,588.93 6.79
DANSKE INVEST KORT RANTA SI SEKC 11,342 13,239,949.31 5.33
HANDELSBANKEN EUROPAFOND INDEX 67,778 7,038,053.58 2.83
HANDELSBANKEN KORTRANTEFOND 118,096 12,300,883.69 4.95
HANDELSBANKEN MSCI USA INDEX 112,698 35,969,661.39 14.48
HANDELSBANKEN SVERIGEFOND INDEX 3,887 39,025,861.36 15.71
SWEDBANK ROBUR ACCESS EUROPA 160,987 19,487,485.13 7.85
SWEDBANK ROBUR ACCESS SVERIGE 218,057 35,150,775.21 14.15
SWEDBANK ROBUR ACCESS USA 132,780 34,387,270.68 13.84
SWEDBANK ROBUR PENNINGMARKNADSFOND 189,566 19,153,749.83 7.71
232,600,279.11 93.64
TOTAL INVESTMENT FUNDS 232,600,279.11 93.64
TOTAL INVESTMENTS 232,600,279.11 93.64
CASH
15,915,789.16 6.41
OTHER NET LIABILITIES
-123,811.28 -0.05
TOTAL NET ASSETS 248,392,256.99 100.00

SEF PLACERUM OPTIMERA
Statement of Investments and other net assets at December 31, 2018 (in SEK)
The accompanying notes form an integral part of these financial statements.
39
Description
Number of shares or
nominal value
Market Value (in SEK)
% of NAV
I. TRANSFERABLE SECURITIES ADMITTED TO AN OFFICIAL EXCHANGE LISTING
BONDS
BONDS IN NOK
AKER 31/01/2023 FRN 4,000,000 4,083,137.36 1.37
FJORD 1 ASA FRN 22 5,000,000 5,206,771.51 1.75
GLX HOLDING FRN 23 6,000,000 6,201,843.39 2.08
LAERINGSVERKSTEDET AS 6,000,000 6,101,564.83 2.05
TEEKAY LNG PARTNERS 19/05/2020 FRN 12,000,000 12,341,976.89 4.14
33,935,293.98 11.39
BONDS IN SEK
GUNNEBO INDUSTRIER AB 6,000,000 6,060,000.00 2.03
HEIMSTADEN AB 7,000,000 7,134,785.00 2.39
IA HEDIN BIL FRN 22 6,000,000 5,955,000.00 2.00
ISLANDSBANKI FRN 23/11/2027 6,000,000 5,742,330.00 1.93
LANDSHYPOTEK FRN PERP 5,000,000 5,112,175.00 1.72
MAGNOLIA BOS 13/10/2021 FRN 5,000,000 4,900,000.00 1.64
OPUS GRP FRN 21 4,000,000 4,130,000.00 1.39
SERNEKE GROUP 01/06/2021 FRN 7,000,000 6,580,000.00 2.21
SIRIUS INTERNATIONAL GRP 9,000,000 9,055,530.00 3.04
STENDORREN FASTIGHETER 07/06/2020 FRN 6,000,000 6,060,000.00 2.03
STILLFRONT GROUP AB 22/11/2022 FRN 6,250,000 6,254,968.75 2.10
TRYG FORSIKRING PERP FRN 6,000,000 5,865,000.00 1.97
VERISURE MIDHOLDING 01/12/2023 FRN 6,000,000 6,062,550.00 2.03
VOSTOK NEW VENTURES 6.150% 14/06/2022 9,000,000 9,135,000.00 3.06
WEST ATLANTIC 6.500% 2019 5,000,000 4,750,000.00 1.59
92,797,338.75 31.13
TOTAL BONDS 126,732,632.73 42.52
TOTAL TRANSFERABLE SECURITIES ADMITTED TO AN OFFICIAL EXCHANGE LISTING 126,732,632.73 42.52
II. INVESTMENT FUNDS
INVESTMENT FUNDS IN SEK
CARNEGIE FONDER PORTFOLIO CORPORATE BOND - A 68,972 28,714,108.34 9.63
DANSKE INVEST KORT RANTA SI SEKC 17,054 19,907,737.34 6.68
NORRON PREMIUM RC 366,328 43,670,003.20 14.65
NORRON SICAV PRESERVE FUND RC - SEK 278,309 32,826,578.51 11.01
SEB PRIME SOLUTIONS NORDIC CROSS STABLE RETURN 200,000 18,814,000.00 6.31
143,932,427.39 48.28
TOTAL INVESTMENT FUNDS 143,932,427.39 48.28
III. OTHER TRANSFERABLE SECURITIES
BONDS
BONDS IN NOK
NORTURA 25/08/2078 FRN 3,000,000 3,008,356.87 1.01
3,008,356.87 1.01

SEF PLACERUM OPTIMERA
Statement of Investments and other net assets at December 31, 2018 (in SEK) (continued)
The accompanying notes form an integral part of these financial statements.
40
Description
Number of shares or
nominal value
Market Value (in SEK)
% of NAV
BONDS IN SEK
STUDSVIK AB FRN 19 3,335,000 3,350,007.50 1.12
3,350,007.50 1.12
TOTAL BONDS 6,358,364.37 2.13
TOTAL OTHER TRANSFERABLE SECURITIES 6,358,364.37 2.13
TOTAL INVESTMENTS 277,023,424.49 92.93
CASH
21,902,570.63 7.35
OTHER NET LIABILITIES
-842,637.41 -0.28
TOTAL NET ASSETS 298,083,357.71 100.00

SEF ASCENSUS BALANSERAD
Statement of Investments and other net assets at December 31, 2018 (in SEK)
The accompanying notes form an integral part of these financial statements.
41
Description
Number of shares
Market Value (in SEK)
% of NAV
INVESTMENT FUNDS
INVESTMENT FUNDS IN SEK
AMF RANTEFOND LANG 708,064 103,596,813.38 10.67
CARNEGIE FONDER PORTFOLIO CORPORATE BOND - A 59,711 24,858,456.77 2.55
CLIENS FORETAGSOBLIGATIONER - A 35,148 34,894,558.33 3.59
DANSKE INVEST KORT RANTA SI SEKC 73,683 86,012,371.72 8.86
HANDELSBANKEN EMERGING MARKETS INDEX - A1S 200,228 27,224,998.58 2.80
HANDELSBANKEN MSCI USA INDEX 351,028 112,037,742.92 11.54
ÖHMAN ETISK INDEX EUROPA 500,282 64,551,444.60 6.65
ÖHMAN ETISK INDEX JAPAN 65,393 6,640,614.51 0.68
ÖHMAN ETISK INDEX SVERIGE 380,265 84,399,924.73 8.69
ÖHMAN FORETAGSOBLIGATIONSFOND - A 529,335 62,350,420.32 6.42
SEB PRIME SOLUTIONS NORDIC CROSS SMALL CAP EDGE 50,451 5,354,392.86 0.55
SEB PRIME SOLUTIONS NORDIC CROSS STABLE RETURN 436,027 43,375,920.90 4.47
SEB PRIME SOLUTIONS NORDIC CROSS TOTAL RETURN BOND FUND 480,972 47,678,803.03 4.91
SPILTAN RANTEFOND SVERIGE 330,685 40,181,581.98 4.14
SPP OBLIGATIONSFOND 348,108 51,807,495.19 5.33
SWEDBANK ROBUR ACCESS ASIEN 139,284 30,840,270.39 3.18
SWEDBANK ROBUR ACCESS EUROPA 33,199 4,018,727.03 0.41
SWEDBANK ROBUR ACCESS USA 434,335 112,483,986.78 11.58
942,308,524.02 97.02
INVESTMENT FUNDS IN USD
SCHRODER SIF GL CS CONV B - CA 20,982 20,156,979.90 2.08
20,156,979.90 2.08
TOTAL INVESTMENT FUNDS 962,465,503.92 99.10
TOTAL INVESTMENTS 962,465,503.92 99.10
CASH
9,122,384.98 0.94
OTHER NET LIABILITIES
-377,040.00 -0.04
TOTAL NET ASSETS 971,210,848.90 100.00
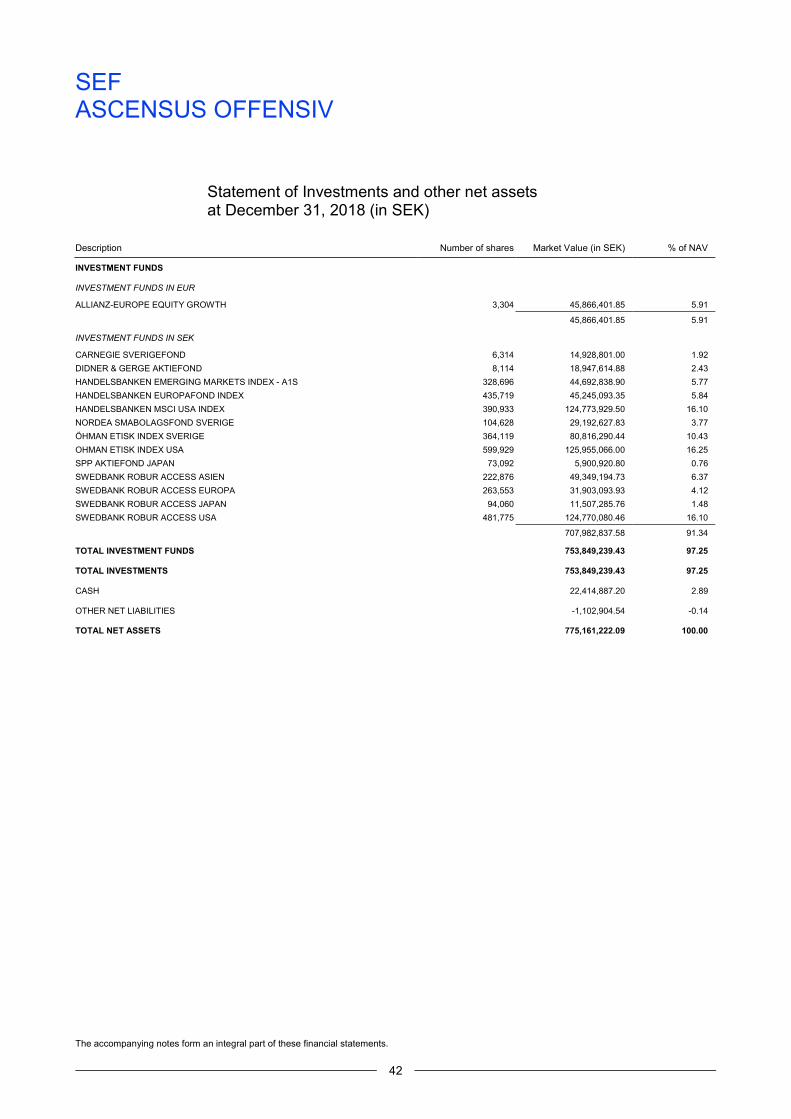
SEF ASCENSUS OFFENSIV
Statement of Investments and other net assets at December 31, 2018 (in SEK)
The accompanying notes form an integral part of these financial statements.
42
Description
Number of shares
Market Value (in SEK)
% of NAV
INVESTMENT FUNDS
INVESTMENT FUNDS IN EUR
ALLIANZ-EUROPE EQUITY GROWTH 3,304 45,866,401.85 5.91
45,866,401.85 5.91
INVESTMENT FUNDS IN SEK
CARNEGIE SVERIGEFOND 6,314 14,928,801.00 1.92
DIDNER & GERGE AKTIEFOND 8,114 18,947,614.88 2.43
HANDELSBANKEN EMERGING MARKETS INDEX - A1S 328,696 44,692,838.90 5.77
HANDELSBANKEN EUROPAFOND INDEX 435,719 45,245,093.35 5.84
HANDELSBANKEN MSCI USA INDEX 390,933 124,773,929.50 16.10
NORDEA SMABOLAGSFOND SVERIGE 104,628 29,192,627.83 3.77
ÖHMAN ETISK INDEX SVERIGE 364,119 80,816,290.44 10.43
OHMAN ETISK INDEX USA 599,929 125,955,066.00 16.25
SPP AKTIEFOND JAPAN 73,092 5,900,920.80 0.76
SWEDBANK ROBUR ACCESS ASIEN 222,876 49,349,194.73 6.37
SWEDBANK ROBUR ACCESS EUROPA 263,553 31,903,093.93 4.12
SWEDBANK ROBUR ACCESS JAPAN 94,060 11,507,285.76 1.48
SWEDBANK ROBUR ACCESS USA 481,775 124,770,080.46 16.10
707,982,837.58 91.34
TOTAL INVESTMENT FUNDS 753,849,239.43 97.25
TOTAL INVESTMENTS 753,849,239.43 97.25
CASH
22,414,887.20 2.89
OTHER NET LIABILITIES
-1,102,904.54 -0.14
TOTAL NET ASSETS 775,161,222.09 100.00

SEF ASCENSUS TREND
Statement of Investments and other net assets at December 31, 2018 (in SEK)
The accompanying notes form an integral part of these financial statements.
43
Description
Number of shares
Market Value (in SEK)
% of NAV
INVESTMENT FUNDS
INVESTMENT FUNDS IN SEK
AMF RANTEFOND LANG 266,209 38,948,988.69 8.57
CARNEGIE FONDER PORTFOLIO CORPORATE BOND - A 11,935 4,968,869.08 1.08
CLIENS FORETAGSOBLIGATIONER - A 15,048 14,939,802.92 3.29
HANDELSBANKEN EMERGING MARKETS INDEX - A1S 152,314 20,710,186.66 4.56
HANDELSBANKEN MSCI USA INDEX 219,461 70,045,289.30 15.41
ÖHMAN ETISK INDEX EUROPA 319,287 41,197,611.83 9.06
ÖHMAN ETISK INDEX JAPAN 85,242 8,656,274.75 1.90
ÖHMAN ETISK INDEX SVERIGE 301,344 66,883,203.85 14.71
OHMAN ETISK INDEX USA 94,919 19,928,289.55 4.38
ÖHMAN FORETAGSOBLIGATIONSFOND - A 87,105 10,260,050.66 2.26
SEB PRIME SOLUTIONS NORDIC CROSS STABLE RETURN 200,669 19,962,528.05 4.39
SEB PRIME SOLUTIONS NORDIC CROSS TOTAL RETURN BOND FUND 130,579 12,944,281.40 2.85
SWEDBANK ROBUR ACCESS ASIEN 101,359 22,443,009.62 4.94
SWEDBANK ROBUR ACCESS EUROPA 79,619 9,637,892.47 2.12
SWEDBANK ROBUR ACCESS USA 274,221 71,017,859.96 15.62
432,544,138.79 95.14
INVESTMENT FUNDS IN USD
SCHRODER SIF GL CS CONV B - CA 13,509 12,977,925.02 2.85
12,977,925.02 2.85
TOTAL INVESTMENT FUNDS 445,522,063.81 97.99
TOTAL INVESTMENTS 445,522,063.81 97.99
CASH
9,851,856.72 2.17
OTHER NET LIABILITIES
-707,472.81 -0.16
TOTAL NET ASSETS 454,666,447.72 100.00

SEF LHV PERSIAN GULF FUND
Statement of Investments and other net assets at December 31, 2018 (in EUR)
The accompanying notes form an integral part of these financial statements.
44
Description
Nominal value
Market Value (in EUR)
% of NAV
I. TRANSFERABLE SECURITIES ADMITTED TO AN OFFICIAL EXCHANGE LISTING
SHARES
SHARES IN AED
ALDAR PROPERTIES PJSC 600,000 220,281.60 2.72
DUBAI ISLAMIC BANK 310,000 369,520.00 4.57
EMAAR DEVELOPMENT PJSC 300,000 320,409.60 3.96
EMAAR PROPERTIES PJSC 300,000 285,364.80 3.53
EMIRATES NBD PJSC 250,000 499,448.00 6.17
RAS AL KHAIMAH CERAMICS 976,336 418,965.30 5.18
UNION NATIONAL BANK ABU DHABI 150,000 167,714.40 2.07
2,281,703.70 28.20
SHARES IN BHD
ALUMINIUM BAHRAIN BSC 400,000 557,436.00 6.89
557,436.00 6.89
SHARES IN KWD
AGILITY 143,750 328,087.24 4.05
HUMANSOFT HOLDING CO KSC 20,000 187,313.75 2.31
MEZZAN HOLDING CO KSCC 100,000 148,410.13 1.83
NATIONAL BANK OF KUWAIT 150,000 360,506.93 4.45
1,024,318.05 12.64
SHARES IN OMR
BANKMUSCAT SAOG 675,000 638,553.24 7.89
638,553.24 7.89
SHARES IN QAR
AL MEERA CONSUMER GOODS CO 2,500 87,968.35 1.09
87,968.35 1.09
SHARES IN SAR
ABDULLAH AL OTHAIM MARKETS 22,000 359,359.00 4.44
AL RAJHI BANK 10,000 200,447.65 2.48
AL TAYYAR TRAVEL GRP 35,000 161,058.17 1.99
JARIR MARKETING CO 4,000 141,876.80 1.75
UNITED ELECTRONICS CO 42,500 604,959.88 7.47
UNITED INTERNATIONAL TRANSPORT 50,000 305,105.13 3.77
WALAA COOPERATIVE INSURANCE 60,500 302,118.25 3.73
2,074,924.88 25.63
TOTAL SHARES 6,664,904.22 82.34
TOTAL TRANSFERABLE SECURITIES ADMITTED TO AN OFFICIAL EXCHANGE LISTING 6,664,904.22 82.34

SEF LHV PERSIAN GULF FUND
Statement of Investments and other net assets at December 31, 2018 (in EUR) (continued)
The accompanying notes form an integral part of these financial statements.
45
Description
Nominal value
Market Value (in EUR)
% of NAV
II. OTHER TRANSFERABLE SECURITIES
SHARES
SHARES IN AED
DEPA LTD 1,200,000 264,624.00 3.27
264,624.00 3.27
TOTAL SHARES 264,624.00 3.27
TOTAL OTHER TRANSFERABLE SECURITIES 264,624.00 3.27
TOTAL INVESTMENTS 6,929,528.22 85.61
CASH
1,147,662.38 14.18
OTHER NET ASSETS
16,974.82 0.21
TOTAL NET ASSETS 8,094,165.42 100.00

SEF KUYLENSTIERNA & SKOG EQUITIES
Statement of Investments and other net assets at December 31, 2018 (in SEK)
The accompanying notes form an integral part of these financial statements.
46
Description
Number of shares or
nominal value
Market Value (in SEK)
% of NAV
I. TRANSFERABLE SECURITIES ADMITTED TO AN OFFICIAL EXCHANGE LISTING
SHARES
SHARES IN EUR
CAPGEMINI SE 8,000 7,062,442.33 2.49
DAIMLER AG-REGISTERED 10,000 4,707,269.56 1.66
DEUTSCHE BANK AG-REGISTERED 35,000 2,503,075.98 0.87
INFINEON TECHNOLOGIES AG 35,000 6,262,175.74 2.21
LVMH MOET HENNESSY LOUIS VUITTON 2,000 5,210,704.40 1.84
SCHNEIDER ELECTRIC SE 10,000 6,108,889.57 2.15
SIEMENS AG - REG 6,000 6,015,995.08 2.12
37,870,552.66 13.34
SHARES IN JPY
SHIMANO INC 4,000 5,036,799.34 1.77
5,036,799.34 1.77
SHARES IN SEK
ABB LTD 37,500 6,440,625.00 2.27
ATLAS COPCO AB - A 20,000 4,230,000.00 1.49
AUTOLIV INC-SWED DEP RECEIPT 7,000 4,481,400.00 1.58
BILLERUDKORSNAS AB 35,000 3,739,750.00 1.32
EPIROC AB - A 20,000 1,674,000.00 0.59
H&M AB - B 26,000 3,292,640.00 1.16
INVESTOR AB - B 25,000 9,440,000.00 3.32
KINNEVIK AB - B 20,000 4,286,000.00 1.51
NORDEA BANK ABP 50,000 3,764,500.00 1.33
ONCOCEPTIDES AB 5,000 661,000.00 0.23
SANDVIK AB 52,000 6,617,000.00 2.33
SKANDINAVISKA ENSKILDA BANK - A 40,000 3,458,400.00 1.22
SKANSKA AB - B 20,000 2,820,000.00 0.99
SKF AB - B 30,000 4,035,000.00 1.42
SWEDBANK AB - A 25,000 4,942,500.00 1.74
TELIA CO AB 160,000 6,715,200.00 2.36
THULE GROUP AB/THE 20,000 3,214,000.00 1.13
TRELLEBORG AB - B 30,000 4,212,000.00 1.48
VEONEER INC - SDR 7,000 1,627,850.00 0.57
VOLVO AB - B 50,000 5,812,500.00 2.05
85,464,365.00 30.09
SHARES IN USD
ALPHABET INC - C 1,002 9,401,569.58 3.31
APPLE INC 4,200 5,881,813.84 2.07
HOME DEPOT INC 4,000 6,099,256.86 2.15
NIKE INC - B 14,000 9,230,762.20 3.25
UNITED TECHNOLOGIES CORP 6,000 5,750,724.82 2.03
WALMART INC 6,000 4,951,833.96 1.74
41,315,961.26 14.55
TOTAL SHARES 169,687,678.26 59.75
TOTAL TRANSFERABLE SECURITIES ADMITTED TO AN OFFICIAL EXCHANGE LISTING 169,687,678.26 59.75

SEF KUYLENSTIERNA & SKOG EQUITIES
Statement of Investments and other net assets at December 31, 2018 (in SEK) (continued)
The accompanying notes form an integral part of these financial statements.
47
Description
Number of shares or
nominal value
Market Value (in SEK)
% of NAV
II. INVESTMENT FUNDS
INVESTMENT FUNDS IN EUR
SPDR MSCI EUROPE FINANCIALS UCITS ETF 8,000 3,799,446.32 1.34
SPDR WORLD HEALTH CARE 15,000 4,760,842.82 1.68
8,560,289.14 3.02
INVESTMENT FUNDS IN GBP
INVESCO EQQQ NASDAQ - 100 UCITS 9,000 12,424,471.49 4.38
ISHARES MSCI TAIWAN 20,000 7,150,055.98 2.52
19,574,527.47 6.90
INVESTMENT FUNDS IN SEK
SEB PRIME SOLUTIONS NORDIC CROSS TOTAL RETURN BOND FUND 49,360 4,893,010.01 1.72
SIMPLICITY FORETAGSOBLIGATION 40,090 4,958,306.61 1.75
SIMPLICITY LIKVIDITET - A 90,102 9,968,888.57 3.51
19,820,205.19 6.98
INVESTMENT FUNDS IN USD
DB X-TRACKERS RUSSEL 2000 UCITS ETF 5,000 8,303,199.94 2.92
FIDELITY CHINA CONSUMER FUND 69,435 10,650,212.81 3.75
GOLDMAN SACHS INDIA EQ - I USD A 63,760 12,269,105.96 4.32
INVESCO NASDAQ BIOTECH UCITS - E 20,000 5,449,506.61 1.92
ISHARES CHINA LARGE CAP UCITS 8,000 8,000,011.81 2.82
ISHARES CORE S&P 500 UCITS ETF 4,000 8,761,116.09 3.09
VARIOPARTNER-SECTORAL EMERGING MARKETS HEALTHCARE FUND 99,666 7,790,845.49 2.74
61,223,998.71 21.56
TOTAL INVESTMENT FUNDS 109,179,020.51 38.46
TOTAL INVESTMENTS 278,866,698.77 98.21
CASH
5,075,408.47 1.79
OTHER NET ASSETS
7,718.73 0.00
TOTAL NET ASSETS 283,949,825.97 100.00

SEF ENTROPICS CAT BOND FUND
Statement of Investments and other net assets at December 31, 2018 (in SEK)
The accompanying notes form an integral part of these financial statements.
48
Description
Nominal value
Market Value (in SEK)
% of NAV
I. TRANSFERABLE SECURITIES ADMITTED TO AN OFFICIAL EXCHANGE LISTING
BONDS
BONDS IN USD
ACORN RE 1121 FRN 500,000 4,374,278.37 1.81
AKIBARE RE 07/04/2020 FRN - A 250,000 2,187,094.86 0.91
AKIBARE RE 07/04/2022 FRN - A 250,000 2,169,763.52 0.90
ALAMO RE 08/06/2020 FRN 500,000 4,415,545.57 1.83
ALAMO RE A 07/06/2021 FRN 250,000 2,191,771.22 0.91
AOZORA RE LTD 07/04/2020 FRN 250,000 2,201,079.61 0.91
AOZORA RE LTD 07/04/2021 FRN - A 17 1 500,000 4,382,744.58 1.82
ARMOR RE II LTD 4.034% 08/06/2023 250,000 2,194,962.66 0.91
ATLAS CAPITAL UK 07/06/2022 FRN 250,000 2,211,208.03 0.92
ATLAS IX CAP 07/01/2019 FRN - A 850,000 5,877,583.34 2.43
BLUE HALO 21/06/2019 FRN - A 500,000 4,298,481.48 1.78
BONANZA RE 31/12/2019 FRN 500,000 4,340,945.47 1.80
BOWLINE RE 23/05/2022 FRN 250,000 2,151,988.93 0.89
BUFFALO RE 07/04/2020 FRN - 1A 250,000 2,214,443.80 0.92
BUFFALO RE 07/04/2020 FRN - 1B 250,000 2,204,470.52 0.91
CAELUS RE IV 06/03/2020 FRN 250,000 2,160,876.23 0.89
CAELUS RE V 05/06/2020 FRN - A 250,000 1,928,388.11 0.80
CAELUS RE V 05/06/2020 FRN - B 500,000 1,307,607.15 0.54
CAELUS RE V 05/06/2020 FRN - C 500,000 0.00 0.00
CAELUS RE V 05/06/2020 FRN - D 250,000 0.00 0.00
CAL PHOENIX A 13/08/2026 FRN 250,000 277,035.42 0.11
CASABLANCA 04/06/2020 FRN - 1A 250,000 2,240,440.80 0.93
CITRUS RE 25/02/2019 FRN - 1D 250,000 1,361,019.58 0.56
CITRUS RE LTD 20/03/2018 FRN 250,000 1,098,168.38 0.45
CRANBERRY RE 13/07/2020 FRN - A 250,000 2,188,136.52 0.91
EAST LANE RE VI 13/03/2020 FRN 500,000 4,427,690.80 1.83
EVERGLADES RE II LTD 04/05/2021 FRN - A 250,000 2,184,789.92 0.90
EVERGLADES RE II LTD 08/05/2020 FRN - A 250,000 2,200,902.30 0.91
FIRST COAST 07/06/2021 FRN 250,000 2,177,520.52 0.90
FLOODSMART 06/08/2021 FRN 250,000 2,196,802.18 0.91
GALILEI RE 08/01/2020 FRN - E1 250,000 2,211,983.73 0.92
GALILEI RE 08/01/2021 FRN - B2 250,000 2,174,639.34 0.90
GALILEI RE 08/01/2021 FRN - C2 250,000 2,174,794.49 0.90
GALILEO RE 06/11/2020 FRN - 1A 500,000 4,445,864.32 1.84
GOLDEN STATE RE II LTD 250,000 2,216,460.62 0.92
GOLDEN STATE RE LTD 08/01/2023 FRN 250,000 2,201,522.87 0.91
INTEGRITY 10/06/2020 FRN - 1D 250,000 2,193,743.71 0.91
KENDALL CAT BOND 06/05/2021 250,000 2,185,255.35 0.91
KILIMANJARO CAT BOND 06/05/2022 250,000 2,145,362.25 0.89
KILIMANJARO II RE LTD 20/04/2021 FRN - A 250,000 2,198,198.44 0.91
KILIMANJARO II RE LTD 20/04/2021 FRN - B1 500,000 4,397,638.00 1.82
KILIMANJARO II RE LTD 20/04/2021 FRN - C1 250,000 2,201,234.75 0.91
KILIMANJARO RE 06/12/2019 FRN 250,000 2,212,648.60 0.92
KILIMANJARO RE 25/11/2019 FRN - 2C 500,000 4,359,739.55 1.81
KIZUNA II RE 11/04/2023 FRN 250,000 2,154,515.50 0.89
LONGPOINT RE III 01/06/2022 FRN 500,000 4,408,852.39 1.83
MANAREE RE LTD II 07/06/2021 250,000 2,186,851.06 0.91
MANATEE RE 13/03/2019 FRN 250,000 2,225,924.15 0.92
MERNA RE LTD 08/04/2019 FRN 250,000 2,215,651.67 0.92
MERNA RE LTD 08/04/2020 FRN 400,000 3,534,067.64 1.46
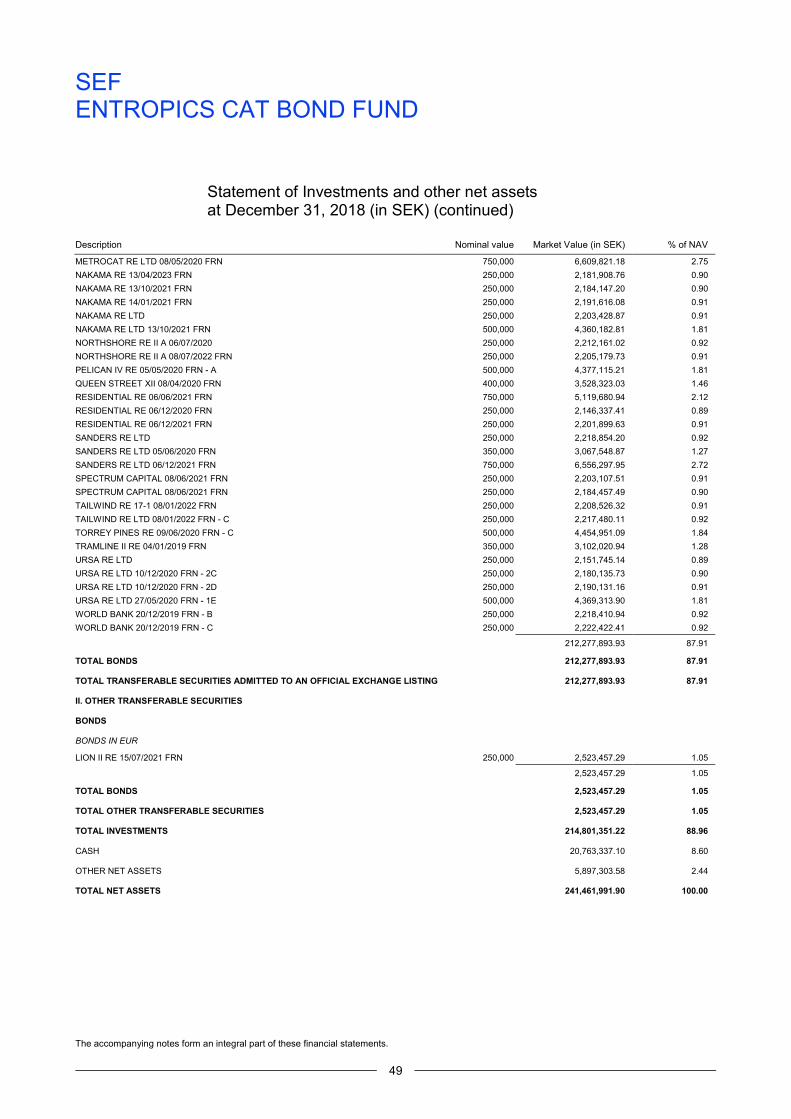
SEF ENTROPICS CAT BOND FUND
Statement of Investments and other net assets at December 31, 2018 (in SEK) (continued)
The accompanying notes form an integral part of these financial statements.
49
Description
Nominal value
Market Value (in SEK)
% of NAV
METROCAT RE LTD 08/05/2020 FRN 750,000 6,609,821.18 2.75
NAKAMA RE 13/04/2023 FRN 250,000 2,181,908.76 0.90
NAKAMA RE 13/10/2021 FRN 250,000 2,184,147.20 0.90
NAKAMA RE 14/01/2021 FRN 250,000 2,191,616.08 0.91
NAKAMA RE LTD 250,000 2,203,428.87 0.91
NAKAMA RE LTD 13/10/2021 FRN 500,000 4,360,182.81 1.81
NORTHSHORE RE II A 06/07/2020 250,000 2,212,161.02 0.92
NORTHSHORE RE II A 08/07/2022 FRN 250,000 2,205,179.73 0.91
PELICAN IV RE 05/05/2020 FRN - A 500,000 4,377,115.21 1.81
QUEEN STREET XII 08/04/2020 FRN 400,000 3,528,323.03 1.46
RESIDENTIAL RE 06/06/2021 FRN 750,000 5,119,680.94 2.12
RESIDENTIAL RE 06/12/2020 FRN 250,000 2,146,337.41 0.89
RESIDENTIAL RE 06/12/2021 FRN 250,000 2,201,899.63 0.91
SANDERS RE LTD 250,000 2,218,854.20 0.92
SANDERS RE LTD 05/06/2020 FRN 350,000 3,067,548.87 1.27
SANDERS RE LTD 06/12/2021 FRN 750,000 6,556,297.95 2.72
SPECTRUM CAPITAL 08/06/2021 FRN 250,000 2,203,107.51 0.91
SPECTRUM CAPITAL 08/06/2021 FRN 250,000 2,184,457.49 0.90
TAILWIND RE 17-1 08/01/2022 FRN 250,000 2,208,526.32 0.91
TAILWIND RE LTD 08/01/2022 FRN - C 250,000 2,217,480.11 0.92
TORREY PINES RE 09/06/2020 FRN - C 500,000 4,454,951.09 1.84
TRAMLINE II RE 04/01/2019 FRN 350,000 3,102,020.94 1.28
URSA RE LTD 250,000 2,151,745.14 0.89
URSA RE LTD 10/12/2020 FRN - 2C 250,000 2,180,135.73 0.90
URSA RE LTD 10/12/2020 FRN - 2D 250,000 2,190,131.16 0.91
URSA RE LTD 27/05/2020 FRN - 1E 500,000 4,369,313.90 1.81
WORLD BANK 20/12/2019 FRN - B 250,000 2,218,410.94 0.92
WORLD BANK 20/12/2019 FRN - C 250,000 2,222,422.41 0.92
212,277,893.93 87.91
TOTAL BONDS 212,277,893.93 87.91
TOTAL TRANSFERABLE SECURITIES ADMITTED TO AN OFFICIAL EXCHANGE LISTING 212,277,893.93 87.91
II. OTHER TRANSFERABLE SECURITIES
BONDS
BONDS IN EUR
LION II RE 15/07/2021 FRN 250,000 2,523,457.29 1.05
2,523,457.29 1.05
TOTAL BONDS 2,523,457.29 1.05
TOTAL OTHER TRANSFERABLE SECURITIES 2,523,457.29 1.05
TOTAL INVESTMENTS 214,801,351.22 88.96
CASH
20,763,337.10 8.60
OTHER NET ASSETS
5,897,303.58 2.44
TOTAL NET ASSETS 241,461,991.90 100.00

SEF EME EUROPEAN BEST IDEAS
Statement of Investments and other net assets at December 31, 2018 (in SEK)
The accompanying notes form an integral part of these financial statements.
50
Description
Nominal value
Market Value (in SEK)
% of NAV
TRANSFERABLE SECURITIES ADMITTED TO AN OFFICIAL EXCHANGE LISTING
SHARES
SHARES IN CHF
DORMAKABA HOLDING AG 300 1,618,602.73 2.26
1,618,602.73 2.26
SHARES IN DKK
CHR HANSEN HOLDING A/S 2,200 1,741,564.93 2.45
NOVO NORDISK A/S - B 4,800 1,964,470.75 2.76
3,706,035.68 5.21
SHARES IN EUR
1&1 DRILLISCH AG 3,300 1,499,600.12 2.11
AMADEUS IT GROUP SA 2,500 1,574,900.03 2.21
BANCA IFIS SPA 6,300 992,832.97 1.39
BANCA SISTEMA SPA 47,000 674,664.21 0.95
BAWAG GROUP AG 4,700 1,727,140.37 2.43
CORTICEIRA AMORIM SA 17,000 1,516,456.47 2.13
CTS EVENTIM AG & CO KGAA 5,100 1,707,843.74 2.40
DANONE GROUP 3,100 1,938,572.75 2.72
DUERR AG 5,500 1,729,006.46 2.43
FRESENIUS 3,000 1,302,060.90 1.83
INDUSTRIA DE DISENO TEXTIL 7,000 1,609,863.63 2.26
INNOGY SE 5,600 2,329,457.60 3.27
INTERPUMP GROUP SPA 8,000 2,139,239.21 3.00
MAISONS DU MONDE SA 8,000 1,341,946.07 1.88
ORPEA 1,900 1,710,448.07 2.40
RELX PLC 9,700 1,786,240.13 2.51
SARTORIUS STEDIM BIOTECH 1,600 1,386,240.13 1.95
SIEMENS HEALTHINEERS AG 6,000 2,253,460.47 3.16
SILTRONIC AG 100 74,254.08 0.10
SYMRISE AG 2,500 1,654,875.42 2.32
TELEPERFORMANCE 1,300 1,836,768.17 2.58
TKH GROUP 3,600 1,477,945.25 2.08
UBISOFT ENTERTAINMENT 2,200 1,558,248.74 2.19
WIRECARD AG 1,000 1,362,144.98 1.91
37,184,209.97 52.21
SHARES IN GBP
ARROW GLOBAL GROUP PLC 50,000 968,709.94 1.36
BEAZLEY PLC 27,000 1,549,992.68 2.18
BELLWAY 5,500 1,571,513.26 2.21
BUNZL 8,600 2,298,079.78 3.23
HALMA PLC 14,500 2,218,095.91 3.12
RANDGOLD RESOURCES LTD 2,800 2,131,116.43 2.99
RPC GROUP 21,000 1,546,347.24 2.17
12,283,855.24 17.26
SHARES IN NOK
GAMING INNOVATION GROUP 24,300 573,415.72 0.81
573,415.72 0.81

SEF EME EUROPEAN BEST IDEAS
Statement of Investments and other net assets at December 31, 2018 (in SEK) (continued)
The accompanying notes form an integral part of these financial statements.
51
Description
Nominal value
Market Value (in SEK)
% of NAV
SHARES IN SEK
AF AB - B 11,800 1,899,800.00 2.67
ASSA ABLOY AB - B 10,000 1,586,000.00 2.23
DORO AB 40,000 1,352,000.00 1.90
ESSITY AKTIEBOLAG - B 7,500 1,645,500.00 2.31
KAMBI GROUP PLC 11,500 2,162,000.00 3.04
RAYSEARCH LABORATORIES AB 13,000 1,251,900.00 1.76
9,897,200.00 13.91
TOTAL SHARES 65,263,319.34 91.66
TOTAL TRANSFERABLE SECURITIES ADMITTED TO AN OFFICIAL EXCHANGE LISTING 65,263,319.34 91.66
TOTAL INVESTMENTS 65,263,319.34 91.66
CASH
5,699,732.10 8.00
OTHER NET ASSETS
238,813.72 0.34
TOTAL NET ASSETS 71,201,865.16 100.00

SEF PENSER DYNAMISK ALLOKERING
Statement of Investments and other net assets at December 31, 2018 (in SEK)
The accompanying notes form an integral part of these financial statements.
52
Description
Number of shares or
nominal value
Market Value (in SEK)
% of NAV
I. TRANSFERABLE SECURITIES ADMITTED TO AN OFFICIAL EXCHANGE LISTING
BONDS
BONDS IN SEK
AF AB FRN 20 1,000,000 1,005,950.00 0.31
AKER 24/07/2019 FRN 2,000,000 2,026,000.00 0.62
BILLERUDKORSNAS 20/03/2023 FRN 2,000,000 1,988,720.00 0.61
FABEGE AB 28/02/2023 FRN 3,000,000 2,943,675.00 0.90
FASTIGHETS BALDER 21/03/2022 FRN 2,000,000 1,969,520.00 0.60
FASTPARTNER AB 05/04/2019 FRN 1,000,000 1,005,190.00 0.31
HEXAGON 24/05/2021 FRN 2,000,000 2,014,260.00 0.62
HUSQVARNA FRN 21 2,000,000 2,039,740.00 0.63
LANSFOR FRN 26 2,000,000 2,041,890.00 0.63
LANSFORSAKRINGAR BANK 12/07/2021 FRN 1,000,000 1,013,895.00 0.31
LANTMANNEN FRN 2020 2,000,000 2,039,590.00 0.63
OPUS GRP FRN 21 1,000,000 1,032,500.00 0.32
RESURS BANK FRN 31/08/2019 2,000,000 2,010,880.00 0.62
SAAB AB 28/09/2022 FRN 2,000,000 1,999,990.00 0.61
SAS 5.375% 24/11/2022 2,000,000 2,030,000.00 0.62
SPARBANKEN SKANE FRN 2021 3,000,000 3,056,490.00 0.94
SWEDISH MATCH AB 09/06/2020 FRN 2,000,000 2,017,740.00 0.62
TELIA CO AB 2,000,000 2,014,000.00 0.62
VASAKRONAN AB 1.144% 29/08/2022 2,000,000 2,006,560.00 0.62
VOLVOFINANS BANK FRN 08/06/2023 1,000,000 998,260.00 0.31
37,254,850.00 11.45
TOTAL BONDS 37,254,850.00 11.45
SHARES
SHARES IN SEK
AAK AB 2,940 360,738.00 0.11
ABB LTD 26,900 4,577,035.00 1.40
ASSA ABLOY AB - B 6,150 969,855.00 0.30
ASTRAZENECA 1,711 1,154,411.70 0.35
ATLAS COPCO AB - A 22,413 4,706,730.00 1.44
AUTOLIV INC-SWED DEP RECEIPT 4,129 2,600,444.20 0.80
BILLERUDKORSNAS AB 4,900 518,175.00 0.16
DOMETIC GROUP AB-WI 37,000 2,040,550.00 0.63
EPIROC AB - A 7,913 660,023.33 0.20
ERICSSON LM - B 19,089 1,484,360.64 0.46
ESSITY AKTIEBOLAG - B 8,200 1,780,220.00 0.55
FASTIGHETS BALDER AB - B 14,301 3,603,852.00 1.10
G5 ENTERTAINMENT AB 4,800 605,280.00 0.19
H&M AB - B 5,772 729,234.48 0.22
HANSA BIOPHARMA AB 3,900 1,079,520.00 0.33
HEXAGON AB - B 1,500 611,850.00 0.19
IMMUNOVIA AB 7,500 1,033,500.00 0.32
INDUSTRIVARDEN AB - C 17,093 3,063,065.60 0.94
INVESTOR AB - B 17,570 6,581,722.00 2.02
MIDSONA AB - B 20,000 1,226,000.00 0.38
MYCRONIC AB 12,500 1,476,250.00 0.45
NCC AB - B 5,924 816,327.20 0.25
NIBE INDUSTRIER AB - B 13,000 1,182,220.00 0.36
NORDEA BANK ABP 32,209 2,403,435.58 0.74

SEF PENSER DYNAMISK ALLOKERING
Statement of Investments and other net assets at December 31, 2018 (in SEK) (continued)
The accompanying notes form an integral part of these financial statements.
53
Description
Number of shares or
nominal value
Market Value (in SEK)
% of NAV
RAYSEARCH LABORATORIES AB 7,000 675,500.00 0.21
SANDVIK AB 32,553 4,113,071.55 1.26
SECURITAS AB - B 23,476 3,332,418.20 1.02
SKANDINAVISKA ENSKILDA BANK - A 58,491 5,030,226.00 1.54
STORYTEL AG 4,500 405,000.00 0.12
SVENSKA CELLULOSA AB SCA - B 13,682 940,227.04 0.29
SVENSKA HANDELSBANKEN AB - A 9,415 921,351.90 0.28
SWEDBANK AB - A 7,000 1,382,500.00 0.42
TELIA CO AB 52,758 2,210,032.62 0.68
TRELLEBORG AB - B 10,000 1,392,000.00 0.43
VEONEER INC - SDR 5,629 1,262,866.15 0.39
VOLVO AB - B 36,806 4,263,975.10 1.31
71,193,968.29 21.84
TOTAL SHARES 71,193,968.29 21.84
TOTAL TRANSFERABLE SECURITIES ADMITTED TO AN OFFICIAL EXCHANGE LISTING 108,448,818.29 33.29
II. INVESTMENT FUNDS
INVESTMENT FUNDS IN EUR
DB X-TRACKERS MSCI WORLD HEALTH CARE UCITS ETF 1C - EUR 35,221 9,529,111.68 2.92
ISHARES MSCI JAPAN 110,000 6,026,700.90 1.85
ISHARES MSCI WORLD SRI EUR - A 169,000 8,650,023.11 2.65
LYXOR ETF COMMODITIES CRB 104,969 15,032,531.04 4.61
LYXOR EUR 2-10Y INFL EXPECT 4,800 4,855,948.65 1.49
X EURO STOXX 50 SHORT SWAP 34,790 5,526,384.80 1.69
49,620,700.18 15.21
INVESTMENT FUNDS IN NOK
XACT OBX (UCITS ETF) 125,000 9,133,705.71 2.80
9,133,705.71 2.80
INVESTMENT FUNDS IN SEK
ENTER CROSS CREDIT - C 9,761 9,964,372.49 3.05
HANDELSBANKEN SVERIGE OMXSB INDEX 27,921 5,904,539.01 1.81
LANNEBO CORPORATE BOND 42,351 4,946,213.79 1.51
OHMAN FRN FOND HALLBAR - C 49,826 4,987,045.34 1.53
SIMPLICITY FORETAGSOBLIGAT - C 69,624 6,951,959.42 2.12
SIMPLICITY LIKVIDITET - A 135,291 14,965,940.13 4.59
SPILTAN HOGRANTEFOND 133,513 14,980,158.93 4.58
SPILTAN RANTEFOND SVERIGE 164,772 20,021,465.38 6.14
XACT NORDIC HIGH DIV LOW VOLATILITY 61,700 6,513,052.00 1.99
89,234,746.49 27.32
INVESTMENT FUNDS IN USD
AMUNDI ETF SHORT US TREASURY 7 18,490 12,568,401.24 3.85
ISHARES CORE S&P 500 UCITS ETF 5,066 11,072,372.59 3.39
ISHARES NASDAQ 100 USD ACC 3,200 10,089,762.83 3.09

SEF PENSER DYNAMISK ALLOKERING
Statement of Investments and other net assets at December 31, 2018 (in SEK) (continued)
The accompanying notes form an integral part of these financial statements.
54
Description
Number of shares or
nominal value
Market Value (in SEK)
% of NAV
ISHARES S&P 500 UTILITIES 205,203 9,984,920.86 3.06
LYXOR US 10Y INFL EXPECTATION 6,700 6,185,382.27 1.90
VANGUARD S&P 500 UCITS ETF 30,263 12,831,723.16 3.93
62,732,562.95 19.22
TOTAL INVESTMENT FUNDS 210,721,715.33 64.55
TOTAL INVESTMENTS 319,170,533.62 97.84
CASH
7,263,596.49 2.22
OTHER NET LIABILITIES
-210,892.36 -0.06
TOTAL NET ASSETS 326,223,237.75 100.00

SEF KAVALJER MULTI
Statement of Investments and other net assets at December 31, 2018 (in SEK)
The accompanying notes form an integral part of these financial statements.
55
Description
Number of shares or
nominal value
Market Value (in SEK)
% of NAV
I. TRANSFERABLE SECURITIES ADMITTED TO AN OFFICIAL EXCHANGE LISTING
BONDS
BONDS IN SEK
GUNNEBO INDUSTRIER AB 1,000,000 1,010,000.00 1.78
MARIEFJARD 30/03/2021 FRN 1,000,000 1,036,250.00 1.83
TOBIN PROPERTIES FRN 2019 1,000,000 1,007,500.00 1.78
3,053,750.00 5.39
TOTAL BONDS 3,053,750.00 5.39
SHARES
SHARES IN DKK
PANDORA A/S 4,800 1,738,434.70 3.06
1,738,434.70 3.06
SHARES IN EUR
KONE OYJ - B 1,800 769,793.91 1.36
SAMPO OYJ - A 7,400 2,901,425.20 5.12
3,671,219.11 6.48
SHARES IN SEK
ABB LTD 11,800 2,026,650.00 3.58
AGES INDUSTRI AB 3,000 191,400.00 0.34
ATLAS COPCO AB - B 14,000 2,727,760.00 4.82
AUTOLIV INC-SWED DEP RECEIPT 2,920 1,869,384.00 3.30
BAHNHOF AB - B 42,000 1,211,700.00 2.14
DOMETIC GROUP AB-WI 39,100 2,154,410.00 3.80
ESSITY AKTIEBOLAG - B 8,400 1,842,960.00 3.25
FASTIGHETS BALDER AB - B 9,000 2,273,400.00 4.01
HUSQVARNA AB - B 40,200 2,650,788.00 4.68
IMMUNOVIA AB 22,200 2,925,960.00 5.16
ITAB SHOP CONCEPT AB - B 121,385 1,852,335.10 3.27
NEW WAVE GROUP AB - B 60,000 2,865,000.00 5.06
QLIRO GROUP AB 120,000 1,111,200.00 1.96
SCANDIC HOTELS GROUP AB 30,000 2,352,000.00 4.15
SEMCON AB 39,000 1,848,600.00 3.26
STORYTEL AG 6,000 543,000.00 0.96
SVEDBERG I DALSTORP AB - B 20,000 430,000.00 0.76
SYSTEMAIR AB 15,000 1,428,000.00 2.52
THULE GROUP AB/THE 5,800 932,060.00 1.65
VEONEER INC - SDR 4,400 1,023,220.00 1.81
VOLVO AB - B 30,100 3,499,125.00 6.18
XANO INDUSTRI AB - B 8,286 1,267,758.00 2.24
39,026,710.10 68.90
TOTAL SHARES 44,436,363.91 78.44
TOTAL TRANSFERABLE SECURITIES ADMITTED TO AN OFFICIAL EXCHANGE LISTING 47,490,113.91 83.83

SEF KAVALJER MULTI
Statement of Investments and other net assets at December 31, 2018 (in SEK) (continued)
The accompanying notes form an integral part of these financial statements.
56
Description
Number of shares or
nominal value
Market Value (in SEK)
% of NAV
II. INVESTMENT FUNDS
INVESTMENT FUNDS IN SEK
SPILTAN RANTEFOND SVERIGE 56,666 6,885,431.67 12.15
6,885,431.67 12.15
TOTAL INVESTMENT FUNDS 6,885,431.67 12.15
TOTAL INVESTMENTS 54,375,545.58 95.98
CASH
2,205,372.77 3.90
OTHER NET ASSETS
69,354.06 0.12
TOTAL NET ASSETS 56,650,272.41 100.00

SEF FIRST ALLOKERING
Statement of Investments and other net assets at December 31, 2018 (in NOK)
The accompanying notes form an integral part of these financial statements.
57
Description
Number of shares or
nominal value
Market Value (in NOK)
% of NAV
I. TRANSFERABLE SECURITIES ADMITTED TO AN OFFICIAL EXCHANGE LISTING
BONDS
BONDS IN NOK
AVINOR FRN 19 10,000,000 10,008,838.00 1.27
HAFSLUND FRN 19 7,000,000 7,009,265.90 0.89
HELGELAND BOLIG FRN 20 9,000,000 9,033,045.30 1.15
POSTEN NORGE 28/06/2017 FRN 10,000,000 9,982,634.00 1.27
SPARBK 1 BOL FRN 20 25,000,000 25,184,242.50 3.20
STADSHYPO FRN 20 30,000,000 30,100,605.00 3.82
STATNETT SF 30,000,000 29,911,800.00 3.80
STOREBRAND ASA 10,000,000 10,165,738.00 1.29
TRYG FORSIK FRN 45 10,000,000 10,227,208.00 1.30
141,623,376.70 17.99
TOTAL BONDS 141,623,376.70 17.99
SHARES
SHARES IN NOK
AKER ASA A SHARES 3,000 1,386,000.00 0.18
BW LPG LTD 11,013 287,329.17 0.03
CRAYON GROUP HOLDING AS 135,261 2,166,881.22 0.28
DNO ASA 245,000 3,074,750.00 0.39
ELKEM AS 268,310 5,955,140.45 0.76
GOLDEN OCEAN GROUP LTD 10,000 523,500.00 0.06
MPC CONTAINER SHIPS AS 38,000 1,162,800.00 0.15
NORDIC SEMICONDUCTOR ASA 104,750 3,027,275.00 0.38
NORTHERN DRILLING LTD 52,783 2,681,376.40 0.34
NORWEGIAN AIR SHUTTLE AS 25,489 4,421,067.05 0.56
PETROLEUM GEO-SERVICES 103,000 1,216,430.00 0.15
RAK PETROLEUM PLC 281,170 2,766,712.80 0.35
SEADRILL LTD 53,296 4,265,811.84 0.54
SOLSTAD FARSTAD ASA 37,477 64,460.44 0.01
THIN FILM ELECTRONICS ASA 1,859,942 1,391,236.62 0.18
34,390,770.99 4.36
SHARES IN USD
NAVIOS MARITIME CONTAINERS LP 50,614 1,281,820.40 0.16
NAVIOS MARITIME PARTNERS LP 122,900 923,015.20 0.12
ROWAN COMPANIES PLC - A 61,476 4,729,770.08 0.60
SCORPIO TANKERS INC 194,598 3,109,911.15 0.39
SEADRILL LTD 5,000 413,502.85 0.05
10,458,019.68 1.32
TOTAL SHARES 44,848,790.67 5.68
TOTAL TRANSFERABLE SECURITIES ADMITTED TO AN OFFICIAL EXCHANGE LISTING 186,472,167.37 23.67
II. INVESTMENT FUNDS
INVESTMENT FUNDS IN CHF
UBS ETF MSCI SWITZERLAND 20/35 40,400 6,342,526.50 0.81
6,342,526.50 0.81

SEF FIRST ALLOKERING
Statement of Investments and other net assets at December 31, 2018 (in NOK) (continued)
The accompanying notes form an integral part of these financial statements.
58
Description
Number of shares or
nominal value
Market Value (in NOK)
% of NAV
INVESTMENT FUNDS IN EUR
DB X-TRACKERS MSCI JAPAN 28,000 13,050,823.76 1.66
DB X-TRACKERS MSCI WORLD MOMENTUM 21,000 5,505,292.06 0.70
UBS ETF MSCI EMU 43,800 46,087,309.04 5.85
64,643,424.86 8.21
INVESTMENT FUNDS IN GBP
DB X-TRACKERS S&P ASX 200 UCITS ETF 22,700 6,851,905.64 0.87
ISHARES CORE FTSE 100 UCITS ETF 137,800 10,168,534.37 1.29
17,020,440.01 2.16
INVESTMENT FUNDS IN NOK
FIRST GLOBALT FOKUS 67,178 55,343,152.36 7.03
FIRST HOYRENTE 55,807 57,674,559.44 7.33
FIRST NORGE FOKUS 22,235 20,457,366.60 2.60
FIRST RENTE 142,156 145,655,676.55 18.50
SEF - FIRST SMB - A 25,799 40,855,513.98 5.19
319,986,268.93 40.65
INVESTMENT FUNDS IN USD
AMUNDI MSCI EMERGING MARKET 1,282,000 47,720,034.36 6.06
DB X-TRACKERS MSCI CANADA 19,200 7,487,379.43 0.95
DB X-TRACKERS MSCI USA INDEX UCITS ETF 75,400 43,952,252.32 5.58
ISHARES EDGE MSCI WORLD MINIMUM VOLATILITY UCITS ETF 15,000 5,558,054.62 0.71
ISHARES EDGE MSCI WORLD QUALITY FACTOR UCITS ETF 22,000 6,044,215.20 0.77
ISHARES EDGE MSCI WORLD VALUE FACTOR UCITS ETF 93,500 22,470,801.32 2.85
SPDR WORLD SMALL CAP 24,600 13,276,454.20 1.69
146,509,191.45 18.61
TOTAL INVESTMENT FUNDS 554,501,851.75 70.44
III. OTHER TRANSFERABLE SECURITIES
SHARES
SHARES IN NOK
OKEANIS ECO TANKERS CORP 29,925 1,975,050.00 0.25
1,975,050.00 0.25
TOTAL SHARES 1,975,050.00 0.25
TOTAL OTHER TRANSFERABLE SECURITIES 1,975,050.00 0.25
TOTAL INVESTMENTS 742,949,069.12 94.36
CASH
44,902,915.11 5.70
OTHER NET LIABILITIES
-520,557.89 -0.06
TOTAL NET ASSETS 787,331,426.34 100.00

SEF FIRST SMB
Statement of Investments and other net assets at December 31, 2018 (in NOK)
The accompanying notes form an integral part of these financial statements.
59
Description
Nominal value
Market Value (in NOK)
% of NAV
TRANSFERABLE SECURITIES ADMITTED TO AN OFFICIAL EXCHANGE LISTING
SHARES
SHARES IN NOK
ARCHER 900,000 3,910,500.00 2.14
ARCUS ASA 174,099 7,138,059.00 3.91
ATEA 70,000 7,770,000.00 4.25
BERGENBIO ASA 44,136 1,178,431.20 0.65
BORREGAARD ASA 110,000 8,228,000.00 4.50
BW OFFSHORE LTD 225,000 7,121,250.00 3.90
EUROPRIS ASA 300,000 6,945,000.00 3.80
EVRY AS 150,000 4,717,500.00 2.58
FJORD1 ASA 132,000 5,676,000.00 3.11
FJORDKRAFT HOLDING ASA 255,741 8,695,194.00 4.76
FLEX LNG LTD 350,000 4,322,500.00 2.37
FRONTLINE LTD 50,000 2,440,000.00 1.34
GOLDEN OCEAN GROUP LTD 80,000 4,188,000.00 2.29
KITRON ASA 959,622 8,348,711.40 4.57
KONGSBERG GRUPPEN 85,000 9,996,000.00 5.47
LEROY SEAFOOD GROUP ASA 110,000 7,253,400.00 3.97
MAGSEIS FAIRFIELD ASA 511,142 7,616,015.80 4.17
NORWEGIAN FINANCE HOLDING AS 50,000 3,350,000.00 1.83
ODFJELL DRILLING LTD 370,000 7,659,000.00 4.19
Q-FREE ASA 300,000 2,310,000.00 1.26
RAK PETROLEUM PLC 800,000 7,872,000.00 4.31
SALMONES CAMANCHACA SA 35,446 2,898,773.88 1.59
SCATEC SOLAR ASA 80,000 5,904,000.00 3.23
SCHIBSTED ASA B 30,000 7,875,000.00 4.31
SHELF DRILLING LTD 90,700 3,945,450.00 2.16
SPECTRUM ASA 185,000 6,752,500.00 3.70
STOREBRAND 120,000 7,396,800.00 4.05
TGS NOPEC GEOPHYSICAL 20,000 4,176,000.00 2.29
WALLENIUS WILHELMSEN ASA 275,000 8,167,500.00 4.47
173,851,585.28 95.17
TOTAL SHARES 173,851,585.28 95.17
TOTAL TRANSFERABLE SECURITIES ADMITTED TO AN OFFICIAL EXCHANGE LISTING 173,851,585.28 95.17
TOTAL INVESTMENTS 173,851,585.28 95.17
CASH
7,061,396.54 3.86
OTHER NET ASSETS
1,765,928.65 0.97
TOTAL NET ASSETS 182,678,910.47 100.00

SEF AKTIV FINANS EGAS DYNAMIC PORTFOLIO
Statement of Investments and other net assets at December 31, 2018 (in SEK)
The accompanying notes form an integral part of these financial statements.
60
Description
Number of shares
Market Value (in SEK)
% of NAV
I. INVESTMENT FUNDS
INVESTMENT FUNDS IN EUR
AMUNDI ETF ISTOXX EUROPE MULTI FACTOR MARKET NEUTRAL UCITS ETF - C 16,000 3,806,828.67 10.03
DB X-TRACKERS II ITRAXX XOVER SHORT - 1C 2,000 890,392.70 2.35
INVESCO STOXX EUROPE 600 OPTIMISED TRAVEL & LEISURE UCITS ETF 1,500 2,911,104.28 7.67
SPDR BARCLAYS EMERGING MARKETS LOCAL BOND UCITS ETF 2,000 1,229,283.30 3.24
SPDR REUTERS GL CONVERTIBLE 4,000 1,202,419.77 3.17
UBS ETF HFRX GLOBLA HEDGE FUND INDEX 3,000 2,453,706.55 6.46
12,493,735.27 32.92
INVESTMENT FUNDS IN USD
AMUNDI GLOBAL EQUITY MULTI SM SC BETA 1,230 4,373,825.05 11.52
AMUNDI S&P 500 BUYBACK UCITS ETF - USD CAP 540 680,996.71 1.79
ISHARES S&P 500 FINANCIALS SECTOR UCITS ETF 14,500 810,497.70 2.13
JP MORGAN MANAGED FUTURES UCITS ETF 15,000 3,232,902.34 8.52
LYXOR SG GLOBAL VAL BETA 2,100 2,148,516.78 5.66
MS SCIENTIFIC BETA US EQ 2,700 2,850,863.81 7.51
SOURCE LGIM COMMODITY COMPOSIT 3,050 1,622,772.81 4.27
SPDR BARCLAYS EMERGING MARKETS LOCAL BOND UCITS ETF 1,500 924,741.69 2.44
SPDR DOW JONES GLOBAL REAL ESTATE UCITS ETF 10,500 3,131,765.01 8.25
SPDR MSCI WORLD MATERIALS UCITS 4,000 1,245,703.84 3.28
SPDR S&P GLOBAL DIVIDENDS ARISTOCRATS UCITS ETF 4,500 1,246,688.80 3.28
22,269,274.54 58.65
TOTAL INVESTMENT FUNDS 34,763,009.81 91.57
II. STRUCTURED PRODUCTS
STRUCTURED PRODUCTS IN USD
ETFS 5X SHORT EUR LONG USD 1,500 454,513.57 1.20
454,513.57 1.20
TOTAL STRUCTURED PRODUCTS 454,513.57 1.20
TOTAL INVESTMENTS 35,217,523.38 92.77
CASH
2,282,389.43 6.01
OTHER NET ASSETS
464,316.11 1.22
TOTAL NET ASSETS 37,964,228.92 100.00

SEF CASE POWER PLAY
Statement of Investments and other net assets at December 31, 2018 (in SEK)
The accompanying notes form an integral part of these financial statements.
61
Description
Nominal value
Market Value (in SEK)
% of NAV
TRANSFERABLE SECURITIES ADMITTED TO AN OFFICIAL EXCHANGE LISTING
SHARES
SHARES IN DKK
NOVO NORDISK A/S - B 1,000 409,264.74 0.74
409,264.74 0.74
SHARES IN SEK
ABB LTD 25,000 4,293,750.00 7.71
ASTRAZENECA 3,800 2,565,000.00 4.61
ATLAS COPCO AB - A 10,000 2,115,000.00 3.80
AUTOLIV INC-SWED DEP RECEIPT 3,000 1,920,600.00 3.45
BILLERUDKORSNAS AB 35,000 3,739,750.00 6.72
ELEKTA AB - B 45,000 4,763,250.00 8.56
ESSITY AKTIEBOLAG - B 10,000 2,194,000.00 3.94
INVESTOR AB - B 10,000 3,776,000.00 6.79
MUNTERS GROUP AB 60,000 2,040,000.00 3.67
MYCRONIC AB 20,000 2,362,000.00 4.24
NORDEA BANK ABP 30,000 2,258,700.00 4.06
SAAB AB - B 13,000 4,005,300.00 7.20
SAAB AB - B BTA 3,500 1,074,500.00 1.93
SECURITAS AB - B 15,000 2,134,500.00 3.84
SKANSKA AB - B 15,000 2,115,000.00 3.80
SVENSKA CELLULOSA AB SCA - B 30,000 2,080,800.00 3.74
SYSTEMAIR AB 10,000 952,000.00 1.71
TELIA CO AB 65,000 2,728,050.00 4.90
TRELLEBORG AB - B 10,000 1,404,000.00 2.52
VEONEER INC - SDR 8,000 1,860,400.00 3.34
VOLVO AB - B 20,000 2,325,000.00 4.18
52,707,600.00 94.71
TOTAL SHARES 53,116,864.74 95.45
TOTAL TRANSFERABLE SECURITIES ADMITTED TO AN OFFICIAL EXCHANGE LISTING 53,116,864.74 95.45
TOTAL INVESTMENTS 53,116,864.74 95.45
CASH
2,706,522.16 4.87
OTHER NET LIABILITIES
-175,815.26 -0.32
TOTAL NET ASSETS 55,647,571.64 100.00

SEF KRAFT GLOBAL
Statement of Investments and other net assets at December 31, 2018 (in NOK)
The accompanying notes form an integral part of these financial statements.
62
Description
Nominal value
Market Value (in NOK)
% of NAV
TRANSFERABLE SECURITIES ADMITTED TO AN OFFICIAL EXCHANGE LISTING
SHARES
SHARES IN CAD
TREVALI MINING CORP 2,900,000 7,711,292.56 4.95
7,711,292.56 4.95
SHARES IN DKK
JYSKE BANK 9,800 3,081,718.86 1.98
3,081,718.86 1.98
SHARES IN EUR
BAYER 3,580 2,168,732.90 1.39
BILFINGER BERGER BAU 11,250 2,884,672.99 1.85
CECONOMY AG 68,000 2,141,507.74 1.38
COVESTRO AG 3,900 1,682,666.00 1.08
METRO AG 25,000 3,334,997.50 2.14
NOKIA (SEK) 160,000 8,029,555.67 5.16
PORSCHE NON VTG PRF NPV 12,100 6,248,746.88 4.02
26,490,879.68 17.02
SHARES IN GBP
BT GROUP 165,000 4,355,504.13 2.80
CENTRICA 210,000 3,125,776.30 2.01
DEBENHAMS PLC 1,190,000 642,086.55 0.41
FLYBE GROUP PLC 630,000 1,186,120.47 0.76
PETRA DIAMONDS LTD 260,000 1,065,404.19 0.68
PREMIER FOODS PLC 960,000 3,263,990.89 2.10
PREMIER OIL 770,000 5,193,347.07 3.34
STANDARD LIFE ABERDEEN PLC 96,250 2,758,699.14 1.77
SUPERDRY PLC 61,000 3,064,377.12 1.97
WIZZ AIR HOLDINGS PLC 34,745 10,743,531.46 6.91
35,398,837.32 22.75
SHARES IN HKD
LENOVO GROUP 700,000 4,098,826.76 2.63
PETRO CHINA - H 323,000 1,732,805.50 1.11
5,831,632.26 3.74
SHARES IN JPY
ASAHI GLASS CO LTD 6,200 1,681,319.90 1.08
KUBOTA CORP 14,000 1,728,361.44 1.11
SOFTBANK 2,600 1,501,613.32 0.97
SONY CORP 2,900 1,221,135.07 0.78
6,132,429.73 3.94
SHARES IN NOK
FLEX LNG LTD 240,000 2,964,000.00 1.91
HUNTER GROUP ASA 619,738 2,014,148.50 1.29
KRAFT BANK ASA 200,000 1,600,000.00 1.03
POLARCUS LTD 3,992,014 4,015,966.08 2.58
SOLSTAD FARSTAD ASA 991,052 1,704,609.44 1.10
STOREBRAND 25,500 1,571,820.00 1.01
TERASURE ASA 272,077 3,156,093.20 2.03
17,026,637.22 10.95

SEF KRAFT GLOBAL
Statement of Investments and other net assets at December 31, 2018 (in NOK) (continued)
The accompanying notes form an integral part of these financial statements.
63
Description
Nominal value
Market Value (in NOK)
% of NAV
SHARES IN SEK
BOLIDEN AB 25,700 4,785,181.54 3.08
SAS 200,000 4,044,732.90 2.60
8,829,914.44 5.68
SHARES IN TRY
TAV HAVALIMANLARI 102,000 3,968,752.27 2.55
3,968,752.27 2.55
SHARES IN USD
ALCOA CORP 15,250 3,542,501.15 2.28
ALIBABA GROUP HOLDING-SP ADR 3,810 4,628,849.54 2.98
BED BATH & BEYOND INC 21,200 2,117,972.93 1.36
ENSCO PLC - A 40,084 1,302,184.47 0.84
FITBIT INC - A 52,000 2,284,177.49 1.47
GREENSKY INC - A 23,000 1,924,207.33 1.24
HARMONY GOLD MINING - ADR 200,000 2,916,788.82 1.87
MCDERMOTT INTL INC 103,500 6,137,176.92 3.94
RUSHYDRO PJSC - ADR 475,000 2,692,134.95 1.73
SEADRILL LTD 12,000 992,406.83 0.64
SONY CORP - ADR 3,000 1,261,205.51 0.81
TCS GROUP HOLDING REG S 11,200 1,471,039.65 0.95
TEVA PHARMA IND 32,400 4,439,422.44 2.85
VENATOR MATERIALS PLC 32,000 1,159,729.21 0.75
VEON LTD 84,600 1,736,187.98 1.12
38,605,985.22 24.83
TOTAL SHARES 153,078,079.56 98.39
TOTAL TRANSFERABLE SECURITIES ADMITTED TO AN OFFICIAL EXCHANGE LISTING 153,078,079.56 98.39
TOTAL INVESTMENTS 153,078,079.56 98.39
CASH
1,594,778.02 1.03
OTHER NET ASSETS
907,720.78 0.58
TOTAL NET ASSETS 155,580,578.36 100.00

SEF INDEPENDENT INVESTMENTBOLAGSFOND
Statement of Investments and other net assets at December 31, 2018 (in SEK)
The accompanying notes form an integral part of these financial statements.
64
Description
Nominal value
Market Value (in SEK)
% of NAV
TRANSFERABLE SECURITIES ADMITTED TO AN OFFICIAL EXCHANGE LISTING
SHARES
SHARES IN CAD
BROOKFIELD ASSET MGT 11,069 3,785,823.07 3.48
FAIRFAX FINANCIAL HOLDINGS LTD 1,024 3,983,431.09 3.66
7,769,254.16 7.14
SHARES IN CHF
HBM HEALTHCARE IVST 2,690 3,806,931.16 3.50
3,806,931.16 3.50
SHARES IN DKK
NOVO NORDISK A/S - B 7,601 3,109,501.77 2.86
3,109,501.77 2.86
SHARES IN EUR
KERING 678 2,767,702.18 2.54
LVMH MOET HENNESSY LOUIS VUITTON 1,000 2,595,635.43 2.38
5,363,337.61 4.92
SHARES IN NOK
AKER ASA A SHARES 5,800 2,755,963.44 2.53
2,755,963.44 2.53
SHARES IN SEK
BEIJER REF AB 15,463 2,255,742.44 2.07
BURE EQUITY 8,995 971,460.00 0.89
INDUSTRIVARDEN AB - C 34,055 6,102,656.00 5.61
INDUTRADE 19,110 3,929,016.00 3.61
INVESTMENT AB LATOUR - B 65,709 7,359,408.00 6.76
INVESTOR AB - B 16,354 6,126,208.40 5.63
KINNEVIK AB - B 26,457 5,640,632.40 5.18
LIFCO AB-B 12,057 3,948,667.50 3.63
LUNDBERGFORETAGEN AB - B 19,125 4,983,975.00 4.58
41,317,765.74 37.96
SHARES IN USD
ALLEGHANY 386 2,133,222.83 1.96
ALPHABET INC - C 233 2,170,352.03 1.99
AMAZON 159 2,110,905.64 1.94
AMERICAN STATES WATER CO 3,573 2,142,453.21 1.97
BERKSHIRE HATHAWAY - B 4,040 7,330,932.68 6.74
DANAHER 4,668 4,268,997.91 3.92
JOHNSON & JOHNSON 1,680 1,920,274.01 1.76
LOWE'S COMPANY INC 2,938 2,424,306.41 2.23
MARKEL 439 3,999,145.98 3.67

SEF INDEPENDENT INVESTMENTBOLAGSFOND
Statement of Investments and other net assets at December 31, 2018 (in SEK) (continued)
The accompanying notes form an integral part of these financial statements.
65
Description
Nominal value
Market Value (in SEK)
% of NAV
MINNESOTA MINING & MANUFACTURING COMPANY (3M) 1,214 2,064,320.78 1.90
NORDSON CORP 1,930 2,038,574.71 1.87
PARKER HANNIFIN 1,461 1,945,391.08 1.79
34,548,877.27 31.74
TOTAL SHARES 98,671,631.15 90.65
TOTAL TRANSFERABLE SECURITIES ADMITTED TO AN OFFICIAL EXCHANGE LISTING 98,671,631.15 90.65
TOTAL INVESTMENTS 98,671,631.15 90.65
CASH
10,241,464.57 9.41
OTHER NET LIABILITIES
-70,058.95 -0.06
TOTAL NET ASSETS 108,843,036.77 100.00
SEF
Notes to the financial statements at December 31, 2018
66
NOTE 1 SUMMARY OF SIGNIFICANT ACCOUNTING POLICIES
A. Presentation of the financial statements
The financial statements of the SICAV are presented in accordance with generally accepted accounting principles in Luxembourg and Luxembourg legal and regulatory requirements relating to undertakings for collective investment in transferable securities.
B. Valuation policy
Liquid assets are valued at their nominal value plus accrued interest.
Investments in investment funds are taken at their latest Net Asset Values reported by the administrator of the underlying investment funds.
Securities and money market instruments admitted to official listing on a stock exchange or which are traded on another regulated market are valued on the basis of the last known sales price. If the same security or money market instruments are quoted on different markets, the quotation of the main market for this security is used. If there is no relevant quotation or if the quotations are not representative of the fair value, the valuation is made in good faith by the Board of Directors or its delegate with a view to establishing the probable sale price for such securities.
Non-listed securities or money market instruments are valued on the basis of their probable sales price as determined in good faith by the Board of Directors or its delegate.
Unexpired futures contracts are valued at their last known price on the date of valuation or on closing date and unrealized appreciations or depreciations resulting from them are recorded in the statement of net assets.
Unexpired forward foreign exchange rate contracts are valued at the forward exchange rates applicable on the valuation date or on the closing date and unrealized result resulting from them is recorded in the statement of net assets.
Unexpired OTC “look alike” derivatives contracts (classified as “other OTC Financial Derivative Instruments” in this report) are valued at their last known price on the date of valuation or on closing date and unrealized appreciations or depreciations resulting from them are recorded in the statement of net assets.
Valuation of Cat bonds: Cat Bonds transfer the risk of catastrophic events from the global insurance market mainly via insurance companies and reinsurance companies to the capital markets. When investing in Cat Bonds, the sub-fund receives a risk premium in the form of a yield in exchange for bearing the risk for pre-defined catastrophic events caused by natural disasters (e.g. earthquakes and windstorms). If a pre-defined catastrophe occurs, the value of the Cat Bond (i.e. the issued amount) will be reduced in accordance with the claims caused by the incurred loss. A portfolio of Cat Bonds is subject to relatively few claims, although every claim is mostly of a severe nature. As a result of a catastrophic event, one or several bonds in the portfolio may face a reduction or a full loss of their principal. The Cat Bonds are only held in SEF – ENTROPICS CAT BOND FUND. They are primarily valued using the latest mid-prices contributed by one of the main market makers of such instruments. A second contributor is used to perform a reasonability check of the prices provided by the main market maker.
Assets or liabilities denominated in a currency other than that in which the relevant Net Asset Value is expressed, are converted at the relevant foreign currency spot rate on the relevant Valuation Day. If such quotations are not available, the rate of exchange is determined in good faith by or under procedures established by the Board of Directors of the SICAV.

SEF
Notes to the financial statements at December 31, 2018 (continued)
67
NOTE 1 SUMMARY OF SIGNIFICANT ACCOUNTING POLICIES (CONTINUED)
B. Valuation policy (continued)
All other securities, instruments and other assets are valued at fair value, as determined in good faith pursuant to procedures established by the Board of Directors of the SICAV.
Realized gains and losses on sales of investments or financial instruments are determined on the basis of the average cost of investments or financial instruments sold.
C. Income recognition policy
Interest on bonds is accrued on a daily basis.
Interest income on bank deposits is based on prevailing market interest rates.
Dividends are recognized as income on the date securities are first quoted ex-dividend.
Kick back Fees retroceded to the SICAV are recorded in ”Other income” in the Statement of operations and changes in net assets.
Accrued Kick back Fees retroceded to the SICAV are recorded in “Accrued income” in the Statement of net assets.
D. NAV calculation policy
The Net Asset Value of each sub-fund is expressed in Swedish Krona (SEK) excepted for SEF – LHV PERSIAN GULF FUND expressed in Euro (EUR), SEF – FIRST ALLOKERING, SEF – FIRST SMB and SEF – KRAFT GLOBAL expressed in Norwegian Krona (NOK), as a per share figure and is determined on any valuation date, by dividing the value of the net assets of the sub-fund, being the value of the assets of that sub-fund less its liabilities, on the valuation date, by the number of shares then outstanding.
The financial statements have been established on a NAV calculated on December 31, 2018.
E. Combined financial statements
The combined statement of net assets and combined statement of operations and changes in net assets represent the total of the statements of net assets and statements of operations and changes in net assets of the individual sub-funds, converted in SEK at the exchange rates applicable at year-end.
The currency revaluation of the net assets results from the conversion of the net assets at the beginning of the year (for the sub-fund denominated in currencies other than SEK) at exchange rate applicable on December 31, 2017 and exchange rate applicable on December 31, 2018.
F. Formation expenses
Formation expenses are amortised on a straight line basis over the three or first five years by sub-fund.
NOTE 2 SUBSCRIPTION TAX AND TAX RECLAIM
A. Subscription tax
Fees paid to authorities are mainly composed of the subscription tax.

SEF
Notes to the financial statements at December 31, 2018 (continued)
68
NOTE 2 SUBSCRIPTION TAX AND TAX RECLAIM (CONTINUED)
A. Subscription tax (continued)
Under the prevailing laws and regulations, the SICAV is subject to a tax called "taxe
d’abonnement", payable quarterly and calculated at the annual rate of 0.05% based on the aggregate Net Asset Value at the end of each quarter, except for Class I which will be subject to the reduced subscription tax of 0.01% per annum as its shares are reserved for Institutional Investors.
Pursuant to Article 129 (3) of the amended Law of December 17, 2010 the net assets invested in undertakings for collective investment already subject to the "taxe d’abonnement" are exempt from this tax.
B. Tax reclaim
In several European Union member states, community law grants undertakings for collective investments (UCIs) the right to file claims with a view to recovering taxes they have been unjustly forced to pay. When one member state imposes a greater tax burden on a foreign UCI than on a resident UCI, this constitutes discrimination under community law.
This principle was confirmed by the ruling of the Court of Justice of the European Union (CJEU) in the “Aberdeen” case (18 June 2009). This ruling acknowledges that a non-resident UCI can be subject to discriminatory taxation, which constitutes an obstacle to freedom of establishment and/or the free movement of capital. Other CJEU rulings have subsequently confirmed this jurisprudence.
NOTE 3 CURRENCY TRANSLATION POLICIES
The exchange rates used for the conversion of the Fund’s assets and liabilities not denominated in the SICAV’s base currency are as follows:
As at December 31, 2018:
1 SEK 0.09869 EUR
12.37958 JPY
0.112801 USD
As at December 28, 2018:
1 NOK 0.15607 CAD
0.747946 DKK
0.10015 EUR
0.090294 GBP
0.896598 HKD
12.6484 JPY
1.028498 SEK
0.603968 TRY
0.114509 USD
0.11268 CHF
As at December 28, 2018:
1 SEK 0.410221 AED
0.109498 CHF
0.09753 EUR
0.088055 GBP

SEF
Notes to the financial statements at December 31, 2018 (continued)
69
NOTE 3 CURRENCY TRANSLATION POLICIES (CONTINUED)
As at December 28, 2018: (continued)
1 SEK 12.32529 JPY
0.970448 NOK
0.728379 DKK
0.11168 USD
As at December 27, 2018:
1 EUR 0.2384 AED
2.32265 BHD
2.88175 KWD
2.27405 OMR
0.2395 QAR
0.23335 SAR
10.29601 SEK
0.87535 USD
NOTE 4 COMMISSIONS ON SUBSCRIPTIONS, REDEMPTIONS AND CONVERSIONS
There is a Subscription Fee and a Redemption Fee of 0.10% applied to the subscriptions and redemptions in the sub-funds SEF - FIRST ALLOKERING and SEF - FIRST SMB. These fees are levied for the benefit of the sub-funds concerned.
There are no commissions on subscriptions, redemptions and conversions for all the other sub-funds.
NOTE 5 DEPOSITARY FEES AND ADMINISTRATOR FEES
SWEDBANK AB (publ) Luxembourg Branch has been appointed to act as depositary bank, paying agent and central administrator.
The Depositary Fees and the Administrator Fees are paid to SWEDBANK AB (publ) Luxembourg Branch.
The fees payable to the Depositary may not exceed 0.25% p.a. although Custody fees such as transaction fees and safekeeping fees will be charged additionally.
NOTE 6 INVESTMENT MANAGEMENT FEES
The Investment Management Fees are paid by the SICAV on a monthly basis to the Investment Managers.
For the year ended December 31, 2018, annual Investment Management Fee rates were:
SEF – PLACERUM BALANSERAD – CLASS A 0.75% SEF – PLACERUM BALANSERAD – CLASS I 1.75% SEF – PLACERUM DYNAMISK – CLASS A 0.90% SEF – PLACERUM DYNAMISK – CLASS I 1.95% SEF – PLACERUM OPTIMERA – CLASS A 0.60% SEF – PLACERUM OPTIMERA – CLASS I (liquidated on October 25, 2018) 1.40% SEF – ASCENSUS BALANSERAD – CLASS A 1.60% SEF – ASCENSUS BALANSERAD – CLASS I (until August 1,2018) 1.85% SEF – ASCENSUS BALANSERAD – CLASS I (from August 1,2018) 1.70% SEF – ASCENSUS OFFENSIV – CLASS A 1.60% SEF – ASCENSUS OFFENSIV – CLASS I (until August 1,2018) 1.85%

SEF
Notes to the financial statements at December 31, 2018 (continued)
70
NOTE 6 INVESTMENT MANAGEMENT FEES (CONTINUED)
SEF – ASCENSUS OFFENSIV – CLASS I (from August 1,2018) 1.70% SEF – ASCENSUS TREND – CLASS A 1.60% SEF – ASCENSUS TREND – CLASS I (until August 1,2018) 1.85% SEF – ASCENSUS TREND – CLASS I (from August 1,2018) 1.70% SEF – LHV PERSIAN GULF FUND – CLASS A 1.75% SEF – KUYLENSTIERNA & SKOG EQUITIES – CLASS A 1.50% SEF – KUYLENSTIERNA & SKOG EQUITIES – CLASS P 1.00% SEF – ENTROPICS CAT BOND FUND – CLASS A 1.00% SEF – ENTROPICS CAT BOND FUND – CLASS I 0.70% SEF – EME EUROPEAN BEST IDEAS– CLASS A - SEK 0.65% SEF – EME EUROPEAN BEST IDEAS– CLASS I - EUR 0.60% SEF – EME EUROPEAN BEST IDEAS– CLASS I - SEK 0.60% SEF – EME EUROPEAN BEST IDEAS– CLASS P - SEK 0.95% SEF – PENSER DYNAMISK ALLOKERING - CLASS A 0.70% SEF – MIMER SVERIGE – CLASS A (absorbed on April 3, 2018) 1.60% SEF – GAIA GLOBAL – CLASS A (absorbed on April 3, 2018) 1.60% SEF – KAVALJER MULTI – CLASS A 1.25% SEF – KAVALJER MULTI – CLASS I 0.75% SEF – KAVALJER MULTI – CLASS P 1.75% SEF – FIRST ALLOKERING – CLASS A 1.65% SEF – FIRST ALLOKERING – CLASS I 1.40% SEF – FIRST ALLOKERING – CLASS J 1.00% SEF – FIRST SMB – CLASS A 1.65% SEF – AKTIV FINANS EGAS DYNAMIC PORTFOLIO – CLASS A 1.85% SEF – CASE POWER PLAY – CLASS A 1.00% SEF – CASE POWER PLAY – CLASS P (liquidated on September 3, 2018) 1.00% SEF - KRAFT GLOBAL – CLASS A (launched on May 22, 2018) 1.50% SEF - KRAFT GLOBAL – CLASS B (launched on May 22, 2018) 1.00% SEF - INDEPENDENT INVESTMENTBOLAGSFOND – CLASS A (launched on May 14, 2018)
0.30%
The maximum level of Management Fees that may be charged both to the sub-funds themselves and to the other UCITS and/or other UCIs it intends to invest is 3.1% (excluding any Performance Fees).
NOTE 7 MANAGEMENT COMPANY FEES
The Management Company Fees, including Risk Management Fees and Domiciliation Fees, are paid by the SICAV to the Management Company.

SEF
Notes to the financial statements at December 31, 2018 (continued)
71
NOTE 8 ACCRUED EXPENSES
At December 31, 2018, accrued expenses consist of:
SEF - PLACERUM BALANSERAD
(SEK)
SEF - PLACERUM DYNAMISK
(SEK)
SEF - PLACERUM OPTIMERA
(SEK)
Audit and Legal Fees 0.00 0.00 0.00 Central Administration Fees (Note 5) 68,679.52 72,351.51 83,315.83 Depositary and Custody Fees (Note 5) 25,301.15 26,847.03 30,778.33 Fees paid to authorities (Note 2) 7,416.99 13,392.86 19,290.26 Management Company Fees (Note 7) 31,626.59 33,559.53 39,329.70 Investment Management Fees (Note 6) 317,703.50 334,389.04 152,888.97 Other Fees 0.00 0.00 0.00 Total 450,727.75 480,539.97 325,603.09
SEF - ASCENSUS BALANSERAD
(SEK)
SEF - ASCENSUS OFFENSIV
(SEK)
SEF - ASCENSUS TREND
(SEK)
Audit and Legal Fees 952.70 0.00 0.00 Central Administration Fees (Note 5) 225,966.61 194,662.48 129,719.32 Depositary and Custody Fees (Note 5) 133,069.56 112,784.69 71,342.02 Fees paid to authorities (Note 2) 23,232.24 19,008.98 11,494.63 Management Company Fees (Note 7) 161,079.02 140,954.55 99,037.63 Investment Management Fees (Note 6) 1,426,926.43 1,156,961.40 674,631.02 Other Fees 0.00 0.00 0.00 Total 1,971,226.56 1,624,372.10 986,224.62
SEF - LHV PERSIAN GULF FUND
(EUR)
SEF - KUYLENSTIERNA &
SKOG EQUITIES (SEK)
SEF - ENTROPICS CAT BOND FUND
(SEK)
Audit and Legal Fees 0.00 0.00 0.00 Central Administration Fees (Note 5) 2,886.39 116,890.17 57,934.02 Depositary and Custody Fees (Note 5) 10,850.89 53,599.70 29,378.85 Fees paid to authorities (Note 2) 1,012.04 31,046.75 21,985.71 Management Company Fees (Note 7) 1,317.28 56,017.42 69,681.01 Investment Management Fees (Note 6) 12,611.04 250,163.19 209,086.86 Other Fees 0.00 0.00 0.00 Total 28,677.64 507,717.23 388,066.45

SEF
Notes to the financial statements at December 31, 2018 (continued)
72
NOTE 8 ACCRUED EXPENSES (CONTINUED)
SEF - EME EUROPEAN BEST
IDEAS (SEK)
SEF - PENSER DYNAMISK
ALLOKERING (SEK)
SEF - KAVALJER MULTI (SEK)
Audit and Legal Fees 0.00 0.00 0.00 Central Administration Fees (Note 5) 93,966.45 78,394.02 6,585.76 Depositary and Custody Fees (Note 5) 22,011.88 24,514.48 19,816.97 Fees paid to authorities (Note 2) 2,212.44 38,709.83 7,057.82 Management Company Fees (Note 7) 46,288.81 80,851.53 5,762.53 Investment Management Fees (Note 6) 38,095.24 197,831.70 62,058.09 Other Fees 0.00 0.00 0.00 Total 202,574.82 420,301.56 101,281.17
SEF - FIRST ALLOKERING
(NOK)
SEF - FIRST SMB (NOK)
SEF - AKTIV FINANS EGAS DYNAMIC
PORTFOLIO (SEK)
Audit and Legal Fees 0.00 0.00 86,640.00 Central Administration Fees (Note 5) 158,385.62 85,606.48 11,591.90 Depositary and Custody Fees (Note 5) 46,918.62 28,964.64 20,573.54 Fees paid to authorities (Note 2) 21,787.51 22,838.04 3,734.54 Management Company Fees (Note 7) 123,756.34 58,191.29 5,262.07 Investment Management Fees (Note 6) 818,788.58 281,074.46 64,715.72 Other Fees 7,743.94 8,724.18 41,013.01 Total 1,177,380.61 485,399.09 233,530.78
SEF - CASE POWER PLAY
(SEK)
SEF - KRAFT GLOBAL
(NOK)
SEF - INDEPENDENT INVESTMENTBOLAGSFO
ND (SEK)
Audit and Legal Fees 0.00 0.00 0.00 Central Administration Fees (Note 5) 7,540.65 25,681.07 11,074.60 Depositary and Custody Fees (Note 5) 1,508.34 11,372.43 1,845.75 Fees paid to authorities (Note 2) 6,975.38 19,449.52 13,605.85 Management Company Fees (Note 7) 7,540.65 25,681.07 11,997.53 Investment Management Fees (Note 6) 48,538.95 137,056.42 27,295.85 Other Fees 0.00 0.00 0.00 Total 72,103.97 219,240.51 65,819.58
NOTE 9 CHANGES IN THE INVESTMENT PORTFOLIO
Changes in the investment portfolio during the reporting year are available to the shareholders at the address of the depositary bank and domiciliary agent.

SEF
Notes to the financial statements at December 31, 2018 (continued)
73
NOTE 10 TRANSACTION FEES
The Transaction Fees are composed of fees on purchases and sales on portfolio.
NOTE 11 FORWARD FOREIGN EXCHANGE TRANSACTIONS - OPEN POSITIONS
At December 31, 2018, the following forward foreign exchange transactions were opened:
SEF - LHV PERSIAN GULF FUND
Currency Buy Currency Sell Maturity Date Unrealized Result (EUR)
EUR 7,500,000.00 USD 8,535,714.75 19/02/2019 62,438.93
62,438.93
Swedbank AB is the counterparty to forward foreign exchange transactions.
SEF - ENTROPICS CAT BOND FUND
Currency Buy Currency Sell Maturity Date Unrealized Result (SEK)
SEK 207,344,747.00 USD -23,000,000.00 14/01/2019 3,635,541.00 SEK 2,709,305.91 EUR -263,000.00 14/01/2019 44,425.80 SEK 10,859,316.00 USD -1,200,000.00 14/01/2019 231,009.60 SEK 3,628,205.60 USD -400,000.00 14/01/2019 85,436.80 SEK 2,055,483.14 USD -230,000.00 14/01/2019 18,391.08
4,014,804.28
Swedbank AB and Danske Bank A/S are the counterparties to forward foreign exchange transactions.
SEF - FIRST ALLOKERING
Currency Buy Currency Sell Maturity Date Unrealized Result (NOK)
NOK 29,824,308.50 USD -3,500,000.00 11/01/2019 -736,088.50 NOK 58,356,474.00 EUR -6,000,000.00 11/01/2019 -1,587,288.00 NOK 16,697,512.95 GBP -1,550,000.00 11/01/2019 -473,129.75
-2,796,506.25
Swedbank AB is the counterparty to forward foreign exchange transactions.
SEF - AKTIV FINANS EGAS DYNAMIC PORTFOLIO
Currency Buy Currency Sell Maturity Date Unrealized Result (SEK)
SEK 17,999,400.00 USD -2,000,000.00 04/02/2019 137,190.00
137,190.00
Swedbank AB is the counterparty to forward foreign exchange transactions.

SEF
Notes to the financial statements at December 31, 2018 (continued)
74
NOTE 12 OTHER OTC FINANCIAL DERIVATIVE INSTRUMENTS - OPEN POSITIONS
As at December 31, 2018, SEF - FIRST ALLOKERING invests in "Other OTC Financial Derivative Instruments" called "Look alike derivatives" with Danske Bank A/S as counterparty. The "Look alike derivatives" contracts open as at December 31, 2018 are OTC derivatives mirroring the performance of exchange-traded futures contracts.
The open contracts as at December 31, 2018 are summarized below:
SEF – FIRST ALLOKERING
Number of Contracts
Description Expiration
Date Currency
Price converted in (NOK)
Unrealized Result (NOK)
Commitment (NOK)
-7 S&P 500 EMINI FUTURE
15/03/2019 USD 21,709.99 211,510.85 -7,598,496.72
-300 OBX FUTURE 18/01/2019 NOK 739.83 347,100.00 -22,194,900.00
Total 558,610.85 -29,793,396.72
Danske Bank A/S is the counterparty to the other OTC Financial Derivative Instruments.
NOTE 13 RELATED - PARTIES TRANSACTIONS
During the year, the sub-funds SEF - PLACERUM BALANSERAD, SEF - PLACERUM DYNAMISK, SEF - ASCENSUS BALANSERAD, SEF - ASCENSUS OFFENSIV, SEF - ASCENSUS TREND, SEF – MIMER SVERIGE (absorbed on April 3, 2018), SEF - FIRST ALLOKERING, SEF - KUYLENSTIERNA AND SKOG EQUITIES, SEF - PENSER DYNAMISK ALLOKERING and SEF - CASE POWER PLAY invested part of their assets into other collective investment undertakings promoted by related parties or into transferable securities of related parties.
NOTE 14 CROSS-INVESTMENTS
The value of the cross-investments of the sub-funds has been taken into consideration for the calculation of the total net assets of the funds.
The total value of those cross-investments as at December 31, 2018 amounted to:
Sub-fund investing in other SEF sub-funds
Sub-funds held by other SEF sub-funds
Currency Market Value
(in NOK)
SEF – FIRST ALLOKERING SEF – FIRST SMB NOK 40,855,513.98
The net assets at the end of the financial year of combined figures would be 5,359,197,569.17 SEK without taking into account the cross-investments values.

SEF
Notes to the financial statements at December 31, 2018 (continued)
75
NOTE 15 OTHER INCOME
At December 31, 2018, other income consists mainly of retrocessions on Management Fees received or to be received from the funds in which the sub-funds have invested.
NOTE 16 PERFORMANCE FEES
In addition to the Management Fees, Performance Fees are added. The Performance Fee for each sub-fund is calculated as follows:
SEF – ENTROPICS CAT BOND FUND
The Performance Fee is calculated and crystallized on each Valuation Day and will be accrued on the last Business Day of each month. If a Performance Fee is due, it shall be paid to the Investment Manager by the sub-fund monthly in arrears.
The Performance Fee is calculated after the Investment Management Fee has been deducted from the Net Asset Value per Share. The Performance Fee will be equal to the number of Shares in the Share Class multiplied by the Performance Fee rate which corresponds up to 10% multiplied by the positive excess performance, if any, per Share recorded that Valuation Day as compared to the performance of the benchmark (SSVX90).
No Performance Fee was charged for the year ended December 31, 2018.
SEF – PENSER DYNAMISK ALLOKERING
A Performance Fee of 10 percent on the part of the total returns for the sub-fund shall also be paid to the Investment Manager. The Performance Fee is payable on the sub-fund’s overall performance, which may differ from the performance for the investor.
The Performance Fee is calculated after deduction of fixed expenses and is recorded daily, which means that the sub-fund’s daily Net Asset Value price indicates the value per unit after all Fees and charges. The Accrued Fee is payable to the Investment Manager after the end of each month. In order to know the cumulative total return, the sub-fund must achieve, in order for the Performance Fee to be deducted, a high water mark (the “HWM”). High water mark means the highest Net Asset Value of the sub-fund as ever reached. If the sub-fund’s unit price after fixed expenses exceeds the HWM for that day, 10 percent of the excess return is deducted as a Performance Fee and the Net Asset Value price is adjusted to reflect this.
The HWM is raised to this new higher rate so that fees for the excess return are only paid once. If the sub-fund’s cumulative return on any particular day is below the HWM, no Performance Fee is payable until the sub-fund’s price per unit again exceeds the HWM. If dividends are paid to shareholders, the Net Asset Value and HWM are adjusted equally in percentage terms.
The sub-fund’s unit price and HWM are both set to SEK 1000 on the sub-fund’s inception date.
The Performance Fee charged this year amounted to 1,874,264.79 SEK.
SEF – FIRST ALLOKERING
The Fund will pay the Investment Manager a fee of 10% of the performance of the share classes over a benchmark hurdle rate, being the performance of a basket of indices rebalanced daily with the following weights:
(a) the OBX Statebonds 0.25 Index, a Norwegian treasury bill total return index (Bloomberg code ST1X Index) –weight of 20%;
(b) the OBX Statebonds 3.00 Index, a Norwegian treasury bill and treasury note total return index (Bloomberg code ST4X Index) –weight of 30%;

SEF
Notes to the financial statements at December 31, 2018 (continued)
76
NOTE 16 PERFORMANCE FEES (CONTINUED)
(c) the Oslo Bors Mutual Fund Index (Bloomberg code OSEFX) –l weight of 15%; and
(d) the MSCI World AC Index (Bloomberg code NDUEACWF) converted into NOK –weight 35%. The daily performance of the basket as a whole is calculated by applying the relevant weight detailed above to the daily performance of each index and summing the weighted performance.
The calculation period runs for a calendar year and finishes on the last Valuation Date of each year. The initial offer price from the merging sub-fund LAMP UCITS Funds (Ire) 1 plc – Swedbank Allokering is taken as the starting point for the Performance Fee calculations. A Performance Fee is payable only where:
(a) the increase in the Net Asset Value (before Performance Fees) in respect of any calculation period is higher than the increase in the benchmark in respect of such calculation period; and
(b) any underperformance of the Net Asset Value versus the benchmark in preceding calculation periods has been clawed back.
The Performance Fee charged this year amounted to 7,704.71 NOK.
SEF – FIRST SMB
The Fund will pay the Investment Manager a fee of 20% of the performance of the sub-fund over a benchmark hurdle rate, being the annual performance of the Oslo Bors Small Cap Index (Bloomberg code OSESX).
The calculation period runs for a calendar year and finishes on the last Valuation Date of each year. The initial offer price is taken as the starting point for the Performance Fee calculations. A Performance Fee is payable only where:
• the increase in Net Asset Value (before Performance Fees) in respect of any calculation period is higher than the increase in the benchmark in respect of such calculation period; and
• any underperformance of the Net Asset Value versus the benchmark in preceding calculation periods has been clawed back.
The Performance Fee charged this year amounted to 8,724.18 NOK.
SEF – CASE POWER PLAY
The Investment Manager is entitled to receive a Performance Fee payable out of the sub-fund’s assets.
The Performance Fee will be calculated and accrued on a daily basis, and will be paid out monthly in arrears.
For each calculation period the Performance Fee of each share will be equal to 20% of the appreciation of the Net Asset Value per Share in excess of the performance of a comparison index, SIX Portfolio Return Index (“SIXPRX”).
The Net Asset Value per share is calculated after the accrual of all fees but prior to the accrual of any Performance Fee, on the relevant Valuation Day. The Performance Fee will be equal to the number of Shares in the Share Class multiplied by the Performance Fee rate which corresponds up to 20% multiplied by the positive excess performance, if any, per Share recorded that Valuation Day as compared to the performance of the relevant benchmark. For Class I Shares the Net Asset Value per share used for the calculation of the Performance Fee will be adjusted by any dividend distributions made during the relevant calculation year.

SEF
Notes to the financial statements at December 31, 2018 (continued)
77
NOTE 16 PERFORMANCE FEES (CONTINUED)
In the event that a Performance Fee is due, all investors in a share class will pay the same Performance Fee regardless of when they invested in the sub-fund.
If on a Valuation Day the Net Asset Value per share has underperformed the relevant benchmark, no Performance Fee shall be due until the calculated underperformance has been compensated by an outperformance (the High Water Mark principle).This implies that investors subscribing to new shares after periods of negative relative performance may enjoy positive performance without being accrued any Performance Fee. This applies until the Net Asset Value per share has recovered enough to exceed the new hurdle rate (being the Net Asset Value at the time a Performance Fee was previously paid out adjusted by the performance of the benchmark for the same periodyear).
If the Investment Management Agreement is terminated before the end of a calculation period, the Performance Fee in respect of the then current calculation period will be calculated and paid as though the date of termination were the end of the relevant period.
No Performance Fee was charged for the year ended December 31, 2018.
SEF – KRAFT GLOBAL (launched on May 22, 2018)
The Investment Manager is entitled to receive a Performance Fee payable out of the sub-fund’s assets. The Performance Fee will be calculated and accrued on a daily basis, and will be paid out monthly in arrears.
The Net Asset Value per share is calculated after the accrual of all fees but prior to the accrual of any Performance Fee, on the relevant Valuation Day. The Performance Fee will be equal to the number of Shares in the Share Class multiplied by the Performance Fee rate, which corresponds to up to 10% multiplied by the appreciation of the Net Asset Value per Share in excess of the performance of the benchmark interest rate, 3 month NIBOR + 4 percentage points, recorded that Valuation Day. The index referred to is chosen by the Fund. The index administrator shall be listed on the ESMA's register of administrators and benchmarks in accordance with Regulation (EU) 2016/1011 of the European Parliament and of the Council of 8 June 2016 on indices used as benchmarks in financial instruments and financial contracts or to measure the performance of investment funds (the "EU Benchmark Regulation"). The registration is expected to become effective by the end of the grandfathering period ending 2019, which is applicable to the index administrator, provided for in the EU Benchmark Regulation at the latest. This Prospectus shall be updated once the index administrator will be listed on the ESMA's register of administrators and benchmarks. Investors can receive a copy of the contingency plan as required by the EU Benchmark Regulation at the registered office of the Management Company. The contingency plan sets out the actions that would be taken in the event that a benchmark materially changes or ceases to be provided.
In the event that a Performance Fee is due, all investors in a share class will pay the same Performance Fee regardless of when they invested in the sub-fund.
If on a Valuation Day the Net Asset Value per share has underperformed the relevant benchmark interest rate, no Performance Fee shall be due until the calculated underperformance has been compensated by an outperformance (the high watermark principle). This implies that investors subscribing to new shares after periods of negative relative performance may enjoy positive performance without being accrued any Performance Fee. This applies until the Net Asset Value per share has recovered enough to exceed the new hurdle rate (being the Net Asset Value at the time a Performance Fee was previously paid out (i.e. the high watermark), adjusted by the performance of the benchmark interest rate for the same period).
If the Investment Management Agreement is terminated before the end of a calculation period, the Performance Fee in respect of the then current calculation period will be calculated and charged as though the date of termination was the end of the relevant period.

SEF
Notes to the financial statements at December 31, 2018 (continued)
78
NOTE 16 PERFORMANCE FEES (CONTINUED)
The Investment Manager may, in its absolute discretion, waive charges and/ or fees and may rebate any fees payable to it in favour of an investor, a distributor or any other person or entity.
No Performance Fee was charged for the year ended December 31, 2018.
NOTE 17 SUBSEQUENT EVENTS
During 2018, the Board of Directors resolved to approve a cross-border merger of the compartment SEF – AKTIV FINANS EGAS Dynamic Portfolio into a Swedish registered fund WORLD EQUITY REPLICATION FUND with effective date January 14, 2019.
On December 5, 2018, the Board of Directors has decided to change the name of SEF – Ascensus Balanserad to SEF – NCAM Balanserad, the name of SEF – Ascensus Offensiv to SEF – Eligo Strategifond Offensiv and the name of SEF – Ascensus Trend to SEF – Coeli Total with effective date March 1, 2019. The investment managers of the three compartments were also changed from United Securities AB to respectively Nordic Cross Asset Management AB, Eligo Asset Management AB and Coeli Asset Management AB with the same effective date.
On March 12, 2019, the Board of Directors has resolved to terminate the Management Company Services Agreement between SEF and Swedbank Management Company S.A. with effect from a date yet to be determined. It was resolved to approve the appointment of Carne Global Fund Managers (Luxembourg) S.A. as Management Company of SEF, subject to the negotiation, agreement and signature of the Management Company Agreement, and subject to CSSF approval. The Board has also resolved to terminate the Depositary and Paying Agent Agreement for UCITS between SEF, Swedbank Management Company S.A. and Swedbank AB (publ) Luxembourg Branch with effect from a date yet to be determined. It was resolved to approve the appointment of State Street as depositary of SEF subject to the negotiation, agreement and signature of the new Depositary Agreement, and subject to CSSF approval. The Board has resolved to terminate the Central Administration Agreement between SEF, Swedbank Management Company S.A. and Swedbank AB (publ) Luxembourg Branch with effect from a date yet to be determined. It was resolved to approve the appointment of State Street as administrator of SEF subject to the negotiation, agreement and signature of the new Administration Agreement, and subject to CSSF approval.
On March 13, 2019, the Board of Directors has resolved to change the investment manager of the compartment SEF – Independent Investmentbolagsfond from Independent Investment Group Sweden Aktiebolag to EME Partners AB with effective date March 20, 2019. The Board has also resolved to change the name of the compartment SEF – Independent Investmentbolagsfond to SEF – Investmentbolagsfond with the same effective date.

SEF
Unaudited Appendix
79
GLOBAL MARKET RISK EXPOSURE
The Management Company of SEF, after a risk profile assessment, decides between the commitment approach and the VaR (99%, 20 Days) to determine the global market risk exposure.
The global market risk exposure for sub-funds using a VaR model for the year ending December 31, 2018, is as follows:
Sub-funds Global Risk calculation
Method
VaR model
Reference Portfolio
VaR limit (20d,99%)
Lowest utilisation of
VaR limit
Highest utilisation of
VaR limit
Average utilisation
of VaR limit
Average level of leverage
reached during the
year
SEF – CASE POWER PLAY
Relative VaR Historic (20d, 99%)
SIX Portfolio Return Index
100.00% -23.51% 26.09% -1.61% 2.78%
SEF – FIRST ALLOKERING
Absolute VaR Historic (20d, 99%)
N/A 13.00% 2.61% 6.26% 3.93% 14.89%
SEF – FIRST SMB Relative VaR Historic (20d, 99%)
Oslo Bors Small Cap
Index 100.00% -23.65% 15.55% -5.29% 0.00%
In terms of risk management, the Management Company of SEF selected the commitment approach in order to determine the global risk for all the other sub-funds.
REMUNERATION POLICY
The Management Company has adopted a remuneration policy pursuant to applicable laws and regulations. More details about this remuneration policy, which describes, but not limited to, how remuneration and benefits are determined, may be obtained upon request to the Management Company. There has not been any material change to the Remuneration Policy of Swedbank Management Company S.A. during 2018.
For the year ended December 31, 2018, the total fixed and variable remuneration paid by the Management Company to its employees amounted to EUR 874,186.96 and to EUR 33,828.00 respectively. The total remuneration paid by the Management Company to senior management and members of its control functions amounted to EUR 677,182.09. As at December 31, 2018, the Management Company has a headcount of 7 employees.
58.37 % of the remuneration above is attributable to SEF, based of the total net assets of SEF as at December 31, 2018, compared with the total net assets under management by Swedbank Management Company S.A.
Swedbank Management Company S.A. does not pay any direct remuneration to identified staff of any of its delegates.
INFORMATION ACCORDING TO REGULATION ON TRANSPARENCY OF SECURITIES FINANCING TRANSACTIONS
SEF did not hold any investments within the scope of the SFT Regulation during the year ended December 31, 2018.