Embed Size (px)
Citation preview
1
See All, Know All: Using PROC DOCUMENT to Produce Integrated Data Set Documentation
Jyothi Pabbaraju, Westat, Rockville, MD
ABSTRACT Most SAS® programmers recognize the importance of documenting the data sets that are used in their projects. While SAS software has always provided a variety of procedures to document various data set characteristics and statistics, it has not been very easy to combine the various pieces of output into a single easy-to-use report. This paper describes a macro-based system for data set documentation that takes advantage of the ODS Document destination and PROC DOCUMENT to produce an integrated, bookmarked PDF report file that is useful, compact, and readable. The system provides several options to control the output produced, such as the number of observations to be printed for each data set. In addition, the system reports variables with missing labels, missing values and other data anomalies.
INTRODUCTION This paper describes a macro-based system for data set documentation that takes advantage of the ODS Document destination and PROC DOCUMENT to produce an integrated, bookmarked PDF report file that is useful, compact, and readable. The DataDescriber macro system provides several options to control the output produced such as:
• Summary of datasets, observations and variables • Detailed description of variables • Means • Frequencies • Listing • Missing Labels or Variables with no values • Index of all variables across all datasets • Formats available
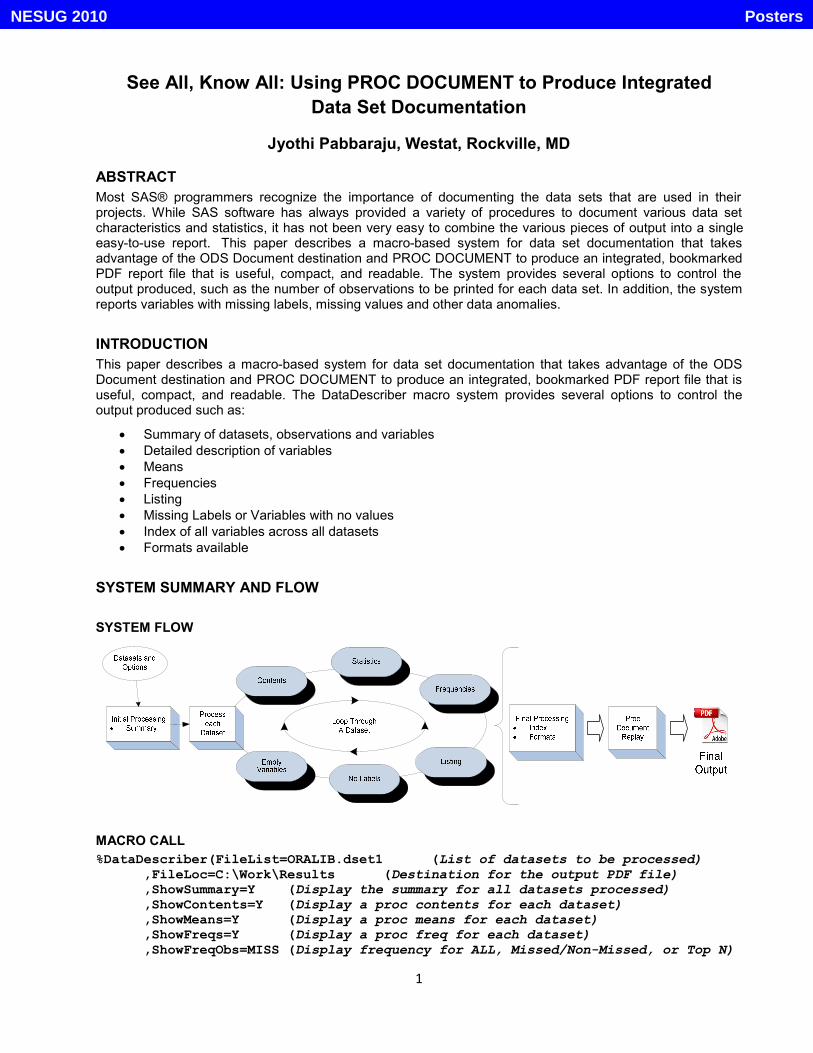
SYSTEM SUMMARY AND FLOW
SYSTEM FLOW
MACRO CALL %DataDescriber(FileList=ORALIB.dset1 (List of datasets to be processed) ,FileLoc=C:\Work\Results (Destination for the output PDF file) ,ShowSummary=Y (Display the summary for all datasets processed) ,ShowContents=Y (Display a proc contents for each dataset) ,ShowMeans=Y (Display a proc means for each dataset) ,ShowFreqs=Y (Display a proc freq for each dataset) ,ShowFreqObs=MISS (Display frequency for ALL, Missed/Non-Missed, or Top N)
PostersNESUG 2010

2
,ShowPrint=Y (Display a proc print listing for each dataset) ,ShowObs=5 (Set how many observations should be displayed for listing) ,ShowNoLabel=Y (Display variables with no labels print for each dataset) ,ShowEmptyVars=Y (Display variables that are completely empty for each dataset) ,ShowIndex=Y (Display an Index of variables for all datasets) ,ShowFormats=Y (Display formats for all datasets) );
MACRO DESCRIPTION
The DataDescriber macro is run on the SAS datasets that are passed to the first parameter, FILELIST. This parameter is expected to contain a list of fully specified datasets or views in the form “libname.objectname1 libname.object2, etc.” Based on the remaining options selected, the macro creates a document using the DOCUMENT Procedure. Once all the options are processed, the final output PDF is generated using the REPLAY feature. PROC DOCUMENT gives the user the ability to control output format and navigation. The bookmarks in the generated PDF file can also be formatted very clearly using the SETLABEL feature. This feature facilitates easy navigation through the sections of output when the macro is run on many datasets. The example to the right demonstrates the ability to nest and clearly label each PDF bookmark.
Each Dataset is a top-level bookmark with all the information inside
The Frequencies node has each table underneath
The first item is the summary for everything processed. At the very bottom are additional “overall” items such as the index
PostersNESUG 2010
3
USE OF THE ODS DOCUMENT DESTINATION ODS DOCUMENT is an ODS destination that allows users to store outputs in a reusable file structure called an ODS “Document”. The DOCUMENT Procedure allows the user to manipulate the output contained in the document by customizing the bookmarks, modifying the document, deleting any unwanted output, and replaying the outputs that we are interested in. The first step in the process of using ODS DOCUMENT is to create a document by opening the DOCUMENT destination. Below is sample code that creates a document named “Perdataset” and uses it to store the output from PROC PRINT. ods document name=work.perdataset(write); /* this creates a new ODS document */
TITLE3 "Variables Without values for dset1" ; proc print data =dset1 ; run ; TITLE3;
ods document close ; After the above code is run, you are able to view the output in the document window of Display Manager, with the path appearing as Print#1\Print#1. The document created above can be modified using the UPDATE option in PROC DOCUMENT, as can be seen in the sample code below. PROC DOCUMENT also gives the user the control of renaming the labels using the SETLABEL statement. Since the output path labels initially created in ODS documents are not easily readable, we can customize them as shown below to make it easier to read the output. proc document name=work.perdataset(Update); /* this opens the document for edits */ setlabel \work.perdataset\Print#1\Print#1 ‘Listing of obs'; /* relabel the bookmark */ obpage \work.perdataset\Print#1\Print#1 /after; /*this inserts a page break */ run; PROC DOCUMENT also allows the user to copy output from one ODS document to another using the COPY statement. Sample code below shows how to copy output from one document to another document. The symbol ^ on the COPY statement places the output in the current directory of the document named Final.
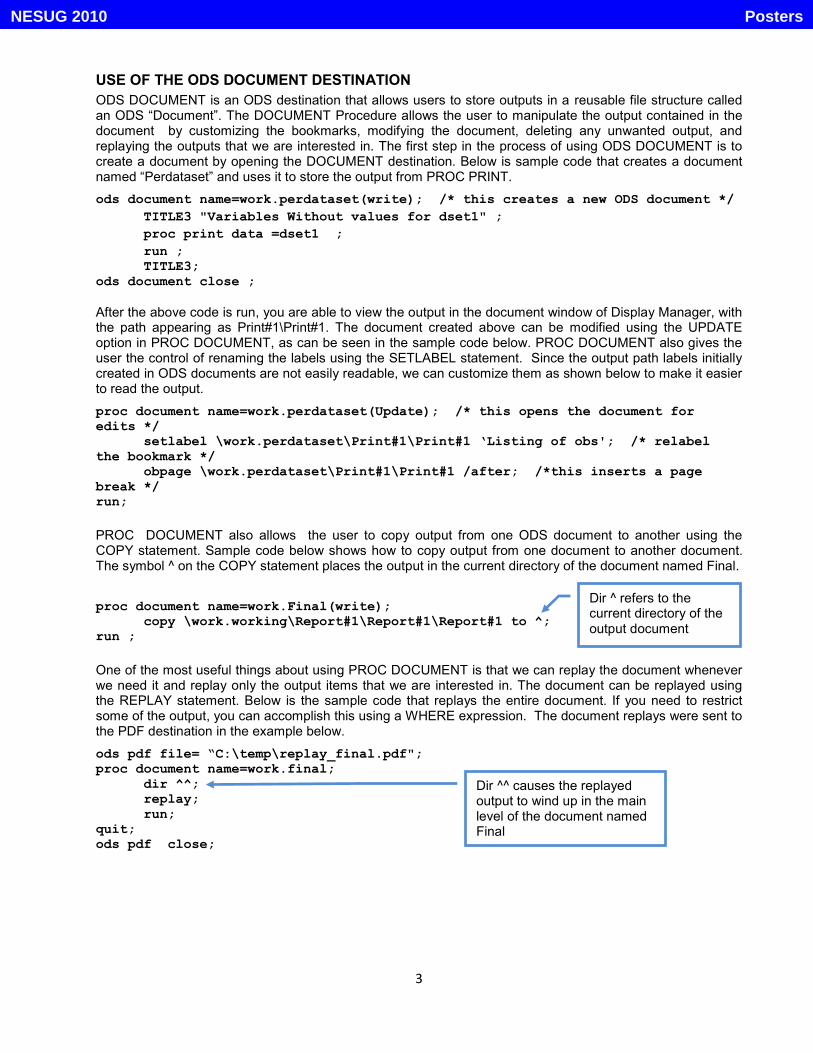
proc document name=work.Final(write); copy \work.working\Report#1\Report#1\Report#1 to ^; run ; One of the most useful things about using PROC DOCUMENT is that we can replay the document whenever we need it and replay only the output items that we are interested in. The document can be replayed using the REPLAY statement. Below is the sample code that replays the entire document. If you need to restrict some of the output, you can accomplish this using a WHERE expression. The document replays were sent to the PDF destination in the example below. ods pdf file= “C:\temp\replay_final.pdf"; proc document name=work.final; dir ^^; replay; run; quit; ods pdf close;
Dir ^^ causes the replayed output to wind up in the main level of the document named Final
Dir ^ refers to the current directory of the output document
PostersNESUG 2010

4
PROCESSING AND OUTPUT
SUMMARY We first present a summary of all the datasets that are documented in the current run. We have found this to be useful on many levels:
1. It gives a quick overall view of the scope of the documentation. 2. It allows for quick comparisons of dataset, observation, and variable counts between runs. Unexpected
changes thus are more easily identified.
As illustrated below, the Summary generates output with a line for each dataset showing:
• Dataset name, • Number of observations, • Number of variables, and • Length of data record.
Below is the sample code that creates the Summary dataset containing dataset name, observations, number of variables, and length of the data record, using the Attributes ODS output table. Using PROC DOCUMENT the output is first placed in the temporary document and then moved to the final version of the document.
** initialize to an empty summary dataset ** ; data Summary; set _null_ ;
attrib member length = $256. label = "Name of dataset" ; attrib nobs length = 8. label = "Number of observation" ; attrib vars length = 8. label = "Number of variables" ; attrib obslen length = 8. label = "Length of data record" ; run ; ODS output attributes=AttribInfo ; proc contents data = &dset ; run ;
PostersNESUG 2010
5
data temp ; set &dset ; if _n_ <= 1 ; run ; ODS output attributes=AttribInfotemp ; proc contents data = temp ; run ; ** Get number of observations, dataset name, number of variables, and length of data record **; proc sql noprint; select count(*)into :numobs from &dset;
select distinct substr(member,index(member,".")+1) as member into :membernm from AttribInfo; Select nvalue2 into :vars from AttribInfotemp where label2 = "Variables"; Select nvalue2 into :obslen from AttribInfotemp where label2 = "Observation Length"; quit; data ContentsTemp ;
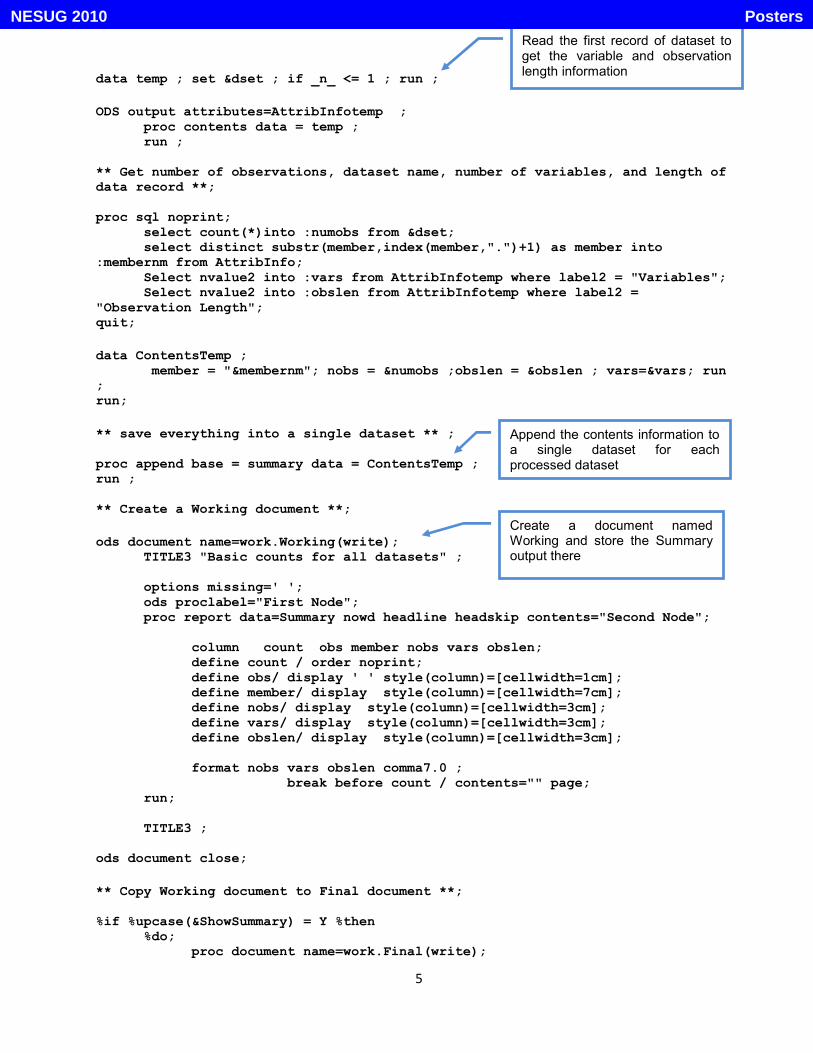
member = "&membernm"; nobs = &numobs ;obslen = &obslen ; vars=&vars; run ; run; ** save everything into a single dataset ** ; proc append base = summary data = ContentsTemp ; run ; ** Create a Working document **; ods document name=work.Working(write); TITLE3 "Basic counts for all datasets" ; options missing=' '; ods proclabel="First Node"; proc report data=Summary nowd headline headskip contents="Second Node"; column count obs member nobs vars obslen; define count / order noprint; define obs/ display ' ' style(column)=[cellwidth=1cm]; define member/ display style(column)=[cellwidth=7cm]; define nobs/ display style(column)=[cellwidth=3cm]; define vars/ display style(column)=[cellwidth=3cm]; define obslen/ display style(column)=[cellwidth=3cm]; format nobs vars obslen comma7.0 ; break before count / contents="" page; run; TITLE3 ; ods document close; ** Copy Working document to Final document **; %if %upcase(&ShowSummary) = Y %then
%do; proc document name=work.Final(write);
Append the contents information to a single dataset for each processed dataset
Create a document named Working and store the Summary output there
Read the first record of dataset to get the variable and observation length information
PostersNESUG 2010

6
copy \work.working\Report#1\Report#1\Report#1 to ^; setlabel \Report#1 'Summary for All Datasets'; obpage \Report#1 /after; run ; quit; %end; CONTENTS Contents provides information about the variables in each dataset, giving us a very good look at the characteristics of each variable. We present this information both:
• Alphabetically by variable name, and • By location on the physical dataset
Each method is shown here
PostersNESUG 2010

7
Below is the sample code that generates contents output using PROC CONTENTS and stores the output using PROC DOCUMENT. ** Creating Perdatset document and storing proc contents output in it **; ods document name=work.Perdataset(write);
%if %upcase(&ShowContents) = Y %then %do;
TITLE3 "Variable Information in Alphabetic Order for &dse2" ; proc contents data = &dset; run ; TITLE3; TITLE3 "Variable Information in Creation Order for &dse2" ; proc contents data = &dset varnum ; run ; TITLE3; %end;
ods document close ; ** Copying the outputs from Perdataset document to Final document **; proc document name=work.Final(Update);
make &dse2.; run; dir ^^ ; dir &dse2. ; %if %upcase(&ShowContents) = Y %then
%do; copy \work.perdataset\Contents#1\DataSet#1\Variables#1 to ^; copy \work.perdataset\Contents#2\DataSet#1\Position#1 to ^; setlabel \&dse2.#1\Variables#1 'by name'; obpage \&dse2.#1\Variables#1 /after; setlabel \&dse2.#1\Position#1 'by location'; obpage \&dse2.#1\Position#1 /after; %end;
STATISTICS Statistics generates descriptive measures for each dataset. This lets us review the distribution, range and other summary statistics of each numeric variable:
• N • Minimum • Maximum • Mean • Median • Standard Deviation
Contents information with variables in Alphabetic order and variables in Creation order
PostersNESUG 2010

8
Below is the sample code that generates and stores output from PROC MEANS. Before attempting to run PROC MEANS, the code checks to see if there are any numeric variables and if there are any observations in the dataset. When there are no numeric variables or observations, we create dummy output to avoid an error in PROC DOCUMENT, since the PROC creates output with pathname \Print#n\Print#1 for n number of proc prints. When there are no numeric variables or observations, the output is not generated and this path does not exist in the document. When PROC DOCUMENT doesn’t find this path when copying outputs to the Final document, it produces an error. To handle this issue we came up with the idea of creating dummy output in the working document and then deleting that output from the final document when there are no numeric variables or observations. This logic is also applied when a user does not request some of the optional output. In this example, when ShowMeans=N, the dummy output is created in the working document and deleted from the final document.
** if ShowMeans = Y and has numeric variables and has observations **; %if %upcase(&ShowMeans) = Y and &HasNum > 0 and &HasObs > 0 %then
%do; TITLE3 "General Statistics Information for &dse2" ; proc means data = &dset n min max mean median std maxdec = 2; run ; proc print data=&dset(obs=5); run; TITLE3; %end; ** if ShowMeans = Y and has observations and no numeric variables **;
Checks if ShowMeans is selected for the output and if the data set has both numeric variables and at least one observation
PostersNESUG 2010

9
%if %upcase(&ShowMeans) = Y and &HasNum = 0 and &HasObs > 0 %then %do; TITLE3 "General Statistics Information for &dse2" ; data nonumvar; NOTE="----- No numeric variables in this dataset -----"; run; proc print data=nonumvar; run; TITLE3; %end; ** if ShowMeans = Y and has no observations **; %if %upcase(&ShowMeans) = Y and &HasObs = 0 %then %do; TITLE3 "General Statistics Information for &dse2" ; data nonumvar; NOTE="----- No observations in this dataset -----"; run; proc print data=nonumvar; run; TITLE3; %end; ** if ShowMeans = N **; %if %upcase(&ShowMeans) = N %then %do; TITLE3 "General Statistics Information for &dse2" ; data nonumvar; NOTE="----- Showmeans not requested -----"; run; proc print data=nonumvar; run; TITLE3; %end; ** Copying the documents from Perdataset document to Final document **; %if %upcase(&ShowMeans) = Y and &HasNum > 0 and &HasObs > 0 %then %do; copy \work.perdataset\Means#1\Summary#1 to ^; copy \work.perdataset\Print#1\Print#1 to ^; setlabel \&dse2.#1\Summary#1 'Statistics' ; obpage \&dse2.#1\Summary#1 /after;
PostersNESUG 2010

10
setlabel \&dse2.#1\Print#1 'StatisticsPrint' ; obpage \&dse2.#1\Print#1 /after; %end; FREQUENCIES The Frequencies section generates a one-way frequency table for each variable in each dataset. The detailed information provided depends on the options selected (Missing/Non-Missing, All, or top N).
Below is the sample code that generates and stores the frequency output. The ShowFreqObs parameter gives the user the options Missing/Non-Missing, All, and Top N. The Missing/Non-missing option shows a frequency table with “Missing” for missing values and “Has values” for non missing data. The option All show frequencies for all values of the variable. Sometimes Missing/Has values is not detailed enough for analyzing the data. On the other hand, the option All creates a very long output for data sets with many continuous variables. Therefore, we added the TopN option, allowing the user to control the number of distinct frequency values he or she would like to see. For instance, with ShowFreqObs=50, the procedure generates a frequency listing for the top 50 values. %if %upcase(&ShowFreqs) = Y and %upcase(&ShowFreqObs) = MISS and &HasObs > 0 %then %do; TITLE3 "General Frequency Information of Character Variables for &dse2" ;
Example of “All” version of the PARTLG frequency table
Example of “Top 5” version of the PARTLG frequency table
PostersNESUG 2010

11
proc freq data=&dset ; tables _all_ /missing nopercent nocum nofreq; format _char_ $missing. _numeric_ missingf.; run; TITLE3; %end; %if %upcase(&ShowFreqs) = Y and %upcase(&ShowFreqObs) = ALL and &HasObs > 0 %then %do; TITLE3 "General Frequency Information of Variables for &dse2" ; proc freq data=&dset ; tables _all_ /missing nocum ; run; TITLE3; %end; ** Creating “Frequencies” folder in the Final document to store all the frequencies output in that folder which makes it easy to read **; %if %upcase(&ShowFreqs) = Y and &HasObs > 0 %then
%do; proc document name=work.final(update); dir \&dse2.; make Frequencies; run; quit; %end;
The Make statement creates folder “Frequencies” in the document
PostersNESUG 2010

12
LISTING
Listing generates a simple printout of the first N observations in each dataset (where N is a user-specified parameter). Seeing is believing, and oftentimes looking at a sample of records gives a good feel for what is or isn’t contained there.
Below is the sample code that generates the listing of observations using PROC PRINT and then manipulates the stored output using PROC DOCUMENT. ods document name=work.perdataset(update);
TITLE3 "First &ShowObs Observations for &dse2" ; proc print data = &dset (obs=&showobs) ; run ; TITLE3; ods document close ; *** set the label for the ShowPrint ***; proc document name=work.perdataset(Update);
setlabel \work.perdataset\Print#2\Print#1 'Listing of obs'; obpage \work.perdataset\Print#2\Print#1 /after; run; quit;
PostersNESUG 2010

13
NO LABELS The No Labels section of the documentation lists any variables that have not been assigned a descriptive label. This can identify variables that were included in the dataset accidentally, or those where a label was inadvertently omitted.
Below is the sample code that generates and stores the listing of variables that do not have labels. ** Creating a table with variable names that do not have label ** proc sql noprint ;
create table NoLabels as select name label="Variable Name" from dictionary.columns where libname = upcase("&getlib") and memname = upcase("&dse2.") and memtype = "DATA" and (label=" " or upcase(label)=upcase(name)); quit; ods document name=work.perdataset(update); TITLE3 "Variables Without Labels for &dse2" ; proc print data = NoLabels uniform Label OBS = ' ' ; run ; TITLE3; ods document close ; quit;
PostersNESUG 2010
14
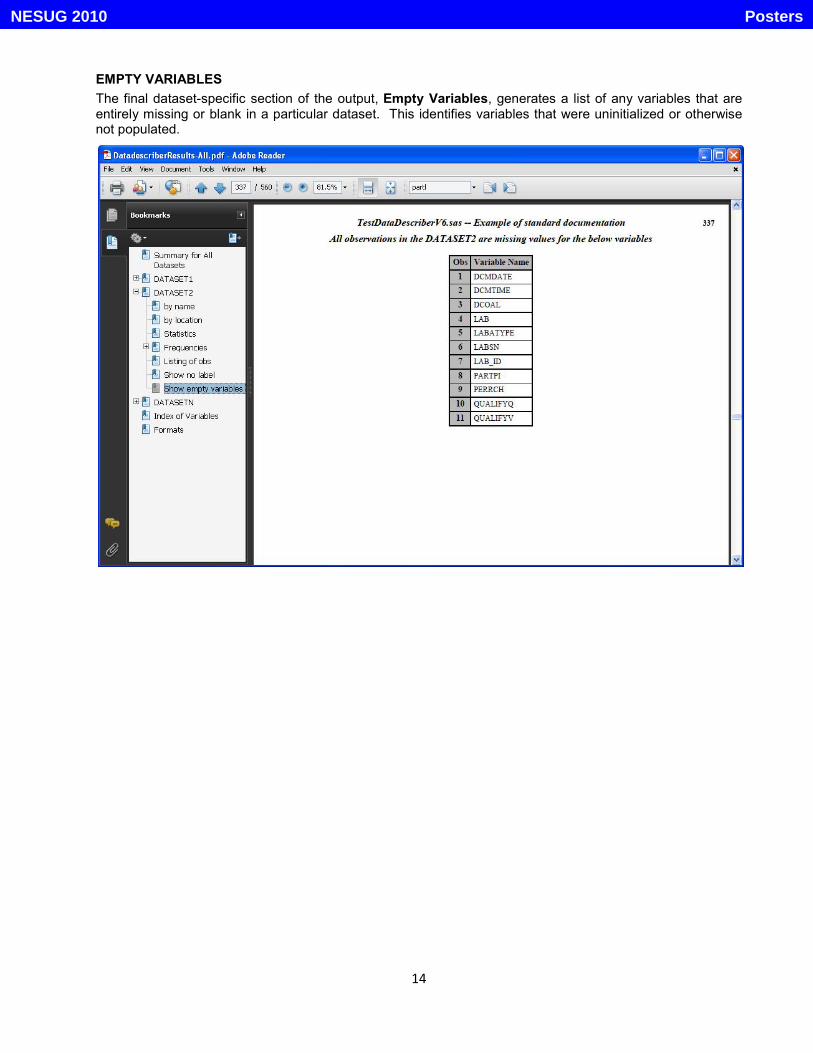
EMPTY VARIABLES The final dataset-specific section of the output, Empty Variables, generates a list of any variables that are entirely missing or blank in a particular dataset. This identifies variables that were uninitialized or otherwise not populated.
PostersNESUG 2010

15
INDEX Following all of the dataset-specific output, the Index section generates an index of all the variables and the dataset(s) the each variable appears in. Aside from a general cross-reference, this can also quickly identify datasets that may be missing primary keys or other variables that should be included in all of the datasets
This variable appears in 3 datasets
PostersNESUG 2010

16
FORMATS The final section of the documentation is Formats, which lists all of the user-created formats used with any of the datasets, along with the values and labels for each category.
CHALLENGES One of the challenges that we came across is that, whenever a user specified a value of N (no output) for any of the parameters, PROC DOCUMENT generated an error since it did not find the path for that component of the output. We fixed this problem by generating a dummy piece of output in these situations, and then deleting it before creating the final Document object.
The other challenge was that, in version 9.1 of SAS, the ODS Document destination had limited support for PROC PRINT and no support at all for PROC REPORT, which made it difficult to achieve the desired output. Fortunately, the arrival of PROC REPORT support with SAS 9.2 allowed us to more easily use the Document destination to achieve the desired output.
CONCLUSION PROC DOCUMENT is a very powerful tool that can customize bookmarks in a manner that is not otherwise possible within ODS. Since the DataDescriber macro generates many pieces of output for each dataset, the output PDF was not easily readable because of the bookmarks that were automatically generated by ODS. With PROC DOCUMENT, however, we no longer needed to stick with the automatically generated bookmarks. Instead, we can customize the bookmarks the way we want. This makes the output easier to read, and therefore more helpful in understanding and comparing the datasets involved.
PostersNESUG 2010

17
DISCLAIMER The contents of this paper are the work of the authors and do not necessarily represent the opinions, recommendations, or practices of Westat.
ACKNOWLEDGMENTS SAS and all other SAS Institute Inc. product or service names are registered trademarks or trademarks of SAS Institute Inc. in the USA and other countries. ® indicates USA registration. Other brand and product names are registered trademarks or trademarks of their respective companies. The author would like to thank Westat management for supporting the participation in NESUG 2010, as well as Mike Rhoads and Mark A. Friedman for their review and constructive suggestions.
CONTACT INFORMATION Your comments and questions are valued and encouraged. Contact the author at:
Jyothi Pabbaraju Westat 1650 Research Blvd. Rockville, MD 20850-3129 301-294-2843 [email protected]
PostersNESUG 2010


![Proc] Proc] Data Modell / Model Kategorie / Category ...€¦ · Proc] Proc] Data Modell / Model Kategorie / Category Energieeffizienzklasse Energieverbrauch (kWh / h / annum) Energy](https://img.dokumen.tips/doc/110x75/5ead02c5c9995c41470efc29/proc-proc-data-modell-model-kategorie-category-proc-proc-data-modell.jpg)