Embed Size (px)
Citation preview

Icarus 215 (2011) 491–507
Contents lists available at SciVerse ScienceDirect
Icarus
journal homepage: www.elsevier .com/locate / icarus
Sedna and the Oort Cloud around a migrating Sun
Nathan A. Kaib a,b,d,⇑, Rok Roškar c,d, Thomas Quinn d
a Department of Physics, Queen’s University, Kingston, ON, Canada K7L 3N6b Canadian Institute for Theoretical Astrophysics, University of Toronto, Toronto, ON, Canada M5S 3H8c Institute for Theoretical Physics, University of Zürich, Institute for Theoretical Physics, University of Zürich, Switzerlandd Department of Astronomy, University of Washington, Box 351580, UW, Seattle, WA 98195-1580, United States
a r t i c l e i n f o
Article history:Received 11 March 2011Revised 27 July 2011Accepted 30 July 2011Available online 11 August 2011
Keywords:Comets, DynamicsComets, OriginOrigin, Solar System
0019-1035/$ - see front matter � 2011 Elsevier Inc. Adoi:10.1016/j.icarus.2011.07.037
⇑ Corresponding author at: Department of Physics,ON, Canada K7L 3N6. Fax: +1 613 533 6463.
E-mail address: [email protected] (N.A. Kaib
a b s t r a c t
Recent numerical simulations have demonstrated that the Sun’s dynamical history within the Milky Waymay be much more complex than that suggested by its current low peculiar velocity (Sellwood, J.A.,Binney, J.J. [2002]. Mon. Not. R. Astron. Soc. 336, 785–796; Roškar, R., Debattista, V.P., Quinn, T.R., Stinson,G.S., Wadsley, J. [2008]. Astrophys. J. 684, L79–L82). In particular, the Sun may have radially migratedthrough the galactic disk by up to 5–6 kpc (Roškar, R., Debattista, V.P., Quinn, T.R., Stinson, G.S., Wadsley,J. [2008]. Astrophys. J. 684, L79–L82). This has important ramifications for the structure of the Oort Cloud,as it means that the Solar System may have experienced tidal and stellar perturbations that were signif-icantly different from its current local galactic environment. To characterize the effects of solar migrationwithin the Milky Way, we use direct numerical simulations to model the formation of an Oort Cloudaround stars that end up on solar-type orbits in a galactic-scale simulation of a Milky Way-like disk for-mation. Surprisingly, our simulations indicate that Sedna’s orbit may belong to the classical Oort Cloud.Contrary to previous understanding, we show that field star encounters play a pivotal role in setting theOort Cloud’s extreme inner edge, and due to their stochastic nature this inner edge sometimes extends toSedna’s orbit. The Sun’s galactic migration heightens the chance of powerful stellar passages, and Sednaproduction occurs around �20–30% of the solar-like stars we study. Considering the entire Oort Cloud, wefind its median distance depends on the minimum galactocentric distance attained during the Sun’s orbi-tal history. The inner edge also shows a similar dependence but with increased scatter due to the effectsof powerful stellar encounters. Both of these Oort Cloud parameters can vary by an order of magnitudeand are usually overestimated by an Oort Cloud formation model that assumes a fixed galactic environ-ment. In addition, the amount of material trapped in outer Oort Cloud orbits (a > 20,000 AU) can be extre-mely low and may present difficulties for traditional models of Oort Cloud formation and long-periodcomet production.
� 2011 Elsevier Inc. All rights reserved.
1. Introduction
The Oort Cloud is the most remote region of the Solar System,and its dynamics are strongly affected by gravitational perturba-tions beyond the Solar System (Oort, 1950). In particular, it is be-lieved that perturbations from passing stars and the localGalactic tide drive the current orbital evolution of the Oort Cloud(Heisler and Tremaine, 1986). The strength of both of these per-turbers is a function of the density of the local solar neighborhood.In the current solar environment, the tide of the Milky Way hasbeen shown to be the more powerful perturbation over long time-scales (Heisler and Tremaine, 1986; Morris and Muller, 1986), andit plays a pivotal role in both enriching and eroding the Oort Cloudpopulation. This is because the tidal force torques the orbits of
ll rights reserved.
Queen’s University, Kingston,
).
distant bodies and causes their perihelia to precess over time(Heisler and Tremaine, 1986). During Oort Cloud formation, asbodies’ orbital semimajor axes are inflated via planetary encoun-ters, this tidal torque can lift these bodies’ perihelia out of the plan-etary region into the Oort Cloud, averting them from being ejectedby further planetary encounters (Duncan et al., 1987). However,once bodies reach the Oort Cloud, the Galactic tide can also lowertheir perihelia and reinject them into the planetary region wheremany are eventually ejected to interstellar space by encounterswith Jupiter or Saturn (Heisler et al., 1987).
Although the perturbations of passing field stars are weakerthan the Galactic tide when averaged over long time periods, theyplay a fundamental role in Oort Cloud dynamics as well. Like theGalactic tide, stellar perturbations influence Oort Cloud dynamicsmainly by torquing orbital perihelia in and out of the planetaryregion (Oort, 1950). However, stellar encounters are a truly sto-chastic process, and they help keep the Oort Cloud isotropized.Without their influence, the Galactic tide would quickly deplete

492 N.A. Kaib et al. / Icarus 215 (2011) 491–507
large regions of orbital parameter space in the Oort Cloud as bodiesare injected into the planetary region and lost through planetaryejections (Rickman et al., 2008). The isotropizing effect of stellarpassages repopulates these regions of orbital space (Fouchardet al., 2011). Thus, there exists a synergy between the perturba-tions of field stars and the Galactic tide (Rickman et al., 2008;Collins and Sari, 2010).
The first numerical simulations of Oort Cloud formation mod-eled external perturbations with a fixed Galactic tide and anunchanging population of passing stars (Duncan et al., 1987). Oneimportant result from this work was that only bodies with semima-jor axes (a) beyond 2000 AU could have their perihelia torqued outof the planetary region into the Oort Cloud, implying that orbitswith smaller a would still have perihelia anchored near the planets.The orbital distribution of observed trans-neptunian objects (TNOs)have largely agreed with this result. However, one glaring excep-tion is the orbit of Sedna (Brown et al., 2004). With a perihelion(q) of 76 AU, this body no longer interacts with the giant planets,yet its high semimajor axis of �500 AU indicates that it has beenstrongly perturbed in the past. While larger than most TNOs, thissemimajor axis is still too small for Sedna’s perihelion to have beensignificantly perturbed by the current local Galactic tide, and Sednaseems to occupy an orbit unexplained by any known dynamicalprocess in the Solar System (Morbidelli and Levison, 2004).
Since the seminal work of Duncan et al. (1987), more recentOort Cloud formation studies have also included the strong pertur-bations associated a solar birth cluster (Fernandez, 1997). In addi-tion to altering the Oort Cloud’s structure and trapping efficiency,these perturbations have been demonstrated to potentially popu-late the Oort Cloud with orbits near or below Sedna’s semimajoraxis (Fernández and Brunini, 2000; Brasser et al., 2006; Kaib andQuinn, 2008). Consequently, many studies have interpreted Sednaas a dynamical relic from when the primordial Solar System expe-rienced much stronger external perturbations within a dense birthcluster (Kenyon and Bromley, 2004; Morbidelli and Levison, 2004;Adams, 2010). Alternative mechanisms for Sedna’s orbit have alsobeen proposed, including distant interactions with an unseen solarcompanion (Matese et al., 2005) or perturbations from a Mars-mass body present in the primordial scattered disk (Gladmanand Chan, 2006).
An underlying assumption motivating every Sedna origin sce-nario is that this body cannot belong to the conventional OortCloud because perturbations from field stars and the Galactic tidehave always been roughly as weak as the present epoch. However,the modeling of external perturbations in even the most sophisti-cated models of Oort Cloud evolution remain relatively (and per-haps overly) simple. They typically view the set of externalperturbations experienced by the Solar System as essentially a stepfunction with time: after an early phase of very powerful perturba-tions from a birth cluster, an unchanging set of weaker perturbingforces due to passing field stars and the Galactic tide continues tosculpt the outer Solar System. In this Paper, we argue that such atreatment is inadequate. Ignoring the subtleties of the local galac-tic environment’s evolution may skew our understanding of Sed-na’s dynamical history as well as the bulk properties of theentire Oort Cloud.
1.1. Solar migration within the Milky Way
The strength of perturbations from passing field stars and theGalactic tide has been assumed to be constant because Galacticdisk stars in general are thought to largely remain near their birthradii, modulo epicyclic oscillations which, in the current solarneighborhood, are restricted to �1.5 kpc (Binney, 2007). Further,the Sun’s peculiar velocity (and by extension its epicyclicoscillation) is very small implying that is has not experienced
many orbital perturbations in the past. With a nearly fixed galacto-centric distance and small vertical oscillations, the density of thelocal solar neighborhood (which controls the strength of the Galac-tic tide and rate of stellar passages) should change very little.Indeed, when the Sun is integrated in an analytical axisymmetricapproximation of the Milky Way’s potential it is found to staywithin �100 pc of the midplane and between 8 and 9 kpc fromthe Galactic center (Matese et al., 1995).
The assumption of a time-invariant axisymmetric potential maynot be valid, however. We know that the structure of the MilkyWay’s disk contains irregular non-axisymmetric components suchas the spiral arms. In addition, the Sun has orbited the Galactic cen-ter for a substantial fraction of the Milky Way’s history, and thegalaxy should have accreted significant amounts of new starsand gas during this time. Sellwood and Binney (2002) found thatstars orbiting near the corotation resonance of the transient spiralarms could experience significant changes in their angularmomentum. As a result, many stars had their mean orbital dis-tances significantly changed, yet their peculiar velocities werenot substantially increased in many cases. Furthermore, it wasfound that stars on nearly circular orbits (low peculiar velocities)were more prone to this type of dynamical evolution since theirangular orbital velocities remain nearly fixed, allowing them to un-dergo resonant interactions with the arms for longer periods.
In idealized simulations of Milky Way-like disk galaxy forma-tion, Roškar et al. (2008) similarly found significant radial migra-tion akin to that described in Sellwood and Binney (2002).Additionally, Roškar et al. (2008) found that over 50% of stars occu-pying the solar neighborhood (roughly defined as being between 7and 9 kpc) were born elsewhere in the disk, mainly in the interior.The migration process in their simulations resembled a randomwalk rather than a smooth outward evolution, and consequentlymany stars occupying the solar neighborhood migrated inward be-fore migrating to their present-day position. Although the migra-tion takes place at the corotation resonance of a spiral, spiralswith different pattern speeds exist in the disk at all times in thissimulation, allowing the entire disk to be affected (Roskar et al.,2011, in preparation).
The results of Sellwood and Binney (2002) and Roškar et al.(2008) raise the possibility that the Sun’s galactocentric distancehas not remained fixed throughout the history of the Solar System,despite its present-day circular orbit about the Galactic center. Thiswould help explain a conundrum concerning the Sun’s metallicity.The metallicity of the Sun is 0.14 dex larger than the mean metal-licity of other nearby solar-age stars (Wielen et al., 1996; Nord-ström et al., 2004). If the Sun formed closer to the Galactic centerwhere the ISM is more metal-rich and then later migrated outwardto its current position, then such a result would be expected. Inaddition, the process of stellar radial migration may explain whythe age-metallicity relation for the solar neighborhood is so flatand contains a great deal of scatter (Nordström et al., 2004). In aclosed-box model for the solar neighborhood, one would expectmetallicity to be tightly correlated with stellar age since older starsform from gas that is less enriched by supernovae than youngerstars. However, as radial migration brings stars into the solarneighborhood that formed in different parts of the disk with differ-ent ISM metallicities, the tight correlation is destroyed. Thus, radialstellar migration seems to be consistent with metallicity distribu-tions of the solar neighborhood Sellwood and Binney (2002), Roš-kar et al. (2008), Schönrich and Binney (2009), Haywood (2008),and Loebman et al. (2011).
1.2. An evolving solar neighborhood
If the Sun has migrated within the Milky Way since its birthcluster dispersed, then the Solar System would have been exposed

N.A. Kaib et al. / Icarus 215 (2011) 491–507 493
to galactic environments (and perturbations) that were markedlydifferent from the local one for some or most of its history. Asone moves closer to the Galactic center, the strength of the Galactictide will increase as the disk density increases. In addition, both thetypical stellar encounter velocity and the rate of encounters willincrease with time. This may impact our understanding of Sedna’shistory. Previous studies that have ruled out Sedna from member-ship in the classical Oort Cloud have not considered these possiblevariations in stellar and galactic perturbations. Moreover, becauseof the fundamental role that these perturbations play in populatingand eroding the entire Oort Cloud, this has the potential to alter theentire distribution of comets throughout the Oort Cloud as well asthe number of bodies trapped in this reservoir.
It is not clear how solar migration would affect the evolution ofthe Oort Cloud, as few previous works have addressed this possibil-ity. While Matese et al. (1995) investigated the effect of a changingtidal strength on the Oort Cloud, these fluctuations were due to thesmall epicyclic oscillations of the Sun about a circular galacticorbit. These variations in the Sun’s galactic position are much smal-ler than those expected due to solar migration. Even so, they foundthat the long-period comet (LPC) flux near Earth would vary by afactor of �4 as the tide strength changed. This was primarily dueto the vertical oscillations above and below the disk midplane.While Matese et al. (1995) focused on the vertical excursions ofthe Sun, substantial radial migration of the Sun may have equalor larger consequences for the Oort Cloud since the disk densityfalls off exponentially with distance from the Galactic center.
To our knowledge, only the works of Tremaine (1993) andBrasser et al. (2010) have explored how the structure of the OortCloud may vary if the Sun were located in different regions ofthe galaxy. Tremaine (1993) employed an analytical treatment ofOort Cloud formation to conclude that a Sun-like star in the galac-tic halo would have an Oort Cloud that is more extended than ourown by a factor of �2. In contrast, Brasser et al. (2010) used a com-putational approach to determine how a drastically different galac-tocentric distance would impact Oort Cloud formation. They usedan analytical approximation of the Milky Way’s potential andnumerically modeled Oort Cloud formation within it, assumingvarious distances to the Galactic center between 2 and 20 kpc.These distances were held constant for the duration of each simu-lation. From this work, it was concluded that shifting the galacto-centric distance of the Sun does not affect the total number ofbodies that are trapped within the Oort Cloud, but it can shiftthe location of its inner edge by over an order of magnitude. How-ever, they found that even their most compact Oort Cloud still hadan inner edge beyond Sedna’s orbit.
Although Brasser et al. (2010) shows that varying the Sun’sgalactocentric distance will affect the Oort Cloud’s structure, it isnot clear how these results apply to a Sun migrating within anevolving galactic disk. A star undergoing radial migration will nothave a fixed galactocentric distance, but instead will sample a largerange of different galactic environments throughout the course ofits life. Furthermore, it is not obvious what is the realistic rangeof possible galactocentric distances for a star that attains a solartype orbit. Lastly, as mentioned previously, the true potential ofthe galaxy is only axisymmetric to first order and has undoubtedlyevolved throughout the Solar System’s history.
Here we present work that uses a purely numerical approach tostudy Oort Cloud formation around a migrating Sun. To investigatethe effect of radial stellar migration, we use the same Milky Wayanalog simulation from Roškar et al. (2008) and combine it withnumerical models of Oort Cloud formation. Our work is describedin the following sections. In Section 2 we describe our numericalmethods. This includes how we select probable galactic historiesfor the Sun, how the corresponding galactic tidal histories are cal-culated, and how we model actual Oort Cloud formation for each
history. Following this, we describe our simulation results in Sec-tion 3, which is divided into two subsections: the first focuses onthe dynamics of Sedna-like orbits, and the second studies the prop-erties of the entire Oort Cloud, paying particular attention to theradial distribution of objects, the trapping efficiency of each OortCloud model, and the erosion of the outer Oort Cloud. Finally, wesummarize the conclusions of our work in Section 4.
2. Numerical methods
We attempt to directly combine a galactic simulation with an-other performed on the planetary scale. Because of the largedynamical range, the numerical method we employ is fairly com-plex and consists of three distinct sets of simulations. The first isa galactic-scale simulation modeling the evolution of a MilkyWay analog galaxy (Roškar et al., 2008). In the first subsection,we summarize the galaxy simulation we use and how we select so-lar analogs from this simulation. We also provide a detailed discus-sion of how the tidal field around each solar analog is measured.The second set of simulations we use are planetary-scale N-bodysimulations employing SCATR (Kaib et al., 2011) to model the for-mation of an Oort Cloud around each of our solar analogs (as wellas three control cases). Our second methods subsection describesthis set of simulations. Finally, our last subsection describes a setof Monte Carlo simulations using the impulse approximation tomodel perturbations from passing field stars on Sedna-like orbits.
2.1. Galaxy simulation
This galaxy simulation has been used previously to study stellardynamics (Roškar et al., 2008) and was run with the N-Body + -smooth-particle-hydrodynamics (SPH) code GASOLINE (Wadsleyet al., 2004). This particular simulation is designed to model thelast 10 Gyr of evolution of the Milky Way following its last majormerger with another galaxy. The initial conditions begin with 106
dark matter particles and 106 gas particles. The dark matter parti-cles are arranged in a spherical Navarro–Frenk–White (NFW) pro-file (Navarro et al., 1997), and a halo of gas particles in hydrostaticequilibrium is imbedded with the same profile. The entire systemis given a cosmologically motivated spin. The total mass of the sys-tem is chosen to be 1012 M� with baryons accounting for 10% ofthis mass. The mass budgets for each matter component are splitevenly for each particle, giving an initial mass of 105 M� for eachgas particle. As the gas collapses and reaches higher densities,gas particles form star particles whose masses are a fraction ofthe original gas particle, typically around 3 � 104 M�. The star for-mation recipe depends on the temperature and density of the localgas and also includes supernova feedback cycles (Stinson et al.,2006). At t = 10 Gyr, the simulated galaxy contains roughly2.5 � 106 star particles. As the gas continues to collapse into arotating disk, transient spiral arms form spontaneously and causea radial redistribution of stellar matter (Sellwood and Binney,2002). During this evolution, gravitational forces are fully resolveddown to distances of 50 pc, below which they are softened with aspline function (Stadel, 2001). It is important to note that our gal-axy is modeled in isolation and consequently does not include fullcosmological effects. However, standard cosmological simulationspredict that cosmological accretion and mergers are most impor-tant at epochs prior to the last major merger of the Milky Way.Hence, our model represents the rebuilding of the Milky Way diskafter the hierarchical building of the galaxy culminating with thelast major merger.
We use our galaxy simulation to approximate the dynamicsSun-like stars may have experienced during the past 4 Gyr in theMilky Way. Therefore, we compare key properties of the simulated

494 N.A. Kaib et al. / Icarus 215 (2011) 491–507
galaxy and the Milky Way in Table 1, and a more detailed compar-ison can be found in Loebman et al. (2011). As can be seen fromTable 1, the only property of our simulated galaxy that differsappreciably from the Milky Way is the stellar velocity dispersionof the disk. Our simulated galaxy has a dispersion that is roughly50% greater than the Milky Way. Because this is a gauge of howeccentric the typical stellar orbit is, it may seem that our galaxycould be overestimating the degree of stellar radial migration com-pared to the Milky Way. We note, however, that the key ingredientfor the processes described in this paper is the presence of tran-sient spiral arms. The asymmetric structure in our simulation isconsistent with observations of external systems (Rix and Zaritsky,1995), with m = 2 Fourier amplitudes in the range of 0.1–0.3. Fur-ther, although the velocity dispersions of old stars are somewhathigher in our models, the heating rates are in fact somewhatslower than those in the Milky Way (Holmberg et al., 2009), andfollow power laws of r � t�0.3. Should we have unrealistic asym-metries in the disk, we might expect that the heating rates wouldalso be uncharacteristically high, but this is not the case. The high-er velocity dispersion is likely mostly a consequence of the fact thatthe disk in our simulation is slightly more massive than the MilkyWay. We are therefore confident that the degree of orbital evolu-tion present in our models is a reasonable proxy for the historyof the Milky Way disk. We have an extensive paper discussingthe details of spiral structure and radial migration in our modelsin preparation.
2.1.1. Solar orbital historiesTo explore the different possible orbital histories of the Sun, we
choose solar analog stars found at the last timestep of our galaxysimulation. Our criteria for choosing solar analogs are based onthe stellar age, position, and kinematics. These criteria are dis-played in Table 2 along with the corresponding solar values foreach category. In total, we found 31 stars that met all of the criteriashown in Table 2. Our suite of solar analogs displays a diverse vari-ety of orbital histories. For instance, the star particle shown inFig. 1a supports the standard idea of the Sun’s orbital history,maintaining a roughly constant galactocentric distance for the his-tory of the Solar System. In contrast, Fig. 1b shows a very differentdynamical evolution of a star that also attains a final orbit similarto the Sun’s. This star spends most of its first 3.5 Gyr orbitingbetween 2.5 and 3.5 kpc from the Galactic center before finallymigrating outward to 8 kpc in the last Gyr of its history.
To gauge the full spectrum of possible solar orbital evolutions,we sample the radial distances of each of our solar analog starsevery 10 Myr for the last 4 Gyr of the galaxy simulation. This radialdata is displayed in the histogram shown in Fig. 2. As can be seen,orbital histories that take a star as close as 2 kpc and as far as13 kpc from the Galactic center are consistent with the Sun’s cur-rent position and velocity in our simulated galaxy. In addition,we also find that the median radial migration incurred during
Table 1Comparison between the properties of the Milky Way and our simulated galaxy at t = 10 Gyvelocity dispersion at r = 8.0 kpc, disk scale length, disk scale height, total disk midplane dscale length and height are taken from Juric et al. (2008), while the circular velocity is baseHolmberg and Flynn (2000) and Just and Jahreiß (2010) respectively. Finally, the stellar d
Galaxy vrot (km/s) rtot (km/s) rL (kp
Milky Way 220 42a 2.6Simulated 240 64 2.3–3
a We chose to report the local Milky Way’s dispersion value from Garcıa-Sánchez etencounter code. This dispersion value is based on Hipparcos velocity data of the solar nvalue of �65 km/s, which is much closer to our simulated galaxy (Holmberg et al., 2009
b The scale length of our galaxy measured via surface density is 3.5 kpc, but the midpgrows with galactic radius. Depending on the method of measurement, we find a scale
the 4 Gyr orbital histories of our solar analogs is 5 kpc, showingthat migration well over a disk scale length is common for Sun-likestars in this Milky Way analog. This is further demonstrated inFig. 2 where we mark the median minimum and median maximumgalactocentric distances of our star sample at 4.63 and 9.77 kpc,respectively. Lastly, the median galactocentric distance of our en-tire set of stellar radial data is 7.14 kpc, indicating that on averagestars with similar dynamical properties to the Sun spend 50% oftheir first 4 Gyr orbiting inside �7 kpc.
It should be noted that in addition to significant radial migra-tion, our solar analogs can also orbit at different vertical positionsabove and below the midplane. However, the effects of this orbitalvariation on Oort Cloud structure are less significant than radialmigration. This is due to a couple of factors. First, we have just seenthat a typical Sun-like star radially migrates by 5 kpc in our simu-lation, which is roughly two disk scale lengths. On the other hand,although there is some vertical variation, our solar analogs tend tostay concentrated toward the midplane for the most part. 99% of allrecorded stellar positions are within 0.5 kpc of the midplane, and92% are within 0.3 kpc (one disk scale height). Thus, the typicalvertical variations of our solar analogs modulate the local densityby a smaller factor than the typical radial variations. Furthermore,even if a star drifts far from the midplane it must still make pas-sages through the high density area of the midplane every orbitas it oscillates above and below. This further diminishes the effectof vertical excitation.
2.1.2. Tide approximationDeveloping a method to approximate the Galactic tide near a
solar analog is challenging because the potential of our simulatedgalaxy is not the well-behaved static function employed in manyprevious Oort Cloud studies. For instance, it is normally assumedthat the vertical component of the Galactic tide dominates overthe radial tide. However, when a spiral arm or any other large sub-structure is located near one of our stars, this assumption may notbe true. For this reason, we build our tidal field directly from theaccelerations calculated by our galactic simulation code. To do this,we remove the star of interest and place massless test particles off-set from the star’s position by ±10 pc in the x, y, and z directions.We then repeat the force calculations for the timestep followingeach simulation data output and record the accelerations of eachtest particle. Comparing the acceleration data for the test particlesthen allows us to measure how the acceleration due to the galacticpotential varies near the star in the x, y, and z directions. (The x, y,and z vectors define a static coordinate system with an x–y plane inthe galactic mid-plane and with vector directions that match thecoordinate system chosen in our Oort Cloud formationsimulations.)
One potential issue with our tidal calculation technique con-cerns the coarse mass resolution of galaxy simulations. In this par-ticular simulation, the masses of stars are scaled up by a factor of
r. Columns are (from left to right): galaxy name, circular velocity at r = 8.0 kpc, stellarensity at r = 8.0 kpc, and stellar disk midplane density at r = 8.0 kpc. Milky Way diskd on Hou et al. (2009). The Milky Way’s total midplane and stellar densities are from
ispersion is based on Garcıa-Sánchez et al. (2001).
c) rH (pc) q (M�/pc3 q⁄ (M�/pc3)
300 0.10 0.04.5b 300 0.09 0.056
al. (2001) since this work supplies the mass-velocity relation used in our stellareighborhood. However, more recent observations indicate a higher local dispersion).
lane density has a substantially smaller scale length because our disk’s scale heightlength as small as 2.3 kpc.

Table 2Comparison between the kinematical properties of the Sun and our selection criteria for solar analogs in our simulated galaxy at t = 10 Gyr. Column are (from left to right): starcategory name, stellar age, distance from galactic center, distance from the disk midplane, radial peculiar velocity, tangential peculiar velocity, and vertical peculiar velocity. Solardistances to the Galactic center and above the midplane are taken from Reid et al. (2009) and Juric et al. (2008) respectively. Solar velocity data are taken from McMillan andBinney (2010).
Stars age (Gyrs) r (kpc) z (pc) u (km/s) v (km/s) w (km/s)
Sun 4.57 8.4 ± 0.6 25 10 18 ± 2 7.2Sun analogs 4.45 ± 0.15 8.05 ± 0.7 0 ± 100 0 ± 15 0 ± 15 0 ± 15
a
b
Fig. 1. Galactocentric distance vs. time for the orbits of two solar analogs. One isconsistent with an approximately fixed galactocentric distance for the history of theSolar System (a), while the other forms much close to the Galactic center than theSun’s current position (b).
Fig. 2. Histogram showing the relative time spent at different galactocentricdistances for our solar analogs. The shaded region mark the range of final distancesfrom which our solar analogs were selected. The dashed lines mark the medianvalues of the minimum and maximum galactocentric distances attained for oursolar analogs. (We assume a scale length of 3.5 kpc in the top x-axis).
Fig. 3. Cumulative histogram of dazdx =
dazdz
�� �� for the local tidal data in our simulatedsolar analogs.
N.A. Kaib et al. / Icarus 215 (2011) 491–507 495
�105. Because the stellar populations of galaxies are collisionless,their dynamics should still be well-modeled by such particles.However, we are measuring the force variations in this popula-tion’s potential over scales of tens of pc. In the real Milky Way,the smooth spatial distribution of gas and millions of stars will pro-duce these force fluctuations, but in our simulated galaxy, it will bea much smaller number of more massive particles. Because of this,our tidal field measurements can become dominated by a singlemassive body near the Sun. To guard against this, the gravitationalpotential of each particle is softened over a distance �. This essen-tially smears the mass of a star particle out over �, so if our test
particle configuration happens to lie right next to a 3 � 104 M� starparticle, force softening will produce very little acceleration changedue to this individual particle’s presence. The characteristic soften-ing length we choose for our tidal calculations is � = 150 pc, whichis three times larger than the softening used in the actual galaxysimulation. We found that without such a large softening lengthour calculated tidal fields did not behave in a manner expectedfor a potential that still resembles a smooth disk to first order.Moreover, it is not surprising that our tidal calculations requireda larger � than the actual force calculations in the original simula-tion run, since the tidal terms represent an additional spatial deriv-ative with respect to the force terms. Because the softening lengthis approximately equal to the scale height of the disk, we shouldstill be able to resolve the actual decrease in stellar density withheight above the disk. In this way, our tidal acceleration measure-ments become more sensitive to the distribution of many distantstar particles rather than a few very close ones. While this schemeis not perfect, we emphasize that this work is the first of its kindand extrapolating a parsec-scale tidal field from a model of a kilo-parsec-scale system requires some degree of compromise.
Although we expect our tidal field to display time-varying irreg-ularities, our simulated galaxy does resemble a smooth uniformdisk to first order. Consequently, we expect our tidal field to gener-ally reflect the properties of such an idealized galaxy most of thetime. We use this fact to perform several exercises to verify thatour measured tidal field behaves like that of a disk galaxy and isnot dominated by shot noise effects from the coarse mass resolu-tion of our Milky Way analog.
Our first exercise is shown in Fig. 3. Here we show a cumulativehistogram of the ratio of the vertical gradient of the vertical accel-eration daz
dz
� �to the x-gradient daz
dx
� �(the ratio for the y-gradient has
a nearly identical shape). The data shown here is for all data out-puts for every solar analog. Because the analytical tides used inmost Oort Cloud studies are dominated by the tide of the galacticdisk, the vertical acceleration should not vary over small distancesin the x and y directions. As can be seen in Fig. 3, for over 90% ofour tidal data, the vertical acceleration varies by a factor of at least5 slower for shifts in the x-direction than in the z. Thus, it seems

496 N.A. Kaib et al. / Icarus 215 (2011) 491–507
that our numerical tidal data generally behaves similarly to analyt-ical approximations in this respect.
The next examination of our tidal field calculations is shown inFig. 4. In this figure, we show another cumulative histogram, thisone displaying the ratio of the x gradient of the x acceleration
daxdx
� �to the vertical gradient of the vertical acceleration daz
dz
� �. For
analytical approximations of the Galactic tide near the Sun, thevertical tide dominates over tangential and radial components bya factor of 5–10 (Levison et al., 2001). Once again, we see thatour tidal data generally shows the same trends. For 80% of our tidaldata, the vertical tidal component is at least a factor of �3 timesstronger than x component. Furthermore, most of the tidal datawhere this ratio is large occurs when the solar analog in questionhas an excursion of several hundred pc away from the disk mid-plane, where the local disk density (and therefore daz
dz ) is lower. Asin Fig. 3, a tidal histogram where the y tidal component is substi-tuted for the x component looks nearly identical to the one shown.
In the last assessment of our tidal field measurements we com-pare the local vertical gradient of the vertical acceleration daz
dz
� �
with the distance from the Galactic center where the tidal mea-surement was taken. In a galactic tidal field that is dominated bythe disk tidal term, the vertical tide will be directly proportionalto the local disk density. As one moves away from the Galactic cen-ter, the disk density falls off exponentially, so we expect that thevertical tidal will show a similar trend. Indeed, Fig. 5 confirms thatthe local vertical tide we measure is strongly dependent on the
Fig. 4. Cumulative histogram of daxdx =
dazdz
�� �� for the local tidal data in our simulatedsolar analogs.
Fig. 5. Plot of dazdz
�� ��/ dazdz
�� ��static vs. galactocentric distance for the local tidal data in our
simulated solar analogs (small points). The line of square data points marks thevalue of daz
dz for an analytical tidal model (Levison et al., 2001), and the triangularpoints mark the best fit disk scale length for our tidal data. The best fit yields a scalelength of 2.6 kpc.
distance from the Galactic center. (Note that a plot of dazdz vs. jzj does
not show such a dependence due to the lesser significance of ver-tical oscillations explained in the previous section.) For reference,we also mark the vertical tide given by a static analytical approx-imation used in several recent Oort Cloud works (Brasser et al.,2006; Levison et al., 2001; Wiegert and Tremaine, 1999). In addi-tion, we fit an inferred disk scale length to our tidal data. We finda best fit scale length of 2.6 kpc, which falls well within the rangeof scale lengths we measure in Table 1. We also see in Fig. 5 thatthe maximum measured daz
dz values are near the analytical tidalmodel at 8 kpc (the approximate solar radius). The lower measuredvalues at 8 kpc correspond to excursions from the midplane or ear-lier times in the simulated galaxy’s evolution when disk density islower. In light of the previous three figures, we believe that ournumerical tidal calculation technique is suitable for exploring theeffects of radial stellar migration on Oort Cloud dynamics.
2.2. Oort Cloud simulations
We select 31 stars in the last timestep of our galaxy simulationthat finish with galactic positions, velocities, and ages similar tothe Sun. These stars display a wide variety of dynamical historiesin the galaxy, and we use direct numerical simulations to modelthe orbital evolution of test particles around these stars. In addi-tion, we perform three ‘‘control’’ simulations to mimic the typicalassumption for the solar neighborhood – the tidal field and stellarpopulation at r = 8 kpc in the last timestep of our simulated galaxyis used for the entire time. To perform these simulations, we usethe numerical algorithm SCATR (Kaib et al., 2011). This code inte-grates massless test particles with an adaptive timestep routinewhose accuracy is enhanced with a symplectic corrector (Wisdom,2006), making it particularly adept at modeling problems with awide-range of dynamical timescales, such as the scattering andtorquing of small bodies in the distant Solar System. Particles with-in 300 AU of the Solar System barycenter are integrated with atimestep of 200 days, and particles beyond this distance are inte-grated with 9000-day timesteps, greatly increasing the computingefficiency of distant orbits.
In our numerical simulations, we represent small bodies withmassless test particles. In each simulation, we begin with 2000 testparticles orbiting between 4 and 40 AU. Their initial eccentricitiesare randomly distributed between 0 and 0.01, while the cosines oftheir initial inclinations are randomly distributed between 0 and0.02. These particles are then evolved under the gravity of theSun and the four giant planets on their present orbits. In additionto the Sun and giant planets, we also include gravitational pertur-bations from the galactic tide and passing field stars. The galactictide we employ is dependent on six independent terms: the x, yand z derivatives of each component of the galactic acceleration(ax, ay, and az) (not nine independent terms, since dax
dy ¼day
dx , etc.).These are recorded in our galaxy simulation every 10 Myr andare updated accordingly in the Oort Cloud formation simulations.In the time between tidal updates, the tidal terms are linearlyinterpolated between the last update and the next.
In addition to tidal information, our galaxy simulation code alsorecords the local stellar density and velocity dispersion near eachof our solar analogs. These quantities are determined from the 64nearest stellar neighbors of the solar analog in question. The re-corded stellar velocity dispersion values range from 21 to 165 km/s, while local stellar densities are measured to be between5 � 10�3 and 1.4 M�/pc3, although the vast majority (99%) are lessthan 0.5 M�/pc3. The highest stellar densities and dispersions occurwhen solar analogs are closest to the Galactic center. In our OortCloud simulations, random stellar encounters are generated bystarting stars at random orientations 1 pc from the Sun. These starsare then given random velocities using the encounter recipe of

N.A. Kaib et al. / Icarus 215 (2011) 491–507 497
Rickman et al. (2008) where stars are assigned different encountervelocities using the mass-velocity relation from Garcıa-Sánchezet al. (2001). It should be noted that this velocity relation is contin-uously scaled up or down so that the mean dispersion will match thelocal dispersion measured in our galaxy simulation, which isupdated every 10 Myr. Lastly, the stellar encounter frequency isset by the locally measured dispersion and density of the galaxy sim-ulation and is also updated every 10 Myr.
Because the vast majority of particles scattered by the giantplanets are ultimately ejected from the Solar System, only a smallpercentage of our original 2000 test particles will be bound to theSun and torqued out of the planetary region after 4 Gyr. The signa-tures of different solar dynamical histories may be difficult to char-acterize with such low particle numbers. For this reason, when ourtest particles pass through critical stages of scattering and torquingthey are cloned with a routine similar to previous works (e.g., Lev-ison and Duncan, 1997; Levison et al., 2001). The first time particlesare cloned is when they are being scattered by the giant planets tolarger semimajor axes. When a particle attains a > 100 AU, it iscloned 10 times by shifting each of its cartesian coordinatesbetween ±1 � 10�7 AU. Then, if a particle’s perihelion is torquedout of the planetary region (q > 45 AU) it is again cloned 10 times.Through this process we generate 100 times as many particles withperihelia beyond the planets as an uncloned simulation would,resulting in much smoother distributions of orbital elements.
2.3. Stellar encounter Monte Carlo simulations
In the present work, we also include a third set of Monte Carlosimulations modeling stellar perturbations. These simulations aremotivated from results of our planetary N-body simulations. Inthe analysis of our N-body simulations, we pay special attentionto the parameter ased, which is defined as follows: Considering onlybodies with Sedna-like perihelia (60 AU < q < 100 AU), ased is thesemimajor axis inside which only 10% of orbits are found. Fromour N-body simulations, we observed that stellar encounters areresponsible for setting the value of this parameter (see next sec-tion). Because stellar passages are a stochastic process, it is impos-sible to determine the probability of Sedna production for a givensolar orbital history with just one N-body simulation. However, thecomputing requirements to perform many N-body simulations foreach solar orbital history would be prohibitive. Thus, we have runmany simple Monte Carlo simulations of stellar encounters tocomplement our N-body simulations.
Fortunately, the total impulse delivered by passing stars is dom-inated by the few strongest encounters (Rickman, 1976), so weonly need to consider a handful of stellar encounters over thecourse of 4.5 Gyr. To measure the variance of the very inner edgeof the Oort Cloud (ased) we generate 100 different sets of stellarencounters for each of our 31 solar orbital histories we modeledwith N-body simulations. In each set of stellar encounters, weignore all encounters except the five closest encounters and thefive encounters that deliver the largest velocity kick to the Sun.We note that the median encounter timescale (b/v) of our set ofpowerful encounters is 104 years, whereas the orbital period ofSedna’s orbit is much larger at �11,000 years. Thus, we can usethe impulse approximation to model the perturbations of most ofthese stellar encounters on Oort Cloud bodies. Occasionally in-cluded in our set of encounters are massive stars encounteringthe Solar System at quite large distances and therefore much largerencounter timescales, which invalidate the impulse approxima-tion. For these encounters, if the encounter timescale is longer than1000 years, we discard the encounter. Therefore, although weknow from observing our N-body simulations that it is usuallythe closest stellar encounters that alter ased, the results from our
Monte Carlo simulations should be considered a minimum esti-mate of the effects of field stars.
Once we have isolated the strongest encounters for each 4.5-Gyrhistory of encounters, we calculate their additive impulse on a gen-eric scattered disk and Oort Cloud. The generic scattered disk/OortCloud configuration we use is a t = 1 Gyr snapshot from one of ourcontrol simulations. After the impulse approximation is applied toour particles, we calculate the new modified orbital elements inour scattered disk and Oort Cloud. As with the N-body simulations,we now consider only particles with 60 AU < q < 100 AU and deter-mine the value of ased. Thus, with a small number of calculations foreach stellar encounter set, we now have 100 different ased values foreach solar orbital history.
Compared to our N-body simulations, these simulations are ofcourse very simple, as they do not include the effects of the planetsor Galactic tide. However, this is an acceptable approximation forbodies with Sedna-like semimajor axes for the following reason.If a low-a orbit happens to be torqued out of the planetary regionby one of the most powerful stellar encounters, it will no longer beinfluenced by planetary perturbations. Additionally, the smallestsemimajor axes affected by powerful stellar encounters will resideclose enough to the Sun that the effect of the Milky Way’s tide willalso be negligible (again, see next section). Thus, such an orbit willnot evolve further until a stellar encounter of similar strengthoccurs, which we do account for.
Perhaps the weakest aspect of these simulations is our choice ofa generic scattered disk and Oort Cloud. The reason for this is thatalthough the dynamics of Sedna-like bodies are governed solely bythe few strongest stellar encounters, this is not true for more dis-tant parts of the Oort Cloud. The Milky Way’s tide sculpts the struc-ture of most of the Oort Cloud, and the strength of this tide willvary significantly for different solar orbital histories. Yet, all ofour Monte Carlo stellar encounter simulations have the same OortCloud. Essentially, we are accurately modeling the torquing ofbodies out of the scattered disk (since the structure of the scattereddisk will be nearly independent of external perturbations), andthen we are tacking on an artificial Oort Cloud. However, includingsome type of Oort Cloud is necessary since distant Oort Cloudorbits also occupy the 60 AU < q < 100 AU region, and their absencewould dramatically alter the location of ased.
3. Simulation results
For reference, we display a summary of our simulations inTable 3. Included are the main orbital characteristics of each solaranalog as well as the main characteristics of the resulting OortCloud. What follows is a more detailed presentation of our simula-tion results that is divided into two subsections. The first focuseson the production of Sedna-like orbits, while the second examinesthe entire Oort Cloud formed around each solar analog.
3.1. Production of Sedna analogs
The potential effects of radial galactic migration on the outerSolar System are illustrated in Fig. 6. Fig. 6a shows the evolutionof one particular solar analog’s galactic orbit with time. Althoughit eventually attains a solar-like galactic orbit, it spends its first4 Gyr significantly closer to the Galactic center where the averagelocal density is about a factor of 4 higher. Consequently, the exter-nal perturbations from the local environment are more powerfulfor a star with this orbital history. In Fig. 6b, we study the evolutionof test particles orbiting this star. Specifically, we follow the semi-major axis distribution of bodies that are torqued just beyond theplanets (60 AU < q < 100 AU). In particular, we pay attention to ased,the semimajor axis inside which only 10% of these particles are

Table 3Summary of Oort Cloud properties for each of our simulations. The columns from left to right are: Simulation name, distance at which the solar analog formed, minimumgalactocentric distance attained by the solar analog, maximum galactocentric distance attained by the solar analog, time at which solar analog attained minimum galactocentricdistance, value of ased, minimum semimajor axis in Oort Cloud, median semimajor axis in Oort Cloud, maximum semimajor axis in Oort Cloud, Oort Cloud semimajor axis beyondwhich orbital inclinations are isotropized, percentage of total particles trapped in Oort Cloud after 4 Gyr.
Run rform (kpc) rmin (kpc) rmax (kpc) t(rmin) (Gyr) ased (AU) amin (AU) amed (AU) amax (AU) aiso (AU) Trap %
Control a – – – – 1184 2740 14,382 76,278 8729 2.91Control b – – – – 1177 2795 15,338 75,051 11,395 3.37Control c – – – – 780 2758 13,870 76,627 7145 2.271 5.48 4.18 9.77 0.10 1450 2485 10,788 62,242 8769 2.832 8.37 6.07 10.43 4.14 1267 4017 20,596 82,286 10,487 2.373 8.21 4.66 11.03 2.68 614 573 12,266 70,461 9750 1.394 4.18 2.38 7.97 3.40 495 665 7184 53,492 3180 1.935 3.89 3.89 8.99 0.00 1056 1943 8946 58,641 7321 3.306 8.09 8.02 12.87 4.05 2789 7025 33,198 87,156 20,739 3.597 7.08 2.71 9.17 3.72 580 700 10,005 67,510 5466 1.708 8.49 2.84 9.74 3.41 475 436 6899 60,000 5035 1.039 3.40 2.32 8.94 3.71 390 802 6757 47,102 4434 1.5010 3.19 2.42 8.70 2.18 213 219 3126 33,658 3290 2.6811 5.99 3.23 8.88 3.27 794 1645 8503 61,498 5615 1.9112 3.92 2.29 9.61 0.04 688 1053 5708 45,630 4664 2.5813 5.74 2.55 8.46 3.23 541 1058 5432 45,403 4086 1.7214 5.56 4.61 10.29 0.28 1031 1846 9831 60,306 6895 3.4415 8.44 6.13 10.76 2.65 1382 3408 19,026 75,725 9134 2.9116 7.50 4.48 10.26 2.40 1133 2089 12,535 65,991 5659 2.2517 5.90 4.14 10.11 0.08 920 1428 10,366 61,410 6577 2.6718 8.16 5.94 9.86 4.33 925 1449 12,029 80,551 8460 1.9619 7.99 4.86 11.48 3.97 1657 3568 17,624 85,213 11,332 2.9320 7.51 7.31 13.42 0.02 2248 6972 30,412 99,913 21,551 2.9821 5.45 2.41 8.78 3.60 679 1306 6414 49,349 4083 1.7222 8.02 4.43 8.76 3.35 762 1758 8032 60,661 8009 1.0323 5.75 4.54 9.99 2.09 254 307 6856 64,671 5489 1.4924 5.87 3.38 10.62 0.48 1406 2229 9552 59,767 7445 2.6825 6.68 5.41 8.81 1.73 817 1591 10,436 63,668 6597 2.1826 5.43 4.63 9.20 2.44 938 1506 7016 50,018 5114 1.8527 8.97 5.13 10.36 2.65 1443 3215 16,102 77,206 10,434 1.6928 5.70 5.25 9.92 2.34 1145 2464 11,259 66,689 6968 2.6329 6.21 5.08 10.38 0.05 908 2845 14,774 69,655 7503 3.4030 6.91 3.35 9.29 1.63 719 1431 9033 61,311 5317 2.1031 5.10 2.28 8.51 1.45 685 1190 4701 36,612 3416 2.66
a
b
c
Fig. 6. (a) Plot of galactocentric distance vs. time for a typical solar analog. (b) Plotof the a distribution for orbits with 60 AU < q < 100 AU vs. time for the above solaranalog. The solid lines mark the semimajor axis inside which 10%, 50%, and 90% oforbits are found. (Note that the 10% curve defines ased.) The shaded region markssemimajor axes inside Sedna’s. (c) Plot of the same orbital distribution as in (b), butwith a fixed galactocentric distance of 8 kpc assumed.
498 N.A. Kaib et al. / Icarus 215 (2011) 491–507
found. Because this parameter is near the minimum semimajoraxis torqued by external perturbations, ased effectively marks theinner edge of the Oort Cloud. Fig. 6b indicates that after 4 Gyr, ob-jects with semimajor axes even smaller than Sedna’s are torqued
beyond the planets. In contrast, a simulation that assumes theSun’s galactocentric distance has remained fixed (Fig. 6c) doesnot yield Sedna analogs. Thus, for some solar migration cases, theOort Cloud’s very inner edge can be pushed to encompass Sedna’ssemimajor axis, making it one of the innermost members of the‘‘normal’’ Oort Cloud. Of the 31 solar analogs for which we ran fullsimulations, seven had ased < 600 AU after 4 Gyr of evolution.
When examining the evolution of ased in Fig. 6b, one notices thatased does not change smoothly. Instead it is nearly constant forhundreds of Myrs before decreasing abruptly in very short periods.If the Galactic tide were controlling the position of ased we wouldexpect to see a much more gradual evolution in ased that reflectsthe steady nature of this perturbation. Even for a migrating star,significant changes in radial position occur over �100 Myr or long-er, so the decreases in ased should occur over these timescales aswell if the tide were setting the Oort Cloud’s inner edge.
The only alternative to explain the evolution of ased is that stel-lar perturbations are setting the position of ased. This is quite sur-prising, as the Galactic tide has been shown to be more powerfulthan stellar perturbations when averaged over long timescales(Morris and Muller, 1986; Heisler and Tremaine, 1986). However,recent modeling of Oort Cloud dynamics suggests that the impor-tance of stellar perturbations has been underestimated in manyother recent studies (Rickman et al., 2008). Furthermore, stellarencounters are a stochastic process whose net effects are domi-nated by the strongest few encounters (Rickman, 1976). As a result,it is possible that the net impulse delivered by all stellar perturba-tions is concentrated into a few small time windows during whichthe most powerful stellar passages occur. During these smallwindows, we would expect stellar perturbations to temporarily

N.A. Kaib et al. / Icarus 215 (2011) 491–507 499
dominate over tidal perturbations, torquing bodies out of the plan-etary region on semimajor axes that are smaller than thoseexpected due to just the Galactic tide.
To test whether this scenario is accurate, we perform a simpleexperiment. First, we randomly generate a set of 100 scattered diskorbits around the solar analog studied in Fig. 6b. The semimajoraxes and perihelia are all fixed at 1000 AU and 40 AU respectively,while inclinations are distributed between 0� and 10�. Becausebodies with such eccentric orbits spend most of their time nearaphelion, we fix the mean anomalies to p. All other orbital ele-ments are chosen randomly from a uniform distribution. Afterthese initial orbits are generated, we next use the impulse approx-imation to simultaneously apply all of the velocity impulses due toevery stellar encounter within a 100-Myr window of our 4-GyrN-body simulation. This is done for every 100-Myr interval ofour simulation, and for each interval, the mean absolute perihelionshift of our suite of orbits is recorded. Similarly, we also calculatethe mean absolute perihelion shift due to tidal forces for eachinterval by integrating the tidal acceleration experienced duringeach 100-Myr interval.
The results of this perturbation study are shown in Fig. 7 wherewe have plotted the mean perihelion shift due to stellar encountersvs. time as well as the mean perihelion shift due to the Milky Waytide vs. time. This plot shows that, indeed, roughly 75% of the time,tidal perturbations are more powerful than stellar perturbations.However, there are also windows of time when a single very pow-erful stellar encounter greatly enhances the net effect of stars dur-ing a particular 100-Myr window. During these windows, theperturbations of stars can be nearly 10 times as powerful as thetides. Reexamining Fig. 6b, we see that ased experiences its sharpestdecreases at t = 0.22, 2.63, and 3.65 Gyr. Fig. 7 shows that all ofthese decreases occur during intervals dominated by stellarencounters. This verifies that stellar encounters set the locationof the Oort Cloud’s inner edge.
It appears only a handful of isolated encounters set the locationof the Oort Cloud’s inner edge. Due to these events’ stochastic nat-ure, the inner edge’s location will vary substantially from one sim-ulation to another, even in the same stellar environment. Thus,there is always a spread of possible inner edge locations for a givenstellar density, and it is impossible to measure this spread for a gi-ven solar analog using just one N-body simulation. Instead, we canuse our Monte Carlo simulations (see Section 2.3) to help predictthe range of ased for the stellar environments encountered by eachsolar analog. First, however, we must assess how well these addi-tional Monte Carlo stellar encounter simulations predict the posi-tion of ased. To do this, we perform stellar encounter simulationsthat use the same exact stellar encounter sets from our N-body
Fig. 7. Mean absolute perihelion change vs. time for 100 particles with a = 1000 AUand q = 40 AU. Data points mark the perihelion change due to stellar perturbations,while the solid line marks the perihelion shift due to the Galactic tide. This is thesame set of perturbations experienced by the solar analog plotted in Fig. 6a and b.
simulations. Then we compare the ased values predicted from thestellar encounter simulations with those measured in our fullN-body simulations. The results of this test are shown in Fig. 8.We see that although there is scatter, the 1:1 trend demonstratesour Monte Carlo simulations are capturing the dominant processresponsible for setting the inner Oort Cloud edge. (The scatter ismost likely due to our use of a generic scattered disk/Oort Cloudconfiguration described in Section 2.3.)
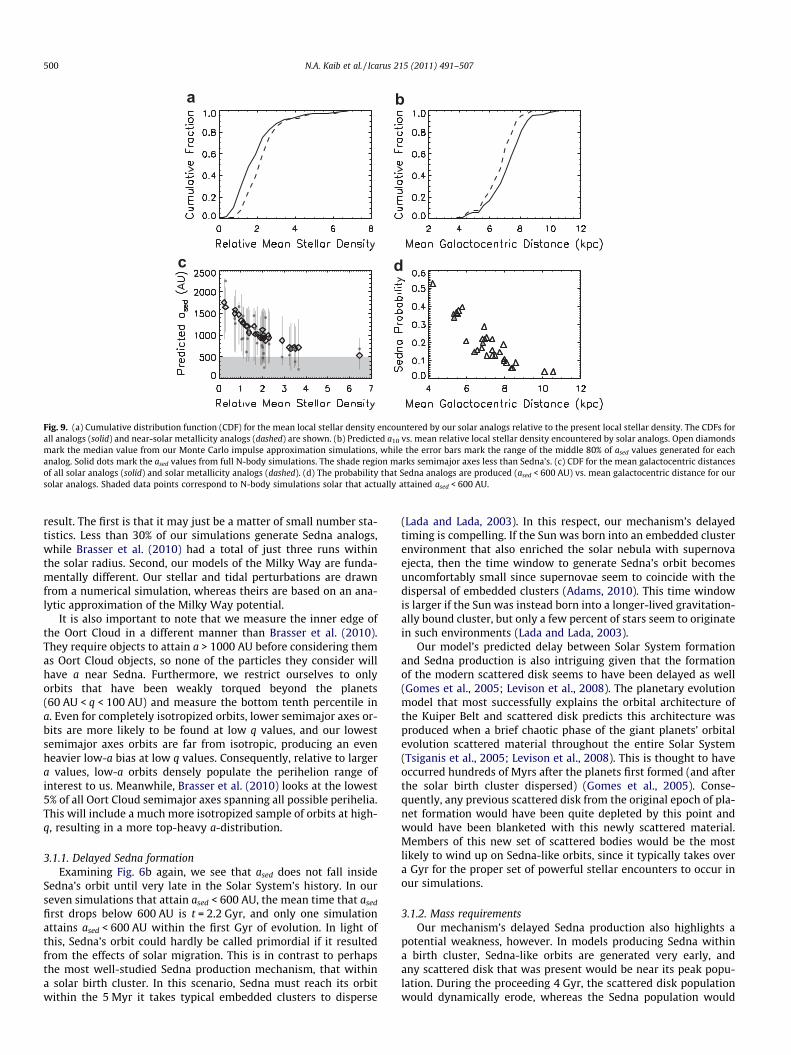
We perform 100 Monte Carlo simulations of random stellarencounters to complement each of our N-body simulations, andclassify a simulation as ‘‘Sedna-producing’’ if ased is pushed inside600 AU. If we assume the current solar neighborhood has been un-changed for 4.5 Gyr, Monte Carlo simulations for our control casesindicate that there is an �8% chance that Sedna analogs can resultfrom field star torques. Even this is a surprisingly high rate, consid-ering most previous Sedna works have discounted such a scenario.However, when we examine the mean stellar densities encoun-tered by all of our solar analogs in Fig. 9a we see that the vastmajority of solar analogs spend most of their time in regions witheven higher stellar densities than our control case. Consequently,this spread of possible inner edges is shifted to lower semimajoraxes for most solar orbital histories. As Fig. 9b shows, the medianlocation of the Oort Cloud’s inner edge gets steadily closer to Sed-na’s orbit for solar histories with higher mean stellar densities,with Sedna becoming the median case for our most extreme ana-log. As can be seen in Fig. 9d, this also translates into a tight corre-lation between the probability of Sedna production and the Sun’saverage distance from the Galactic center (since the local stellardensity is strongly dependent on this distance). Depending onthe Sun’s orbital history, this probability can range between 2and �50%! Because our simulated galaxy contains a chemicalenrichment routine (Stinson et al., 2006), we can also use the met-allicity of our solar analogs to gauge which orbital histories aremost likely. We see in Fig. 9a and c that selecting only analogs withnear solar metallicity (±0.1 dex) biases our sample toward historieswith higher stellar densities and smaller galactocentric distances.(This is due to the fact that higher metallicity stars are more likelyto form from more metal-rich gas nearer to the Galactic center.)
Our result that ased can be pushed inside a few thousand AU is incontrast to many previous Oort Cloud studies. These differences canmostly be explained by the variable nature of our galactic environ-ment. The exception to this is the work of Brasser et al. (2010),which modeled the formation of the Oort Cloud at various distancesfrom the Galactic center. In particular, they ran three simulations at2, 4, and 6 kpc from the Galactic center, and found that only bodieswith semimajor axes beyond 1000–2000 AU could be torquedbeyond the planets. There are several possible explanations for this
Fig. 8. Plot comparing the ased predicted by our Monte Carlo stellar encountersimulations vs. the ased measured in our N-body simulations using the same stellarencounter sets. The solid line marks a 1:1 agreement.
a
c d
b
Fig. 9. (a) Cumulative distribution function (CDF) for the mean local stellar density encountered by our solar analogs relative to the present local stellar density. The CDFs forall analogs (solid) and near-solar metallicity analogs (dashed) are shown. (b) Predicted a10 vs. mean relative local stellar density encountered by solar analogs. Open diamondsmark the median value from our Monte Carlo impulse approximation simulations, while the error bars mark the range of the middle 80% of ased values generated for eachanalog. Solid dots mark the ased values from full N-body simulations. The shade region marks semimajor axes less than Sedna’s. (c) CDF for the mean galactocentric distancesof all solar analogs (solid) and solar metallicity analogs (dashed). (d) The probability that Sedna analogs are produced (ased < 600 AU) vs. mean galactocentric distance for oursolar analogs. Shaded data points correspond to N-body simulations solar that actually attained ased < 600 AU.
500 N.A. Kaib et al. / Icarus 215 (2011) 491–507
result. The first is that it may just be a matter of small number sta-tistics. Less than 30% of our simulations generate Sedna analogs,while Brasser et al. (2010) had a total of just three runs withinthe solar radius. Second, our models of the Milky Way are funda-mentally different. Our stellar and tidal perturbations are drawnfrom a numerical simulation, whereas theirs are based on an ana-lytic approximation of the Milky Way potential.
It is also important to note that we measure the inner edge ofthe Oort Cloud in a different manner than Brasser et al. (2010).They require objects to attain a > 1000 AU before considering themas Oort Cloud objects, so none of the particles they consider willhave a near Sedna. Furthermore, we restrict ourselves to onlyorbits that have been weakly torqued beyond the planets(60 AU < q < 100 AU) and measure the bottom tenth percentile ina. Even for completely isotropized orbits, lower semimajor axes or-bits are more likely to be found at low q values, and our lowestsemimajor axes orbits are far from isotropic, producing an evenheavier low-a bias at low q values. Consequently, relative to largera values, low-a orbits densely populate the perihelion range ofinterest to us. Meanwhile, Brasser et al. (2010) looks at the lowest5% of all Oort Cloud semimajor axes spanning all possible perihelia.This will include a much more isotropized sample of orbits at high-q, resulting in a more top-heavy a-distribution.
3.1.1. Delayed Sedna formationExamining Fig. 6b again, we see that ased does not fall inside
Sedna’s orbit until very late in the Solar System’s history. In ourseven simulations that attain ased < 600 AU, the mean time that ased
first drops below 600 AU is t = 2.2 Gyr, and only one simulationattains ased < 600 AU within the first Gyr of evolution. In light ofthis, Sedna’s orbit could hardly be called primordial if it resultedfrom the effects of solar migration. This is in contrast to perhapsthe most well-studied Sedna production mechanism, that withina solar birth cluster. In this scenario, Sedna must reach its orbitwithin the 5 Myr it takes typical embedded clusters to disperse
(Lada and Lada, 2003). In this respect, our mechanism’s delayedtiming is compelling. If the Sun was born into an embedded clusterenvironment that also enriched the solar nebula with supernovaejecta, then the time window to generate Sedna’s orbit becomesuncomfortably small since supernovae seem to coincide with thedispersal of embedded clusters (Adams, 2010). This time windowis larger if the Sun was instead born into a longer-lived gravitation-ally bound cluster, but only a few percent of stars seem to originatein such environments (Lada and Lada, 2003).
Our model’s predicted delay between Solar System formationand Sedna production is also intriguing given that the formationof the modern scattered disk seems to have been delayed as well(Gomes et al., 2005; Levison et al., 2008). The planetary evolutionmodel that most successfully explains the orbital architecture ofthe Kuiper Belt and scattered disk predicts this architecture wasproduced when a brief chaotic phase of the giant planets’ orbitalevolution scattered material throughout the entire Solar System(Tsiganis et al., 2005; Levison et al., 2008). This is thought to haveoccurred hundreds of Myrs after the planets first formed (and afterthe solar birth cluster dispersed) (Gomes et al., 2005). Conse-quently, any previous scattered disk from the original epoch of pla-net formation would have been quite depleted by this point andwould have been blanketed with this newly scattered material.Members of this new set of scattered bodies would be the mostlikely to wind up on Sedna-like orbits, since it typically takes overa Gyr for the proper set of powerful stellar encounters to occur inour simulations.
3.1.2. Mass requirementsOur mechanism’s delayed Sedna production also highlights a
potential weakness, however. In models producing Sedna withina birth cluster, Sedna-like orbits are generated very early, andany scattered disk that was present would be near its peak popu-lation. During the proceeding 4 Gyr, the scattered disk populationwould dynamically erode, whereas the Sedna population would

Fig. 10. Total mass of the population within the ‘‘Sedna region’’ vs. ased for each oneof our planetary N-body simulations. We define the Sedna region as any orbit witha < 600 and q > 60 AU. Assuming a mass of 5 � 10�4 M� for Sedna, we convert thismass to ‘‘number of Sednas’’ on the righthand axis.
a
b
Fig. 11. (a) Plot of perihelion vs. semimajor axis for all test particles insidea < 2000 AU in Run 4. (b) Plot of inclination (relative to ecliptic) vs. semimajor axisfor all test particles inside a < 2000 AU in Run 4. The orbit of Sedna is marked with atriangle in both plots, and the orbit of 2004 VN112 is marked with a circle.
N.A. Kaib et al. / Icarus 215 (2011) 491–507 501
remain intact since it is nearly unaffected by perturbing forces.Therefore, the cluster model should predict relatively few Sedna-sized bodies in the modern scattered disk for each real Sedna. Onthe other hand, our Sedna formation takes place after the scattereddisk has already been eroded for at least hundreds of Myrs. Conse-quently, we require a much greater number of Sedna-sized bodiesin the modern scattered disk. To calculate this required number,we define a Sedna-like orbit as a < 600 AU and 60 AU < q < 100 AU,while we classify particles as scattered disk objects if they have28 AU < q < 40 AU and e > 0.25. Indeed, we find that for our sevensimulations with ased < 600 AU, there should be between 4 and�90 Sedna-sized objects in the scattered disk for every similar-sized object in a Sedna-like orbit. This is disturbing, as there arejust two known scattered disk objects that are comparable in sizeto Sedna: Eris (Brown et al., 2005) and 2007 OR10 (Schwamb et al.,2009).
Although the predictions of our model are difficult to reconcilewith current scattered disk observations, this may not be a flaw inour Sedna production mechanism, but perhaps our simplistic mod-eling of the scattered disk. The formation of the real scattered diskmost likely involved a chaotic evolution of the giant planets’ orbits(Tsiganis et al., 2005). Our simulations are somewhat crude in thisrespect, as they do not include such an evolution. In addition,recent models of the early Solar System suggest that the originaldisk of planetesimals was truncated at �30 AU (Gomes et al.,2005). By starting our particles on circular orbits between 4 and40 AU, we have most likely overpopulated the classical Kuiper Belt.Some of these particles will inevitably bolster the modern scat-tered disk population of our simulations. (We note that 60% ofour Sedna-like objects had initial orbits inside 30 AU and notbetween 30 and 40 AU, where the original population may be arti-ficially enhanced in our simulations.)
Unlike the scattered disk, we find that our mechanism’s massrequirements on the original protoplanetary disk are more reason-able. For our simulations that have ased inside 600 AU, we find thatfor each Sedna that exists today we require between 800 and30,000 Sedna-sized bodies in the original protoplanetary disk. Ifwe assume a mass of 5 � 10�4 M� for Sedna, this means that be-tween �.5 and �17 M� of Sedna-sized bodies must have been inthe original protoplanetary disk for each Sedna-like body today.Such masses could be accounted for by current models of Solar Sys-tem evolution (Gomes et al., 2005; Morbidelli et al., 2007).
3.1.3. Predicted population occupying the Sedna regionIn the previous section, we examined the mass requirements
placed on the scattered disk and protoplanetary disk by our mod-els. Conversely, if we assume a given value for the original mass ofsolids in the protoplanetary disk, we can also estimate the totalmass of objects occupying the ‘‘Sedna region’’ predicted by oursimulations. As a fiducial value for this exercise, we take our initialdisk mass to be 50 M� since this is the disk mass favored by themost recent models explaining the orbital architecture of the giantplanets and the formation of the modern scattered disk (Morbidelliet al., 2007). Assuming this disk value, the total mass in Sedna ana-logs found around each of our solar analogs is shown in Fig. 10. (Tocompute the masses in this figure, we count any object withq > 60 AU and a < 600 AU.) We see in Fig. 10 that for our solar ana-logs with ased�400–600 AU, we would expect anywhere between acouple thousandths to �0.01 M� of material occupying Sedna-likeorbits. Once again assuming a mass of Sedna of 5 � 10�4 M�, thiswould be equivalent to �3 to �20 Sedna-like bodies.
Although the total mass of Sedna analogs predicted by our mod-els is small, it is important to realize that this population is highlyanisotropic and concentrated in observable high eccentricity orbits.In Fig. 11, we display the orbits of all particles inside a < 2000 AU forone of our nominal N-body simulations, Run 4 (ased = 495 AU). We
can see that for particles with a near Sedna, the orbital distributionis far from isotropic. This contrasts with most models that produceSedna within a star cluster environment. For most cluster modelsthe orbital distribution is nearly isotropic (Fernández and Brunini,2000; Brasser et al., 2006; Kaib and Quinn, 2008). This would implythat Sedna represents the first discovered member of a vast butmostly unobservable population whose eccentricities range fullybetween 0 and 1 and whose inclinations (i) are also nearly ran-domly distributed between 0� and 180�. On the other hand, ournew mechanism is just strong enough to perturb the perihelion ofSedna beyond the reach of the planets. Consequently, our sampleof Sedna analogs has a very non-isotropic orbital distribution withinclinations strongly concentrated toward the ecliptic (see Fig. 12a).In addition, Fig. 12b shows that for nearly all of our full N-body sim-ulations, the majority of particles with a < ased have perihelia inside90 AU. Thus, we predict no vast high-q or high-i population of Sednaanalogs. Although it can be misleading to infer a population’s char-acteristics from a single known object, it is compelling that recentsearches for Sedna analogs at high ecliptic latitudes have yieldedno detections (Schwamb et al., 2010). If upcoming synoptic surveyssuch as LSST and Pan-STARRS (Ivezic et al., 2008 (arXiv/0805.2366);Kaiser et al., 2002) detect a distribution of Sedna-like bodies similarto our predictions, this would suggest that our Sun has undergone

a
b
Fig. 12. (a) Plot of median cos i for particles with a < ased and 60 AU < q < 100 AU vs.ased for each N-body simulation performed for a solar analog. (b) Plot of medianperihelion for particles with a < ased and q > 60 AU vs. ased for each N-bodysimulation. Sedna’s orbit is marked with a triangle in each plot.
502 N.A. Kaib et al. / Icarus 215 (2011) 491–507
substantial outward migration in the Milky Way. On the otherhand, the detection of retrograde Sedna-like orbits would be verydifficult to explain with our mechanism.
In addition to reproducing the orbit of Sedna well, Fig. 11 showsthat this simulation also contains particles on orbits quite similarto 2004 VN112. With a perihelion of 47 AU and semimajor axis of�350 AU, 2004 VN112 is very close to being dynamically isolatedfrom the planetary region of the solar system, much like Sednais. However, its perihelion may be low enough that it could alsopossibly be an extreme example of perihelion-lifting due to Kozaiinteractions with Neptune (Gomes et al., 2005). In our simulation,we see that there exist numerous test particles with perihelia wellbeyond q J 50 AU and with a � 350 AU. For these particles, theirperihelia could only have been lifted by steller perturbations, andthis raises the possibility that bodies like 2004 VN112 may also besignatures of the Sun’s radial migration. Because it is less isolatedfrom the planetary region, it is harder to quantify which of our runsgenerate 2004 VN112 analogs and which do not. Nevertheless, ourN-body simulations with ased [ 600 AU seem to usually populatethe 2004 VN112 region, providing qualitative evidence that ourmechanism can explain 2004 VN112 as well.
Again due to its timing, our mechanism differs from Sedna pro-duction within a birth cluster in one other way. Previous workindicates that aerodynamic drag due to the gaseous componentof the solar nebula prevents bodies with radii below �10 km fromreaching large a before embedded clusters typically disperse(Brasser et al., 2007), so this mechanism would imply an absenceof km-sized bodies with Sedna-like orbits. On the other hand, nosize discrimination would occur if Sedna’s orbit is due to the Sun’smigration within the galaxy, as the most powerful field star pas-sages almost certainly occurred after solar nebula dispersal.Although direct observation of such small objects in distant orbitsis currently impossible, such a prediction may be testable by stellaroccultation experiments.
3.1.4. Simulated galaxy vs. Milky WaySince the key ingredient of our Sedna formation mechanism is
powerful stellar encounters, we must consider how much our pow-erful stellar encounters will differ between our simulated galaxyand the real Milky Way. As noted in Table 1, our simulated galaxyhas a higher velocity dispersion and stellar density at the solarradius than the present solar neighborhood. To assess the effectsof this, we perform 400 additional Monte Carlo stellar encounter
simulations that assume a fixed stellar density of 0.04 M�/pc3
and a fixed dispersion of 42 km/s (values similar to the presentsolar neighborhood). Of these simulations, ased is pushed inside600 AU 8% of the time. Remarkably, this is the same percentageas found from the Monte Carlo simulations for our control case thatassumed a density of 0.056 M�/pc3 and a dispersion of 62 km/s.The reason for this is that although the heightened dispersionand density of our simulated galaxy cause a greater number ofencounters with the Solar System as well as a lower expected min-imum encounter distance, the increased stellar velocities decreasethe encounter timescale and make each individual encounterweaker. These two effects essentially cancel each other out. Thus,to first order it appears that the most powerful encounters fromour simulated galaxy will perturb the Solar System as much asthe most powerful encounters from the real Milky Way.
3.2. The Oort Cloud
3.2.1. Oort Cloud trapping efficiencyWe now turn our attention to the rest of the Oort Cloud formed
around each of our solar analogs. When analyzing the results of ourplanetary N-body simulations, we consider any body that attains aperihelion beyond 45 AU to be an Oort Cloud object. After 4 Gyr ofevolution, we find that the characteristics of the Oort Cloud formedaround each of our solar analogs is quite sensitive to that star’sorbital migration history. This migration causes significant changesin the population of passing stars as well as the Galactic tide. Asnoted in Roškar et al. (2008), there is a general tendency for starsto radially migrate beyond their formation radius. Consequently,many of our solar analogs experience more powerful tidal and stel-lar perturbations early in their history. Because this increases therate that perihelia can be torqued beyond the planetary region ata given semimajor axis, the number of bodies trapped in the OortCloud increases. Typically, bodies scattered by Jupiter and Saturnexperience such a rapid growth in semimajor axis that they areejected before they can be trapped in the Oort Cloud. With a short-er perihelion torquing timescale, however, a greater fraction ofthese bodies are trapped.
This effect is evident in Fig. 13, where we plot Oort Cloud trap-ping efficiency after 100 Myr as a function of the mean galactocen-tric distance for this time period (r100) for each solar analog. Wedefine the Oort Cloud trapping efficiency to be the fraction of ori-ginal particles that are located in the Oort Cloud at a given time.We see that solar analogs formed nearer to the Galactic center ini-tially trap a higher fraction of material in the Oort Cloud. Further-more, the median value of r100 (a proxy for stellar formation radius)is 6.1 kpc, indicating that most solar analogs formed inside thepresent solar orbit and experience this trapping enhancement.However, this effect is short-lived. The increased external pertur-bations will also strip the outermost orbits and enhance the ratethat Oort Cloud bodies are re-injected into the planetary regionwhere many are ejected by perturbations from Jupiter and Saturn.Thus, once the initial population of planetesimals starting nearJupiter and Saturn is exhausted, the outer regions of the Oort Cloudare eroded by the enhanced tidal field faster than they can bereplenished. Only the Oort Cloud bodies in the innermost regionof the cloud are protected from this effect. Consequently, after4 Gyr we see in Fig. 13 that all of the Oort Clouds we form havetrapping efficiencies of between 1 and 3.5% with no obvious depen-dence on the Sun’s formation radius. This supports the results ofBrasser et al. (2010) who showed that an Oort Cloud formed nearerto the Galactic center will have a higher initial trapping efficiencybut will finish with one similar to that found near the solar radius.
These results contrast with the works of Brasser et al. (2006,2008) who show that the tidal torques of an early embedded clus-ter environment can greatly enhance the Oort Cloud’s trapping
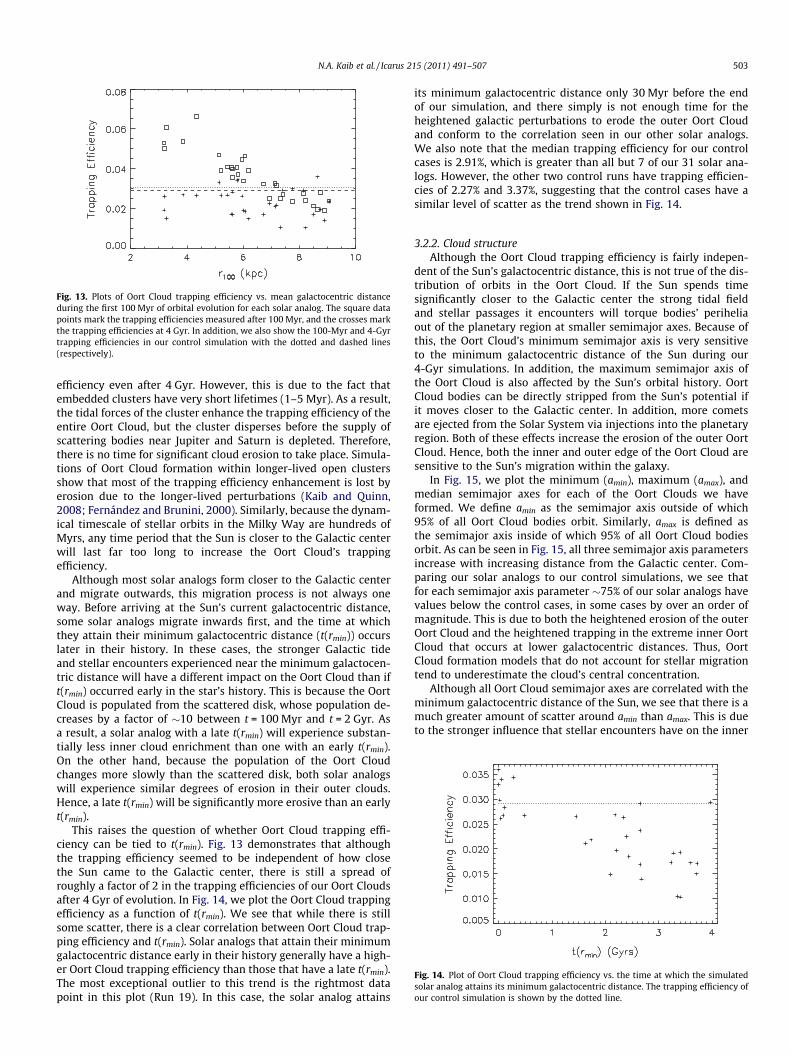
Fig. 13. Plots of Oort Cloud trapping efficiency vs. mean galactocentric distanceduring the first 100 Myr of orbital evolution for each solar analog. The square datapoints mark the trapping efficiencies measured after 100 Myr, and the crosses markthe trapping efficiencies at 4 Gyr. In addition, we also show the 100-Myr and 4-Gyrtrapping efficiencies in our control simulation with the dotted and dashed lines(respectively).
Fig. 14. Plot of Oort Cloud trapping efficiency vs. the time at which the simulatedsolar analog attains its minimum galactocentric distance. The trapping efficiency ofour control simulation is shown by the dotted line.
N.A. Kaib et al. / Icarus 215 (2011) 491–507 503
efficiency even after 4 Gyr. However, this is due to the fact thatembedded clusters have very short lifetimes (1–5 Myr). As a result,the tidal forces of the cluster enhance the trapping efficiency of theentire Oort Cloud, but the cluster disperses before the supply ofscattering bodies near Jupiter and Saturn is depleted. Therefore,there is no time for significant cloud erosion to take place. Simula-tions of Oort Cloud formation within longer-lived open clustersshow that most of the trapping efficiency enhancement is lost byerosion due to the longer-lived perturbations (Kaib and Quinn,2008; Fernández and Brunini, 2000). Similarly, because the dynam-ical timescale of stellar orbits in the Milky Way are hundreds ofMyrs, any time period that the Sun is closer to the Galactic centerwill last far too long to increase the Oort Cloud’s trappingefficiency.
Although most solar analogs form closer to the Galactic centerand migrate outwards, this migration process is not always oneway. Before arriving at the Sun’s current galactocentric distance,some solar analogs migrate inwards first, and the time at whichthey attain their minimum galactocentric distance (t(rmin)) occurslater in their history. In these cases, the stronger Galactic tideand stellar encounters experienced near the minimum galactocen-tric distance will have a different impact on the Oort Cloud than ift(rmin) occurred early in the star’s history. This is because the OortCloud is populated from the scattered disk, whose population de-creases by a factor of �10 between t = 100 Myr and t = 2 Gyr. Asa result, a solar analog with a late t(rmin) will experience substan-tially less inner cloud enrichment than one with an early t(rmin).On the other hand, because the population of the Oort Cloudchanges more slowly than the scattered disk, both solar analogswill experience similar degrees of erosion in their outer clouds.Hence, a late t(rmin) will be significantly more erosive than an earlyt(rmin).
This raises the question of whether Oort Cloud trapping effi-ciency can be tied to t(rmin). Fig. 13 demonstrates that althoughthe trapping efficiency seemed to be independent of how closethe Sun came to the Galactic center, there is still a spread ofroughly a factor of 2 in the trapping efficiencies of our Oort Cloudsafter 4 Gyr of evolution. In Fig. 14, we plot the Oort Cloud trappingefficiency as a function of t(rmin). We see that while there is stillsome scatter, there is a clear correlation between Oort Cloud trap-ping efficiency and t(rmin). Solar analogs that attain their minimumgalactocentric distance early in their history generally have a high-er Oort Cloud trapping efficiency than those that have a late t(rmin).The most exceptional outlier to this trend is the rightmost datapoint in this plot (Run 19). In this case, the solar analog attains
its minimum galactocentric distance only 30 Myr before the endof our simulation, and there simply is not enough time for theheightened galactic perturbations to erode the outer Oort Cloudand conform to the correlation seen in our other solar analogs.We also note that the median trapping efficiency for our controlcases is 2.91%, which is greater than all but 7 of our 31 solar ana-logs. However, the other two control runs have trapping efficien-cies of 2.27% and 3.37%, suggesting that the control cases have asimilar level of scatter as the trend shown in Fig. 14.
3.2.2. Cloud structureAlthough the Oort Cloud trapping efficiency is fairly indepen-
dent of the Sun’s galactocentric distance, this is not true of the dis-tribution of orbits in the Oort Cloud. If the Sun spends timesignificantly closer to the Galactic center the strong tidal fieldand stellar passages it encounters will torque bodies’ periheliaout of the planetary region at smaller semimajor axes. Because ofthis, the Oort Cloud’s minimum semimajor axis is very sensitiveto the minimum galactocentric distance of the Sun during our4-Gyr simulations. In addition, the maximum semimajor axis ofthe Oort Cloud is also affected by the Sun’s orbital history. OortCloud bodies can be directly stripped from the Sun’s potential ifit moves closer to the Galactic center. In addition, more cometsare ejected from the Solar System via injections into the planetaryregion. Both of these effects increase the erosion of the outer OortCloud. Hence, both the inner and outer edge of the Oort Cloud aresensitive to the Sun’s migration within the galaxy.
In Fig. 15, we plot the minimum (amin), maximum (amax), andmedian semimajor axes for each of the Oort Clouds we haveformed. We define amin as the semimajor axis outside of which95% of all Oort Cloud bodies orbit. Similarly, amax is defined asthe semimajor axis inside of which 95% of all Oort Cloud bodiesorbit. As can be seen in Fig. 15, all three semimajor axis parametersincrease with increasing distance from the Galactic center. Com-paring our solar analogs to our control simulations, we see thatfor each semimajor axis parameter �75% of our solar analogs havevalues below the control cases, in some cases by over an order ofmagnitude. This is due to both the heightened erosion of the outerOort Cloud and the heightened trapping in the extreme inner OortCloud that occurs at lower galactocentric distances. Thus, OortCloud formation models that do not account for stellar migrationtend to underestimate the cloud’s central concentration.
Although all Oort Cloud semimajor axes are correlated with theminimum galactocentric distance of the Sun, we see that there is amuch greater amount of scatter around amin than amax. This is dueto the stronger influence that stellar encounters have on the inner

Fig. 15. Plot of amin (diamonds), amax (squares), and median semimajor axis (crosses)vs. the minimum galactocentric distance for each of our solar analogs. In addition,we show amin (dashed line), amax (dotted line) and the median a (dash-dot-dash line)for our control simulation.
a
b
Fig. 16. (a) Plot of the mean cosine of the orbital inclination (relative to ecliptic) fortwo Oort Cloud simulations: the control simulation (dotted line) and Run 31 (blackline). The mean cosine is calculated by taking a moving average for the nearest 5% ofthe Oort Cloud at a given semimajor axis. The dotted line marks a mean cosine of0.2, below which we consider the Oort Cloud to be isotropic. (b) Plot of the ratio ofthe isotropization semimajor axis to the minimum semimajor axis of our OortClouds as a function of the minimum galactocentric distance attained by each solar
504 N.A. Kaib et al. / Icarus 215 (2011) 491–507
Oort Cloud’s structure compared to the outer cloud, because thesmallest semimajor axis orbits become trapped in the Oort Clouddue to the most powerful stellar encounters and not as a resultof the Galactic tide. Consequently, amin is influenced by a handfulof isolated events, so there is a large amount of stochasticity in thisparameter. In contrast, scattered bodies can reach the outer cloudduring any time period, regardless of stellar encounters. Due tothese differing effects, amin can vary by over an order of magnitude(between 200 and 7000 AU), while amax varies by less than a halfdecade between 30,000 AU and 105 AU.
analog. The dotted line marks this semimajor axis ratio for our control simulation.
3.2.3. Cloud isotropyAnother prediction of previous simulations of Oort Cloud forma-
tion (Dones et al., 2004; Duncan et al., 1987) is that the isotropy ofOort Cloud orbits should vary with semimajor axis. Because theKozai tidal cycle (Heisler and Tremaine, 1986) is longer than theage of the Solar System at semimajor axes below �5000 AU andonly a small fraction of stellar encounters strongly perturb suchorbits, the innermost region of the Oort Cloud should have adistribution of orbital inclinations (relative to the ecliptic) stillconcentrated toward the ecliptic. Indeed, when we look at thedistribution of orbital inclinations as a function of semimajor axisfor our control simulation in Fig. 16a, we see that only beyonda > 9000 AU is the mean cosine of inclination near 0 (which indi-cates isotropy). However, we also plot the inclination distributionfor Run 31 in Fig. 16a. As can be seen in this plot, the region ofisotropic inclinations extends much deeper into the Oort Cloudthan in our control run. This is of course because when the effectsof stellar migration are included, the strength of the local tidal fieldis not static and, in the case of Run 31, is larger than our control sim-ulation for much of the history of the solar analog. In addition, thenumerical tidal field we measure in our simulated galaxy is notalways as well-behaved as the analytical tides used in most previ-ous works (see Section 2). This element of stochasticity will alsotend to increase the level of isotropy in the Oort Cloud.
In Fig. 16b, we plot the ratio of aiso to amin vs. the minimumgalactocentric distance for each solar analog. In addition, we alsomark the median ratio for our control simulations, which at 2.31is lower than any of our solar analogs. For comparison, the vastmajority of our simulations that include stellar migration haveratios that range from 2.5 to 6, with a few larger than 15. Presum-ably, this is due to the fact once again that the strength of externalperturbations vary much more in our simulations with stellarmigration. As a result, when the Sun is close to the Galactic centerthe stronger perturbing forces torque the perihelia of small orbits
out of the planetary region and lower amin. However, the timescaleto isotropize a distribution of inclinations is much longer than thetimescale to shift a perihelion by tens of AU, so aiso is not decreasedas much during these relatively short-lived excursions to lowgalactocentric distances. In addition, the solar analogs with extre-mely high values of aiso/amin represent cases that experiencedexceptionally strong stellar encounters for the mean density ofmatter they encountered during their 4-Gyr history. In these cases,this powerful stellar encounter torqued orbits into the Oort Cloudvery deep in the scattered disk, but this perturbation was far tooshort to substantially affect the isotropy of the entire cloud.
Although we have taken amin to represent the inner edge of theOort Cloud for each of our solar analogs in the previous analyses, itis important to keep in mind that 5% of our Oort Cloud bodies stillorbit inside this value. It is typically in this inner 5% where we findthe Sedna analogs that we discussed previously.
3.2.4. Oort Cloud erosionIn the preceding sections, we have shown that solar analogs
that spend time closer to the Galactic center will have more com-pact Oort Clouds than predicted by models that do not account forstellar migration. On the other hand, the total amount of materialthat is trapped in the Oort Cloud does not increase if the Sunspends time at smaller galactocentric distances. Because there isno enhancement in trapping efficiency, this means that the fractionof Oort Cloud bodies orbiting in the outer Oort Cloud(a > 20,000 AU) will be smaller for solar analogs that spend anappreciable amount of time at small galactocentric distances.
To demonstrate this, for each of our solar analogs we look at thepopulation ratio of bodies orbiting between 5000 AU < a < 20,000 AU to bodies orbiting beyond 20,000 AU. (For the purposes ofthe following discussion, we are only interested in bodies capableof evolving to observable comets, so we only consider bodies

N.A. Kaib et al. / Icarus 215 (2011) 491–507 505
beyond a = 5000 AU (Kaib and Quinn, 2009).) This ratio is plotted inFig. 17. We see that this ratio varies by nearly an order of magni-tude depending on the Sun’s orbital history and has a median valueof 1.80, indicating that most comets typically orbit insidea = 20,000 AU for our solar analogs. For comparison, our controlsimulations predict a more evenly split distribution of comets witha median value of 1.19. Looking again at Fig. 15, we see that theinner edge of the Oort Cloud is inside a = 5000 AU for all but twoof our solar analogs. Therefore, we can conclude that the trend inFig. 17 is due to the enhanced erosion of the outer Oort Cloudrather than the populating of low semimajor axes orbits.
This presents additional difficulties for traditional models ofOort Cloud formation and comet delivery. It is well-documentedthat the mass of the outer Oort Cloud implied by the observedlong-period comet (LPC) flux near Earth seems to be at odds withother aspects of Solar System formation (Dones et al., 2004). Ifthe outer Oort Cloud is the source of all LPCs there must be at least�4 � 1011 comet-sized bodies orbiting in the outer Oort Cloud toproduce the observed flux (Francis, 2005). Assuming a typicalcomet mass to be �4 � 1016 g (Weissman, 1996), we find thatthere should be roughly 2–3 M� of material in the outer OortCloud. Our current control simulations as well as similar simula-tions in previous works (Kaib and Quinn, 2008; Dones et al.,2004) indicate that only 1–3% of all bodies scattered by the giantplanets are trapped in the present day outer Oort Cloud. Thus, tobuild the outer Oort Cloud seems to require an original disk ofplanetesimals with a mass of 70–300 M�. In contrast, a disk of nomore than about 50 M� is favored by models attempting to explainthe orbital evolution of the giant planets and trans-Neptunianobjects (Morbidelli et al., 2007). This mass discrepancy typicallybecomes even worse when the enhanced erosion due to solarmigration is included.
Two possible solutions have recently emerged for this dilemma.First, it has been shown that the outer Oort Cloud may not be theonly or even the dominant source of observable LPCs (Kaib andQuinn, 2009). Integrations of particles with semimajor axesbetween 5000 and 20,000 AU indicate that they too can evolve tobecome LPCs via a dynamical pathway that is only moderately lessefficient than outer Oort Cloud comet production. Aside fromexpanding the semimajor axis range of comet production, thismay also help solve this mass discrepancy because the trappingefficiency of the inner Oort Cloud can be an order of magnitude lar-ger than that of the outer cloud if Oort Cloud formation beganwithin the solar birth cluster (Brasser et al., 2006; Kaib and Quinn,2008). Thus, the required protoplanetary disk mass to account fortoday’s comet flux could be lower by a factor of 5–10 than if we
Fig. 17. (a) Plot of the ratio of Oort Cloud bodies with 5000 AU < a < 20,000 AU (Nin)to bodies with a > 20,000 AU (Nout) vs. the mean galactocentric distance for eachsolar analog. The dashed line is the median fraction for our three control runs.
only considered the outer Oort Cloud as an LPC source. (In orderto isolate the effects of stellar migration, we have no simulationsthat include the effects of a birth cluster.)
A second possible mechanism to ease the mass requirements ofthe protoplanetary disk was recently proposed in Levison et al.(2010). In this scenario, the Oort Cloud is not primarily comprisedof material native to the Solar System. Instead, as the solar birthcluster dissolves, small bodies that were ejected from the planetarysystems of other cluster members are captured into the Sun’spotential well. If the Oort Cloud formed by this mechanism, nearlyall of the material in the cloud was deposited when the solar birthcluster dispersed, which was likely no more than a few Myr afterthe Sun formed. A second advantage of this model is that it is capa-ble of producing a ratio of scattered disk to Oort Cloud bodies thatis more consistent with that observed in the actual Solar System(Dones et al., 2004; Duncan and Levison, 1997). However, for thisformation mechanism to work, a significant fraction of the bodiesin the Oort Cloud must be able to survive for the 4.5 Gyr leadingup to the present epoch.
To determine whether a captured Oort Cloud can survive for4.5 Gyr, we examine the fates of all particles that were added toour solar analogs’ clouds within the first Gyr of our simulation.As these particles evolve for the next 3 Gyr, we calculate floss, thefraction of these bodies eroded per Gyr during this time period.Assuming that all of these particles were instead added to the OortCloud at t = 0, we can predict the fraction that will remain after4.5 Gyr of evolution with
fremain ¼ ð1� flossÞ4:5 ð1Þ
For each of our solar analogs, we calculate both the erosion rate andthe predicted remaining fraction as a function of particles’ initialOort Cloud semimajor axis. These results are displayed in Fig. 18.We see that for the median case of our solar analogs, any Oort Cloudpopulation captured beyond a � 20,000 AU will be eroded by overan order of magnitude after 4.5 Gyr of evolution, negating muchof the population gains offered by the capture model in this a-range.However, the situation improves inside 20,000 AU. In this semima-jor axis range, between 20% and 50% of the population will survivefor 4.5 Gyr for our median case. However, these captured bodiesmust be able to explain today’s LPC flux, so they must be capturedon semimajor axes beyond �5000 AU (Kaib and Quinn, 2009). Thus,it seems that non-native comets must be captured on orbits with
Fig. 18. Plot of the fraction of the Oort Cloud population eroded per Gyr as afunction of the initial semimajor axes that particles have when they enter the OortCloud. Semimajor axes bins are 0.2 dex wide in loga-space. Dots mark the medianerosion value in each bin, while the error bars mark the range between the lowest10% of erosion rates and the highest 10% of erosion rates. Diamonds mark themedian erosion rates for our control runs. The righthand y-axis marks the projectedpopulation fraction that will remain if one assumes the erosion rates of the lefthandy-axis.

506 N.A. Kaib et al. / Icarus 215 (2011) 491–507
initial semimajor axes between �5000 AU and �20,000 AU in orderfor a large fraction to survive and account for today’s observed LPCs.
4. Conclusions
In a simulation of a Milky Way analog, we have isolated stars atthe end of the simulation with solar-like ages, galactic positions,and kinematics. We find that the galactocentric distances of mostof these stars has varied dramatically during their histories, andthere appear to be many different orbital histories possible forstars like the Sun. On the whole, however, our simulation indicatesthat it is possible that the Sun formed at least 2 kpc closer to theGalactic center than where it currently resides. A large fraction ofthe solar analogs in our simulation spent at least a few hundredMyr orbiting within 5 kpc or less of the Galactic center. Past orbitsthat take the Sun within 2.5 kpc of the Galactic center are evenpossible. Because the Sun would have encountered much higherdisk densities at these small galactocentric distances, the stellarencounters and galactic tides that sculpt the structure of the OortCloud would likely have been stronger in the past.
This has important consequences for our understanding of theorbit of Sedna. This object in unaffected by the current Galactictide, and therefore it has been assumed that it cannot belong tothe conventional Oort Cloud. Our work shows that this may notbe the case. Contrary to previous understanding, the minimumsemimajor axis of orbits whose perihelia can be torqued beyondthe planets is very dependent on the few most powerful field stel-lar passages, which are stochastic events. In addition, we show thatit is quite possible that the Sun spent much of its history residing indenser regions of the Milky Way, enhancing the chance for a ‘‘Sed-na-perturbing’’ stellar encounter. The combination of these twofindings suggests that Sedna may in fact represent the extremeinner edge of the conventional Oort Cloud and may be a result ofthe Sun’s migration within the Milky Way. Out of all of the solaranalogs we study, �20–30% generated Sedna analogs. While Sednais not the median case, our mechanism is certainly a plausibleexplanation for this object’s orbit.
Most previous Oort Cloud simulations do not consider changesin the Galactic tide or the population of passing field stars, and wefind that changes induced by the Sun’s orbital history can have sig-nificant effects on the formation of the entire Oort Cloud. When theSun encounters stronger tidal and stellar perturbations the rate ofperihelion change for orbits of any semimajor axis will increase.Consequently, smaller semimajor axis orbits will be torqued outof the planetary region and into the Oort Cloud. In addition, distantOort Cloud bodies will be stripped or cycled back into the planetaryregion (and subsequently ejected) at a faster rate when the Sun hasa small galactocentric distance. Both of these effects cause the min-imum and median orbital semimajor axis in the whole Oort Cloudto vary about an order of magnitude depending on the Sun’s orbitalhistory. In general, an Oort Cloud formation model that assumes aconstant Galactic tide overestimates the semimajor axes of OortCloud orbits compared to most models that include solar orbitalmigration throughout the galaxy.
While the orbital structure of the Oort Cloud is sensitive to theSun’s past minimum galactocentric distance, we find that the frac-tion of scattered bodies that become trapped in the cloud is notcorrelated well with this parameter and range between 1.0% and3.5% . This is because the timing of the Sun’s period of lowest galac-tocentric distance determines whether the stronger galactic per-turbations will have an erosive or an enriching effect on the OortCloud. As stated already, a stronger tidal force will increase the effi-ciency at which smaller semimajor axis orbits are transferred fromthe scattered disk to the Oort Cloud. However, the population ofthe scattered disk decreases throughout the history of the Solar
System, and if the scattered disk is largely depleted, a period ofstronger perturbations will do little to enrich the Oort Cloud. Onthe other hand, there will always be an increased erosion of theouter Oort Cloud. For this reason, stars that reach their minimumgalactocentric distances late in their histories tend to have thesmallest Oort Cloud populations.
The increased cloud erosion experienced by most solar analogsalso has implications for the source of observed long-period com-ets. Historically, the outer Oort Cloud has been considered thesource of LPCs. However, only a small fraction of bodies scatteredby the giant planets are trapped in the outer Oort Cloud, and anuncomfortably massive protoplanetary disk is required to forman outer Oort Cloud capable of generating current LPCs. We showthat solar migration within the Milky Way typically enhances theouter Oort Cloud’s erosion, worsening this mass discrepancy. Onthe other hand, the inner Oort Cloud is a more protected reservoir,strengthening the case that it may actually supply a significantfraction of observed LPCs (Kaib and Quinn, 2009; Dybczynski andKrólikowska, 2011).
Lastly, this heightened erosion also has implications for alterna-tive models of Oort Cloud formation. Recently, it has been arguedthat the population of the Oort Cloud has been greatly bolsteredby the capture of non-native bodies early in the Solar System’s his-tory (Levison et al., 2010). However, these bodies must be able tosurvive for 4.5 Gyr to explain the modern LPC flux. We find thatthis captured population will typically be eroded by at least an or-der of magnitude beyond a � 20,000 AU. Thus, bodies capturedinto inner Oort Cloud orbits (a < 20,000 AU) show the most prom-ise of accounting for the Oort Cloud’s large population.
Acknowledgments
We would like to thank the two anonymous referees whose com-ments and suggestions greatly improved the quality of this paper.This work was funded by a NASA Earth and Space Science Fellow-ship, a CITA National Fellowship, the National Science Foundation(Grant AST-0709191) and NSERC. The bulk of our computing wasperformed using Teragrid resources at Purdue University managedwith Condor scheduling software (http://www.cs.wisc.edu/condor).We also thank Martin Duncan and Mark Claire for helpfuldiscussions.
References
Adams, F.C., 2010. The birth environment of the Solar System. Annu. Rev. Astron.Astrophys. 48, 47–85.
Binney, J., 2007. Dynamics of disks. In: de Jong, R.-S. (Ed.), Island Universes –Structure and Evolution of Disk Galaxies, Springer, pp. 67–76.
Brasser, R., Duncan, M.J., Levison, H.F., 2006. Embedded star clusters and theformation of the Oort Cloud. Icarus 184, 59–82.
Brasser, R., Duncan, M.J., Levison, H.F., 2007. Embedded star clusters and theformation of the Oort Cloud. II. The effect of the primordial solar nebula. Icarus191, 413–433.
Brasser, R., Duncan, M.J., Levison, H.F., 2008. Embedded star clusters and theformation of the Oort Cloud. III. Evolution of the inner cloud during the Galacticphase. Icarus 196, 274–284.
Brasser, R., Higuchi, A., Kaib, N., 2010. Oort Cloud formation at various Galacticdistances. Astron. Astrophys. 516, A72–A83.
Brown, M.E., Trujillo, C., Rabinowitz, D., 2004. Discovery of a candidate inner OortCloud planetoid. Astrophys. J. 617, 645–649.
Brown, M.E., Trujillo, C.A., Rabinowitz, D.L., 2005. Discovery of a planetary-sizedobject in the scattered Kuiper Belt. Astrophys. J. 635, L97–L100.
Collins, B.F., Sari, R., 2010. A unified theory for the effects of stellar perturbationsand Galactic tides on Oort Cloud comets. Astron. J. 140, 1306–1312.
Dones, L., Weissman, P.R., Levison, H.F., Duncan, M.J., 2004. Oort Cloud formationand dynamics. Comets II, 153–174.
Duncan, M.J., Levison, H.F., 1997. A scattered comet disk and the origin of Jupiterfamily comets. Science 276, 1670–1672.
Duncan, M., Quinn, T., Tremaine, S., 1987. The formation and extent of the SolarSystem comet cloud. Astron. J. 94, 1330–1338.
Dybczynski, P.A., Królikowska, M., 2011. Where do long-period comets come from?Moving through Jupiter–Saturn barrier. ArXiv e-prints.

N.A. Kaib et al. / Icarus 215 (2011) 491–507 507
Fernandez, J.A., 1997. The formation of the Oort Cloud and the primitive galacticenvironment. Icarus 129, 106–119.
Fernández, J.A., Brunini, A., 2000. The buildup of a tightly bound comet cloud aroundan early Sun immersed in a dense Galactic environment: Numericalexperiments. Icarus 145, 580–590.
Fouchard, M., Froeschlé, C., Rickman, H., Valsecchi, G.B., 2011. The key role ofmassive stars in Oort Cloud comet dynamics. Icarus 214, 334–347.
Francis, P.J., 2005. The demographics of long-period comets. Astrophys. J. 635,1348–1361.
Garcıa-Sánchez, J. et al., 2001. Stellar encounters with the Solar System. Astron.Astrophys. 379, 634–659.
Gladman, B., Chan, C., 2006. Production of the extended scattered disk by rogueplanets. Astrophys. J. 643, L135–L138.
Gomes, R., Levison, H.F., Tsiganis, K., Morbidelli, A., 2005. Origin of the cataclysmicLate Heavy Bombardment period of the terrestrial planets. Nature 435, 466–469.
Gomes, R.S., Gallardo, T., Fernández, J.A., Brunini, A., 2005. On the origin of the high-perihelion scattered disk: The role of the Kozai mechanism and mean motionresonances. Celest. Mech. Dyn. Astron. 91, 109–129.
Haywood, M., 2008. Radial mixing and the transition between the thick and thinGalactic discs. Mon. Not. R. Astron. Soc. 388, 1175–1184.
Heisler, J., Tremaine, S., 1986. The influence of the galactic tidal field on the Oortcomet cloud. Icarus 65, 13–26.
Heisler, J., Tremaine, S., Alcock, C., 1987. The frequency and intensity of cometshowers from the Oort Cloud. Icarus 70, 269–288.
Holmberg, J., Flynn, C., 2000. The local density of matter mapped by Hipparcos.Mon. Not. R. Astron. Soc. 313, 209–216.
Holmberg, J., Nordström, B., Andersen, J., 2009. The Geneva-Copenhagen survey ofthe solar neighbourhood. III. Improved distances, ages, and kinematics. Astron.Astrophys. 501, 941–947.
Hou, L.G., Han, J.L., Shi, W.B., 2009. The spiral structure of our Milky Way Galaxy.Astron. Astrophys. 499, 473–482.
Juric, M. et al., 2008. The Milky Way tomography with SDSS. I. Stellar numberdensity distribution. Astrophys. J. 673, 864–914.
Just, A., Jahreiß, H., 2010. Towards a fully consistent Milky Way disc model – I. Thelocal model based on kinematic and photometric data. Mon. Not. R. Astron. Soc.402, 461–478.
Kaib, N.A., Quinn, T., 2008. The formation of the Oort Cloud in open clusterenvironments. Icarus 197, 221–238.
Kaib, N.A., Quinn, T., 2009. Reassessing the source of long-period comets. Science325, 1234–1236.
Kaib, N.A., Quinn, T., Brasser, R., 2011. Decreasing computing time with symplecticcorrectors in adaptive timestepping routines. Astron. J. 141, 3–9.
Kaiser, N. et al., 2002. Pan-STARRS: A large synoptic survey telescope array. In:Tyson, J.A., Wolff, S. (Eds.), Survey and Other Telescope Technologies andDiscoveries. Proceedings of the SPIE, vol. 4836, pp. 154–164.
Kenyon, S.J., Bromley, B.C., 2004. Stellar encounters as the origin of distant SolarSystem objects in highly eccentric orbits. Nature 432, 598–602.
Lada, C.J., Lada, E.A., 2003. Embedded clusters in molecular clouds. Annu. Rev.Astron. Astrophys. 41, 57–115.
Levison, H.F., Duncan, M.J., 1997. From the Kuiper Belt to Jupiter-family comets: Thespatial distribution of ecliptic comets. Icarus 127, 13–32.
Levison, H.F., Dones, L., Duncan, M.J., 2001. The origin of Halley-type comets:Probing the inner oort cloud. Astron. J. 121, 2253–2267.
Levison, H.F., Morbidelli, A., Vanlaerhoven, C., Gomes, R., Tsiganis, K., 2008. Origin ofthe structure of the Kuiper Belt during a dynamical instability in the orbits ofUranus and Neptune. Icarus 196, 258–273.
Levison, H.F., Duncan, M.J., Brasser, R., Kaufmann, D.E., 2010. Capture of the Sun’sOort Cloud from stars in its birth cluster. Science 329, 187–190.
Loebman, S.R., Roškar, R., Debattista, V.P., Ivezic, Z., Quinn, T.R., Wadsley, J., 2011. Thegenesis of the Milky Way’s thick disk via stellar migration. Astrophys. J. 737,8–24.
Matese, J.J., Whitman, P.G., Innanen, K.A., Valtonen, M.J., 1995. Periodic modulationof the Oort Cloud comet flux by the adiabatically changing galactic tide. Icarus116, 255–268.
Matese, J.J., Whitmire, D.P., Lissauer, J.J., 2005. A widebinary solar companion as apossible origin of Sedna-like objects. Earth Moon Planets 97, 459–470.
McMillan, P.J., Binney, J.J., 2010. The uncertainty in Galactic parameters. Mon. Not.R. Astron. Soc. 402, 934–940.
Morbidelli, A., Levison, H.F., 2004. Scenarios for the origin of the orbits of the trans-neptunian objects 2000 CR105 and 2003 VB12 (Sedna). Astron. J. 128, 2564–2576.
Morbidelli, A., Tsiganis, K., Crida, A., Levison, H.F., Gomes, R., 2007. Dynamics of thegiant planets of the Solar System in the gaseous protoplanetary disk and theirrelationship to the current orbital architecture. Astron. J. 134, 1790–1798.
Morris, D.E., Muller, R.A., 1986. Tidal gravitational forces – The infall of ‘new’ cometsand comet showers. Icarus 65, 1–12.
Navarro, J.F., Frenk, C.S., White, S.D.M., 1997. A universal density profile fromhierarchical clustering. Astrophys. J. 490, 493–508.
Nordström, B. et al., 2004. The Geneva-Copenhagen survey of the Solarneighbourhood. Ages, metallicities, and kinematic properties of �14000 F andG dwarfs. Astron. Astrophys. 418, 989–1019.
Oort, J.H., 1950. The structure of the cloud of comets surrounding the Solar Systemand a hypothesis concerning its origin. Bull. Astron. Inst. Netherlands 11, 91–110.
Reid, M.J. et al., 2009. Trigonometric parallaxes of massive star-forming regions. VI.Galactic structure, fundamental parameters, and noncircular motions.Astrophys. J. 700, 137–148.
Rickman, H., 1976. Stellar perturbations of orbits of long-period comets and theirsignificance for cometary capture. Bull. Astron. Inst. Czechoslovakia 27,92–105.
Rickman, H., Fouchard, M., Froeschlé, C., Valsecchi, G.B., 2008. Injection of OortCloud comets: The fundamental role of stellar perturbations. Celest. Mech. Dyn.Astron. 102, 111–132.
Rix, H., Zaritsky, D., 1995. Nonaxisymmetric structures in the stellar disks ofgalaxies. Astrophys. J. 447, 82–102.
Roškar, R., Debattista, V.P., Quinn, T.R., Stinson, G.S., Wadsley, J., 2008. Riding thespiral waves: Implications of stellar migration for the properties of galacticdisks. Astrophys. J. 684, L79–L82.
Schönrich, R., Binney, J., 2009. Chemical evolution with radial mixing. Mon. Not. R.Astron. Soc. 396, 203–222.
Schwamb, M.E., Brown, M.E., Rabinowitz, D.L., 2009. A search for distant SolarSystem bodies in the region of Sedna. Astrophys. J. 694, L45–L48.
Schwamb, M.E., Brown, M.E., Rabinowitz, D.L., Ragozzine, D., 2010. Properties of thedistant Kuiper Belt: Results from the Palomar Distant Solar System Survey.Astrophys. J. 720, 1691–1707.
Sellwood, J.A., Binney, J.J., 2002. Radial mixing in galactic discs. Mon. Not. R. Astron.Soc. 336, 785–796.
Stadel, J.G., 2001. Cosmological N-body Simulations and their Analysis. Ph.D. Thesis,AA (University of Washington).
Stinson, G., Seth, A., Katz, N., Wadsley, J., Governato, F., Quinn, T., 2006. Starformation and feedback in smoothed particle hydrodynamic simulations – I.Isolated galaxies. Mon. Not. R. Astron. Soc. 373, 1074–1090.
Tremaine, S., 1993. The distribution of comets around stars. In: Phillips, J.A.,Thorsett, S.E., Kulkarni, S.R. (Eds.), Planets Around Pulsars, Astronomical Societyof the Pacific Conference Series, vol. 36, pp. 335–344.
Tsiganis, K., Gomes, R., Morbidelli, A., Levison, H.F., 2005. Origin of the orbitalarchitecture of the giant planets of the Solar System. Nature 435, 459–461.
Wadsley, J.W., Stadel, J., Quinn, T., 2004. Gasoline: A flexible, parallelimplementation of TreeSPH. New Astron. 9, 137–158.
Weissman, P.R., 1996. The Oort Cloud. In: Rettig, T., Hahn, J.M. (Eds.), Completingthe Inventory of the Solar System. Astronomical Society of the PacificConference Series, vol. 107, pp. 265–288.
Wiegert, P., Tremaine, S., 1999. The evolution of long-period comets. Icarus 137, 84–121.
Wielen, R., Fuchs, B., Dettbarn, C., 1996. On the birth-place of the Sun and the placesof formation of other nearby stars. Astron. Astrophys. 314, 438–447.
Wisdom, J., 2006. Symplectic correctors for canonical heliocentric N-body maps.Astron. J. 131, 2294–2298.


![Catalog - Sedna 2011 [Ro]](https://img.dokumen.tips/doc/110x75/55721414497959fc0b93b7f2/catalog-sedna-2011-ro-55cd80fe3982c.jpg)