Embed Size (px)
Citation preview
Security Information And Event Management (SIEM) Market - Outlook (2015-19)
[email protected]+1-408-469-4380
+91-80-6134-1500www.researchfox.com
1

ResearchFox Consulting is an Indian market research and consulting firm based in Bangalore. We strive to provide our clients with research data and reports which they can trust and analyze. Insights gleaned from our detailed and comprehensive research reports helps our clients stay ahead of trends. ResearchFox serves clients with services from data collection to analysis and reports. ResearchFox has extensive sector expertise and its consultants are abreast of global trends and issues across industries. Our areas of expertise include Manufacturing, IT, FMCG, Healthcare, Automotive, Government Sector and NGO, BFSI and Retail.
Disclaimer :This report is furnished to the recipient for information
purposes only. Each recipient should conduct their own
investigation and analysis of any such information
contained in this report. No recipient is entitled to rely on
the work of ResearchFox Consulting Pvt.Ltd. contained in
this report for any purpose. ResearchFox Consulting Pvt.
Ltd. makes no representations or warranties regarding the
accuracy or completeness of such information and
expressly disclaims any and all liabilities based on such
information or on omissions therefrom. The recipient must
not reproduce, disclose or distribute the information
contained herein without the express prior written consent
of ResearchFox Consulting Pvt.Ltd.
Copyright © 2015. ResearchFox Consulting Private Limited
2

Tableof Contents
5. Market Segmentation5.1 . Region
North America Europe APAC South America ROW
5.2 . End User Enterprise Mid Size Small Business
5.3 . Deployment Cloud On-Premise Hybrid
5.4 . Industry Financial Services IT & Telecommunication Government Retail Healthcare Education Others
6. List of Tables7. List of Charts
1. Introduction1.1. Report Description1.2. Objective1.3. Scope of the Research1.4. Regions Covered1.5. Key Takeaways1.6. Key Stakeholders1.7. Key Terminologies1.8. List of Abbreviations
2. Executive Summary2.1. Executive Overview
3. Research and Forecasting3.1. Research Methodology3.2. Forecasting Methodology
4. Industry Landscape4.1. Market Size and Growth4.2. Competitive Landscape4.3. Market Share4.4. Company Classification4.5. Region Outlook4.6. Market Metrics4.7. Porter's Five Forces Model4.8. Key Drivers Analysis4.9. Key Constraints Analysis4.10. Key Opportunities Identified4.11. Key Challenges Identified
3
List of Tables
Table 1: Market Estimation and Forecast Methodology, 2015Table 2: Significance and Importance of the Market Forecast, 2015Table 3: Market Size and Forecasting, 2014-2019Table 4: Market Share, 2014Table 5: Classification By Company HeadquartersTable 6: Classification By Headcount of the companyTable 7: Market MetricsTable 8: Competitive Landscape, 2014Table 9: Market Drivers Ranked in Order of Impact, 2014-2019Table 10: Impact of Top Industry Drivers on Business Functions, 2014-2019Table 11: Market Constraints Ranked in Order of Impact, 2014-2019Table 12: Impact of Top Industry Constraints on Business Functions, 2014-2019Table 13: Market Opportunities Ranked in Order of Impact, 2014-2019Table 14: Impact of Top Industry Opportunities on Business Functions, 2014-2019Table 15: Market Challenges Ranked in Order of Impact, 2014-2019Table 16: Impact of Top Industry Challenges on Business Functions, 2014-2019Table 17: Market Size & Forecasting of North America By Region, 2014-2019Table 18: Market Size & Forecasting of Europe By Region, 2014-2019Table 19: Market Size & Forecasting of APAC By Region, 2014-2019Table 20: Market Size & Forecasting of South America By Region, 2014-2019Table 21: Market Size & Forecasting of ROW By Region, 2014-2019Table 22: Market Size & Forecasting of Enterprise By End User, 2014-2019Table 23: Market Size & Forecasting of Mid Size By End User, 2014-2019Table 24: Market Size & Forecasting of Small Business By End User, 2014-2019Table 25: Market Size & Forecasting of Cloud By Deployment, 2014-2019Table 26: Market Size & Forecasting of On-Premise By Deployment, 2014-2019Table 27: Market Size & Forecasting of Hybrid By Deployment, 2014-2019Table 28: Market Size & Forecasting of Financial Services By Industry, 2014-2019Table 29: Market Size & Forecasting of IT & Telecommunication By Industry, 2014-2019Table 30: Market Size & Forecasting of Government By Industry, 2014-2019Table 31: Market Size & Forecasting of Retail By Industry, 2014-2019Table 32: Market Size & Forecasting of Healthcare By Industry, 2014-2019Table 33: Market Size & Forecasting of Education By Industry, 2014-2019Table 34: Market Size & Forecasting of Others By Industry, 2014-2019
4
List of Charts
Chart 1: Market Size and Forecasting, 2014-2019Chart 2: Region Outlook, 2014Chart 3: Market Size & Forecasting of North America By Region, 2014-2019Chart 4: Market Size & Forecasting of Europe By Region, 2014-2019Chart 5: Market Size & Forecasting of APAC By Region, 2014-2019Chart 6: Market Size & Forecasting of South America By Region, 2014-2019Chart 7: Market Size & Forecasting of ROW By Region, 2014-2019Chart 8: Market Size & Forecasting of Enterprise By End User, 2014-2019Chart 9: Market Size & Forecasting of Mid Size By End User, 2014-2019Chart 10: Market Size & Forecasting of Small Business By End User, 2014-2019Chart 11: Market Size & Forecasting of Cloud By Deployment, 2014-2019Chart 12: Market Size & Forecasting of On-Premise By Deployment, 2014-2019Chart 13: Market Size & Forecasting of Hybrid By Deployment, 2014-2019Chart 14: Market Size & Forecasting of Financial Services By Industry, 2014-2019Chart 15: Market Size & Forecasting of IT & Telecommunication By Industry, 2014-2019Chart 16: Market Size & Forecasting of Government By Industry, 2014-2019Chart 17: Market Size & Forecasting of Retail By Industry, 2014-2019Chart 18: Market Size & Forecasting of Healthcare By Industry, 2014-2019Chart 19: Market Size & Forecasting of Education By Industry, 2014-2019Chart 20: Market Size & Forecasting of Others By Industry, 2014-2019
5

dfgfd dfgfdh dfgfh dfhgf
Introduction 01 6

1. Introduction
1.1. Report Description
With growing usage of Internet, businesses across the globe are using web based applications in their day-to-day operations. Increasing number of employees and other stakeholders access the company's digital assets regularly. It becomes next to impossible for the in-house incident response team to keep a track on who is accessing what content and at which point of time. With growing traffic on the network, they would also fail to keep a track on the network related activities and these lapses could invite trouble to company's digital assets in the form of cyber threats or attacks. Keeping a tab on these things manually is proving a painful activity to the personnel. And, as this process involves sensitive issues like the data security of the company, any kind of delays to respond to suspicious activities may prove costly to the company both financially and from the reputation point-of view. To counter these, businesses, especially large enterprises have started implementing Security Information and Event Management (SIEM) solutions that automatically monitor and store the log and activity information which can be used by the company to negate any kind of cyber threats.
The growing incidents of sophisticated attacks where businesses are being targeted irrespective of their geographical presence and despite of having all necessary IT infrastructure in place is worrying the businesses. This, along with the existing strong compliance policies of the countries are proving to be catalyst in the growth of IT security solutions like SIEM. Because businesses are now realizing that it is better safe than sorry.
The market for Security Information and Event Management (SIEM) solution is catching up and this report provides deep insights on how the market is expected to fare in the next five years. It also presents interpretative and easy-to-understand facts on how the current SIEM market is segmented based on the deployment type, the major verticals that have been implementing these, the end-user group of these SIEM solutions and also based on the geographic regions.
1.2. Objective
1. To understand the Security Information and Event Management (SIEM) market across the globe by addressing the challenges faced by the industry with regards to the adoption of Enterprise SIEM solutions.2. To estimate the size of present global Security Information and Event Management (SIEM) market and to forecast its future values.
1.3. Scope of the Research
Scope of the research was limited to understanding the market share across segments. Key drivers, constraints and challenges along with their impact on various business functions in both short term and long term were addressed. Segmentations and forecasting were done based on:1. End-User2. Verticals3. Deployment Type (On-premise vs Cloud vs Hybrid)4. Region Based Segmentation
7
1.4. Regions Covered
1. North America (US, Canada and Mexico and other countries)2. Europe (United Kingdom, France, Germany, Italy, Spain and other countries)3. APAC (Australia, India, China, Japan, Singapore and others)4. South America (Brazil, Argentina and others)5. RoW (Middle East and Africa, South America, Russia and other countries)
1.5. Key Takeaways
1. North America is growing at a much higher rate than other geographies in terms of adoption and the revenue generated from this region is highest. Europe and APAC are far behind in this race of adoption.2. The market for Security Information and Event Management was USD 1824.43 million in 2014 and is expected to grow at a CAGR of close to 12.85% till 2019.3. Deployment wise, traditional on-premise SIEM solutions have the highest market share but Cloud based SIEM and Hybrid SIEM solutions are slowly eating up this market share and are experiencing greater adoption rate than on-premise SIEM solutions.4. Enterprise level businesses still remain the major consumers of these solutions and even the small and medium level businesses are also catching up in the race of adoption.5. Financial institutions, Government organizations, IT & Telecom, Retail, Education and Healthcare companies have emerged as the major users. This is because, usage of Internet among these companies is rising and hence would require proper security solutions in place to protect the network infrastructure.
1.6. Key Stakeholders
1. Enterprise Security Information and Event Management solution and product providers: Enterprise SIEM solution providers will be able to gauge the market more accurately as this will assist them in better decision making. Also, the product developers would be able to develop products according to the requirement of the customers.2. End-User companies: Report will provide the end-users, a more clear picture on the solution provider demographics so that they can choose among the best.3. Global Investors: Those investors who look to fund new and budding cloud based SIEM solution provider start-ups, will get clear picture about the market and its trends.4. Industry Watchers: Industry and trend watchers are always referred to as trusted advisors who follow markets. The report would add to their knowledge repository, creating value for their know-how.
8

1.7. Key Terminologies
1. APAC: Mainly includes Australia, India, China, Japan, Singapore and other nations in the region2. Europe: Mainly includes United Kingdom, France, Germany, Spain and other European nations3. MEA: Mainly includes Israel, South Africa, UAE and other nations4. North America: Mainly includes United States of America, Canada, Mexico and other North American nations5. South America: Mainly includes Brazil and Argentina and other South American nations6. Enterprise: Companies with an employee headcount above 1001.7. Mid-Size: Companies with an employee headcount between 501 - 1000.8. Small-Business: Companies with an employee up to 500.9. BYOD (Bring Your Own Device): Bring Your Own Device refers to the policy of permitting employees to bring their own devices, such as laptops, smart phones and tablets to their workplace.10. Security Information and Event Management (SIEM): A security management approach that help companies to identify and prevent security breaches early.11. Health Insurance Portability and Accountability Act (HIPAA): A federal act that makes easier for people to uphold the confidentiality of their healthcare information or data.
9

1.8. List of Abbreviations
1. BYOD: Bring-Your-Own-Device2. USD: United States Dollar3. CAGR: Compound Annual Growth Rate4. USA: United States of America5. APAC: Asia-Pacific6. IT: Information Technology7. RoW: Rest of the World8. UK: United Kingdom9. R&D: Research and Development10. SMB: Small and Medium Businesses11. HITECH: Health Information Technology for Economic and Clinical Health Act12. GLBA: The Gramm-Leach-Bliley Act12. MASSIF: Management of Security information and events in Service Infrastructures13. NIA: National Investigation Agency 14. UAE: United Arab Emirates15. SIEM: Security Information and Event Management16. FFIEC: The Federal Financial Institutions Examination Council17. PCI DSS: The Payment Card Industry Data Security Standard 18. SSN: Social Security Number
10

dfgfd dfgfdh dfgfh dfhgf
Executive Summary 02 11

2. Executive Summary
2.1 Executive Overview
Internet is turning out to be a major facilitator for many of the operations of the businesses. Many of the departments like sales and marketing, research & development, operations have been using internet to improve their efficiency. Growing use of Internet means, multiple users accessing the company's digital assets at the same time. On a positive note, this would improve the efficiency of the entire company, but growing network activity would also mean, need for more monitoring and management of events across the company's digital assets. The incident response team of the company come under immense pressure and this would hamper quality of their work. This would also invite risk of data breaches as the manual detection of suspicious activities would amount to lapse of crucial time that would otherwise save the company from cyber-attacks.
Use of manual processes are generally time consuming and would not be as accurate as the automated processes. And any delay in timely detection of cyber threats would result the data thefts and other related security breaches. To counter these issues, many of the enterprises these days are actively adopting necessary IT security solutions which includes Security Information and Event Management (SIEM). The demand for SIEM solutions are steadily increasing, thanks to the growing security threats. Also, the existing compliance regulations are prompting many of the businesses to adopt these solutions voluntarily in order to avoid hefty fines.
Security Information and Event Management is a combination of Security Information Management (SIM) and Security Event Management (SEM). While SIM is responsible for collection of login information and other related data and generate an automated report for further analysis, SEM draws some analysis and trends from the information events that has occurred. Combined together, SIEM provides a comprehensive real time analysis of on-going activities and report these activities to the company personnel automatically so that the company can initiate any preventive measures in case of detection of any suspicious activities or cyber-attacks. Implementation of Security Information and Event Management solutions is happening among enterprises to adhere to certain compliance standards. In countries like the USA and UK, the existing compliance standards makes it mandatory for companies to have certain IT security solutions which includes SIEM as well.
Several of the IT product based companies, Network Security companies, IT security companies and cloud service provider companies dominate the service provider market and many of the new start-up companies are also entering the arena by introduction of cloud based SIEM solutions.
Security Information and Event Management Market Growing Steadily
With growing frequency of attacks, security monitoring solutions like SIEM is expected to flourish further. The Global Security Information and Event Management Market - Outlook (2015-2019) report suggests that the overall market was valued at USD 1824.43 million in 2014 and is expected to grow at a steady CAGR of 12.85% till 2019. The introduction of cloud based SIEM solutions and also the Hybrid SIEM solutions would also add to the growing market.
North America - Highest Revenue Contributor with Highest Adoption Rate; Europe and APAC - A "yet-to-
12

grow" Market.
As always, North America, especially countries like the USA and Canada have been the top adopters of this technology and the region contributes the most in terms of revenue. The main reason being, that businesses here are vulnerable to attacks and the frequency of attacks is way too high when compared to other regions.
Europe and Asia-Pacific market have limited adoption and the revenue generated from them is comparably low. Europe, in particular is showing some positive signs of growth but the revenue generation is still less. Asia-Pacific market, on the other hand is a mixed bag, where businesses of developed countries like Japan and Singapore are adopting the solutions, but growth still lags in countries like India and China. Going forward, as the business related activities here heats up, the rate of adoption is expected to go up.
On-Premise SIEM solutions losing its market share to Cloud and Hybrid SIEM.
No doubt on-premise SIEM solutions contribute the most to the overall SIEM market. But, due to the complexities involved in terms of adoption, high initial investment costs and introduction of cloud based and hybrid SIEM solutions is driving businesses away from on-premise deployment model. The adoption rate of cloud and hybrid SIEM solutions is higher and is expected to grow further. This is because, going forward, all those enterprise level businesses who earlier adopted on-premise SIEM solutions would also start partially adopting cloud based solutions. Along with this, small and medium businesses across the globe are also expected to start adopting these solutions.
Enterprises are the major consumers, Financial Services are the top adopters.
Enterprises are the major consumers of these solutions as they are the most frequently targeted end-user segment of all. These businesses also consists of large number of employees who use Internet to reach out to their customers. This has prompted them to adopt SIEM solutions which can reduce the manual tasks and automatically detect the risks or any other abnormal events.
Among the verticals, Financial Services companies have emerged as the major users of these solution. Many of banking, insurance and other finance related companies across the globe are facing innumerable attacks every day-in and day-out. To counter these, many of these businesses have been implementing these solutions. Businesses in this vertical are known to seek advanced forms of Security Information and Event Management solutions as well.
The Underlying Challenges
One of the greatest challenge for growth of SIEM market is the complexities involved in implementation of SIEM solutions, the skilled workforce required to effectively manage them and the high initial investment costs. A majority of these issues is now being addressed by the introduction of cloud and hybrid SIEM solution. But the user base of SIEM solutions now require more effective solutions which can counter the sophisticated attempts of attacks by early detection and reporting. Another notable issue is to educate the customers about the effectiveness of such solutions especially in the emerging markets. Most of these markets having limited technological exposure and do not dedicatedly use them in their operations. Convincing the customer about the necessity of such solutions would be another major challenge that provider companies have to concentrate upon.
13

With introduction of cloud based SIEM solutions and with making the existing solutions customer friendly, most of these challenges can be successfully addressed by the provider companies. The R&D teams of the solution providers have to constantly enhance their product features in order to deliver what the customer actually wants.
14

dfgfd dfgfdh dfgfh dfhgf
Research and Forecasting 03 15

3.1. Research Methodology
Base Year: 2014Forecasting Period: 2015 - 2019
3.1.1. Sampling
The leading suppliers of each end-user product categories that were chosen to provide a larger representative sample.
Purposive unit sampling was adopted for every service segment such as verticals, regions, end-users and others. This was resorted to, in order to elicit the appropriate inputs with regard to the qualitative growth aspects of the market.
3.1.2. Secondary Research
The research methodology that was carried out was desk research through various journals, association reports, and in house database to build a knowledge base on various market service segments, product categories and industry trends.
Various fact based data was analyzed. Some of the sources included:a. ResearchFox Knowledge Base:
Previous data on the market has been put through a rigorous and comprehensive analysis to analyze the current state.
b. Desk Research:
Industry reports, annual reports, press releases, webinars, journals and publication, independent rating agencies and government statistics.
3.1.3. Primary Research
Primary interviews were conducted among various stakeholders:
Product and service companiesMembers of associations and alliancesSubject Matter Experts and EvangelistsConsultants and Strategists
16

3.1.4. Industry Information
It was essential to understand the current industry landscape, market dynamics, security ecosystem and competitor metrics. To estimate the global market, Chief Experience Officers (CXOs), Marketing Heads, Sales Managers and product stakeholders were interviewed.
3.1.5. Technical Information
In addition to the interviews with leading participants for industry-related information, ResearchFox conducted interviews with Research and Development (R&D) and Design and Development teams to understand the current usage of the products by service type and also to find out the emerging trends. Finally, interviews with suppliers were conducted to cross check the validity of information and also to understand the emerging trends in the end-user segment. The detailed methodology for primary research is outlined below.
3.1.6. Primary Interview Questionnaire Design
ResearchFox developed a detailed questionnaire, which was used by the analysts as a guide for their discussions. This process ensured the collection of all necessary data. The questionnaire was designed to elicit unbiased industry level data (market size, production, sales, and others), that had check points (questions such as company level information and their position in the industry acted as check points) to ensure accuracy of the data. The questionnaire included the following sections:
1. Industry level information2. Characteristics and Dynamics3. Company-specific information4. Market segmentation data
3.1.7. Interview Questionnaire Test and Validation
Following the design of the questionnaire, ResearchFox carried out some initial interviews to verify that the appropriate market and technology data was generated. After the final design of the questionnaire, ResearchFox began full scale primary research. Specific companies targeted for primary research interviews were selected based upon market participation. Higher was the entity's profile, more attractive was the entity.
17

3.1.8. Interview Process
As participants respond in the course of an interview, ResearchFox analysts are trained to move from lower priority and/ or sensitive topics to increasingly key and/or sensitive topics in response to the interviewee's behavior. This responsive and reflective interview process, combined with the analysts' ability to discuss the industry and technical issues in an open and sharing environment, allows ResearchFox to probe for key data, operations, and competitive information. Multiple contacts within a single organization and with an individual are often planned and/or staged in order to optimize and complete the information gathering process.
3.1.9. Research Validation
At a point, when 20 percent of the research interviews and/or data collection had been completed, ResearchFox consultants evaluated the preliminary findings to assure that up-to-date results are in line with project objectives. The analyst team analyzed the information from the interviews and information was validated through a combination of the following validation techniques:
Cross checking with other primary data and previously developed in-house researchReview of secondary information, such as trade journals, annual reports and industry directories
18
3.2. Forecasting Methodology
3.2.1. Step-by-Step Methodology for Market Estimation and Forecasting
Table 1: Market Estimation and Forecast Methodology, 2015
Step Method
1Understand the market mechanism for the market through structured, systematic and theoretically established norms of analyzing, designing, introducing and quality assurance of the market estimation
2 Measuring the various market drivers, constraints, opportunities and challenges at regular intervals of time
3 Integrate expert-opinion of discussions in consultation with the ResearchFox Analyst team
4 Market estimation and forecast calculation
5 Delphi method and Causal Analysis used as and when required
6Rigorous quality check with heads of Research Team, Subject Matter Experts and Consultants before final publication
Source: ResearchFox
Table 2: Significance and Importance of the Market Forecast, 2015
Sr. No. Significance and Importance
1 Helps revisit on the company's R&D investments
2 Keeps the Sales and Marketing team posted on the market prospects
3 Strategize investment and expansion plans
4 Improve business planning
5 Helps create business aims and set sales figures within the company
6 Aware of the current market competition
7 Support plans for Merger and Acquisition (M&A)
Source: ResearchFox
19

dfgfd dfgfdh dfgfh dfhgf
Industry Landscape 04 20
4. Industry Landscape
4.1. Market Size and Growth
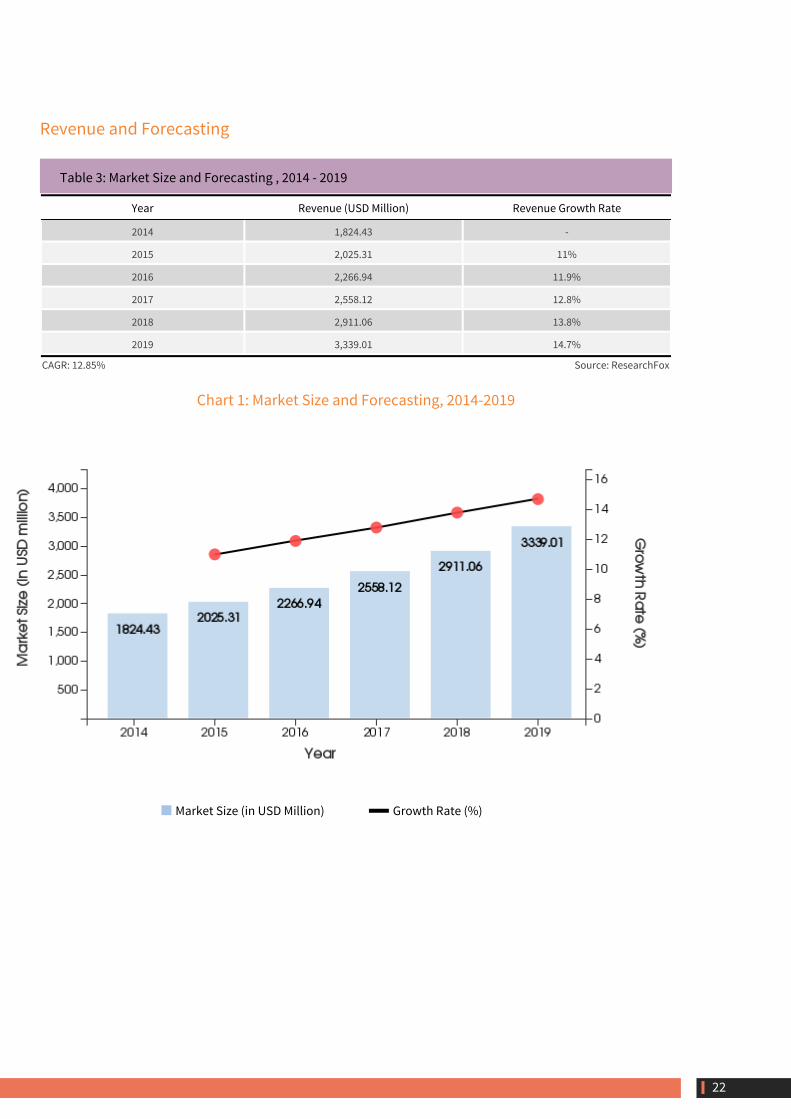
Market SizeGlobal market size of Security Information and Event Management was USD 1824.43 million in 2014 and is expected to reach USD 3339.01 million in 2019. IT security software providers are the major providers of these solutions and until now, enterprise level business have been the major consumers of this solution. Going forward, as the Cloud based and Hybrid SIEM solutions become affordable and as their popularity grows, even the small and medium businesses are expected to start the adoption.
Growth RateGlobal Security Information and Event Management market was estimated to be worth USD 1824.43 million in 2014 and is expected to reach USD 3339.01 million by 2019 growing at a CAGR of 12.85%. Among the regions, North America and Europe contribute the most to the overall market revenue and North America continues to maintain a higher growth rate compared to other geographies.
Increase in incidents related to network infrastructure attacks or growing breaches in the networks are forcing businesses across the geographies to closely monitor their digital assets. Manual monitoring of the network activities is becoming a cumbersome process due to increased activities on the network. Also, with increased cyber threats and attacks, the management is becoming even tougher. This has prompted many of the businesses to look for solutions that would automatically intimate companies about the ongoing network activities and also record and report any kind of suspicious activities.
To address most of these issues, several IT security related watchdog institutions and country's intelligence organizations encourage every companies to implement security monitoring tools like SIEM. However, with growing sophistication of attacks, miscreants are also coming up with new tactics to breach company's digital assets. This again, has increased the demand for need of better and advanced SIEM solutions. Also, the introduction of new cloud based and hybrid SIEM solutions are helping those companies which earlier could not afford traditional on-premise SIEM solutions.
The market for SIEM solution is expected to grow and the forecasted future market values are as shown in the table below.
21
Revenue and Forecasting
Table 3: Market Size and Forecasting , 2014 - 2019
Year Revenue (USD Million) Revenue Growth Rate
2014 1,824.43 -
2015 2,025.31 11%
2016 2,266.94 11.9%
2017 2,558.12 12.8%
2018 2,911.06 13.8%
2019 3,339.01 14.7%
CAGR: 12.85% Source: ResearchFox
Chart 1: Market Size and Forecasting, 2014-2019
Market Size (in USD Million) Growth Rate (%)
22

4.2. Competitive Landscape
Table below suggests the competitive demography of the SIEM Market
Table 4: Competitive Landscape, 2014
Parameters Details
Number of Companies in the Market 70
Types of CompetitorsComputer and Network Security Software providersIT & Telecom software and service providersIT Security providers
Distribution Structure68% - Direct Sales Channel32%- Indirect Sales Channel (Resellers, VAR's, Distributors)
Tiers of CompetitionTier 1: Well established companies with Market grip on IT security productsTier 2: Large and Midsized companies that are seeing growthTier 3: Companies with less market share
Notable Acquisitions, Mergers
IBM acquired CrossIdeas, a provider of security software that governs user access to applicationsLogLogic acquired by TIBCOQ1 Labs acquired by IBM
Key End-User GroupsEnterprisesMid-size businessSmall business
Competitive Factors
Enables companies to adhere to certain security compliance standardsAutomates IT infrastructure monitoring with lease human interventionAllows companies to initiate necessary actions to avoid cyber threats or attacks
Source:ResearchFox
23

4.3. Market Share
The top 6 companies listed below consists of a combination of IT software provider, Network security companies, and Pure IT security software provider companies. This shows that the service provider demography is a mixture of various types of companies. The other prominent players who reflect in the top 10 list as per the market share include, TripWire, TIBCO, Logrhythm, Dell SecureWorks and others.
Table 5: Market Share, 2014
Company Market Share
Hewlett Packard 19%
EMC 14%
IBM 14%
Splunk 8%
McAfee 7%
Juniper Networks 3%
Others* 35%
Source:ResearchFox
* Tripwire, TIBCO, Logrythm, NetIQ, Dell Secureworks & Others
24

4.4. Company Classification
By Company Headquarters
It is evident that more than 60% of the overall Security Information and Event Management solution vendors originate from North America and this is due to the fact that most of the cyber-attacks happens in these regions evidently which has prompted businesses here to adopt SIEM solutions pro-actively. Hence most of the solution providers are based out of this region as it is easy to reach to their customers.
Table 6: Company Headquarters
Category No. of Vendors
North America 45
Europe 12
APAC 9
Other regions (includes South America, Israel and others) 4
Source:ResearchFox
By Headcount of the company
The vendor landscape is mainly dominated by the enterprise level companies that consists of more than 1000 employees. This is due to the requirement of high level of R&D costs involved which is affordable by the large companies. However, the number of small and medium companies offering these solutions is also expected to increase in the future due to introduction of solutions like cloud based SIEM.
Table 7: Headcount of the company
Category No. of Vendors
0-50 7
51-200 15
201-500 9
501-1000 11
1000+ 28
Source:ResearchFox
25
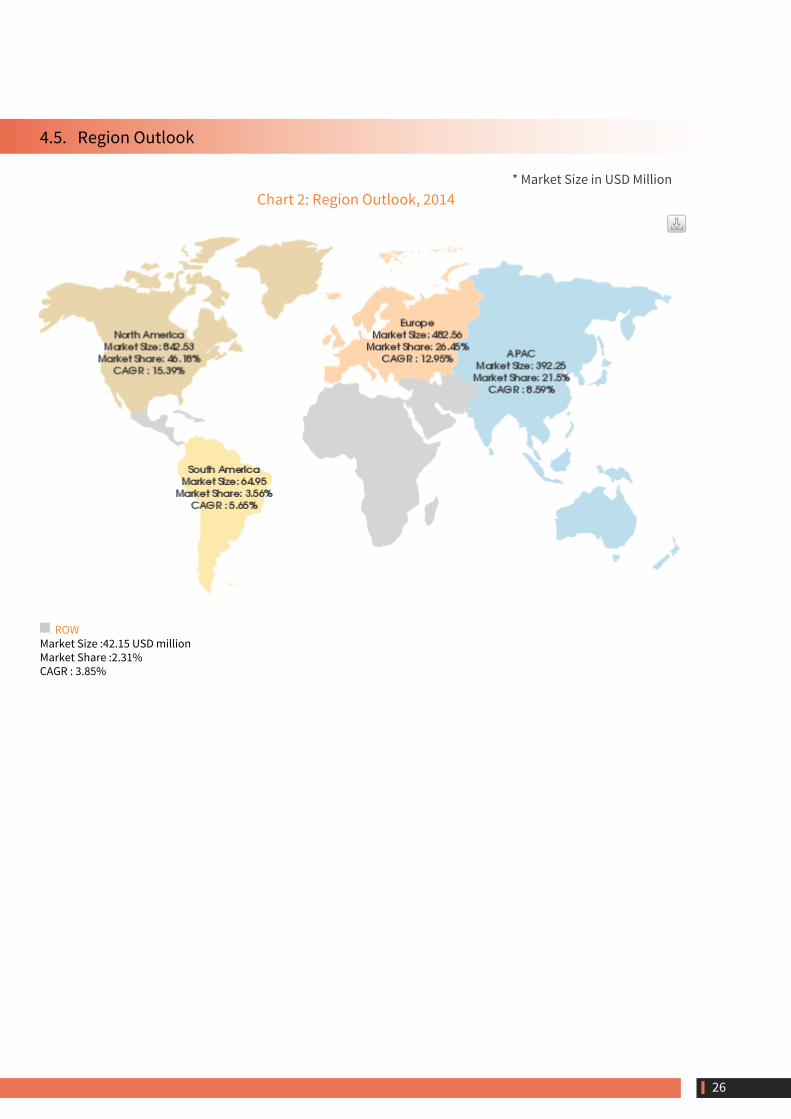
4.5. Region Outlook
* Market Size in USD MillionChart 2: Region Outlook, 2014
ROWMarket Size :42.15 USD millionMarket Share :2.31%CAGR : 3.85%
26
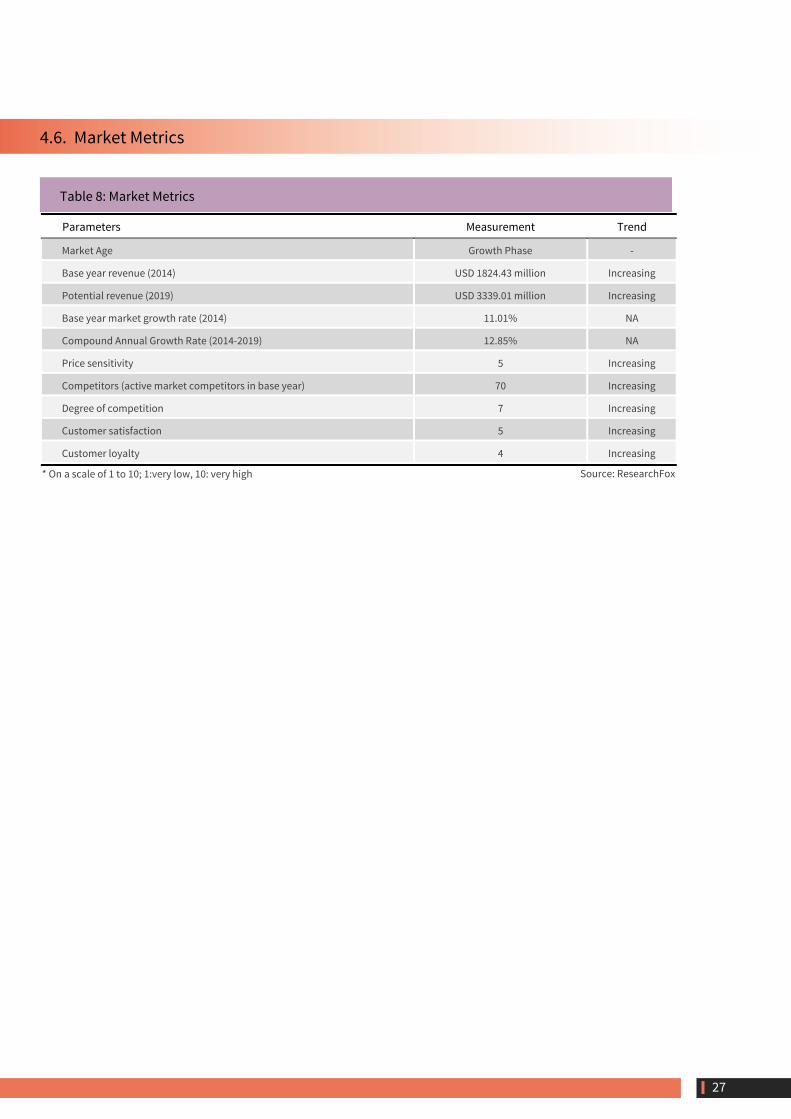
4.6. Market Metrics
Table 8: Market Metrics
Parameters Measurement Trend
Market Age Growth Phase -
Base year revenue (2014) USD 1824.43 million Increasing
Potential revenue (2019) USD 3339.01 million Increasing
Base year market growth rate (2014) 11.01% NA
Compound Annual Growth Rate (2014-2019) 12.85% NA
Price sensitivity 5 Increasing
Competitors (active market competitors in base year) 70 Increasing
Degree of competition 7 Increasing
Customer satisfaction 5 Increasing
Customer loyalty 4 Increasing
* On a scale of 1 to 10; 1:very low, 10: very high Source: ResearchFox
27
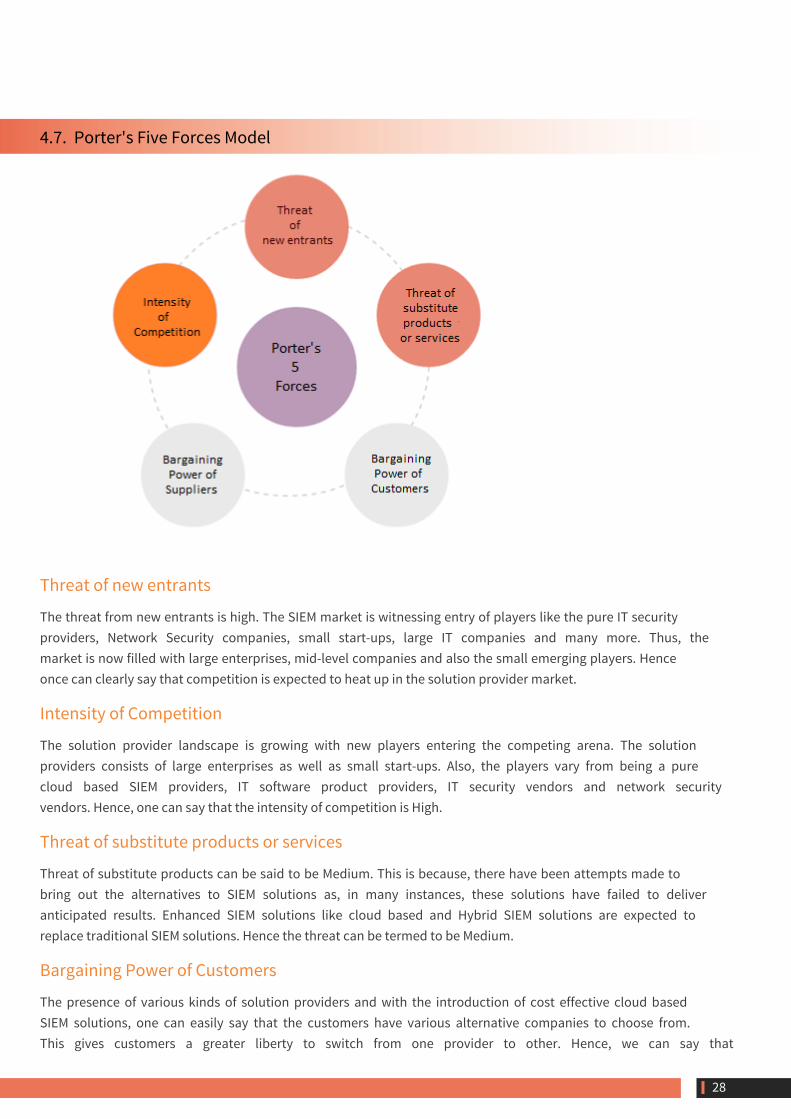
4.7. Porter's Five Forces Model
Threat of new entrants
The threat from new entrants is high. The SIEM market is witnessing entry of players like the pure IT security providers, Network Security companies, small start-ups, large IT companies and many more. Thus, the market is now filled with large enterprises, mid-level companies and also the small emerging players. Hence once can clearly say that competition is expected to heat up in the solution provider market.
Intensity of Competition
The solution provider landscape is growing with new players entering the competing arena. The solution providers consists of large enterprises as well as small start-ups. Also, the players vary from being a pure cloud based SIEM providers, IT software product providers, IT security vendors and network security vendors. Hence, one can say that the intensity of competition is High.
Threat of substitute products or services
Threat of substitute products can be said to be Medium. This is because, there have been attempts made to bring out the alternatives to SIEM solutions as, in many instances, these solutions have failed to deliver anticipated results. Enhanced SIEM solutions like cloud based and Hybrid SIEM solutions are expected to replace traditional SIEM solutions. Hence the threat can be termed to be Medium.
Bargaining Power of Customers
The presence of various kinds of solution providers and with the introduction of cost effective cloud based SIEM solutions, one can easily say that the customers have various alternative companies to choose from. This gives customers a greater liberty to switch from one provider to other. Hence, we can say that
28

bargaining power of customers is High.
Bargaining Power of Suppliers
Bargaining power of suppliers is Low, as the market is flooded with small and large solution providers. There is no scope for any kind of vendor lock-in and the suppliers are governed and driven by customer's requirements. So, once can say that the solution providers have very less say in deciding the trend of the SIEM market.
29

4.8. Key Drivers Analysis
Over the last few years cyber-crime has increased drastically. Research suggests that it has increased over 10% in 2014 from that of the previous year. USA alone has lost USD 12.69 million in FY 2014 through cyber-crimes followed by Germany USD 8.13 million and Japan by USD 6.91 million. In order to prevent cyber-crime, a thorough real-time monitoring is required. Use of SIEM solution could help counter such attacks through improved security intelligence and analytics.
The table given below suggests the various drivers ranked in order of impact for SIEM market.
Table 9: Market Drivers Ranked in Order of Impact, 2014 - 2019
Rank Drivers 1-2 Years 3-5 Years
1 Growing compliance & Regularity Mandates Medium High
2 Rising level of sophistication of cybercrimes High High
3 Improving security and efficiency Medium High
Source:ResearchFox
The table given below suggests the impact of various drivers on business functions.
Table 10: Impact of Top Industry Drivers on Business Functions, 2014 - 2019
Rank Drivers Sales Marketing R&DBus. Dev. and
Corp. Mgmt.
1Growing compliance & Regularity Mandates
Medium High High Medium
2Rising level of sophistication of cybercrimes
High Very High High Medium
3 Improving security and efficiency Medium High High Medium
Source:ResearchFox
30
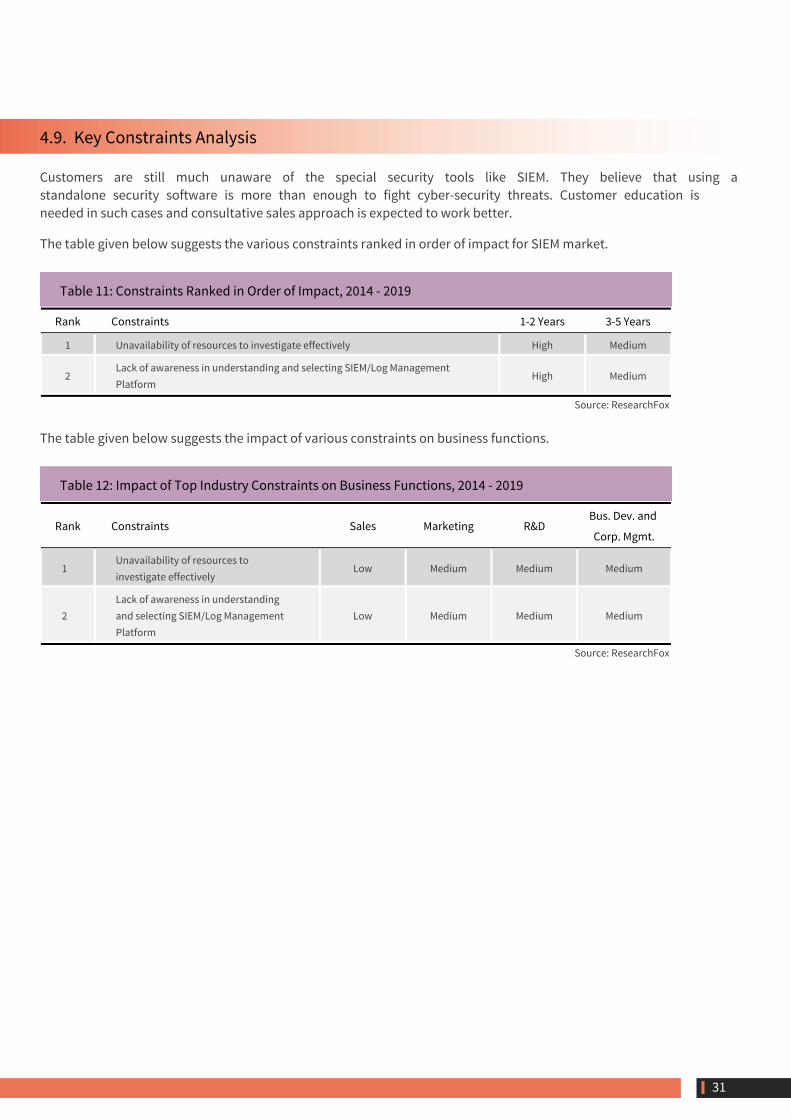
4.9. Key Constraints Analysis
Customers are still much unaware of the special security tools like SIEM. They believe that using a standalone security software is more than enough to fight cyber-security threats. Customer education is needed in such cases and consultative sales approach is expected to work better.
The table given below suggests the various constraints ranked in order of impact for SIEM market.
Table 11: Constraints Ranked in Order of Impact, 2014 - 2019
Rank Constraints 1-2 Years 3-5 Years
1 Unavailability of resources to investigate effectively High Medium
2Lack of awareness in understanding and selecting SIEM/Log Management Platform
High Medium
Source: ResearchFox
The table given below suggests the impact of various constraints on business functions.
Table 12: Impact of Top Industry Constraints on Business Functions, 2014 - 2019
Rank Constraints Sales Marketing R&DBus. Dev. and
Corp. Mgmt.
1Unavailability of resources to investigate effectively
Low Medium Medium Medium
2Lack of awareness in understanding and selecting SIEM/Log Management Platform
Low Medium Medium Medium
Source: ResearchFox
31

4.10. Key Opportunities Identified
Currently, the state of the SIEM industry suggests that the providers largely target enterprise customers given the limited opportunities they see across mid-market and small businesses. Going ahead this opportunity needed to be explored with special focus on the mid-market segment. This segment currently looks dynamic with high cash flow.
The table given below suggests the various opportunities ranked in order of impact for SIEM market.
Table 13: Opportunities Ranked in Order of Impact, 2014 - 2019
Rank Opportunities 1-2 Years 3-5 Years
1 Penetration in the mid-market business segment Medium High
2 Offering cost effective cloud SIEM solutions Low High
3 Marketing SIEM solutions through consultative sales approach Low Medium
Source: ResearchFox
The table given below suggests the impact of various opportunities on business functions.
Table 14: Impact of Top Industry Opportunities on Business Functions, 2014 - 2019
Rank Opportunities Sales Marketing R&DBus. Dev. and
Corp. Mgmt.
1Penetration in the mid-market business segment
Low Medium Low Medium
2Offering cost effective cloud SIEM solutions
Low Medium Low Medium
3Marketing SIEM solutions through consultative sales approach
Low Medium Low Medium
Source:ResearchFox
32

4.11. Key Challenges Identified
A big challenge most of the security providers face is the fact that they are unable to catch-up with the advanced security attacks that hackers and cyber-miscreants rage against consumers. This remains a main challenge for security service providers as their solutions are at times in-capable of delivering upon their expectations.
The table given below suggests the various opportunities ranked in order of impact for SIEM market.
Table 15: Impact of Top Industry Challenges, 2014 - 2019
Rank Challenges 1-2 Years 3-5 Years
1 Ever changing advanced methods of security threats Very High Very High
2 Inconsistency in security mandates across regions and industry verticals High Medium
Source: ResearchFox
The table given below suggests the impact of various opportunities on business functions.
Table 16: Impact of Top Industry Challenges on Business Functions, 2014 - 2019
Rank Challenges Sales Marketing R&DBus. Dev. and
Corp. Mgmt.
1Ever changing advanced methods of security threats
High High High High
2Inconsistency in security mandates across regions and industry verticals
No Impact
No Impact
No Impact
No Impact
Source: ResearchFox
33

Market Segmentation 05 34

5.1. Region
5.1.1. North America
Market Size and ForecastingNorth America, especially countries like the USA and Canada are the biggest contributor to the Security Information and Event Management (SIEM) market. The rate of adoption is much higher among the businesses of this part of the world. Both the provider market and the consumer market are biggest in the region. Many IT security software providers originate from North America and have a large pool of customers who are also majorly from North America. In 2014, more than 45% of the overall SIEM revenue was realized from North America businesses. Going forward, in 2018, this revenue contribution is expected to be more than 51%. With growing incidents of cyber-attacks in the region, the demand is expected to grow even more in the years to come.
The table given below suggests that the SIEM market in North America generated revenue of USD 842.50 million in 2014 and would be USD 1723.44 million in 2019 growing at a CAGR of 15.39%. In other words we can interpret that the market share for this region would increase from 46.18% in 2014 to 51.62% in 2019.
The probable reasons for growth of SIEM market in North America include:
1. Growing incidents of cyber-attacks in the region due to increased identity thefts and unauthorized access into a company's digital assets. 2. To adhere to the compliance standards set by the governing authorities. Many of the policies and Acts governing the Healthcare and Financial industry in USA like the HIPAA, HITECH, Sarbanes Oxley and GLBA makes it mandatory to have SIEM solutions to monitor security events in the businesses. 3. Log and security information management becoming a complex task due to increased activities of employees who access digital resources of company more often.
Table 17: Market Size and Forecasting of North America, 2014-2019
Year Revenue (USD (Million)) Revenue Growth Rate
2014 842.53 -
2015 959.02 13.8%
2016 1,099.14 14.6%
2017 1,268.33 15.4%
2018 1,473.53 16.2%
2019 1,723.45 17%
CAGR: 15.39% Source: ResearchFox
Chart 3: Market Size and Forecasting of North America, 2014-2019
35

Market Size (in USD Million) Growth Rate (%)
36
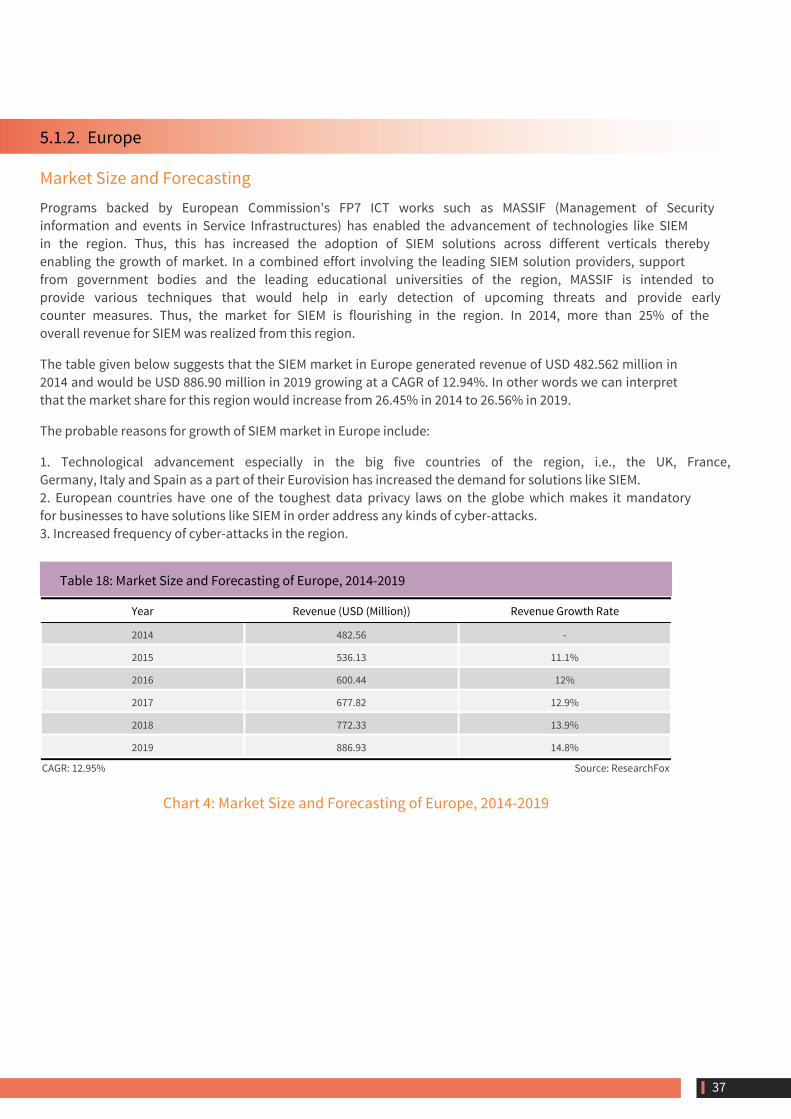
5.1.2. Europe
Market Size and ForecastingPrograms backed by European Commission's FP7 ICT works such as MASSIF (Management of Security information and events in Service Infrastructures) has enabled the advancement of technologies like SIEM in the region. Thus, this has increased the adoption of SIEM solutions across different verticals thereby enabling the growth of market. In a combined effort involving the leading SIEM solution providers, support from government bodies and the leading educational universities of the region, MASSIF is intended to provide various techniques that would help in early detection of upcoming threats and provide early counter measures. Thus, the market for SIEM is flourishing in the region. In 2014, more than 25% of the overall revenue for SIEM was realized from this region.
The table given below suggests that the SIEM market in Europe generated revenue of USD 482.562 million in 2014 and would be USD 886.90 million in 2019 growing at a CAGR of 12.94%. In other words we can interpret that the market share for this region would increase from 26.45% in 2014 to 26.56% in 2019.
The probable reasons for growth of SIEM market in Europe include:
1. Technological advancement especially in the big five countries of the region, i.e., the UK, France, Germany, Italy and Spain as a part of their Eurovision has increased the demand for solutions like SIEM. 2. European countries have one of the toughest data privacy laws on the globe which makes it mandatory for businesses to have solutions like SIEM in order address any kinds of cyber-attacks. 3. Increased frequency of cyber-attacks in the region.
Table 18: Market Size and Forecasting of Europe, 2014-2019
Year Revenue (USD (Million)) Revenue Growth Rate
2014 482.56 -
2015 536.13 11.1%
2016 600.44 12%
2017 677.82 12.9%
2018 772.33 13.9%
2019 886.93 14.8%
CAGR: 12.95% Source: ResearchFox
Chart 4: Market Size and Forecasting of Europe, 2014-2019
37
Market Size (in USD Million) Growth Rate (%)
38

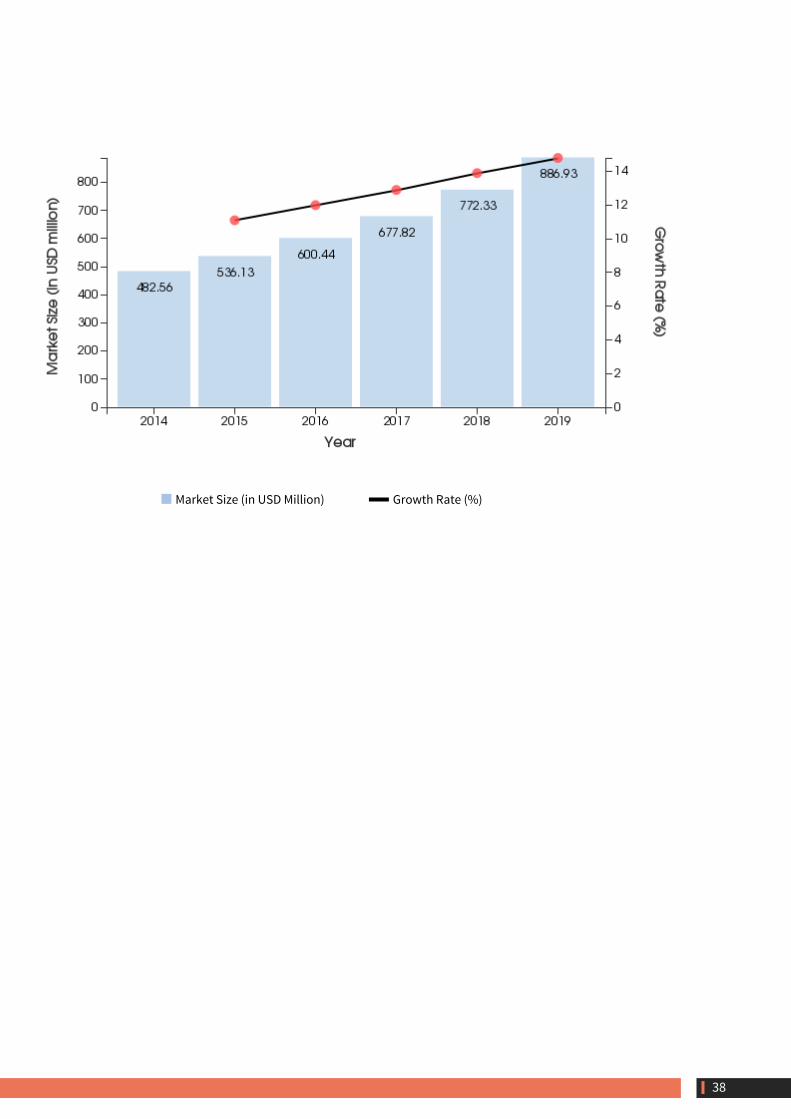
5.1.3. APAC
Market Size and ForecastingMarket for SIEM mainly revolves around the technology oriented countries like Japan, Singapore, Australia, China and India. Most of the revenue contribution in the region mainly comes from the businesses located in these countries. Compared to North America and Europe, Asia-Pacific regions lag in terms of adoption. The main reasons attributed for this are the lack of technology understanding among companies of the region, the complexities involved in implementing these solutions and the scarcity of quality workforce who can manage these solutions. A mere 20% of the revenue was generated in 2014 by this solution in the region in 2014. But, on the optimistic note, the market is growing at a slower rate compared to that in North America or Europe.
The table given below suggests that the SIEM market in APAC generated revenue of USD 392.25 million in 2014 and would be USD 592.30 million in 2019 growing at a CAGR of 8.59%. In other words we can interpret that the market share for this region would decrease from 21.50% in 2014 to 17.74% in 2019.
The probable reasons for growth of SIEM market in Asia-Pacific include:
1. Growing users accessing company's digital information via web thereby resulting in increase in the log events related information. 2. Businesses in the region moving from old, traditional, less effective manual processes towards automation especially with the use of IT solutions. 3. Growing incidents of identity thefts in the region thereby requiring more security monitoring and identification of threats before they strike. 4. Stronger compliance related policies by the governments making it mandatory for businesses to possess these solutions.
Table 19: Market Size and Forecasting of APAC, 2014-2019
Year Revenue (USD (Million)) Revenue Growth Rate
2014 392.25 -
2015 419.82 7%
2016 452.62 7.8%
2017 491.53 8.6%
2018 537.62 9.4%
2019 592.26 10.2%
CAGR: 8.59% Source: ResearchFox
Chart 5: Market Size and Forecasting of APAC, 2014-2019
39
Market Size (in USD Million) Growth Rate (%)
40

5.1.4. South America
Market Size and ForecastingRevenue contribution from South America towards SIEM was less than 4% in 2014. The market in this part of the world is still new. Only few technology oriented countries like Brazil and Argentina have been adopting these solutions. Few of the global IT companies who have their presence here, have been offering Security Information and Event Management Solutions. As the market here is still new, solution providers have the opportunity to view this market as a great potential going forward.
The table given below suggests that the SIEM market in South America generated revenue of USD 64.94 million in 2014 and would be USD 85.50 million in 2019 growing at a CAGR of 5.65%. In other words we can interpret that the market share for this region would decrease from 3.56% in 2014 to 2.56% in 2019.
The probable reasons for growth of SIEM market in South America include: 1. Improving knowledge among the businesses about the importance of analyzing and monitoring their log events. 2. Growing number of users accessing the digital content of businesses using usernames and passwords. 3. Increasing incidents of data and identity thefts among businesses of the region. 4. Government authorities trying to implement certain compliance policies to businesses who possess their customer data.
Table 20: Market Size and Forecasting of South America, 2014-2019
Year Revenue (USD (Million)) Revenue Growth Rate
2014 64.95 -
2015 67.38 3.7%
2016 70.54 4.7%
2017 74.53 5.7%
2018 79.47 6.6%
2019 85.48 7.6%
CAGR: 5.65% Source: ResearchFox
Chart 6: Market Size and Forecasting of South America, 2014-2019
41

Market Size (in USD Million) Growth Rate (%)
42

5.1.5. ROW
Market Size and ForecastingMost of the businesses in other parts of the world are least aware of these technologies and hence have been not able to adopt these solutions. Also, generally, most of the SIEM solutions are complex to implement and management and would also require high initial investments. All these factors have deterred companies from implementing SIEM. But, some of the companies in Middle East and Africa have slowly started progressing in terms of adoption. As of now, this has enabled some growth of the market. In 2014, the contribution from this geographic market towards global SIEM market was just above 2%.
The table given below suggests that the SIEM market in RoW generated revenue of USD 42.10 million in 2014 and would be USD 50.90 million in 2019 growing at a CAGR of 3.85%. In other words we can interpret that the market share for this region would decrease from 2.31% in 2014 to 1.52% in 2019.
The probable reasons for growth of SIEM market in RoW include:
1. Growing knowledge about the importance of having proper IT security solutions supporting business operations. 2. Increased incidents of cyber-attacks and identity thefts in the region.
Table 21: Market Size and Forecasting of ROW, 2014-2019
Year Revenue (USD (Million)) Revenue Growth Rate
2014 42.15 -
2015 42.96 1.9%
2016 44.21 2.9%
2017 45.91 3.9%
2018 48.13 4.8%
2019 50.91 5.8%
CAGR: 3.85% Source: ResearchFox
Chart 7: Market Size and Forecasting of ROW, 2014-2019
43

Market Size (in USD Million) Growth Rate (%)
44

5.2. End User
5.2.1. Enterprise
Market Size and ForecastingBigger business houses often deal with more complex user cases as compared with the smaller firms. While interacting with stakeholders in the enterprises, we have noted five major pain areas around SIEM which includes securing big data usage, real-time incident reporting, situational awareness, deployment flexibility and lack of integrated security solution. With a large number of providers still offering traditional SIEM solutions, the bigger players in the market has started to extend their support in developing SIEM products capable of handling complex security infringements.
The table given below suggests that the enterprise segment of SIEM market generated revenue of USD 1057.60 million in 2014 and would be USD 1955.20 million in 2019 growing at a CAGR of 13.10%. In other words we can interpret that the market share for this segment would increase from 57.97% in 2014 to 58.56% in 2019.
The probable reasons for growth of Global SIEM market in Enterprise segment include:
1. Complex nature of cyber-attacks on larger enterprises2. Insider attacks (employees) being conducted 3. Employee mobility and use BYOD concepts4. Real-time incidence reporting5. Growing compliance & Regularity Mandates
Table 22: Market Size and Forecasting of Enterprise, 2014-2019
Year Revenue (USD (Million)) Revenue Growth Rate
2014 1,057.63 -
2015 1,177.63 11.3%
2016 1,320.51 12.1%
2017 1,492.77 13%
2018 1,701.72 14%
2019 1,955.25 14.9%
CAGR: 13.08% Source: ResearchFox
Chart 8: Market Size and Forecasting of Enterprise, 2014-2019
45

Market Size (in USD Million) Growth Rate (%)
46
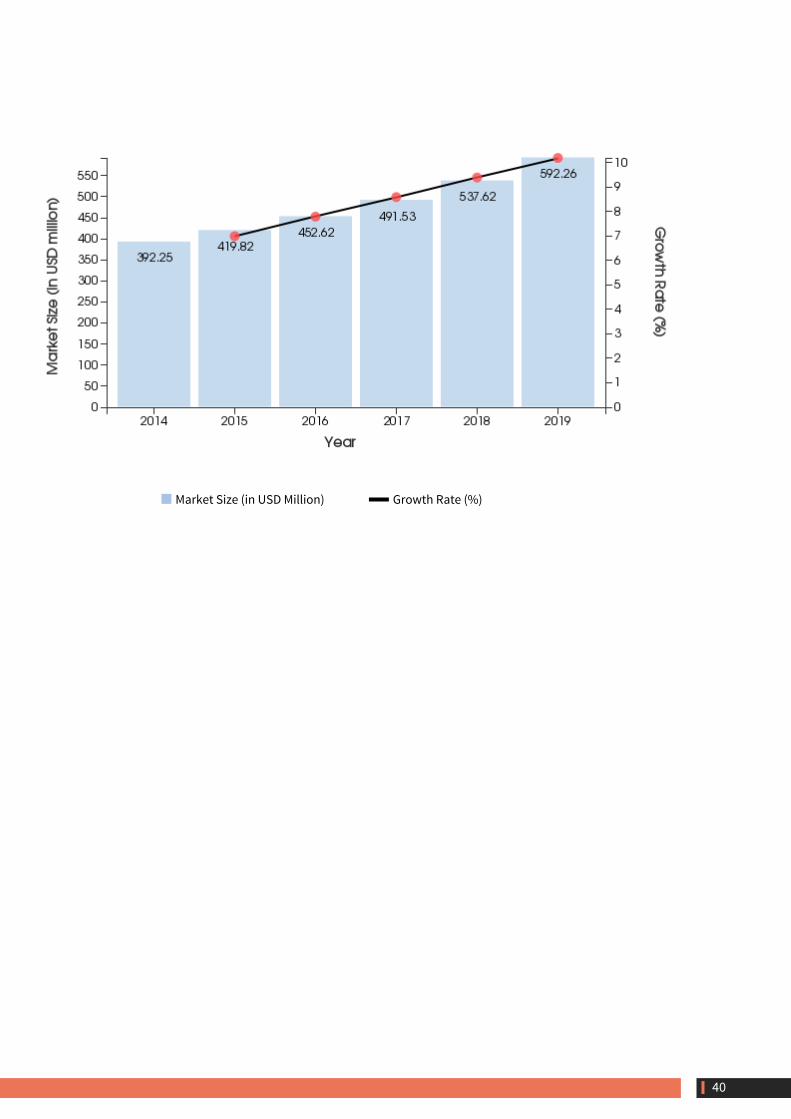
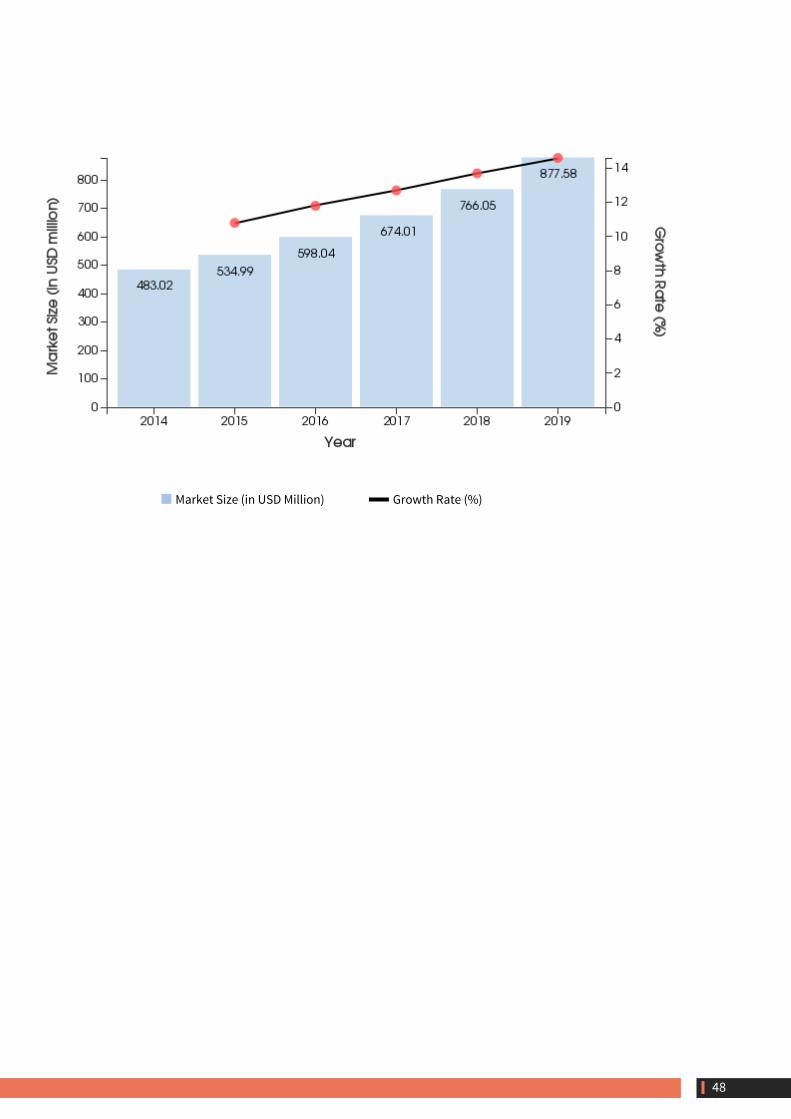
5.2.2. Mid Size
Market Size and ForecastingThe mid-size or mid-market companies has the second largest share of SIEM users among other sections of the end-user segment. Large mid-market companies remain serious on adopting SIEM solutions given the level of intrinsic data this set of companies deal with. This in a way offers an option for service providers to pitch through and convince in buying such security products.
The table given below suggests that the mid-size segment of SIEM market generated revenue of USD 483.00 million in 2014 and would be USD 877.60 million in 2019 growing at a CAGR of 12.70%. In other words we can interpret that the market share for this segment would decrease from 26.47% in 2014 to 26.28% in 2019.
The probable reasons for growth of Global SIEM market in mid-size segment include:
1. Complex nature of cyber-attacks on larger mid-market companies2. Sensitive nature of data handling3. Insider attacks (employees) being conducted 4. Employee mobility and use BYOD concepts5. Need for real-time incidence reporting6. Growing compliance & Regularity Mandates
Table 23: Market Size and Forecasting of Mid Size, 2014-2019
Year Revenue (USD (Million)) Revenue Growth Rate
2014 483.02 -
2015 534.99 10.8%
2016 598.04 11.8%
2017 674.01 12.7%
2018 766.05 13.7%
2019 877.58 14.6%
CAGR: 12.68% Source: ResearchFox
Chart 9: Market Size and Forecasting of Mid Size, 2014-2019
47
Market Size (in USD Million) Growth Rate (%)
48

5.2.3. Small Business
Market Size and ForecastingSmall businesses mostly run on shoe string budgets, not enough to afford advanced technological equipment. This goes even for security software. The larger pie of these companies use basic version of software in order to fight security threats. Hence SIEM finds itself in poor state among this set of companies.
The table given below suggests that the small business segment of SIEM market generated revenue of USD 283.80 million in 2014 and would be USD 506.20 million in 2019 growing at a CAGR of 12.30%. In other words we can interpret that the market share for this segment would decrease from 15.56% in 2014 to 15.16% in 2019.
The probable reasons for growth of Global SIEM market in small business segment include:
1. Sensitive nature of data handling2. Insider attacks (employees) being conducted 3. Employee mobility and use BYOD concepts4. Growing compliance & Regularity Mandates
Table 24: Market Size and Forecasting of Small Business, 2014-2019
Year Revenue (USD (Million)) Revenue Growth Rate
2014 283.77 -
2015 312.70 10.2%
2016 348.39 11.4%
2017 391.34 12.3%
2018 443.30 13.3%
2019 506.17 14.2%
CAGR: 12.27% Source: ResearchFox
Chart 10: Market Size and Forecasting of Small Business, 2014-2019
49

Market Size (in USD Million) Growth Rate (%)
50

5.3. Deployment
5.3.1. Cloud
Market Size and ForecastingCloud based SIEM or SIEM-as-a-Service is a cloud based model for traditional SIEM solutions and are designated to perform similarly or even more efficiently than the standard on-premise SIEM solutions. These solutions are slowly gaining importance globally. The cloud based SIEM solutions negate the complexities involved in implementation of traditional SIEM solutions. Also, SIEM solutions are way too cost effective when compared to on-premise solutions. Those companies who are start-ups but require the solutions like SIEM have been the primary consumers of these kinds of solutions. Market for these kinds of solutions are expected to grow in the future as all those companies who earlier could not afford costly traditional SIEM solutions will now start adopting these solutions.
The table given below suggests that the market for Cloud SIEM software is expected to grow from USD 609.20 million in 2014 to USD 1150.20 million in 2019 at CAGR 13.55%. In other words we can interpret that the market share for this segment would increase from 33.39% in 2014 to 34.45% in 2019.
The probable reasons for growth of Cloud SIEM software include:
1. Improved efficiency of cloud all over the globe making businesses to believe that cloud based solutions are equally effective like traditional SIEM. 2. The high costs and complexities involved in implementation of SIEM solutions making businesses to turn towards cloud solutions. 3. The scarcity of skilled workforce for management of traditional SIEM solutions, especially among small and medium companies.
Table 25: Market Size and Forecasting of Cloud, 2014-2019
Year Revenue (USD (Million)) Revenue Growth Rate
2014 609.17 -
2015 681.60 11.9%
2016 767.53 12.6%
2017 871.22 13.5%
2018 997.13 14.5%
2019 1,150.17 15.3%
CAGR: 13.55% Source: ResearchFox
Chart 11: Market Size and Forecasting of Cloud, 2014-2019
51

Market Size (in USD Million) Growth Rate (%)
52
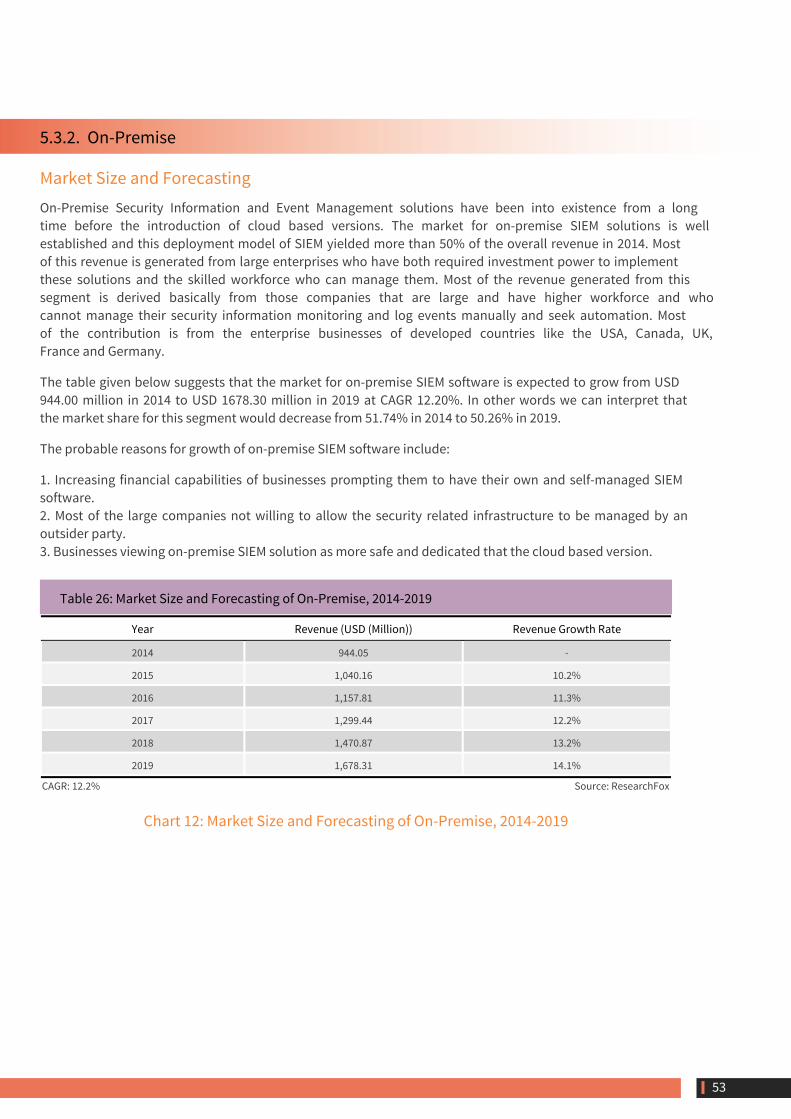
5.3.2. On-Premise
Market Size and ForecastingOn-Premise Security Information and Event Management solutions have been into existence from a long time before the introduction of cloud based versions. The market for on-premise SIEM solutions is well established and this deployment model of SIEM yielded more than 50% of the overall revenue in 2014. Most of this revenue is generated from large enterprises who have both required investment power to implement these solutions and the skilled workforce who can manage them. Most of the revenue generated from this segment is derived basically from those companies that are large and have higher workforce and who cannot manage their security information monitoring and log events manually and seek automation. Most of the contribution is from the enterprise businesses of developed countries like the USA, Canada, UK, France and Germany.
The table given below suggests that the market for on-premise SIEM software is expected to grow from USD 944.00 million in 2014 to USD 1678.30 million in 2019 at CAGR 12.20%. In other words we can interpret that the market share for this segment would decrease from 51.74% in 2014 to 50.26% in 2019.
The probable reasons for growth of on-premise SIEM software include:
1. Increasing financial capabilities of businesses prompting them to have their own and self-managed SIEM software. 2. Most of the large companies not willing to allow the security related infrastructure to be managed by an outsider party. 3. Businesses viewing on-premise SIEM solution as more safe and dedicated that the cloud based version.
Table 26: Market Size and Forecasting of On-Premise, 2014-2019
Year Revenue (USD (Million)) Revenue Growth Rate
2014 944.05 -
2015 1,040.16 10.2%
2016 1,157.81 11.3%
2017 1,299.44 12.2%
2018 1,470.87 13.2%
2019 1,678.31 14.1%
CAGR: 12.2% Source: ResearchFox
Chart 12: Market Size and Forecasting of On-Premise, 2014-2019
53

Market Size (in USD Million) Growth Rate (%)
54
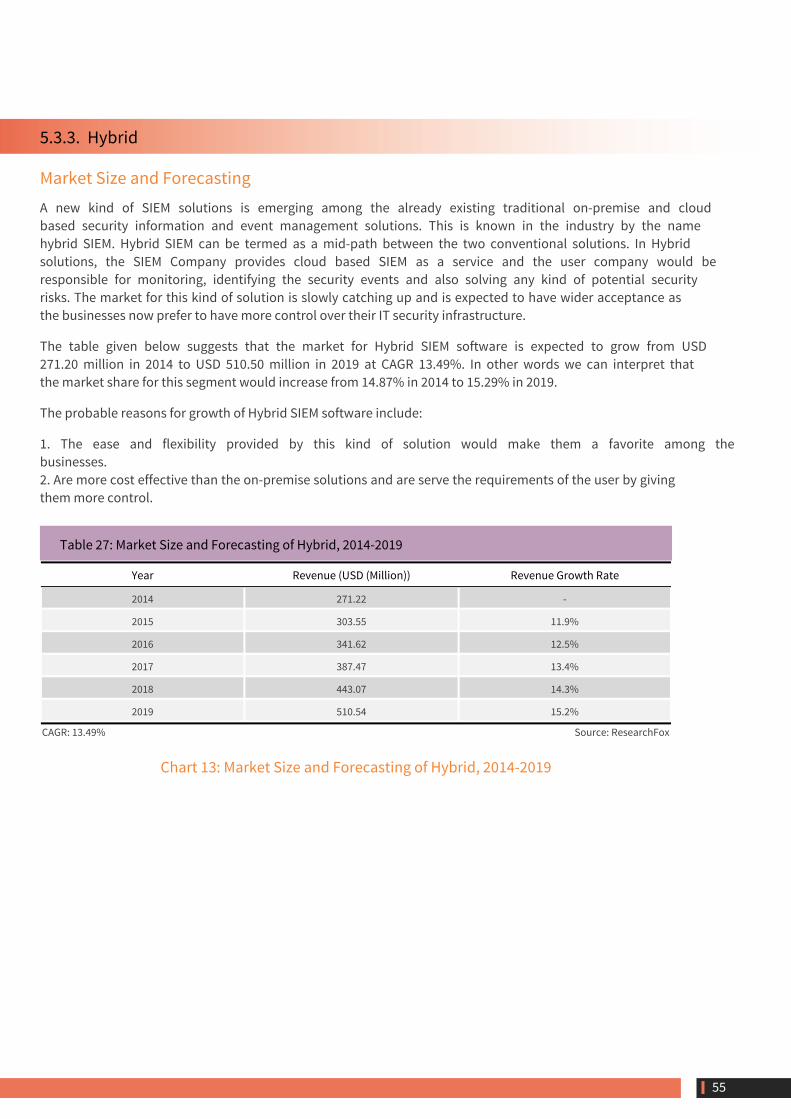
5.3.3. Hybrid
Market Size and ForecastingA new kind of SIEM solutions is emerging among the already existing traditional on-premise and cloud based security information and event management solutions. This is known in the industry by the name hybrid SIEM. Hybrid SIEM can be termed as a mid-path between the two conventional solutions. In Hybrid solutions, the SIEM Company provides cloud based SIEM as a service and the user company would be responsible for monitoring, identifying the security events and also solving any kind of potential security risks. The market for this kind of solution is slowly catching up and is expected to have wider acceptance as the businesses now prefer to have more control over their IT security infrastructure.
The table given below suggests that the market for Hybrid SIEM software is expected to grow from USD 271.20 million in 2014 to USD 510.50 million in 2019 at CAGR 13.49%. In other words we can interpret that the market share for this segment would increase from 14.87% in 2014 to 15.29% in 2019.
The probable reasons for growth of Hybrid SIEM software include:
1. The ease and flexibility provided by this kind of solution would make them a favorite among the businesses. 2. Are more cost effective than the on-premise solutions and are serve the requirements of the user by giving them more control.
Table 27: Market Size and Forecasting of Hybrid, 2014-2019
Year Revenue (USD (Million)) Revenue Growth Rate
2014 271.22 -
2015 303.55 11.9%
2016 341.62 12.5%
2017 387.47 13.4%
2018 443.07 14.3%
2019 510.54 15.2%
CAGR: 13.49% Source: ResearchFox
Chart 13: Market Size and Forecasting of Hybrid, 2014-2019
55

Market Size (in USD Million) Growth Rate (%)
56

5.4. Industry
5.4.1. Financial Services
Market Size and ForecastingCustomers put their most valued financial data including Social Security Number (SSN) and credit card numbers in banking and financial institutions. These institutions need to comply with the government and industry regulations like FFIEC, GLBA and PCI-DSS. SIEM solution plays a vital role in the industry and helps to perform several activities. This includes: monitoring events throughout the organization like servers, workstations, devices, applications, services and processes; activity analysis for administrator and user accounts; creating a role based web interface to run and view reports on event log data and performing comprehensive and automated regulatory compliance capabilities.
The table given below suggests that the Financial Services segment of SIEM market generated revenue of USD 645.20 million in 2014 and would be USD 1182.26 million in 2019 growing at a CAGR of 12.88%. In other words we can interpret that the market share for this segment would increase from 35.36% in 2014 to 35.41% in 2019.
The probable reasons for growth of Global SIEM market in Financial Services segment include:
1. Sensitivity of financial data that is being stored and consumed by banking and financial institutions2. Volume of logs generated3. Growing security compliance issues from users4. Need for security intelligence for combating threat5. Growing compliance & Regularity Mandates
Table 28: Market Size and Forecasting of Financial Services, 2014-2019
Year Revenue (USD (Million)) Revenue Growth Rate
2014 645.21 -
2015 717.19 11.2%
2016 802.68 11.9%
2017 905.74 12.8%
2018 1,030.70 13.8%
2019 1,182.27 14.7%
CAGR: 12.88% Source: ResearchFox
Chart 14: Market Size and Forecasting of Financial Services, 2014-2019
57

Market Size (in USD Million) Growth Rate (%)
58

5.4.2. IT & Telecommunication
Market Size and ForecastingThe telecom industry is revolutionizing in itself. What was earlier considered as connecting people over telephones now has changed the way in which it does business. They are now required to support big-data analytics, cloud computing and Software Defined Networking (SDN). Adoption of these advanced features in their environment makes them vulnerable to cyber-threats. A SIEM solution for a telecom provider could help streamline and increase compliance management. Telecom providers could obtain valuable insights into key performance markers and would be able to prevent fraud, APTs and malicious insiders.
The table given below suggests that the IT & Telecom segment of SIEM market generated revenue of USD 490.64 million in 2014 and would be USD 908.35 million in 2019 growing at a CAGR of 13.11%. In other words we can interpret that the market share for this segment would increase from 26.89% in 2014 to 27.20% in 2019.
The probable reasons for growth of Global SIEM market in IT & Telecom segment include:
1. Adoption and use of big-data analytics, cloud computing and SDN in the telecom industry2. Global presence and multi-shoring in executing complex IT projects 3. Growing security compliance issues from users4. Need for security intelligence for combating threat5. Growing compliance & Regularity Mandates
Table 29: Market Size and Forecasting of IT & Telecommunication, 2014-2019
Year Revenue (USD (Million)) Revenue Growth Rate
2014 490.65 -
2015 545.80 11.2%
2016 612.39 12.2%
2017 692.69 13.1%
2018 790.12 14.1%
2019 908.35 15%
CAGR: 13.11% Source: ResearchFox
Chart 15: Market Size and Forecasting of IT & Telecommunication, 2014-2019
59

Market Size (in USD Million) Growth Rate (%)
60
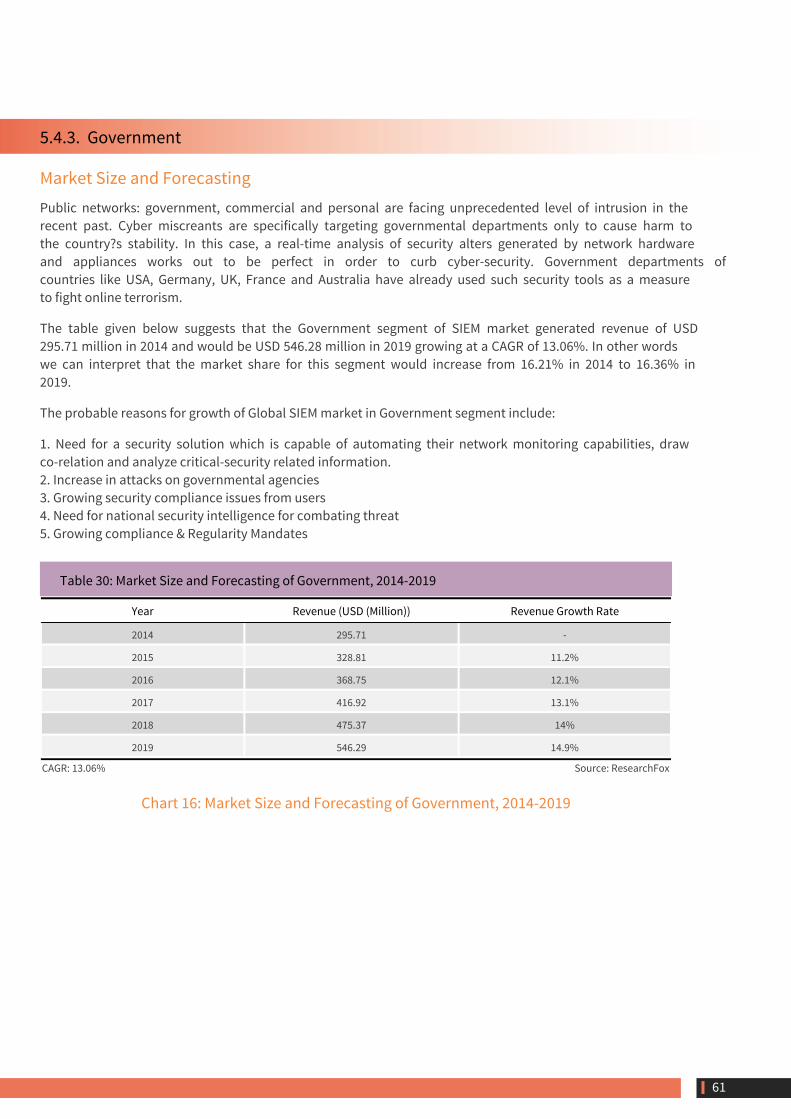
5.4.3. Government
Market Size and ForecastingPublic networks: government, commercial and personal are facing unprecedented level of intrusion in the recent past. Cyber miscreants are specifically targeting governmental departments only to cause harm to the country?s stability. In this case, a real-time analysis of security alters generated by network hardware and appliances works out to be perfect in order to curb cyber-security. Government departments of countries like USA, Germany, UK, France and Australia have already used such security tools as a measure to fight online terrorism.
The table given below suggests that the Government segment of SIEM market generated revenue of USD 295.71 million in 2014 and would be USD 546.28 million in 2019 growing at a CAGR of 13.06%. In other words we can interpret that the market share for this segment would increase from 16.21% in 2014 to 16.36% in 2019.
The probable reasons for growth of Global SIEM market in Government segment include:
1. Need for a security solution which is capable of automating their network monitoring capabilities, draw co-relation and analyze critical-security related information. 2. Increase in attacks on governmental agencies3. Growing security compliance issues from users4. Need for national security intelligence for combating threat5. Growing compliance & Regularity Mandates
Table 30: Market Size and Forecasting of Government, 2014-2019
Year Revenue (USD (Million)) Revenue Growth Rate
2014 295.71 -
2015 328.81 11.2%
2016 368.75 12.1%
2017 416.92 13.1%
2018 475.37 14%
2019 546.29 14.9%
CAGR: 13.06% Source: ResearchFox
Chart 16: Market Size and Forecasting of Government, 2014-2019
61

Market Size (in USD Million) Growth Rate (%)
62

5.4.4. Retail
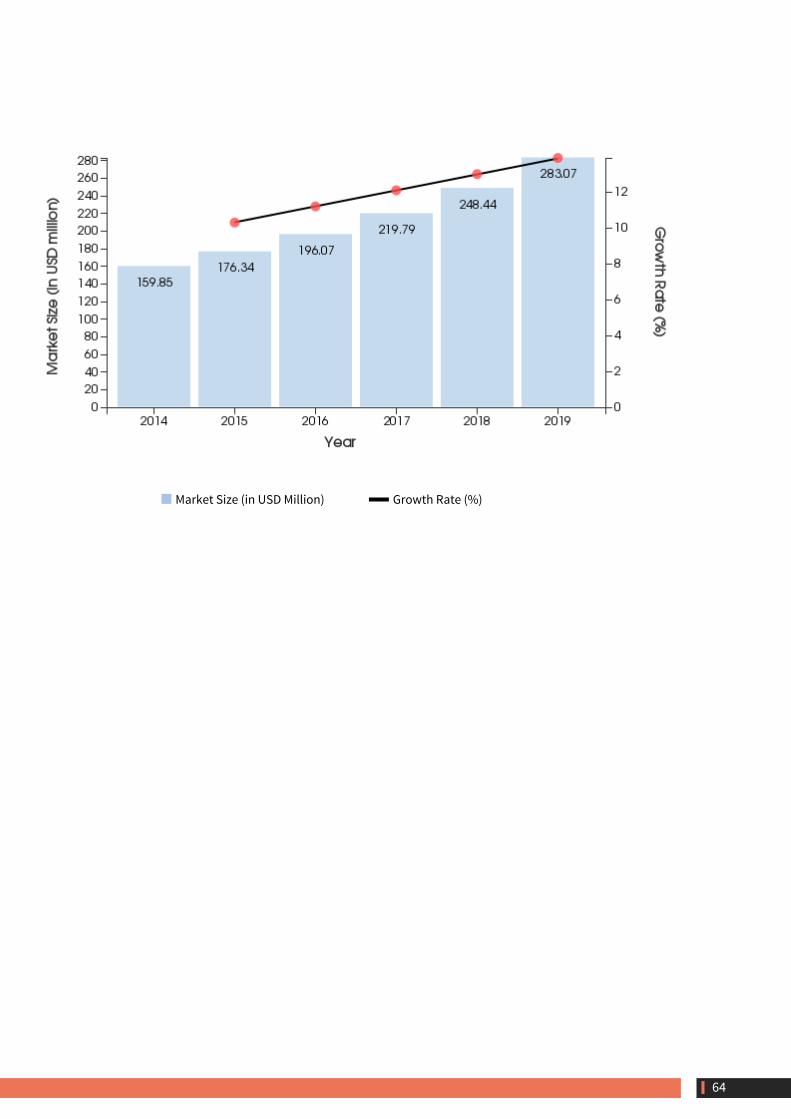
Market Size and ForecastingRetail companies across the globe are undergoing transformational changes and information technology is being seen as a major facilitator of this trend. This is making them a hot industry to target. Most of the hackers today view retail businesses as a major target potential due to increased role of IT and telecommunication in retail operations. Attackers try to infiltrate the telecom networks of most of the retailers to obtain precious customer information. This has prompted retail companies across the globe to grow more cautious about managing their digital infrastructure. Retail companies are now seeking continuous monitoring solutions like SIEM to maintain a transparency on who is accessing what content at which point of time. They are also using SIEM technology to monitor any abnormal activities in their networks which could pose cyber related threats. Hence the use of SIEM is growing among retail companies across the globe. Close to 9% of the overall global revenue for SIEM was generated by retail businesses in the year 2014 and this share is expected to grow in the future.
The table given below suggests that the SIEM market for Retail segment generated revenue of USD 159.80 million in 2014 and would be USD 283.07 million in 2019 growing at a CAGR of 12.11%. In other words we can interpret that the market share for this region would decrease from 8.76% in 2014 to 8.48% in 2019.
The probable reasons for growth of SIEM market for Retail segment include:
1. The growing demand for use of information technology for everyday operations among the retail companies across the globe. 2. Increased targeting of retail businesses as they consist of large number of crucial customer information. 3. Retail companies becoming more vigilant about maintaining the security of their digital assets.
Table 31: Market Size and Forecasting of Retail, 2014-2019
Year Revenue (USD (Million)) Revenue Growth Rate
2014 159.85 -
2015 176.34 10.3%
2016 196.07 11.2%
2017 219.79 12.1%
2018 248.44 13%
2019 283.07 13.9%
CAGR: 12.11% Source: ResearchFox
Chart 17: Market Size and Forecasting of Retail, 2014-2019
63
Market Size (in USD Million) Growth Rate (%)
64
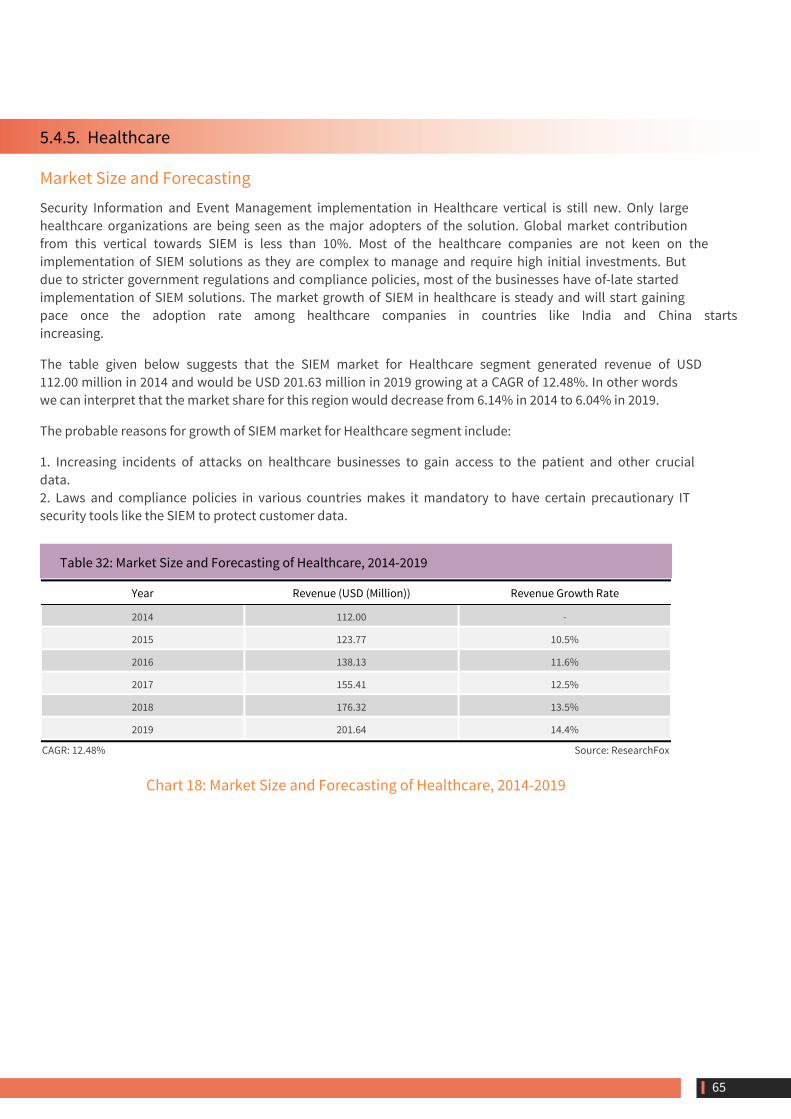
5.4.5. Healthcare
Market Size and ForecastingSecurity Information and Event Management implementation in Healthcare vertical is still new. Only large healthcare organizations are being seen as the major adopters of the solution. Global market contribution from this vertical towards SIEM is less than 10%. Most of the healthcare companies are not keen on the implementation of SIEM solutions as they are complex to manage and require high initial investments. But due to stricter government regulations and compliance policies, most of the businesses have of-late started implementation of SIEM solutions. The market growth of SIEM in healthcare is steady and will start gaining pace once the adoption rate among healthcare companies in countries like India and China starts increasing.
The table given below suggests that the SIEM market for Healthcare segment generated revenue of USD 112.00 million in 2014 and would be USD 201.63 million in 2019 growing at a CAGR of 12.48%. In other words we can interpret that the market share for this region would decrease from 6.14% in 2014 to 6.04% in 2019.
The probable reasons for growth of SIEM market for Healthcare segment include:
1. Increasing incidents of attacks on healthcare businesses to gain access to the patient and other crucial data. 2. Laws and compliance policies in various countries makes it mandatory to have certain precautionary IT security tools like the SIEM to protect customer data.
Table 32: Market Size and Forecasting of Healthcare, 2014-2019
Year Revenue (USD (Million)) Revenue Growth Rate
2014 112.00 -
2015 123.77 10.5%
2016 138.13 11.6%
2017 155.41 12.5%
2018 176.32 13.5%
2019 201.64 14.4%
CAGR: 12.48% Source: ResearchFox
Chart 18: Market Size and Forecasting of Healthcare, 2014-2019
65

Market Size (in USD Million) Growth Rate (%)
66

5.4.6. Education
Market Size and ForecastingMost of the data breaches that happen in education sector are due to the hackers, malwares or sometimes due to accidental revelation of information/data. With increased use of portable devices in educational facilities, the risks associated with data breach grows high. Most of the educational institutions around the world are now slowly realizing the importance of monitoring their network infrastructure for any sorts of suspicious activities in the network. In an attempt to ramp-up their IT security, most of the educational institutions are now adopting certain fixed IT security measures which includes implementation of solutions like the SIEM.
The table given below suggests that the SIEM market for Education segment generated revenue of USD 74.30 million in 2014 and would be USD 134.70 million in 2019 growing at a CAGR of 12.63%. In other words we can interpret that the market share for this region would crease from 4.07% in 2014 to 4.03% in 2019.
The probable reasons for growth of SIEM market for Education segment include:
1. Increasing number of education institutions encouraging portable devices to its students which means these institutions require to take certain IT security measures which includes implementation of SIEM solutions as well. 2. Growing number of attacks targeting educational institutions across the globe prompting them to adopt these solutions. 3. Certain compliance policies by the government making it mandatory for businesses to adopt IT security solutions like SIEM.
Table 33: Market Size and Forecasting of Education, 2014-2019
Year Revenue (USD (Million)) Revenue Growth Rate
2014 74.33 -
2015 82.05 10.4%
2016 91.76 11.8%
2017 103.45 12.7%
2018 117.60 13.7%
2019 134.70 14.5%
CAGR: 12.63% Source: ResearchFox
Chart 19: Market Size and Forecasting of Education, 2014-2019
67

Market Size (in USD Million) Growth Rate (%)
68

5.4.7. Others
Market Size and ForecastingOther industry verticals like Media and Entertainment, Aviation, Real Estate, etc. have less adoption of SIEM solution. Special solution for such specific industries could help foster the growth of SIEM in the near future.
The table given below suggests that the Others segment of SIEM market generated revenue of USD 46.70 million in 2014 and would be USD 82.70 million in 2019 growing at a CAGR of 12.11%. In other words we can interpret that the market share for this segment would decrease from 2.56% in 2014 to 2.48% in 2019.
The probable reasons for growth of Global SIEM market in Other Verticals segment include:
1. Growing security compliance issues from users2. Need for security intelligence for combating threat3. Growing compliance & Regularity Mandates
Table 34: Market Size and Forecasting of Others, 2014-2019
Year Revenue (USD (Million)) Revenue Growth Rate
2014 46.71 -
2015 51.37 10%
2016 57.18 11.3%
2017 64.13 12.2%
2018 72.56 13.1%
2019 82.72 14%
CAGR: 12.11% Source: ResearchFox
Chart 20: Market Size and Forecasting of Others, 2014-2019
69

Market Size (in USD Million) Growth Rate (%)
70

About ResearchFoxWHAT WE STAND FOR
We strive towards helping our customers take informed decisions by providing different perspectives for business. We don't believe in flashing LOGOs but are proud to mention that we have been helping all sizes of businesses since our inception. We are glad to have contributed in our own little way towards making a business successful. Whether you are a start-up or a large enterprise, we assure equal treatment to all, after all "Customer is King"!
THE TEAM
We are a bunch of 25 people with handful of grey hair between us. Our humble experience of around 75 man years in market research and business consulting has led us to believe that this industry is ripe for disruption. With the advent of enterprise consumerization and rapid digitization across industries, days are numbered for traditional business models of market research and consulting services. We make all efforts to bring different (fresh) perspectives to Market, Competition, and Growth of your business.
Contact Us:
Suggest a Report Topic: Report topics are approved based on number of users with the same suggestion and users are notified when the topic is approved.If you prefer to customize a report, or would like to get your report done exclusively in less than a months time!
Bangalore# 4 & 5, 1st & 2nd Floor,1st Cross,Krishna Reddy Colony,Domlur Layout,Bangalore 560 071,India
Phone: +91-80-61-341500Email: [email protected]
Hyderabad# 104 & 105, 1st Floor,Bhuvana Towers,CMR Building,Sarojini Devi Road,Secunderabad 500 003,India
Phone: +91-40-49-084455Email: [email protected]
Pune6th Floor Pentagon P-2,Magarpatta City,Hadapsar,Pune 411 028,India
Phone: +91-20-6500-6541Email: [email protected]
PhilippinesL29 Joy Nostalg Centre,17 ADB Avenue,Ortigas Center,Pasig City, Manila,Philippines - 1600
Email: [email protected]
The information contained here in is of a general nature and is not intended to address the circumstances of any particular individual or entity. Although we endeavor to provide accurate and timely information, there can be no guarantee that such information is accurate as of the date it is received or that it will continue to be accurate in the future. No one should act on such information without appropriate professional advice after a thorough examination of the particular situation.
71