Embed Size (px)
Citation preview

STATE OF THE PHISH2019 REPORT
ANNUAL REPORT
proofpoint.com/security-awareness
Security Awareness Training

STATE OF THE PHISH | 2019 2
INTRODUCTION THREE PILLARS OF CONTENT SECTION 1: THE EXTENT OF END-USER RISK
SECTION 2: WHAT INFOSEC PROS ARE EXPERIENCING
SECTION 3: SECURITY AWARENESS TRAINING: OUTCOMES AND OPPORTUNITIES
INTRODUCTION
INTRODUCTION
What did the phishing landscape look like in 2018? Is general end-user awareness of phishing and other social engineering attacks improving? What are organizations doing to combat the phishing threat — and how successful are their efforts?
Our fifth annual State of the Phish Report answers all of these questions — and more. In this report, our focus mirrors that of cyber attackers: your people. You will see data related to the following:
Tens of millions of simulated phishing emails
16 industries
7,000+ technology user insights
Nearly 15,000 survey responses from infosec professionals
16
We compiled and analyzed data from tens of millions of simulated phishing emails sent to end users around the world in organizations of all sizes. Findings are based on phishing tests administered via our
cloud-based Security Education Platform between October 2017
and September 2018.
We compare and contrast activities and results from organizations
and their employees across 16 industries, including finance, healthcare, and manufacturing.
We sent quarterly surveys to our global database of infosec professionals (customers and
non-customers) throughout 2018. Their responses reveal the
challenges they are facing, their views of the threat landscape, and the actions they’re taking to fend off phishing attacks.
Our third-party survey of more than 7,000 working adults — 1,000 each
in the US, UK, France, Germany, Italy, Australia, and Japan — focused on common social engineering terms
and attack vectors. Results provide a global perspective on the awareness
levels of the average end user.

STATE OF THE PHISH | 2019 3
INTRODUCTION THREE PILLARS OF CONTENT SECTION 1: THE EXTENT OF END-USER RISK
SECTION 2: WHAT INFOSEC PROS ARE EXPERIENCING
SECTION 3: SECURITY AWARENESS TRAINING: OUTCOMES AND OPPORTUNITIES
FOR THIS YEAR’S REPORT, WE FOCUS ON THREE KEY AREAS OF DATA
AND ANALYSIS:
The Extent of End-User RiskProofpoint threat intelligence continues to demonstrate attackers’ focus on
end users, and it validates the need to take a people-centric approach to
cybersecurity. But what if organizations aren’t following that model?
In this section of the report, you’ll find the results of our five-question,
seven-country survey, which was designed to gauge the fundamental
cybersecurity knowledge of working adults around the world. We include
global averages and country-by-country breakdowns for responses to each
question. We also feature analysis by age groups, which examines how
millennials — a key demographic for organizations worldwide — compare to
baby boomers and others in terms of cybersecurity awareness.
What Infosec Pros Are ExperiencingThis section of the report reveals the results of our quarterly surveys
of infosec professionals. We cover a number of key topics, including
the following:
• The different types of social engineering attacks organizations
are experiencing
• The frequency of phishing and spear phishing attacks
• How phishing is impacting organizations
• How organizations are using security awareness training tools
to manage end-user risk
• Application of consequence models and escalation paths
We also take a high-level, regional look at the survey data, highlighting
interesting variations among respondents who reside in one of three key
business regions: North America, EMEA, and APAC.
THREE PILLARS OF CONTENT
THREE PILLARS OF CONTENT Security Awareness Training: Outcomes and OpportunitiesWe close this year’s report with an in-depth look at the data gleaned from
our Security Education Platform. This SaaS-based learning management
system (LMS) allows our customers to plan and execute phishing awareness
training programs, as well as to gather business intelligence about these
activities. You’ll find the following results and analysis:
• Average failure rates across different phishing campaign types
• The simulated phishing templates and themes favored by
program administrators
• Average failure rates by industry and department
• How personalization and program maturity influence failure rates
• Visibility into frequently attacked targets across multiple industries
• Phishing templates that most frequently fool end users
• Insights into end-user reported emails
USER RISK REPORT Find out more about the cybersecurity knowledge levels of
working adults around the world in our 2018 User Risk Report.
DOWNLOAD THE REPORT

STATE OF THE PHISH | 2019 4
INTRODUCTION THREE PILLARS OF CONTENT SECTION 1: THE EXTENT OF END-USER RISK
SECTION 2: WHAT INFOSEC PROS ARE EXPERIENCING
SECTION 3: SECURITY AWARENESS TRAINING: OUTCOMES AND OPPORTUNITIES
The Human Factor 2018, a Proofpoint report based on threat intelligence gathered from
analysis of more than one billion emails per day, makes one thing abundantly clear:
Cyber attackers are increasingly focusing their attention on people, not technical
defenses. As the report states, “Attackers are adept at exploiting our natural curiosity,
desire to be helpful, love of a good bargain, and even our time constraints to persuade
us to click.”
Proofpoint researchers reported the following:
• Email is the top attack vector, with threat actors using macro- and micro-level
campaigns to target employees across organizational levels and job functions.
• The brand equity of large enterprises is under attack, with suspiciously registered
domains outpacing defensive brand-registered domains at a ratio of 20 to 1.
• Millions of users are facing malvertising campaigns that feature fake browser and
plugin updates laden with dangerous software and exploit kits.
• Cybercriminals are leveraging the lure of pirated content in their social media-based
attacks. Approximately 35% of these scams tempted users with video streaming and
movie downloads.
Knowing the landscape, we wanted to connect the dots to end-user knowledge levels
and explore the potential vulnerabilities for organizations that are not running measurable
security awareness training programs — meaning, they don’t have the tools in place to
know which employees are actively engaging with training and progressively learning
over time.
To make this connection, we commissioned a third-party survey of working adults from
around the world. Participants were representative of workers who are currently employed
by global organizations of all sizes: technology users who may or may not have a solid
grasp of cybersecurity best practices.
We asked five relatively simple, multiple-choice questions of 7,000 end users across
seven countries (the US, UK, France, Germany, Italy, Australia, and Japan). All questions
focused on fundamental cybersecurity concepts, including high-profile topics (like
phishing and ransomware), and lesser-known but frequently experienced attacks like
smishing (SMS/text message phishing) and vishing (voice phishing).
We found that, in general, end users are not familiar with commonly used infosecurity
terms. In addition — and of particular concern — many are relying on IT teams to
automatically discover and fix accidental downloads of malicious software. The lack of
clarity with regard to the role of IT in attack prevention could be giving users a false sense
of security and unnecessarily taxing infosec resources.
THE EXTENT OF END-USER RISK SECTION 1
SECTION 1: THE EXTENT OF END-USER RISK
HUMAN FACTOR REPORT Learn more about how cybercriminals are exploiting human
nature by attacking people rather than technology.
DOWNLOAD THE REPORT

STATE OF THE PHISH | 2019 5
INTRODUCTION THREE PILLARS OF CONTENT SECTION 1: THE EXTENT OF END-USER RISK
SECTION 2: WHAT INFOSEC PROS ARE EXPERIENCING
SECTION 3: SECURITY AWARENESS TRAINING: OUTCOMES AND OPPORTUNITIES
SECTION 1: THE EXTENT OF END-USER RISK
Five Questions
When it comes to the language that infosec teams are using when communicating to end
users, it’s important to recognize that there might be a fundamental disconnect. If the
terminology isn’t recognizable to users at a basic level, they are likely to tune out and think
the information doesn’t apply to them. If employees don’t understand what you’re asking
of them, they will not progress in terms of cyber hygiene.
Following, you will see global averages for each question we asked, as well as country-
by-country response comparisons. Multinational organizations in particular should note
the strengths and weaknesses of particular regions, as this information can help guide
assessment and training choices in global locations.
0%
10%
20%
30%
40%
50%
60%
70%
80%
JapanAustraliaItalyGermanyFranceUKUS
What Is Phishing?Global Averages
INCORRECT
I DON’T KNOW
CORRECT
66% 17% 17%
65%
72%
17%
11%
65%
18%
17%
64%
19%
17%
70%
12% 18
%
15% 21
%
17%
62%64
%
21%
22%
13%
0%
10%
20%
30%
40%
50%
60%
70%
JapanAustraliaItalyGermanyFranceUKUS
What Is Ransomware?
INCORRECT
I DON’T KNOW
CORRECTGlobal Averages
45% 22% 33%
56%
24%
20%
60%
22%
18%
40%
23%
37%
31%
21%
48%
36%
25%
39%
58%
19% 23
%
36%
20%
44%
JapanAustraliaItalyGermanyFranceUKUS
0%
10%
20%
30%
40%
50%
60%
70%
What Is Smishing?
INCORRECT
I DON’T KNOW
CORRECTGlobal Averages
23% 22% 55%
17%
30%
53%
18%
29%
53%
39%
11%
50%
26%
19%
55%
28%
22%
50%
17% 24
%59
%
15% 18
%
67%

STATE OF THE PHISH | 2019 6
INTRODUCTION THREE PILLARS OF CONTENT SECTION 1: THE EXTENT OF END-USER RISK
SECTION 2: WHAT INFOSEC PROS ARE EXPERIENCING
SECTION 3: SECURITY AWARENESS TRAINING: OUTCOMES AND OPPORTUNITIES
SECTION 1: THE EXTENT OF END-USER RISK
0%
10%
20%
30%
40%
50%
60%
70%
80%
JapanAustraliaItalyGermanyFranceUKUS
What Is Vishing?
INCORRECT
I DON’T KNOW
CORRECTGlobal Averages
18% 19% 63%
20%
21%
59%
18%
20%
62%
15% 19
%
66%
13%
25%
62%
24%
22%
54%
20%
14%
66%
12% 16
%
72%
0%
10%
20%
30%
40%
50%
60%
JapanAustraliaItalyGermanyFranceUKUS
True or False?If you accidentally install a virus or malicious software on your computer, your IT team will be notified by their monitoring tools so you can fix it.
FALSE
I DON’T KNOW
TRUEGlobal Averages
32% 34% 34%
35%
37%
28%
25%
43%
32%
35%
28%
37%
32% 37
%
31%
30% 35
%35
%
31%
40%
29%
37%
19%
44%

STATE OF THE PHISH | 2019 7
INTRODUCTION THREE PILLARS OF CONTENT SECTION 1: THE EXTENT OF END-USER RISK
SECTION 2: WHAT INFOSEC PROS ARE EXPERIENCING
SECTION 3: SECURITY AWARENESS TRAINING: OUTCOMES AND OPPORTUNITIES
SECTION 1: THE EXTENT OF END-USER RISK
Year-over-Year Comparisons
Last year, we surveyed just 3,000 technology users across three countries: the US, UK,
and Germany. Year-over-year comparisons between these countries’ respondents show
some bright spots: Ransomware awareness increased significantly in the US and the
UK (with Germany holding steady), and average understanding of smishing improved
among these users. But the news on phishing is mixed: The US gained some ground
and the UK remained relatively steady, but German technology users took a significant
step back.
75%50%25%0%
What Is Phishing? Percentage of correct answers
2018
2017
2018
2017
2018
2017
75%50%25%0%
2017
2018
2018
2017
2018
2017
What Is Ransomware?Percentage of correct answers
Germany
UK
US
Germany
UK
US65%
61%
73%
72%
64%
71%
56%
46%
55%
60%
31%
31%
5.2% EXECUTIVE
20%CORRECT
16%CORRECT
2018 2017
What Is Smishing?Average across US, UK, and Germany
RECOMMENDED: SPEAK THE RIGHT LANGUAGE, AND SPEAK IT FREQUENTLY
Infosec teams should make it a point to educate employees at a fundamental level.
Terminology that is commonly used in some circles is not necessarily recognizable across
all job functions ... even if those terms have a vital link to overall security postures.
Organizations must also recognize that workforce knowledge is not a constant,
particularly when it comes to learning new skills. This is because education isn’t a one-and-
done proposition; new concepts introduced via cybersecurity training must be reinforced
regularly over time in order for awareness to transition to understanding and, ultimately,
behavior change.

STATE OF THE PHISH | 2019 8
INTRODUCTION THREE PILLARS OF CONTENT SECTION 1: THE EXTENT OF END-USER RISK
SECTION 2: WHAT INFOSEC PROS ARE EXPERIENCING
SECTION 3: SECURITY AWARENESS TRAINING: OUTCOMES AND OPPORTUNITIES
The Millennial Question: Are ‘Digital Natives’ More Cyber Secure? Much has been made of the millennial generation and its impact on the global workforce.
Though much of the discussion has trended to philosophical differences between
preceding generations of workers, it’s worth considering the technological impact this
device-heavy, data-generating population will have on employer networks and systems.
Clearly, these digital natives, as a collective, are far more cyber-savvy than their
predecessors. Having been raised on smart devices and applications, there is little about
technology that intimidates them. Unfortunately, it appears that a high degree of cyber
comfort doesn’t necessarily lead to a clear understanding of cybersecurity.
SECTION 1: THE EXTENT OF END-USER RISK
Age 18-21
Age 54+
Age 22-37 Age 38-53
What Is Phishing?
INCORRECT
I DON’T KNOW
CORRECT
47%
28%
25%
73%
14%
13%
58%
20%
22%68%
16%
16%
Age 18-21
Age 54+
Age 22-37 Age 38-53
What Is Ransomware?
INCORRECT
I DON’T KNOW
CORRECT
40%34%
26%
52%
30%
18%
40%35%
25%
45%33%
22%
As you will note in the charts, millennials fall significantly behind at least one other
age group on all questions, and baby boomers — arguably the least cyber-savvy
demographic from our survey — outperform all others in fundamental understanding
of phishing and ransomware.
Note: According to Pew Research, millennials fell into the 22-37 age bracket and baby boomers
were 54 and older in 2018.

STATE OF THE PHISH | 2019 9
INTRODUCTION THREE PILLARS OF CONTENT SECTION 1: THE EXTENT OF END-USER RISK
SECTION 2: WHAT INFOSEC PROS ARE EXPERIENCING
SECTION 3: SECURITY AWARENESS TRAINING: OUTCOMES AND OPPORTUNITIES
SECTION 1: THE EXTENT OF END-USER RISK
Age 18-21
Age 54+
Age 22-37 Age 38-53
What Is Smishing?
INCORRECT
I DON’T KNOW
CORRECT
33%37%
30%
21%
61%18%
25%
49%
26%
22%
57%
21%
Age 18-21
Age 54+
Age 22-37 Age 38-53
What Is Vishing?
INCORRECT
I DON’T KNOW
CORRECT
27%
47%
26%
15%
69% 16%
21%
56%23%
16%
64% 20%
Some Thoughts on the Age Gaps ...• Baby boomers and Gen X respondents (ages 38-53) exhibit much stronger
recognition of phishing and ransomware, which we feel is likely due to longer-term
exposure to security awareness training about these topics.
• Millennials and their younger counterparts are strongest in recognition of smishing
and vishing, two more recent threat vectors — though less than a third of each group
responded correctly, so not a great showing overall.
• The bottom line is that organizations should not assume that younger workers
have an innate understanding of cybersecurity threats and/or best practices simply
because they are more cyber-savvy. Clearly, security awareness training is needed
across all age groups.

STATE OF THE PHISH | 2019 10
INTRODUCTION THREE PILLARS OF CONTENT SECTION 1: THE EXTENT OF END-USER RISK
SECTION 2: WHAT INFOSEC PROS ARE EXPERIENCING
SECTION 3: SECURITY AWARENESS TRAINING: OUTCOMES AND OPPORTUNITIES
APAC residents were five times more likely than those in EMEA
to experience 26+ smishing and vishing attacks per quarter.
WHAT INFOSEC PROS ARE EXPERIENCING SECTION 2
SECTION 2: WHAT INFOSEC PROS ARE EXPERIENCING
Each year, we survey our extensive database of infosec professionals — both customers
and non-customers — to find out what they’re experiencing, how phishing and other
social engineering attacks are impacting their organizations, and the tools they’re using to
manage end-user risk. This year, we received nearly 15,000 responses to our quarterly
surveys of security specialists from around the world. You will find the global averages for
each set of responses, along with key highlights for three of the world’s largest business
regions: North America, EMEA, and APAC.
How Often Are Organizations Experiencing Social Engineering Attacks? Across the board, infosec professionals identified a more active social engineering
landscape in 2018. The vast majority — 96% — said the rate of phishing attacks either
increased or stayed consistent throughout the year, and more respondents said they
experienced attacks during 2018 than in 2017. Phishing and spear phishing saw the
biggest increases, but all types of attacks happened more frequently than in 2017.
experienced vishing (voice phishing)and/or smishing (SMS/text phishing) in 2018.
told us they faced USB-based social engineering attacks via infected thumb drives.
of survey respondents said they experienced phishing attacks in 2018.
49% 4%83%An increase from
45% in 2017An increase from
3% in 2017An increase from
76% in 2017
of infosec professionals experiencedspear phishing in 2018.
of APAC infosec pros said phishing attacks increased in 2018, compared to 50% in North America and just 33% in EMEA.
64%An increase from
53% in 2017
58%
1-5
6-15
16-25
26+
80%60%40%20%0%
Social Engineering Beyond EmailOf the 49% of respondents who said they experienced vishing and smishing, 50% dealt only with vishing attacks, 12% saw just smishing, and 38% experienced both types of attacks. In addition, these attacks happened with regularity; following are the number of attacks organizations experienced each quarter, on average.
66%
19%
7%
8%

STATE OF THE PHISH | 2019 11
INTRODUCTION THREE PILLARS OF CONTENT SECTION 1: THE EXTENT OF END-USER RISK
SECTION 2: WHAT INFOSEC PROS ARE EXPERIENCING
SECTION 3: SECURITY AWARENESS TRAINING: OUTCOMES AND OPPORTUNITIES
FREQUENCY OF SPEAR PHISHING ATTACKS PER QUARTER
Not only did more infosec professionals experience spear phishing in 2018, but the
frequency of attacks also increased. Below, we compare the 2018 and 2017 average
numbers of attacks per quarter.
What Impact Is Phishing Having on Organizations? Since attackers use different phishing techniques and have different goals, organizations
experience varying impacts from phishing attacks. Below, we compare responses to the
question about phishing impacts from the last three years of our survey.
As you’ll note, credential compromise increased by more than 70% since 2017,
leapfrogging malware infections to become the most commonly experienced impact in
2018. This is of particular concern given that multiple services often sit behind a single
password. In addition, reports of data loss have more than tripled since 2016. We
believe the significant increases across all three categories since 2016 not only
speak to the growing phishing threat, but also to organizations’ heightened awareness of
— and attention to — the effect these attacks have on businesses.
SECTION 2: WHAT INFOSEC PROS ARE EXPERIENCING
0%
10%
20%
30%
40%
50%
60%
70%
Loss of Data
Malware Infections
Compromised Accounts
Phishing Impacts Experienced*
* Multiple responses permitted
2017
2016
2018
19%
63% 18%65%
38%
17%
49% 49%
27% 24%
13%7%
0%
10%
20%
30%
40%
50%
60%
70%
1-5 6-15 16-25 26+
2017
2018
Number of Spear Phishing Attacks per Quarter
59%
67%
27%21%
4% 4% 10% 8%
From a regional perspective, respondents in North America
were most likely (67%) to say they experienced spear
phishing in 2018, but they were least likely to face the highest
rate of attacks per quarter. APAC respondents were about
twice as likely as their North American counterparts to say
they faced 26+ quarterly spear phishing attempts.
APAC respondents were most likely to experience account
compromise and data loss, while EMEA respondents were
most likely to experience malware infections.
STATE OF THE PHISH | 2019 12
INTRODUCTION THREE PILLARS OF CONTENT SECTION 1: THE EXTENT OF END-USER RISK
SECTION 2: WHAT INFOSEC PROS ARE EXPERIENCING
SECTION 3: SECURITY AWARENESS TRAINING: OUTCOMES AND OPPORTUNITIES
57%
80%
We also asked our infosec contacts how they gauge the cost of phishing within their
organizations. A positive trend from last year: 80% of 2018 respondents said they
measure phishing costs, up from 77% in 2017.
What Are Organizations Doing to Combat the Phishing Threat? Naturally, infosec teams employ a wide range of technical tools — including email/spam
filters, URL rewriting, advanced malware analysis, and threat monitoring platforms — in
their defense-in-depth architectures. But they are also shifting to a more people-centric
model by proactively identifying phishing susceptibility, measuring end-user risk, and
delivering regular security awareness training. We’ve seen a much greater focus on
measurement and business intelligence over the past few years, and the good news is that
most infosec professionals say they can see their efforts paying off.
We also gave our respondents the option to comment about other phishing impacts
they experienced in 2018. Though some responses triggered our curiosity (for example,
one respondent was “not able to say” what was experienced, but said the impact was
“significant”), most were fairly straightforward. The most common write-in responses
about phishing impacts included the following:
• Financial losses, including fraudulent wire transfers, legal fees, and fines
• Compliance issues
• Greater burden on IT teams
• Damage to the reputation of infosec teams
• Investments in new technology, including multi-factor authentication (MFA)
• Frustration from customers and employees following a data breach
of organizations measure their susceptibility to phishing attacks.
A 31% increase since we first asked this question in 2014
of respondents said they train end users to identify and avoid phishing attacks.95%
By a wide margin, computer-based online training (83%) and simulated phishing attacks (75%) are respondents’ preferred security awareness training tools.
of organizations evaluate the risk individual end users pose to overall security postures.65%
The most common ways respondents gauge risk are via security awareness training performance (75%), business risk assessments (72%), technical policy violations (45%), and administrative policy violations (42%).
of infosec professionals said they have been able to quantify a reduction in phishing susceptibility
based on their training activities.
A 6% increase from 2017
SECTION 2: WHAT INFOSEC PROS ARE EXPERIENCING
Lost Productivity for Employees
Damage to Business Reputation
Not Applicable
Business Impacts through Loss of Proprietary Information
0% 20% 40% 60% 80%
How Infosec Teams Measure the Cost of Phishing*
* Multiple responses permitted
67%
54%
50%
20%

STATE OF THE PHISH | 2019 13
INTRODUCTION THREE PILLARS OF CONTENT SECTION 1: THE EXTENT OF END-USER RISK
SECTION 2: WHAT INFOSEC PROS ARE EXPERIENCING
SECTION 3: SECURITY AWARENESS TRAINING: OUTCOMES AND OPPORTUNITIES
Balancing Quality and Quantity We’ve long spoken about the need for regular cybersecurity education; once-a-year
programs simply will not drive knowledge retention or change end-user behaviors. Many
regulatory boards agree as well, which is why it’s good to see that the vast majority of
those we surveyed opt for monthly or quarterly training (though we’d love to see that
22% in the pie chart trickle down to single digits).
That said, more isn’t always more. It’s important to strike the right balance between
quality and quantity, and be thoughtful about how you structure your program. Repetition
and reinforcement are key components of learning, but peppering users with too many
messages can lead to confusion and frustration. This can contribute to training fatigue and
leave employees feeling like cybersecurity education is a waste of their time.
3%
34%
22%
41%
Biweekly
Monthly
Quarterly
Yearly
Security Awareness Training Tools: Frequency of Use
SECTION 2: WHAT INFOSEC PROS ARE EXPERIENCING
What about Ransomware? This is the first time we asked our database about ransomware attacks … just in time to
confirm what we’ve all been hearing: that ransomware took a back seat to other types of
attacks in 2018.
By a wide margin, EMEA respondents were most likely (21%) to say they experienced a ransomware attack in 2018.
of global respondents said they experienced a ransomware attack in 2018.10%
APAC organizations are most likely to rely on yearly training,
and they most commonly employ education methods that
offer fewer opportunities for users to “learn by doing” — like
cybersecurity videos and in-person training sessions. As such,
it’s not surprising to see that these respondents were the least
likely to say they’ve been able to quantify a reduction in their
end users’ phishing susceptibility.

STATE OF THE PHISH | 2019 14
INTRODUCTION THREE PILLARS OF CONTENT SECTION 1: THE EXTENT OF END-USER RISK
SECTION 2: WHAT INFOSEC PROS ARE EXPERIENCING
SECTION 3: SECURITY AWARENESS TRAINING: OUTCOMES AND OPPORTUNITIES
Here are our thoughts about implementing a consequence model: It’s not a decision to
be taken lightly, and it should be a collaborative process that includes management, HR,
and legal teams (and the latter two should take the lead if termination and/or monetary
penalties are on the table). As well, we highly recommend identifying ways to gauge
effectiveness to ensure that any ramifications tied to poor cybersecurity performance
— which can breed negative feelings among end users — are generating the positive
outcome that’s desired.
Not sure, we haven’t measured it.
54% ?
Yes, the consequences have made a difference.
39% No, they haven’t made a difference.
7%
SECTION 2: WHAT INFOSEC PROS ARE EXPERIENCING
ARE CONSEQUENCES EFFECTIVE?
This year, we asked an additional follow-up question to those infosec professionals who
said they’re using a consequence model: Do the punishments make a difference?
Consequence Models: Carrot vs. Stick The “carrot vs. stick” debate has become more heated over the past few years, with
organizations seeking every available opportunity to make end users take cybersecurity
seriously. There are impassioned supporters on both sides: Some firmly believe in positive
reinforcement, while others think the threat of punishment yields the best results.
We first asked our infosec contacts about consequence models for last year’s State
of the Phish Report. This year’s responses show an overall decrease in the use of
negative reinforcement techniques, as well as a move away from monetary penalties
for repeat offenders.
76% 74%
66%
0%
10%
20%
30%
40%
50%
60%
70%
80%
Monetary Penalty
TerminationRemoval of Access to Systems
Counseling from Manager
Additional Training**
* Multiple responses permitted ** New response option for 2018
Types of Consequences Enforced within Organizations*
2017
2018
N/A
19%
76% 74%
66%
26% 25%
12% 11% 2%5%
42%
of respondents said there are ramifications for users who continue to click on simulated phishing attacks. A 7% decrease year over year

STATE OF THE PHISH | 2019 15
INTRODUCTION THREE PILLARS OF CONTENT SECTION 1: THE EXTENT OF END-USER RISK
SECTION 2: WHAT INFOSEC PROS ARE EXPERIENCING
SECTION 3: SECURITY AWARENESS TRAINING: OUTCOMES AND OPPORTUNITIES
SECURITY AWARENESS TRAINING: OUTCOMES AND OPPORTUNITIES
SECTION 3
SECTION 3: SECURITY AWARENESS TRAINING: OUTCOMES AND OPPORTUNITIES
Our customers sent tens of millions of simulated phishing emails between October
2017 and September 2018 via our Security Education Platform. The data gathered from
this SaaS-based LMS allows us to share valuable insights into the security awareness
training tactics organizations are using and the progress they are making, both as a global
population and by industry segment.
As you peruse the statistics and analysis, consider how the awareness of end users in
these environments — which are actively embracing the use of phishing tests and training
content — is likely to compare to the 7,000 average working adults we surveyed. We also
encourage you to think about how taking a more people-centric approach to cybersecurity
can help to change behaviors, build a culture of security, and enable a stronger last line of
defense against phishing attacks throughout your organization.
RECOMMENDED: A GREATER FOCUS ON CREDENTIAL COMPROMISE
According to Proofpoint research, instances of credential phishing quadrupled between
Q2 and Q3 2018 — a dangerous trend given the serious ramifications of a successful
credential compromise attack.1
The average click rate of our customers’ data entry campaigns trended higher than the
9% average failure rate, though only about 5% of tested users ultimately submitted
credentials or other requested data. That said, any disclosure of credentials provides
an open pathway for cybercriminals. Given this mix of opportunity and vulnerability, we
recommend more frequent use of data entry-based phishing campaigns to test users’
susceptibility to these types of attacks.
Preferred Phishing Template Styles We observed a 9% average failure rate across all simulated phishing campaign styles
and all industries during our measurement period. This held steady from 2017, a good sign
that end users continue to apply learned skills and remain alert to different phishing lures
and traps.
Within our platform, administrators can choose from link-based, attachment-based, and
data entry-based templates, the latter of which ultimately request login credentials or other
sensitive information from recipients. Used in 69% of campaigns, link-based templates
were the overwhelming favorite in 2018.
average failure rate across all phishing campaigns and all industries. No change from 20179%
5.2% EXECUTIVE
69% 17%
LINK DATA ENTRY
14%
ATTACHMENT
Phishing Template Styles: Frequency of Use
of end users clicked links to take them to data entry forms.
11% ultimately submitted the data requested in the phishing test.
4%
1 Proofpoint, Protecting People: A Quarterly Analysis of Highly Targeted Cyber Attacks, Autumn 2018

STATE OF THE PHISH | 2019 16
INTRODUCTION THREE PILLARS OF CONTENT SECTION 1: THE EXTENT OF END-USER RISK
SECTION 2: WHAT INFOSEC PROS ARE EXPERIENCING
SECTION 3: SECURITY AWARENESS TRAINING: OUTCOMES AND OPPORTUNITIES
SECTION 3: SECURITY AWARENESS TRAINING: OUTCOMES AND OPPORTUNITIES
Usage frequency of these four template themes stayed relatively consistent compared
to last year (though Corporate template themes regained pole position over Consumer
themes). Failure rates also remained relatively consistent, with some minor year-over-year
fluctuations. The good news: The majority of gains made by our customers since 2016
are holding steady.
Preferred Phishing Template Themes Administrators can choose from (and customize) several hundred different templates
within our ThreatSim® Phishing Simulations library. However, as in years past, nearly all of
our customers’ phishing campaigns reflected one of four overarching template themes:
Corporate, Consumer, Commercial, and Cloud.
RECOMMENDED: MORE FREQUENT USE OF COMMERCIAL- AND
CLOUD-THEMED CAMPAIGNS
Point of fact: fluctuating failure rates aren’t necessarily a bad thing. Over time, you
should challenge your end users as they become more adept at recognizing and avoiding
“easier” simulated phishing attacks — and these activities are likely to result in higher
failure rates
(at least initially, following the introduction of more difficult phishing tests).
It’s also a great idea to use a variety of template styles and themes when testing users.
Cybercriminals are agile, and the threat landscape doesn’t stand still. In fact, Proofpoint
researchers recently identified that attackers targeted different job functions in Q3 2018
than they did in Q2.2
Users are likely to see an assortment of real-world phishing emails, which means that
organizations should regularly test employees (ideally on a monthly basis). Attackers often
use commercial- and cloud-based lures to trap unsuspecting users, so it’s concerning to
see so many organizations shying away from using these themes, particularly given the
steep rise of business email compromise (BEC) attacks across all industries.
These types of emails look like official corporate communications. Examples include full mailbox notifications, spam quarantines, benefits enrollment messages, invoices, and confidential HR documents.
CORPORATE EMAILS
Examples of these business-related emails include messages about downloading documents from cloud storage services, or directives to visit an online file sharing service to create or edit a document.
CLOUD EMAILS
These are business-related emails that are not organization-specific. Sample topics include shipping confirmations, invoice payments, and wire transfer requests.
COMMERCIAL EMAILS
These emails mimic messages seen by the general public on a daily basis. Examples include emails about frequent flyer accounts, bonus miles, photo tagging, frozen accounts, big-box store memberships, social networking, gift card notifications, and more.
CONSUMER EMAILS
0%
10%
20%
30%
40%
50%
CloudCommercialCorporate Consumer
Phishing Template Themes: Frequency of Use in 2018
45% 44%
8%3%
0%
5%
10%
15%
20%
CloudCommercialCorporate Consumer
2018
20172016
Phishing Template Themes: Average Failure Rates
11% 10% 10%8% 9%
15%
11% 12%
15%
8%6%
19%
2 Proofpoint, Protecting People: A Quarterly Analysis of Highly Targeted Cyber Attacks, Autumn 2018

STATE OF THE PHISH | 2019 17
INTRODUCTION THREE PILLARS OF CONTENT SECTION 1: THE EXTENT OF END-USER RISK
SECTION 2: WHAT INFOSEC PROS ARE EXPERIENCING
SECTION 3: SECURITY AWARENESS TRAINING: OUTCOMES AND OPPORTUNITIES
SECTION 3: SECURITY AWARENESS TRAINING: OUTCOMES AND OPPORTUNITIES
WHAT ARE THE MOST ‘SUCCESSFUL’ PHISHING CAMPAIGNS?
As we all know, some phishing tests are trickier than others. Here are some of
the subject lines that garnered the highest failure rates among end users for
campaigns that were sent to a minimum of 1,500 recipients:
Failure Rate Comparisons across Industries and Departments INDUSTRY DATA
Customers and non-customers alike want to know the same thing: How do their
organizations compare with others in their industry? In this section, you’ll find data about
16 different industries; we reveal average failure rates across all simulated attacks, as
well as failure rates specific to the three campaign styles (link-, attachment-, and data
entry-based) and the four campaign themes (Corporate, Consumer, Commercial, and
Cloud) noted prior.3
As you take note of the highs and lows in each category, it’s important to remember that,
for the most part, organizations primarily tested their users via link-based templates
that reflected Corporate or Consumer themes. With many of the highest failure rates
coming in the lesser-used categories, organizations should consider incorporating some
variety in their simulated phishing campaigns if they aren’t already doing so.
Manufacturing
Retail
Government
Technology
Telecommunications
Professional Services
Transportation
Defense Industrial Base
Healthcare
Energy
Insurance
Finance
Hospitality
0% 5% 10% 15% 20%
Education
Consumer Goods
Entertainment
Average Failure Rates by Industry
16%
11%
11%
11%
11%
11%
11%
10%
10%
10%
9%
8%
8%
8%
7%
6%
3 These 16 industries are representative of the majority of our customers, but not all. Some organizations self-identify as being a part of other less-common industry designations.
• Toll Violation Notification
• [EXTERNAL]: Your Unclaimed Property
• Updated Building Evacuation Plan
(also among the highest
failure rates in 2017)
• Invoice Payment Required
• February 2018 – Updated Org Chart
• Urgent Attention (a notification requesting
an email password change)

STATE OF THE PHISH | 2019 18
INTRODUCTION THREE PILLARS OF CONTENT SECTION 1: THE EXTENT OF END-USER RISK
SECTION 2: WHAT INFOSEC PROS ARE EXPERIENCING
SECTION 3: SECURITY AWARENESS TRAINING: OUTCOMES AND OPPORTUNITIES
SECTION 3: SECURITY AWARENESS TRAINING: OUTCOMES AND OPPORTUNITIES
Failure Rates by Template StyleLink Attachment Data Entry*
Consumer Goods 10% 3% Click rate: 14%Submit rate: 4%
Defense Industrial Base 13% 2% Click rate: 8%Submit rate: 4%
Education 13% 4% Click rate: 10%Submit rate: 4%
Energy 9% 7% Click rate: 10%Submit rate: 3%
Entertainment 14% 45% Click rate: 6%Submit rate: 2%
Finance 9% 1% Click rate: 9%Submit rate: 3%
Government 10% 6% Click rate: 10%Submit rate: 3%
Healthcare 8% 1% Click rate: 13%Submit rate: 6%
Hospitality 9% 1% Click rate: 11%Submit rate: 3%
Insurance 9% 1% Click rate: 10%Submit rate: 3%
Manufacturing 11% 6% Click rate: 11%Submit rate: 4%
Professional Services 9% 14% Click rate: 16%Submit rate: 4%
Retail 12% 6% Click rate: 11%Submit rate: 3%
Technology 10% 1% Click rate: 15%Submit rate: 5%
Telecommunications 11% 6% Click rate: 11%Submit rate: 3%
Transportation 9% <1% Click rate: 13%Submit rate: 5%
Failure Rates by Template ThemeCorporate Consumer Commercial Cloud
Consumer Goods 13% 10% 8% 3%
Defense Industrial Base 10% 30% N/A* N/A
Education 12% 9% 19% 11%
Energy 13% 6% 15% 7%
Entertainment 10% 10% 32% 10%
Finance 9% 6% 9% 5%
Government 11% 10% 11% 11%
Healthcare 10% 7% 12% 8%
Hospitality 8% 6% 3% N/A
Insurance 8% 8% 10% 5%
Manufacturing 11% 10% 13% 9%
Professional Services 12% 10% 9% 7%
Retail 13% 9% 13% 4%
Technology 15% 7% 9% 4%
Telecommunications 9% 13% 9% 10%
Transportation 10% 4% 16% 6%
* For data entry campaigns, the click rate indicates the percentage of users who clicked the link within the phishing test, and the submit rate is the percentage of users who ultimately submitted the requested data.
* “N/A” entries indicate that customers in this industry did not send any campaigns of this type.

STATE OF THE PHISH | 2019 19
INTRODUCTION THREE PILLARS OF CONTENT SECTION 1: THE EXTENT OF END-USER RISK
SECTION 2: WHAT INFOSEC PROS ARE EXPERIENCING
SECTION 3: SECURITY AWARENESS TRAINING: OUTCOMES AND OPPORTUNITIES
SECTION 3: SECURITY AWARENESS TRAINING: OUTCOMES AND OPPORTUNITIES
DEPARTMENT DATA
New this year, we examined departmental failure rates by isolating on our customers’ most
commonly used department classifications.4 All failure rates are based on a minimum of
2,500 emails sent (though some departments received upwards of 100,000 emails).
It’s concerning that some of the highest failure rates were seen within departments and
roles that are likely to have access to some of the most sensitive organizational
and customer data, as well as those that are responsible for many of an organization’s
most essential business activities. And the complexity of the story only deepens when we
compare these average failure rates to the most highly targeted departments identified by
Proofpoint in its Autumn 2018 Protecting People report.
RECOMMENDED: KNOW YOUR ROLES
In examining these different pieces of data — knowing that the landscape shifts from
organization to organization — it becomes clear that it’s to infosec teams’ advantage
to be able to detect which of their people/departments are being attacked, and how
cybercriminals are targeting specific job functions. When organizations can identify their
“Very Attacked People (VAPs),” they can then test specific departments and individuals,
isolate potential vulnerabilities, and deliver targeted security awareness training
assignments to improve knowledge and reduce risk. (See more about how VAPs vary by industry on the following page.)
Production/Operations
Management
R&D/Engineering
Accounting/Finance
Sales
Marketing/PR
Administrator/Assistant
HR
Sourcing/Purchasing
Facilities/Internal Support
Customer Service
Legal
Distribution
0% 5% 10% 15% 20% 25%
Highly Targeted Departments
Source: Proofpoint, Protecting People: A Quarterly Analysis of Highly Targeted Cyber Attacks, Autumn 2018
Sales
Security
Marketing
Procurement
Executive
Maintenance
Accounting
Legal
Operations
Treasury
Tax
Information Technology
Facilities
0% 5% 10% 15% 20%
Communication
Purchasing
Commercial
Finance
Human Resources
Engineering
Compliance
Business Development
Customer Service
Internal Audit
Average Failure Rates by Department
19%
14%
13%
13%
12%
12%
11%
11%
11%
11%
11%
10%
10%
10%
9%
9%
9%
9%
8%
8%
7%
7%
7%
4 This represents a subset of our full data set, as not all program administrators group their end users by department, and many organizations use proprietary terminology for department classifications.

STATE OF THE PHISH | 2019 20
INTRODUCTION THREE PILLARS OF CONTENT SECTION 1: THE EXTENT OF END-USER RISK
SECTION 2: WHAT INFOSEC PROS ARE EXPERIENCING
SECTION 3: SECURITY AWARENESS TRAINING: OUTCOMES AND OPPORTUNITIES
SECTION 3: SECURITY AWARENESS TRAINING: OUTCOMES AND OPPORTUNITIES
IDENTIFYING (AND REMEDIATING) VULNERABLE HUMAN TARGETS As we noted on page 19, cybercriminals target different roles and responsibilities within
different organizations and different industries. This means that VAPs (Very Attacked People)
will vary from industry to industry and organization to organization.
The two sample VAP charts below reflect anonymized data pulled from Proofpoint’s
proprietary threat analysis technology, which helps to detect, mitigate, and block advanced
threats that target people through email. The charts show the top 20 most-attacked inboxes
within a healthcare service provider and a manufacturer over a three-month span. The
variances between the two clearly illustrate attackers’ preparedness, agility, and tenacity.
It’s important to note the number of email aliases that are regularly targeted by attackers,
and the varying job functions cybercriminals seek to exploit. Third parties — those with
inroads to systems and data — also frequently find their way into the top tiers of VAP charts.
RECOMMENDED: GET TO KNOW YOUR VAPS
Proofpoint threat analysis allows organizations to identify the inboxes that face the largest
number of attacks from outsiders, as well as the ways cybercriminals are attempting
to breach defenses. Infosec teams can identify the people and places that are within
attackers’ crosshairs, and how many attacks are getting through. This offers a unique
opportunity to move away from assumptions about vulnerabilities, and shift focus to areas
that could be most prone to falling for attacks that slip past perimeter defenses.
A VAP chart is an eye-opener for many organizations … but it also provides an advantage
from a resource allocation standpoint. Infosec teams can use this information to quickly
deliver the right training to the right people at the right time, helping to close potential
knowledge gaps that could leave specific individuals open to compromise.
Nurse Practitioner General "Communications" Inbox
Rehabilitation Clinic Staff MemberVP of Strategy and Innovation
Senior Financial AnalystManaging Director of Global Partnerships
Communications DirectorClinical Resource Nurse
Admissions Officer for an Affiliated Health CollegeCEO of Third-Party Healthcare Staffing Agency
President and CEOPayroll Systems Analyst
Head of Learning and DevelopmentRegional Director
Registered Nurse in Specialty FieldGeneral HR InboxFinancial Analyst
Registered Nurse in Specialty FieldCentral Office Staff Member
Recruiting Manager
0 2k1k 3k 4k 5k 6k 7k
Example of a Healthcare VAP Chart
Malware Credential Phishing Keylogger Corporate Credential Phishing RAT
Downloader Consumer Credential Phishing Banking Stealer Ransomware
General "Info" InboxThird-Party Distributor's General "Sales" Inbox
Branch Manager of a Company DivisionCFO
Sales Inbox for Regional Service CenterRegional Sales Inbox for a Company Division
Sales Inbox for a Regional Service CenterRegional Sales Inbox for a Company DivisionRegional Sales Inbox for a Company Division
Inside Sales Rep for a Company DivisionBoard Member
Specialty Product ManagerGeneral "Sales" Inbox
Sales Manager for a Company DivisionCorporate Branch Manager
Regional Sales Processing InboxSales Inbox for a Regional Service Center
Corporate Regional Credit ManagerInside Sales Rep for a Company Division
Corporate Regional Sales Inbox
0 2k1k 3k 4k 5k 6k 7k
Example of a Manufacturing VAP Chart
Malware Credential Phishing Keylogger Corporate Credential Phishing
RATConsumer Credential Phishing Downloader Stealer
Unknown Credential PhishingBanking
* Please note that each targeted entity had a unique email address. The organization supports multiple countries and regions.
Note that attackers sent a wide variety of malicious content to this general inbox, hoping to catch recipients off guard.Note that the only
ransomware attacks targeted the HR inbox, which is likely to regularly receive legitimate attachments.

STATE OF THE PHISH | 2019 21
INTRODUCTION THREE PILLARS OF CONTENT SECTION 1: THE EXTENT OF END-USER RISK
SECTION 2: WHAT INFOSEC PROS ARE EXPERIENCING
SECTION 3: SECURITY AWARENESS TRAINING: OUTCOMES AND OPPORTUNITIES
SECTION 3: SECURITY AWARENESS TRAINING: OUTCOMES AND OPPORTUNITIES
Getting Personal with Phishing Tests As noted earlier in this report, our customers have the flexibility to utilize different campaign
styles, themes, and messages in their simulated phishing attacks. They also have the option
to use personalized fields within these tests. They can add first names and/or last names, as
well as redisplay the recipient’s email address within the body of the message.
We found that all types of personalization led to higher failure rates than the 9% average.
In particular, redisplaying email addresses inside of phishing tests seemed to lend a greater
credibility to messages, subsequently elevating the likelihood of end-user interactions.
How Program Maturity Influences Failure Rates Our data shows a terrific trend for organizations that are committed to longer-term security
awareness and training initiatives: Average failure rates fall steadily as programs
continue, with the biggest gains happening in programs that have been running for at
least a year. Even better, personalization factors have less impact over time (though they
have a big impact in less-mature programs).
Failure Rates by Template Theme
Average Failure Rate
Custom First Name
Custom Last Name
Email Address Redisplay
<6 months 12% 12% 15% 15%
6-12 months 11% 12% 15% 16%
12-24 months 9% 9% 12% 13%
>24 months 8% 9% 9% 9%
RECOMMENDED: DON’T STOP WITH EMAIL
Email remains the easiest and most frequent attack vector … but social engineering
techniques are also used outside of email to gather data and infiltrate your
organization. Cybercriminals regularly use pretexting, vishing, and smishing attacks
to try to penetrate your defenses.
Smishing should be of particular concern given the wide use of smart devices and
the increased adoption of BYOD policies. In our 2018 User Risk Report, more than
90% of the 6,000 working adults we surveyed have a smartphone, and 39% use
these devices for a blend of work and personal activities.
Simulated smishing campaigns are not commonly used by our customers; the
counts are in the tens of thousands, compared to the tens of millions of email
phishing tests sent. But average failure rates on these assessments are similar
to those for phishing: 7% of users clicked links sent to them via text message
during our measurement period.
With vishing and smishing attacks on the rise — and many organizations dealing
with more than 25 of these types of attacks each quarter — now is the ideal time
to consider how you are assessing your organization’s susceptibility to these
threats and how you are educating users to spot and avoid them.
RECOMMENDED: MAINTAIN CADENCE, EVEN AS PROGRAMS MATURE
We did note a point of concern in our analysis of maturity data: Organizations tend to send
fewer phishing tests once they reach the two-year mark of their program. We saw a fairly
significant drop off in activity levels of programs that are more than 24 months old compared
to programs that are 12 to 24 months old (which have the highest campaign frequency).
Those who reduce the number of phishing tests as their programs mature are likely to see
a plateau or even a regression in failure rates. The threat landscape is continually changing,
and new scams appear weekly (if not daily). Instead of backing off once you reach an
“acceptable” failure rate, continue to challenge end users with more difficult tests to keep
them thinking and learning. And be sure to keep an eye to emerging threats and work those
themes into your campaign cadence, regardless of how long you’ve been testing users.
Custom First Name10%
Custom Last Name11%
Email Address Redisplay13%
AVERAGE FAILURE RATES WITH PERSONALIZED FIELDS
STATE OF THE PHISH | 2019 22
INTRODUCTION THREE PILLARS OF CONTENT SECTION 1: THE EXTENT OF END-USER RISK
SECTION 2: WHAT INFOSEC PROS ARE EXPERIENCING
SECTION 3: SECURITY AWARENESS TRAINING: OUTCOMES AND OPPORTUNITIES
SECTION 3: SECURITY AWARENESS TRAINING: OUTCOMES AND OPPORTUNITIES
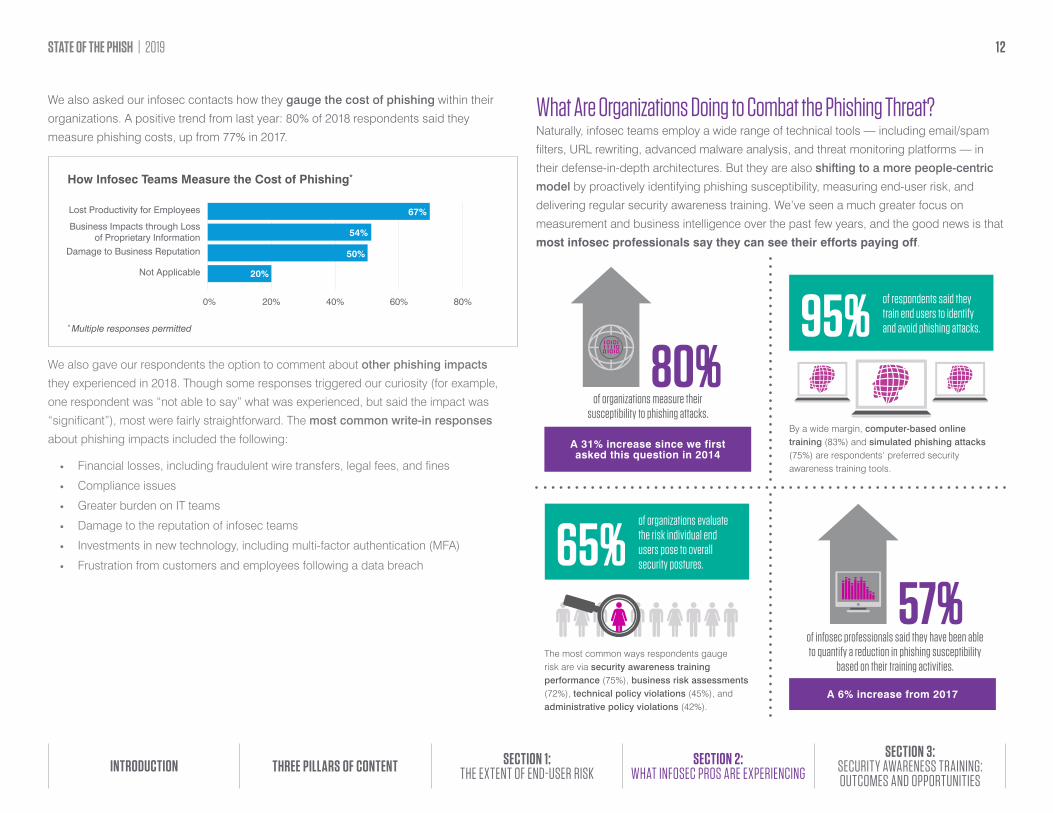
A Look at End-User Email Reporting We strongly believe that end-user email reporting is one of the best metrics for gauging
the effectiveness of security awareness training activities. An increase in reporting
indicates that employees are being more diligent and thoughtful about the emails they
receive. Their reporting also gives organizations an opportunity to capitalize on increased
awareness to quickly identify and remediate malicious messages that slip through
perimeter defenses.
suspicious emails during our measurement period.
5.5 million
A 180% year-over-year increase
End users reported nearly
of end-user reported emails were classified as potential
phishing emails.
59%
RECOMMENDED: SIMPLIFY REPORTING AND REMEDIATION
To best take advantage of increasing phishing awareness, organizations should make it
easy for end users to report suspicious messages and make it easy for response teams
to take action.
An email client add-in — like our PhishAlarm® button — gives users a quick, simple way
to forward messages to designated inboxes (with headers intact). In addition, automated
analysis of reported messages — like that afforded by PhishAlarm Analyzer — filters
whitelisted email addresses, system notifications, and simulated phishing attacks to allow
infosec teams to focus on emails that are most likely to be phishing attempts.
To streamline even further, we recommend incorporating a solution like CLEAR. Closed-
Loop Email Analysis and Response integrates email reporting and remediation,
reducing the time it takes to neutralize an active threat from days to minutes. Once
reported messages are analyzed against multiple intelligence and reputation systems,
malicious emails can be deleted or quarantined with a single click.
Conclusion: Focus on the Battles and the War We’ve all likely heard the phrase, “You won the battle but you lost the war.” But the
reality is that organizations must consistently win daily battles in order to have a
shot at being victorious in the war against cybercrime.
Like it or not, end users play a significant role in those battles. When phishing
attacks slip through network perimeters, people become the last line of defense.
End users should not be left unarmed when they find themselves at these binary
decision points: Should I or shouldn’t I click this link … download this attachment …
respond to this request for sensitive information? Those moments count.
Security awareness training provides an opportunity for organizations to be present
in those moments. Effective education and learned skills can become the “whispers”
in your end users’ ears, guiding them to make the right choices.

0119-001SATproofpoint.com/security-awarenessSecurity Awareness Training
ABOUT PROOFPOINTProofpoint, Inc. (NASDAQ:PFPT) is a leading cybersecurity company that protects organizations’ greatest assets and biggest risks: their people. With an integrated suite of cloud-based
solutions, Proofpoint helps companies around the world stop targeted threats, safeguard their data, and make their users more resilient against cyber attacks. Leading organizations of all
sizes, including more than half of the Fortune 100, rely on Proofpoint to mitigate their most critical security and compliance risks across email, the cloud, social media, and the web. No one
protects people, the data they create, and the digital channels they use more effectively than Proofpoint.
© Proofpoint, Inc. Proofpoint is a trademark of Proofpoint, Inc. in the United States and other countries. All other trademarks contained herein are property of their respective owners.