Embed Size (px)
Citation preview

Sector F
Water-Related Environment Management

i
Sector F. Water-Related Environment Management
Table of Contents
Pages
F.1 Introduction ............................................................................................................................. F-1
F.1.1 Study Area .............................................................................................................. F-1 F.1.2 Scope of the Water-related Environment Study ..................................................... F-1 F.1.3 Governing Policies and Regulations ...................................................................... F-2
F.1.3.1 National Issuances ...................................................................................... F-2 F.1.3.2 Local Issuances ........................................................................................... F-2
F.1.4 Institutional Responsibilities .................................................................................. F-2
F.2 Water-related Environmental Conditions ............................................................................. F-4
F.2.1 Natural Environment .............................................................................................. F-4 F.2.1.1 Water Catchments ....................................................................................... F-4 F.2.1.2 Ecologically Sensitive Areas ...................................................................... F-4
F.2.2 Socio-economic Environment ................................................................................ F-5 F.2.2.1 Population in the Study Area ...................................................................... F-5 F.2.2.2 Fishpond Aquaculture Areas ....................................................................... F-6 F.2.2.3 Livestock and Poultry Population ............................................................... F-6
F.3 Water Quality Status in the Study Area ................................................................................. F-8
F.3.1 Surface Water Quality ............................................................................................ F-8 F.3.1.1 Classification of Surface Waters ................................................................. F-8 F.3.1.2 Surface Water Quality of Pampanga and San Fernando Rivers ................. F-9 F.3.1.3 Surface Water Quality of Angat River ........................................................ F-9
F.3.2 Groundwater Quality ........................................................................................... F-10 F.3.3 Coastal/Marine Water Quality .............................................................................. F-13
F.4 Pollution Load Analysis ........................................................................................................ F-14
F.4.1 General ................................................................................................................. F-14 F.4.1.1 Definition of Pollution Load..................................................................... F-14 F.4.1.2 Gross BOD Pollution Generation in Manila Bay Area ............................. F-14
F.4.2 Methods and Assumptions for Estimating Pollution Load .................................. F-15 F.4.2.1 Domestic Pollution Load .......................................................................... F-15 F.4.2.2 Industrial Pollution Load .......................................................................... F-15 F.4.2.3 Agricultural Pollution Load ...................................................................... F-16
F.4.3 Estimated BOD Pollution Load ........................................................................... F-17 F.4.4 Relationship between Accumulated BOD Pollution Load and BOD Pollution
Flux in Rivers ....................................................................................................... F-18 F.4.5 Effect of Structural Measures on the Reduction of Pollution Load ..................... F-20
F.4.5.1 Structural Measures .................................................................................. F-20 F.4.5.2 Estimated BOD Pollution Load with or without Structural Measures ..... F-20
F.4.6 Summary of Results and Recommendations ....................................................... F-22
F.5 Issues and Concerns .............................................................................................................. F-23
F.5.1 Inadequate Water Quality Data Management ...................................................... F-23 F.5.1.1 Poor Water Quality Monitoring ................................................................ F-23

ii
F.5.1.2 Inadequate Inventory of Pollution Sources .............................................. F-23 F.5.1.3 Inadequate Inventory of Pollution Sources .............................................. F-23
F.5.2 Contamination of Surface, Ground and Coastal Waters ...................................... F-23 F.5.2.1 Inadequate Sewerage Treatment and Sanitation Facilities ....................... F-24 F.5.2.2 Inadequate Strategies to Control Pollution from Industrial, Agricultural
and Aquaculture Wastes ............................................................................ F-24 F.5.2.3 Poor Solid Waste Management ................................................................. F-24 F.5.2.4 Over-Extraction of Groundwater .............................................................. F-25 F.5.2.5 Siltation of Rivers ..................................................................................... F-25 F.5.2.6 Illegal Settlements along River Easements .............................................. F-25
F.5.3 Institutional Constraints ....................................................................................... F-25 F.5.3.1 Inadequate Institutional Capability ........................................................... F-25 F.5.3.2 Weak Regulatory Enforcement ................................................................. F-25 F.5.3.3 Weak Institutional Coordination ............................................................... F-25 F.5.3.4 Inadequate Public Awareness ................................................................... F-26
F.6 Plan for Water-related Environmental Management ......................................................... F-27
F.6.1 Goals of Water-Related Environment Management in the Basin ........................ F-27 F.6.1.1 Related National and Regional Policies, Strategies and Thrusts .............. F-27 F.6.1.2 Goals under the IWRM Plan .................................................................... F-27
F.6.2 Projects as Countermeasures to Address the Problems and Issues on Water-related Environment Management ............................................................ F-27
F.6.2.1 Project List ................................................................................................ F-27 F.6.2.2 Projects to Improve Inadequate Water Quality Data Generation and
Management ............................................................................................. F-29 F.6.2.3 Projects to Address Contamination of Surface, Ground and Coastal
Waters ....................................................................................................... F-32
List of Tables
List of Tables in Report
Table F. 1.1.1 Study Area ........................................................................................................ F-1 Table F. 2.1.1 Initial Components of the NIPAS in the Basin ................................................. F-4 Table F. 2.2.1 Population within the Study Area ..................................................................... F-5 Table F. 2.2.2 Projected Population within the Study Area ..................................................... F-5 Table F. 2.2.3 Fisheries Production within the Pampanga River Basin. ................................. F-6 Table F. 2.2.4 Fishpond Production Areas in the Pampanga River Basin ............................... F-6 Table F. 2.2.5 Livestock and Poultry Population within the Study Area ................................. F-7 Table F. 3.1.1 Use Classification of Surface Water Bodies ..................................................... F-8 Table F. 3.1.2 Guideline Values for Different Classes of Water .............................................. F-8 Table F. 3.1.3 Classification of Principal Rivers in Pampanga River Basin ........................... F-8 Table F. 3.1.4 Summary of Over-year Average Water Quality of Pampanga and San
Fernando River ................................................................................................. F-9 Table F. 3.1.5 Summary of Over-year Average Water Quality of Angat River,
2004-2008. ...................................................................................................... F-10 Table F. 3.2.1 Philippine National Standards for Drinking Water ......................................... F-10 Table F. 3.2.2 Results of Water Quality Test for Groundwater Managed by Water
Districts .......................................................................................................... F-11

iii
Table F. 3.2.3 TDS of Groundwater in Bulacan Province, 2005-2008. ................................ F-12 Table F. 4.3.1 BOD Pollution Load by Sources .................................................................... F-17 Table F. 4.3.2 BOD Pollution Load Density by Sub-Basins ................................................. F-18 Table F. 4.4.1 Relationship between Observed BOD Pollution Flux and
Accumulated BOD Pollution Load ................................................................ F-19 Table F. 4.4.2 Estimated BOD at Existing Monitoring Stations............................................ F-20 Table F. 4.5.1 Structural Measures to Reduce Domestic BOD Pollution Load .................... F-20 Table F. 4.5.2 Reduction of BOD Pollution Load ................................................................. F-21 Table F. 4.5.3 Estimated BOD at Existing Monitoring Stations............................................ F-21 Table F. 6.2.1 On-going, Proposed and Conceptual Programs and Projects to address
the Issues and Concerns on Water-related Environment Management .......... F-28 Table F. 6.2.2 On-going and Proposed Programs/Projects for Water-related
Environment Management Sector in the Study Area ..................................... F-29 Table F. 6.2.3 Existing and Proposed Monitoring Stations for Surface Water Quality ......... F-30 Table F. 6.2.4 Particulars of the Proposed Waste Transfer Stations. ..................................... F-34 Table F. 6.2.5 Status of Implementation of ESWM Plans as of 2008. .................................. F-38
List of Annex Tables
Annex-T F.3.1.1 Monitoring Record of Water Quality in Pampanga River ........................... FT-1 Annex-T F.3.1.2 Monitoring Record of Water Quality for San Fernando River .................... FT-2 Annex-T F.3.1.3 Monitoring Record of Water Quality for Angat River, 2004-2008 ............. FT-3 Annex-T F.3.2.1 Groundwater Quality Test Results for Wells Operated by Water
Districts(Bulacan Province) ........................................................................ FT-4 Annex-T F.3.2.2 Groundwater Quality Test Results for Wells Operated by Water
Districts(Pampanga Province) .................................................................... FT-5 Annex-T F.3.2.3 Groundwater Quality Test Results for Wells Operated by Water
Districts(Nueva Ecija Province) ................................................................. FT-6 Annex-T F.4.3.1 Pollution Load and Pollution Load Density by Water Balance
Catchment ................................................................................................... FT-7 Annex-T F.6.2.1 Project Profile for Water-related Environment Management ..................... FT-8
List of Figures
List of Figures in Report
Figure F. 3.2.1 DS of Groundwater in Each Province ............................................................ F-11 Figure F. 3.2.2 ossible Extent of Saltwater Intrusion Estimated by NWRC in 1982 .............. F-12 Figure F. 4.1.1 Definition of Pollution Load .......................................................................... F-14 Figure F. 4.3.1 Share of BOD Pollution Load by Source ....................................................... F-17 Figure F. 4.4.1 Monitoring Stations Used to Estimate the BOD Pollution Flux in the
Study Area ...................................................................................................... F-18 Figure F. 4.4.2 Relationship between Observed BOD Pollution Flux and
Accumulated BOD Pollution Load ................................................................ F-19 Figure F. 4.5.1 Reduction of BOD Pollution Load ................................................................. F-21 Figure F. 6.2.1 Conceptual Plan of the Proposed Cluster Waste Transfer Stations ................. F-34

iv
List of Annex Figures
Annex-F F.2.1.1 River Basin Catchments in the Study Area ................................................. FF-1 Annex-F F.4.3.1 Total Pollution Load by Water Balance Catchment .................................... FF-2 Annex-F F.4.3.2 Total Pollution Load Density by Water Balance Catchment ....................... FF-3 Annex-F F.4.5.1 Reduction of Domestic Pollution Load by Sub-Basin ................................ FF-4 Annex-F F.4.5.2 Reduction of Domestic Pollution Load by Water Balance Catchment ....... FF-5 Annex-F F.6.2.1 Locations of Projects for Water-related Environment Management ........... FF-6 Annex-F F.6.2.2 Location of Proposed Monitoring Stations for Surface Water Quality ..... FF-10

Sector F: Water-Related Environment Management
F-1
Sector F. Water-Related Environment Management
F.1 Introduction
F.1.1 Study Area
The whole study area includes the entire catchment of Pampanga river basin, which spans an area of 1,043,438ha. It covers 11 provinces and 90 cities and municipalities. Four major provinces, namely Nueva Ecija, Tarlac, Pampanga and Bulacan, comprise about 95% of the entire study area. The remaining area or roughly 5% includes minor portions of the provinces of Aurora, Zambales, Rizal, Quezon, Pangasinan, Bataan and Nueva Viscaya. Table F.1.1.1 shows the extent of the study area.
Table F. 1.1.1 Study Area
Province Area Coverage
Number of Cities/Municipalities (ha) Ratio to the study area
Nueva Ecija 501,335.0 48.0% 30
Pampanga 202,219.5 19.4% 22
Bulacan 202,056.7 19.4% 18
Tarlac 83,397.5 8.0% 6
Sub-total 95% 76 Aurora 19,473.0 1.9% 3
Zambales 7,381.1 0.7% 2
Rizal 4,220.3 0.4% 1
Quezon 3,023.4 0.3% 1
Pangasinan 2,606.9 0.2% 1
Bataan 1,401.7 0.1% 2
Nueva Viscaya 16,323.3 1.6% 4
Sub-total 5% 14 Total 1,043,438.5 100.0% 90 Source: JICA Study Team
F.1.2 Scope of the Water-related Environment Study
The water-related environment management sector study focuses primarily on the four major provinces listed above, namely Nueva Ecija, Tarlac, Pampanga and Bulacan. The scope of this study and the contents of this sector report include:
the legal and institutional framework governing water-related environment management
the natural and social conditions in the study area related to water quality and water-related environment
the status of surface, ground and coastal water quality
the potential water pollution sources and preliminary estimate of the pollution load in the Pampanga river basin
the issues and concerns pertaining to water quality that matter to most stakeholders
the on-going, proposed and conceptual water-related projects as components of the IWRM plan that will address these issues
the legal and institutional framework of water-related environment management

Sector F: Water-Related Environment Management
F-2
F.1.3 Governing Policies and Regulations
F.1.3.1 National Issuances
The following issuances constitute the policy and regulatory framework that govern the management of water-related environment:
PD 1152, the Philippine Environmental Code of 1978, provides the basic tenet for protecting and improving the quality of water resources.
PD 984, the Pollution Control Law of 1976 provides guidelines for the control of pollution from industrial sources.
RA 9275, the Clean Water Act of 2004, is the landmark law that provides for the comprehensive management of water quality by designating Water Quality Management Areas (WQMA), Non-Attainment Areas (NAA) and Attainment Areas (AA). It calls for the implementation of ten-year WQMA Action Plans with defined water quality targets and water pollution control strategies. It also reinforces the mandate of LGUs to provide sewerage treatment facilities for domestic wastewater. DENR Administrative Order (DAO) 2005-10 embodies the implementing rules and regulations (IRR) of the Clean Water Act.
DAO 90-34 governs the classification of water bodies according to beneficial use and the guideline values for parameters of water quality for such uses. DAO 90-35 prescribes the standards for certain industrial effluent parameters prior to discharge into receiving water bodies. Both issuances are now undergoing review in the light of the CWA.
PD 1586 of 1978 governs the implementation of the Philippine Environmental Impact Statement (EIS) System. It requires proponents of environmentally critical projects (ECPs) and projects located in environmentally critical areas (ECAs) to institute measures that will mitigate adverse impacts on water quality. The revised IRR (DAO 2003-30) require proponents to submit Self-Monitoring Reports (SMRs) to monitor compliance with effluent discharge regulations under the CWA.
RA 9003 or the Ecological Solid Waste Management Act (ESWMA) of 2000 and its IRR (DAO 2001-34) provide for an integrated approach to the management of solid waste. Under the act, LGUs are mandated to: (i) reduce waste volume by 25% by 2005 through segregation at source, reuse, recycling and composting; (ii) establish Materials Recovery Facilities (MRFs) in each barangay or cluster of barangays by 2004; (iii) convert open dumpsites into controlled dumpsites by 2004; and (iv) establish sanitary landfills by 2006.
F.1.3.2 Local Issuances
At the local level, the LGUs enact local ordinances in support of these national laws. San Fernando City for example promulgated an Ordinance in 2003 that prohibits dumping of waste in all waterways within the city. The implementation of the 10-Year ESWM Plans by each LGU is also supported by local ordinances at the LGU and barangay levels.
F.1.4 Institutional Responsibilities
Pursuant to the CWA, water quality management is within the purview of the DENR-Environmental Management Bureau. The EMB coordinates its efforts as necessary with other line bureaus and divisions of the DENR are such as the Mines and Geosciences Bureau (MGB), the forest Management Bureau (FMB), the Protected Area and Wildlife Bureau (PAWB), the National Solid Waste Commission (NSWC) and related national line agencies such as the National Water Resources Board (NWRB), the Department of Health (DOH), the Department of Science and Technology (DOST), the Department of Trade and Industry (DTI), the Department of Agriculture (DA) and the Philippine Coastguard, among others.
In Region III, the DENR-Environment Management Bureau (EMB) III spearheads the initiatives and programs meant to improve and safeguard water quality in the region. These programs are implemented in partnership with other public agencies, private businesses, academe, civil society groups, the LGUs and international development institutions. In particular, the implementation of

Sector F: Water-Related Environment Management
F-3
solid waste management and sanitation plans are devolved to the LGUs, by virtue of RA 9160 or the Local Government Code of 1990.

Sector F: Water-Related Environment Management
F-4
F.2 Water-related Environmental Conditions
F.2.1 Natural Environment
F.2.1.1 Water Catchments
The Study area is divided into three river basin catchments, namely; (a) Pampanga river basin, (b) Angat river basin and (c) Pasac river basin (refer to Annex-F F.2.1.1). The principal features of the catchments are described below.
(1) Pampanga River Basin
Pampanga river basin is the largest catchment with an area of 797,800 ha and the longest channel length of 265km. The river originates from Caraballo Mountains north of the study area and flows into Pantabangan dam. The upstream stretch of the river above the dam is often called as Pantabangan River. From the dam, the river flows southward and joins three tributaries, namely Coronell River, Penaranda River, and Rio Chico River before it finally empties into Manila Bay. Of the tributaries, Rio Chico River has the largest catchment area of 289,500ha. Rio Chico joins main Pampanga River near Mt. Arayat and Candaba Swamp. The latter has a maximum inundation area of about 33,000ha during a rainy season.
(2) Angat River Basin
Angat river basin originates from Sierra Madre Mountains and flows into Angat dam, Downstream of the dam, the river flows westward and finally empties into Manila Bay through Labangan Floodway. A small connecting channel, called Bagbag River, connects it with Pampanga River. The total length of Angat River is 153km and the total catchment area is about 108,500ha.
(3) Pasac River Basin
Pasac river basin is comprised of various river channels that drain the eastern slope of Mt. Pinatubo, namely Abacan-San Fernando River, Pasig-Potrero River and Porac-Gumain River before emptying into Manila Bay. The total catchment area of the river basin is about 137,100ha. In the lower reaches, the river system is connected with Pampanga Main River by Bebe-San Esteban Cutoff Channel. The morphology of the Pasac River has been greatly affected by the eruption of Pinatubo in 1991; the river alignments have been changed due to the mudflow produced by the eruption and the heavy sediment deposition in the river channel.
F.2.1.2 Ecologically Sensitive Areas
Table F.2.1.1 lists the three (3) national parks and five (5) watershed forest reserves that comprise the initial components of the national integrated protected area system. These areas are considered biologically important public lands representing critical habitats of rare and endangered species of plants and animals, bio-geographic zones and related ecosystems.
Table F. 2.1.1 Initial Components of the NIPAS in the Basin Protected Area Area (ha)
National Parks Minalungao NP 2,018.00 Biak-na-Bato NP 658.85 Mt. Arayat NP 3,715.23 Watershed Forest Reserve Angat WFR Pilot (Metro Water District) 55,709.10 Angat Watershed and Forest Range 6,600.00 Talavera Watershed Reservation 37,156.00 Pantabangan-Carranglan Watershed FR 84,500.00 Dona Remedios Trinidad/Gen. Tinio WFR 20,760.00
Total 211,117.18 Source: JICA Study Team, 2009; LGUs, 2008.

Sector F: Water-Related Environment Management
F-5
Of these sites, the Angat watershed forest reserves deserve particular attention as an integral part of the Sierra Madre Mountain Ranges. The Sierra Madre portion along Bulacan-Nueva Ecija-Quezon border together with Mt. Arayat National Park, Candaba Swamp and Manila Bay belong to the Greater Luzon Bio-geographic Region. Owing to its unique assemblage of flora and fauna, critical habitats and ecosystems, the GLBR is listed among the country’s biodiversity conservation priority areas identified in the National Bio-diversity Strategy and Action Plan (NBSAP). The NBSAP is included in the MTPDP and is integrated into the sectoral plans and programs of government agencies, in recognition of the Philippine’s unique position among the 17 mega-diversity countries in the world and a biodiversity hotspot1).
Particular attention should also be paid to the protection of Candaba Swamp, which was declared as a bird sanctuary pursuant to Resolution No. 51, series of 2004, by the Municipality of Candaba by virtue of its global importance as a wintering ground of international migratory bird species. For the same reason, Candaba Swamp is also a being registered under the Ramsar Convention as a candidate wetland of international importance. Together with Manila Bay, it is also nominated as an Important Bird Area by Birdlife International.
F.2.2 Socio-economic Environment
F.2.2.1 Population in the Study Area
Based on 2007 NSCB population census, there are presently 5.8 million people living in the study area (Table F.2.2.1). This represents 59.2% of the total population of Region III and roughly 6.5% of the country’s total population. Pampanga has the largest population of 2.2 million (about 38% of the basin’s total) followed by Nueva Ecija (1.7 million or 30% of the basin’s total), while Bulacan has 1.3 million (23%) and Tarlac 0.5 million (8%), respectively.
Table F. 2.2.1 Population within the Study Area Province 1980 1990 1995 2000 2007
Bulacan 594,920 769,921 908,081 1,072,923 1,299,400 Nueva Ecija 990,542 1,222,034 1,402,016 1,549,715 1,733,849 Pampanga 1,159,123 1,503,152 1,602,261 1,839,706 2,180,084 Tarlac 260,839 322,431 345,794 396,042 472,676 Others 28,922 40,365 43,744 51,150 70,148
Whole Study Area 3,034,346 3,857,903 4,301,897 4,909,536 5,756,156 Source: (1) Population Census, NSCB. (2) JICA Study Team (estimated population within study area)
The population is expected to grow to 7.6 million by 2025 in the four major provinces according to the estimated growth rates shown in Table F.2.2.2. The urban to rural population ratio is assumed to remain constant until 2025.
Table F. 2.2.2 Projected Population within the Study Area
Province Urban:Rural
ratio 2007 2008 2015 2020 2025
Bulacan 70:30 1,299,400 1,334,500 1,585,932 1,766,134 1,944,546 Growth Rate, % 2.70 2.70 2.41 2.18 1.94Nueva Ecija 50:50 1,733,849 1,761,894 1,960,159 2,092,188 2,210,272 Growth Rate, % 1.62 1.62 1.50 1.31 1.10Pampanga 68:32 2,180,084 2,219,624 2,493,194 2,675,248 2,843,509 Growth Rate, % 1.81 1.81 1.62 1.42 1.35Tarlac 44:56 472,676 480,708 536,813 573,956 607,911 Growth Rate, % 1.70 1.70 1.55 1.35 1.16Others 70,148
Total 5,756,156 5,796,726 6,576,098 7,107,526 7,606,238 Source: JICA Study Team
Sector F: Water-Related Environment Management
F-6
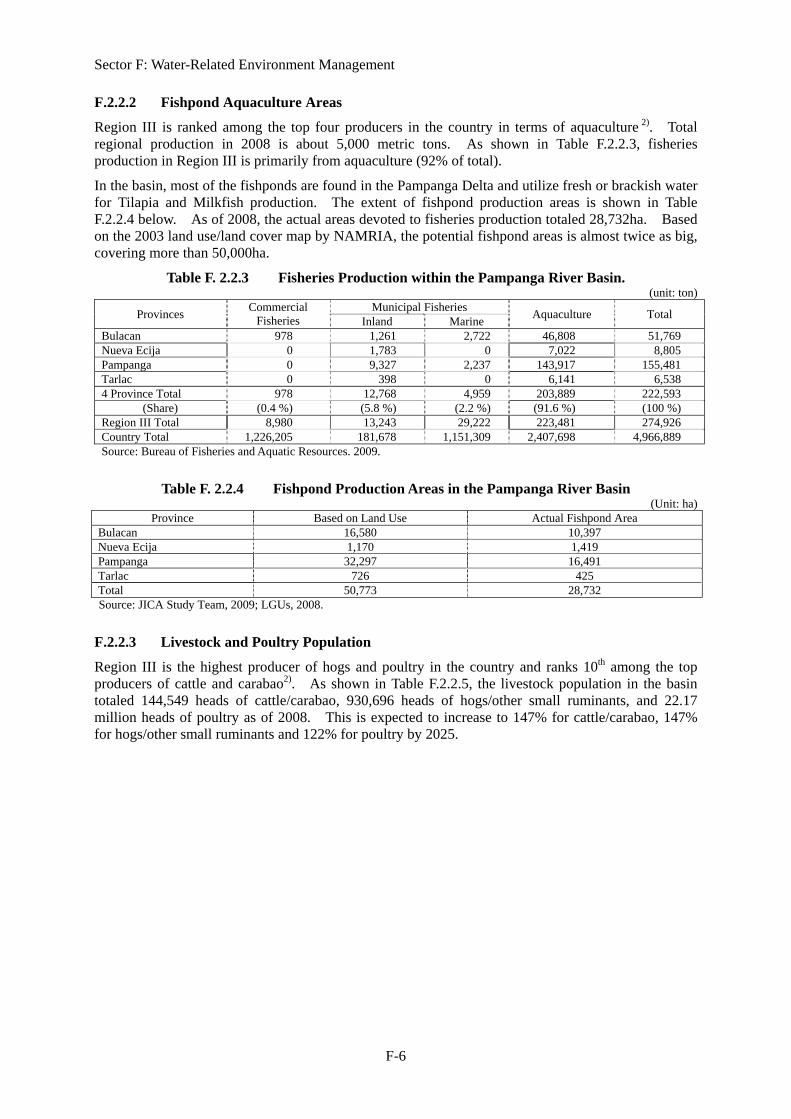
F.2.2.2 Fishpond Aquaculture Areas
Region III is ranked among the top four producers in the country in terms of aquaculture 2). Total regional production in 2008 is about 5,000 metric tons. As shown in Table F.2.2.3, fisheries production in Region III is primarily from aquaculture (92% of total).
In the basin, most of the fishponds are found in the Pampanga Delta and utilize fresh or brackish water for Tilapia and Milkfish production. The extent of fishpond production areas is shown in Table F.2.2.4 below. As of 2008, the actual areas devoted to fisheries production totaled 28,732ha. Based on the 2003 land use/land cover map by NAMRIA, the potential fishpond areas is almost twice as big, covering more than 50,000ha.
Table F. 2.2.3 Fisheries Production within the Pampanga River Basin. (unit: ton)
Provinces Commercial Fisheries
Municipal FisheriesAquaculture Total
Inland MarineBulacan 978 1,261 2,722 46,808 51,769 Nueva Ecija 0 1,783 0 7,022 8,805 Pampanga 0 9,327 2,237 143,917 155,481 Tarlac 0 398 0 6,141 6,538 4 Province Total 978 12,768 4,959 203,889 222,593
(Share) (0.4 %) (5.8 %) (2.2 %) (91.6 %) (100 %) Region III Total 8,980 13,243 29,222 223,481 274,926 Country Total 1,226,205 181,678 1,151,309 2,407,698 4,966,889 Source: Bureau of Fisheries and Aquatic Resources. 2009.
Table F. 2.2.4 Fishpond Production Areas in the Pampanga River Basin (Unit: ha)
Province Based on Land Use Actual Fishpond Area Bulacan 16,580 10,397 Nueva Ecija 1,170 1,419 Pampanga 32,297 16,491 Tarlac 726 425 Total 50,773 28,732 Source: JICA Study Team, 2009; LGUs, 2008.
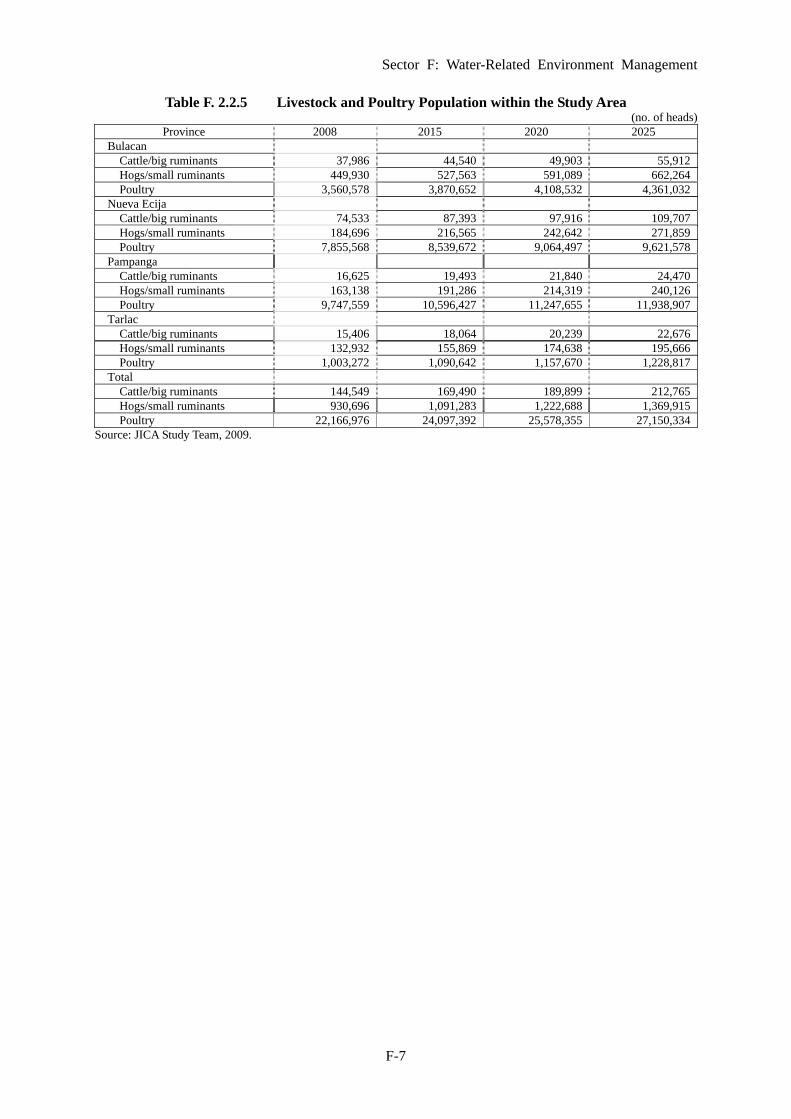
F.2.2.3 Livestock and Poultry Population
Region III is the highest producer of hogs and poultry in the country and ranks 10th among the top producers of cattle and carabao2). As shown in Table F.2.2.5, the livestock population in the basin totaled 144,549 heads of cattle/carabao, 930,696 heads of hogs/other small ruminants, and 22.17 million heads of poultry as of 2008. This is expected to increase to 147% for cattle/carabao, 147% for hogs/other small ruminants and 122% for poultry by 2025.
Sector F: Water-Related Environment Management
F-7
Table F. 2.2.5 Livestock and Poultry Population within the Study Area (no. of heads)
Province 2008 2015 2020 2025 Bulacan Cattle/big ruminants 37,986 44,540 49,903 55,912 Hogs/small ruminants 449,930 527,563 591,089 662,264 Poultry 3,560,578 3,870,652 4,108,532 4,361,032 Nueva Ecija Cattle/big ruminants 74,533 87,393 97,916 109,707 Hogs/small ruminants 184,696 216,565 242,642 271,859 Poultry 7,855,568 8,539,672 9,064,497 9,621,578 Pampanga Cattle/big ruminants 16,625 19,493 21,840 24,470 Hogs/small ruminants 163,138 191,286 214,319 240,126 Poultry 9,747,559 10,596,427 11,247,655 11,938,907 Tarlac Cattle/big ruminants 15,406 18,064 20,239 22,676 Hogs/small ruminants 132,932 155,869 174,638 195,666 Poultry 1,003,272 1,090,642 1,157,670 1,228,817 Total Cattle/big ruminants 144,549 169,490 189,899 212,765 Hogs/small ruminants 930,696 1,091,283 1,222,688 1,369,915 Poultry 22,166,976 24,097,392 25,578,355 27,150,334
Source: JICA Study Team, 2009.

Sector F: Water-Related Environment Management
F-8
F.3 Water Quality Status in the Study Area
Water quality status of the surface and ground water in the study area is assessed using available water quality monitoring records of the DENR-EMB III, Manila Water Company and the Water Districts. A preliminary evaluation of the river water quality is attempted here for three river systems only, for which adequate monitoring data are available. These include Pampanga (main stream), San Fernando River (a tributary of Pasac River) and Angat River (upstream, dam area). The DENR-EMB III also monitored Minalin River, Porac River and Angat River in 2007 and 2008. However, the data sets generated were inadequate and, hence, were not included in this evaluation.
F.3.1 Surface Water Quality
F.3.1.1 Classification of Surface Waters
Pursuant to DAO 90-34, the DENR classifies surface water bodies according to their best uses, as shown in Table F.3.1.1. This classification is based on the principle that the quality of waters in the Philippines shall be maintained in safe and satisfactory condition according to their best uses3). The standard concentration of the important parameters (Table F.3.1.2) is used as criterion for maintaining water quality based on such classification. Accordingly, the principal rivers in the study area are classified as shown in Table F.3.1.3.
Table F. 3.1.1 Use Classification of Surface Water Bodies Class AA Public Water Supply Class I – Intended primarily for waters having watersheds which are uninhabited
and otherwise protected and which require only approved disinfection to meet the Philippine Nat’l Standards for Drinking Water (PNSDW)
Class A Public Water Supply Class II – Intended as sources of water supply requiring conventional treatment to meet the PNSDW
Class B Recreational Water Class I – Intended for primary contact recreation (e.g., bathing, swimming, skin diving, etc.)
Class C Fishery Water, Recreational Water Class II, or Industrial Water Supply Class I – Intended for propagation and growth of fish & other aquatic resources, boating, manufacturing processes after treatment
Class D Industrial Water Supply Class I – Intended for agriculture, irrigation, livestock watering, etc. Source: DENR Administrative Order 90-34.
Table F. 3.1.2 Guideline Values for Different Classes of Water Parameter Unit Class AA Class A Class B Class C Class D
BOD (Max) mg/liter 1.0 5.0 5.0 7.0 (10.0) 10.0 (15.0) DO (Min) mg/liter 5.0 5.0 5.0 5.0 3.0 TDS (Max) mg/liter 500.0 1,000.0 -- -- 1,000.0 TSS (Max) mg/liter 25.0 50.0 (b) (c) (d) Notes: (a) -The numerical limits are yearly average values. Values enclosed in parentheses are maximum values., (b)
-Not more than 30% increase, (c) -Not more than 30 mg/liter increase, (d) -Not more than 60 mg/liter increase
Source: DENR Administrative Order 90-34.
Table F. 3.1.3 Classification of Principal Rivers in Pampanga River Basin Classification Name of River River System
Class AA No principal river is classified under this category - Class A Pampanga main stream (Upstream), Sacobia River Pampanga Main
Class B
Pampanga River (Downstream), Pantabangan River, Coronel River, Penaranda River , Talavera River
Pampanga Main
Angat River (Upstream) Angat Porac River (Downstream), San Fernando River Porac
Class C Rio Chico River Pampanga Main Angat River (Downstream), Angat
Class D No principal river is classified under this category - Source: DENR-EMB. 2007

Sector F: Water-Related Environment Management
F-9
As listed in Table F.3.1.3, majority of the rivers in the basin are classified as Class B. Two rivers are classified as Class A and two others as Class C; none is classified as Class D. Field reconnaissance suggests that Pampanga River and its tributaries are generally not seriously polluted yet. However, attention should be paid to the Abacan River, a tributary of Pasac River, which flows through Angeles City, the largest urban area in the basin. The JICA Study Team observed that the river gives off an offensive odor during dry season, suggesting unusually high BOD levels that would hardly meet the criteria for Class D water. Unfortunately, there are no monitoring records that could validate this observation in Abacan River.
F.3.1.2 Surface Water Quality of Pampanga and San Fernando Rivers
The data for Pampanga River and San Fernando River were obtained during the actual monitoring activities of the DENR-Environmental Management Bureau (EMB) Region III. For Pampanga main stream, samples were collected quarterly between 2003 and 2006 from three stations, all of which are located in Apalit Municipality, the province of Pampanga. As for San Fernando River, the water samples were taken quarterly in 2007-2008 from seven monitoring stations located within the city limits of San Fernando City. The monitoring data are shown in Annex-T F.3.1.1 to Annex-T F.3.1.2, and summarized in Table F.3.1.4.
As shown in Table F.3.1.4 all the parameters for Pampanga River except TSS are within the criteria for Class A water. Thus, the sections of the river upstream of the monitoring point at Apalit is preliminarily judged to be rather clean and may be considered eligible as future source of drinking water supply requiring conventional treatment only. The TSS of the river is, however, over the limit for Class A during the entire observation period. This may be attributed to the denudation of the watershed in the upper reaches of the river basin.
In contrast, the average BOD levels in San Fernando River were invariably beyond the limit for Class A water during the whole observation period. This could be attributed to the effluent discharges from various domestic/commercial and industrial sources in San Fernando City, one of the highly urbanizing cities in the basin. San Fernando River is thus judged to be ineligible even for Class D uses.
Table F. 3.1.4 Summary of Over-year Average Water Quality of Pampanga and San Fernando River
(unit: mg/liter) River Monitored/ DENR Criteria
for Water Usage Quarter/Year BOD DO TDS TSS
Pampanga River at Apalit Monitoring Point (Monitoring Period: 2003 -2006)
1st Quarter 3.7 6.4 234.8 74.0 2nd Quarter 2.7 3.9 322.4 107.8 3rd Quarter 7.0 5.9 345.9 111.5 4th Quarter 1.8 6.4 197.0 285.7 Throughout- Year 4.3 5.7 282.1 142.2
San Fernando River in the City Limit of San Fernando (Monitoring Period: 2007 -2008)
1st Quarter 18.6 7.2 429.0 56.3 2nd Quarter 24.8 5.4 539.0 62.6 3rd Quarter 10.6 4.7 - 48.3 4th Quarter 6.9 3.8 - 50.3 Throughout- Year 13.0 5.0 429.0 47.9
DENR Criteria for Water Usage of Class A < 5.0 >5.0 <1,000.0 <50.0 Source : DENR Region III, 2009
F.3.1.3 Surface Water Quality of Angat River
Angat River is classified as Class B in its upstream reaches and Class C in the downstream reaches. Angat River supplies the drinking water of Metro Manila. The Manila Water Company undertakes quarterly monitoring of DO, BOD, TDS and TSS and daily monitoring of fecal and total coliform in upstream Angat River. The results of the monitoring from 2004 to 2008 are found in Annex-T F.3.1.3 and are summarized in Table F.3.1.5 below.

Sector F: Water-Related Environment Management
F-10
Table F. 3.1.5 Summary of Over-year Average Water Quality of Angat River, 2004-2008. (unit: mg/li)
Monitoring Period BOD
(mg/li) DO (mg/li)
TDS (mg/li)
TSS (mg/li)
Fecal Coliform*
Total Coliform*
1st Quarter Ave. 0.68 7.7 89.3 15.3 2,290.6 4,319.5 Max 1.00 9.0 120.0 99.0 30,000.0 30,000.0
2nd Quarter Ave. 1.25 7.2 88.3 4.7 201.3 744.5 Max 5.00 8.5 119.0 8.0 1,300.0 2,800.0
3rd Quarter Ave. 0.94 7.3 100.3 18.0 335.7 1,325.2 Max 2.00 9.0 134.0 134.0 1,100.0 5,000.0
4th Quarter Ave. 1.92 7.7 84.9 80.9 5,864.1 22,989.4 Max 12.00 9.0 105.0 686.0 50,000.0 110,000.0
Throughout- Year Ave. 1.92 7.7 84.9 80.9 1,893.8 5,807.8Max 12.00 9.0 105.0 686.0 50,000.0 110,000.0
DENR Criteria for Water Usage of Class A < 5.0 > 5.0 <1,000.0 <50.0 100.0 1,000.0
Note: * Unit expressed in Most Probable Number (MPN) Source : Manila Water Company, 2009
As shown above, the average values for BOD, DO, TDS were mostly compliant with the DENR criteria for Class A waters. The average TSS values for the fourth quarter and over the five-year period, however, exceeded the DENR criteria. This again may be attributed to excessive sediment load due to the denudation of the upper reaches of the watershed. On the other hand, the average fecal and total coliform values invariably exceeded the guideline values, registering a maximum of 50,000MPN and 110,000MPN, respectively, over the 5-year period. This may be reflective of the extent of human encroachment into the Angat watershed.
The Manila Water Company also monitored the occurrence of heavy metals during the period. The results showed that all samples met the DENR criteria for all the metals, namely Cd, Cr, Cu Cn, Pb, Fe and Mn, for Class A waters
F.3.2 Groundwater Quality
The potable water supply in the study area is primarily sourced from groundwater. Hence, the present status of groundwater quality is preliminarily evaluated against the Philippine National Standards for Drinking Water (PNSDW) by the Department of Health (DOH). The updated PNSDW Limits for the major indices are as shown in Table F.3.2.1.
Table F. 3.2.1 hilippine National Standards for Drinking Water Index Unit PNSDW Limit
Turbidity NTU Less than 5 True Color Color Units Less than 5 pH pH 6.50 - 8.50 Hardness mg/liter CaCo3 Less than 300 Total Dissolved Solids (TDS) mg/liter Less than 500 Chloride mg/liter Less than 250 Iron Total Less than 1 Manganese Total Less than 0.40 Source: Revised Philippine National Standards for Drinking Water, the Department of Health (DOH), 2007.
The data for groundwater quality tests in 2005 to 2008 were collected from 180 production wells in 21 water districts. All of these sampling points are located in and around the study area and administratively belong to the three provinces of Bulacan, Pampanga and Nueva Ecija. The results of groundwater quality tests are shown in Annex-T F.3.2.1 to Annex-T F.3.2.3 and are summarized in Table F.3.2.2 below

Sector F: Water-Related Environment Management
F-11
Table F. 3.2.2Results of Water Quality Test for Groundwater Managed by Water Districts in and around the Study Area
Description Bulacan Pampanga Nueva Ecija Total 1. Number of Total Sampling Points 71 87 22 180 2. Number of Groundwater Samples above
PNSDW Limit
(1) Turbidity 2 0 0 2 (2) True Color 4 0 0 4 (3) Ph 8 1 0 9 (4) Hardness 3 0 2 5 (5) Total Dissolved Solids (TDS) 35 0 0 35 (6) Chloride 15 0 0 15 (7) Iron 1 1 0 2 (8) Manganese 0 9 1 9
Source: Water Districts
Heavy metal and bacteriological tests were also conducted, albeit on only a few of the groundwater samples collected. The tests indicate that heavy metals such as the arsenic, cadmium, and mercury were not detected. However, impermissible levels of coliform were detected in the raw groundwater samples from a few wells in Angeles City, which is the most densely populated area in the basin. Interview survey further assured that there were no reported or documented incidences of disease related to groundwater contamination in the study area.
Table F.3.2.2 shows that a substantial number of sampling points (35 out of 71) in the province of Bulacan yield high TDS and Chloride values that exceed the PNSDW limits. Seven of these samples (or about 10% of the whole samples) show extremely high TDS levels exceeding 1,000mg/liter, which is double of the PNSDW Limits (refer to Figure F.3.2.1). Both TDS and Chloride could be the indicators of high salinity. Judging from the extraordinary values of TDS and Chloride, it appears that saline intrusion has become a matter of grave concern and has constrained the availability of groundwater in some parts of the province of Bulacan for domestic water supply.
Bulacan Pampanga Nueva Ecija
PNSDW Limit (500mg/L)
0
200
400
600
800
1,000
1,200
1,400
1,600
1,800
2,000
Sampling Point
TD
S (m
g/L
)
Source: Water Districts
Figure F. 3.2.1 DS of Groundwater in Each Province
Recent reports indicate that the saline intrusion into the groundwater supply is generally observed in the shoreline areas. Based on the analysis of groundwater quality tests, geo-resistivity logs of aquifer formation, and other available relevant data conducted before 19824), the NWRC (now NWRB) estimated the possible extent of the saltwater intrusion in the study area during 1980s to be within 20km to 30km of the costal belt of Pampanga and Bulacan (see Figure F.3.2.2).

Sector F: Water-Related Environment Management
F-12
Source: NWRB
Figure F. 3.2.2 ossible Extent of Saltwater Intrusion Estimated by NWRC in 1982
Table F.3.2.3 shows the results of recent groundwater quality tests made between 2005 and 2008. This shows that of late, excessive levels of TDS in groundwater have been detected as far as San Miguel Municipality, which is located more than 40km away from the shoreline. Of the eight sampling points in the municipality, three indicate concentrations of TDS over the PNSDW limit. In addition to TDS and Chloride, the pH values of the groundwater samples also exceed the PNSDW limit in about 11% of the sampling points within the province of Bulacan. However, the excess in pH values are not significant compared to TDS. While excessive pH values may render water a little unpalatable, it is not a cause for concern in relation to human health.
Table F. 3.2.3 DS of Groundwater in Bulacan Province, 2005-2008.
Water District City/
Municipality
Approx. Distance from
Shore Line (km)
Number of Sampling
Points
Value of TDS
Max. Min. Ave.
Baliwang Baliwang 18 to 29 9 1,427 307 671 Calumpit Calumpit 11 to 19 13 668 182 423 Malolos Malolos 0 to 14 11 907 332 587 Hiyas Guiguinto 5 to 13 12 1,549 444 819 San Ildefonso San Ildefonso 31 to 45 6 664 524 580 Plaridel Plaridel 11 to 19 3 613 283 469 San Miguel San Miguel 40 to 62 8 879 370 517
Provincial Total 62 1,549 182 581 Source: Water Districts
In contrast to the province of Bulacan, both Pampanga and Nueva Ecija (with the exception of certain salinity-constrained areas in the coast of Pampanga) are likely to maintain the quality of groundwater for domestic use, as shown previously in Table F.3.2.3. A little concern is given to the impermissible concentration of Manganese detected in nine sampling wells in the province of Pampanga. Nevertheless, this concern is limited to a few water districts only. Moreover, excessive Manganese could be addressed by proper treatment and is therefore judged to be less crucial an issue for drinking water supply.

Sector F: Water-Related Environment Management
F-13
F.3.3 Coastal/Marine Water Quality
In 2008, the DENR-EMB Region III began monitoring the quality of coastal waters near the mouth of Manila Bay, which is the outlet of Pampanga River. This is in support of the initiative to clean up, rehabilitate and restore the life support functions of Manila Bay. The Supreme Court’s continuing mandamus specifically directed the restoration of the water quality of the Manila Bay to “Class SB” to render it fit for public bathing, swimming, skin diving, etc. and as spawning area for milkfish and similar species. Six monitoring stations were established within Pampanga Delta, specifically along the fishpond areas in the towns of Masantol, Macabebe and Sasmuan. The data sets, however, are still inadequate for purposes of analysis.
Nevertheless, available reports from water quality assessments done in adjoining coastal areas of Manila Bay including Navotas, Metro Manila and Cavite, confirm the risks to human health posed by high fecal and total coliform and other toxic contaminants that are contributed by domestic, agricultural and industrial wastes from areas draining into Manila Bay5),6),7) .
As will be discussed in the succeeding section, Pampanga river basin contributes relatively less in terms of total pollution load compared to other watersheds that feed into Manila Bay. Nevertheless, pollutants in the coastal environment are constantly being remobilized. Landward transgression of sea water may still cause the re-deposition of contaminants from the bay into nearby coastal areas of Pampanga and Bulacan owing to tidal and flood events.

Sector F: Water-Related Environment Management
F-14
F.4 Pollution Load Analysis
F.4.1 General
BOD pollution load is estimated in order to assess the present and future conditions of water quality in the study area. BOD is usually selected as a parameter to preliminary estimate the current organic pollution load in the study area. Firstly, the assumptions used for estimating pollution load are shown. Next, the pollution load entering water body is estimated for both present and future conditions without considering the natural reduction processes of BOD in rivers. The estimated present pollution load is then compared with the observed average pollution flux in rivers (based on monitoring data), in order to roughly evaluate the reduction rate of BOD pollution load in rivers through chemical and biological process. Applying the evaluated reduction rate, the total pollution load entering Manila Bay as well as future water quality condition is finally estimated.
F.4.1.1 Definition of Pollution Load
The pollution load could be defined as follows, considering the processes of generation, transport and decomposition in a river basin (refer to Figure F.4.1.1).
Gross pollution generation
The pollution generated at source in a river basin
Pollution load
Amount of pollutant as it enters a water body after reduction through on-site/off-site treatment facilities as well as natural processes before entering the water body
Pollution flux in water body
Amount of pollutant as a flux in a river after reduction through chemical and biological decomposition processes in a water body
Gross Pollution Generation
Pollution Flux in Water Body
Catchment
Red
uctio
n in
wat
er b
ody
Reduction before entering water body
Pollution Load
Water body
Gross Pollution Generation
Pollution Flux in Water Body
Catchment
Red
uctio
n in
wat
er b
ody
Reduction before entering water body
Pollution Load
Water body
Source: JICA Study Team, 2009.
Figure F. 4.1.1 Definition of Pollution Load
F.4.1.2 Gross BOD Pollution Generation in Manila Bay Area
According to the Philippine Environment Monitor, 20038), the combined gross BOD pollution generated by the NCR, Region III and Region IV, all of which drain into to Manila Bay, is estimated at
Sector F: Water-Related Environment Management
F-15
856,700 tons/year. Region III, which includes the study area, contributes 212,700 tons/year or 25% of the combined total pollution load from the NCR, Region III and Region IV.
F.4.2 Methods and Assumptions for Estimating Pollution Load
In this study, the BOD pollution load is estimated basically by following the methods applied in the on-going Capacity Development Project on Water Quality Management (CDPWQM) by DENR supported by JICA9). In the CDPWQM, the Marilao-Meycauayan-Obando (MMO) river system, which is adjacent to the study area, has been selected as the pilot Water Quality Management Area (QWMA) for Region III.
In the CDPWQM, BOD pollution load is firstly estimated. The reduction of BOD through chemical and biological decomposition processes in a water body is then considered in a separate model for water quality analysis. In the present study, the BOD pollution load is estimated using the same assumptions given in the CDPWQM.
F.4.2.1 Domestic Pollution Load
To estimate the domestic pollution load, the unit load and reduction factors employed in CDPWQM are applied.
Unit domestic BOD pollution generation = 37 grams-BOD/person/day
Pollution generation reduction factors:
Reduction through on-site treatment facility (Septic tank):
Septic tank not covered by SpTP = 10% BOD reduction
Septic tank covered by septage treatment plant (SpTP) or septage treatment and disposal facility = 30% BOD reduction
EcoSan toilet = 50% BOD reduction (Tentative estimate by the Study Team)
Reduction through off-site treatment facility (Sewerage treatment plant):
Population covered by STP = 95% BOD reduction
BOD reduction through natural processes:
Urban areas = 20%
Rural areas = 40%
The present and future population is given earlier in Table F.2.2.2. There are presently no on-site SpTP in the study area. It is assumed that by 2025, 100% of the households will be provided with sanitary toilets. The coverage of septic tank and off-site treatment facilities are given in the sector report on municipal water supply, sewerage and sanitation.
The domestic BOD pollution load is estimated using the following equation.
Domestic BOD pollution load (kg-BOD/day) = Population (person) x 0.037 (kg-BOD/person/day) x Reduction factor (facilities) x Reduction factor (natural processes)
F.4.2.2 Industrial Pollution Load
There are not enough data for estimating the industrial pollution load in the study area, unfortunately. It is thus assumed that the ratio of the industrial BOD pollution load to the domestic BOD pollution load be same as that of MMO river system, which is next to the study area. According to the CDPWQM9), the ratio is 27.2%.
The industrial BOD pollution load is estimated as follows:

Sector F: Water-Related Environment Management
F-16
Industrial BOD pollution load (kg-BOD/day) = 0.272 x Domestic BOD pollution load (kg-BOD/day)
As a point of reference, the industrial to domestic pollution load ratio is estimated at 27.5% for Metro Manila10), which is understandably more urbanized in setting than the MMO river system. The estimation of industrial pollution load for Pampanga river basin should be revised when enough data becomes available in future.
F.4.2.3 Agricultural Pollution Load
(1) Fishpond
The following unit load is applied, following the CDPWQM9).
Unit BOD pollution load = 2.74 (kg-BOD/ha/day)
The extent of fishpond areas is given in Section F.2.2.4. The fishpond BOD pollution load is estimated using the following equation.
Fishpond BOD pollution load (kg-BOD/day) = Fishpond area (ha) x 2.74 (kg-BOD/ha/day)
(2) Livestock
The following unit BOD pollution generation is applied based on WHO guideline11). For commercial farms, the reduction of BOD through treatment facilities is considered. The runoff rate is also considered.
Unit BOD pollution generation:
Cattle/Carabao = 250.0 (kg-BOD/head/year)
Other kinds of livestock = 28.4 (kg-BOD/head/year)
Poultry = 1.4 (kg-BOD/head/year)
Pollution generation reduction factors through on-site treatment facility for commercial farms = 30% BOD reduction
Runoff rate = 0.10
The number of livestock population is given in Section F.2.2.5. The coverage of on-site facilities is assumed to be 22%, based on the information on the number of effluent discharge permits. The livestock BOD pollution load is estimated using the following equation:
Livestock pollution load (kg-BOD/year) = Number of Livestock (head) x Unit BOD pollution generation (kg-BOD/head/year) x Reduction factor (facilities) x 0.10 (Runoff rate)
(3) Cultivated area
The following unit BOD pollution generation is applied based on WHO guideline11). The runoff rate is considered.
Unit BOD pollution generation = 2,459.6 (kg-BOD/km2/year)
Runoff rate = 0.10
The cultivated area is estimated by the existing land cover. It is assumed that it will be kept constant until 2025. The cultivated BOD pollution load is estimated using the following equation:
Cultivated BOD pollution load (kg-BOD/year) = Cultivated area (km2) x 2,459.6(kg-BOD/km2/year) x 0.10 (Runoff rate)

Sector F: Water-Related Environment Management
F-17
F.4.3 Estimated BOD Pollution Load
The estimated present total BOD pollution load is about 103,000tons/year. It is expected to increase to 127,000tons/year by 2025, or about 124% increase from the present condition. Table F.4.3.1 and Figure F.4.3.2 show the BOD pollution load from different sources. At present, domestic and industrial sources contribute 64% of the total pollution load. It would increase to 68% in the future (2025). It should be noted that contribution from the fishponds is fairly large, which shares 26% of the total pollution load.
Table F. 4.3.1 BOD Pollution Load by Sources Domestic Industrial Fishpond Livestock Cultivated Total
Present (2008) (tons/year) 51,966 14,153 26,204 9,050 1,151 102,522
Future (2025) (tons/year) 68,309 18,604 26,204 12,597 1,151 126,864
Increasing rate (%) 131% 131% 100% 139% 100% 124%
Source: JICA Study Team
2008
Domestic50%
Industrial14%
Fishpond26%
Livestock9%
Cultivated1%
2025
Domestic53%
Industrial15%
Fishpond21%
Livestock10%
Cultivated1%
Source: JICA Study Team
Figure F. 4.3.1 Share of BOD Pollution Load by Source
The total BOD pollution load in the MMO river system, which has already been designated as WQMA, was estimated at 17,000tons/year at the present condition9). It is smaller than Pampanga river basin. However, the present BOD pollution load density (pollution load per unit area) in the MMO river system is calculated at 362kg/day/km2. This is over 10 times the estimated pollution load density in the PRB, which is only 27 kg/day/km2.
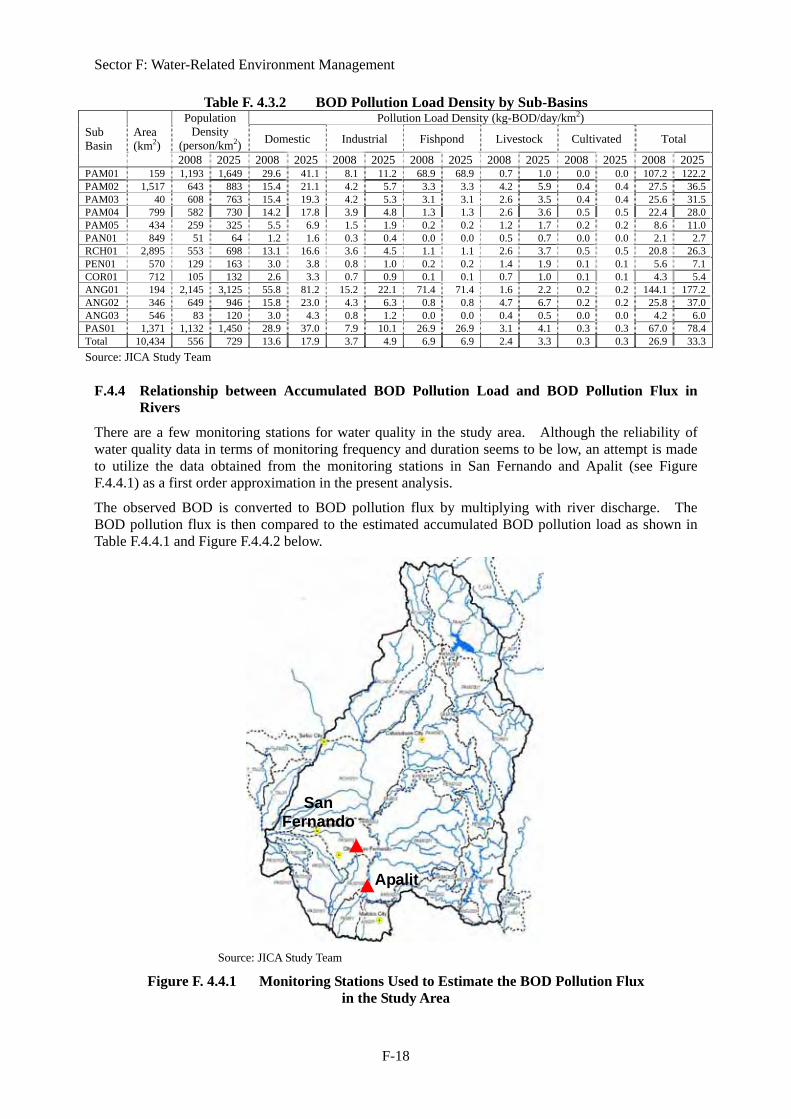
Table F.4.3.2 shows the BOD pollution load density by sub-basins. In general, the lower reaches of Pampanga river basin have higher BOD pollution load density. This is mainly because of the existence of high-density urban areas and widely extended fish pond areas downstream of the basin. The pollution load and pollution load density by water balance catchment as well as sub-basin is presented in Annex-T F.4.3.1 and Annex-F F.4.3.1 to Annex-F F.4.3.2.
Sector F: Water-Related Environment Management
F-18
Table F. 4.3.2 BOD Pollution Load Density by Sub-Basins
Sub Basin
Area (km2)
Population Density
(person/km2)
Pollution Load Density (kg-BOD/day/km2)
Domestic Industrial Fishpond Livestock Cultivated Total
2008 2025 2008 2025 2008 2025 2008 2025 2008 2025 2008 2025 2008 2025PAM01 159 1,193 1,649 29.6 41.1 8.1 11.2 68.9 68.9 0.7 1.0 0.0 0.0 107.2 122.2 PAM02 1,517 643 883 15.4 21.1 4.2 5.7 3.3 3.3 4.2 5.9 0.4 0.4 27.5 36.5 PAM03 40 608 763 15.4 19.3 4.2 5.3 3.1 3.1 2.6 3.5 0.4 0.4 25.6 31.5 PAM04 799 582 730 14.2 17.8 3.9 4.8 1.3 1.3 2.6 3.6 0.5 0.5 22.4 28.0 PAM05 434 259 325 5.5 6.9 1.5 1.9 0.2 0.2 1.2 1.7 0.2 0.2 8.6 11.0 PAN01 849 51 64 1.2 1.6 0.3 0.4 0.0 0.0 0.5 0.7 0.0 0.0 2.1 2.7 RCH01 2,895 553 698 13.1 16.6 3.6 4.5 1.1 1.1 2.6 3.7 0.5 0.5 20.8 26.3 PEN01 570 129 163 3.0 3.8 0.8 1.0 0.2 0.2 1.4 1.9 0.1 0.1 5.6 7.1 COR01 712 105 132 2.6 3.3 0.7 0.9 0.1 0.1 0.7 1.0 0.1 0.1 4.3 5.4 ANG01 194 2,145 3,125 55.8 81.2 15.2 22.1 71.4 71.4 1.6 2.2 0.2 0.2 144.1 177.2 ANG02 346 649 946 15.8 23.0 4.3 6.3 0.8 0.8 4.7 6.7 0.2 0.2 25.8 37.0 ANG03 546 83 120 3.0 4.3 0.8 1.2 0.0 0.0 0.4 0.5 0.0 0.0 4.2 6.0 PAS01 1,371 1,132 1,450 28.9 37.0 7.9 10.1 26.9 26.9 3.1 4.1 0.3 0.3 67.0 78.4 Total 10,434 556 729 13.6 17.9 3.7 4.9 6.9 6.9 2.4 3.3 0.3 0.3 26.9 33.3
Source: JICA Study Team
F.4.4 Relationship between Accumulated BOD Pollution Load and BOD Pollution Flux in Rivers
There are a few monitoring stations for water quality in the study area. Although the reliability of water quality data in terms of monitoring frequency and duration seems to be low, an attempt is made to utilize the data obtained from the monitoring stations in San Fernando and Apalit (see Figure F.4.4.1) as a first order approximation in the present analysis.
The observed BOD is converted to BOD pollution flux by multiplying with river discharge. The BOD pollution flux is then compared to the estimated accumulated BOD pollution load as shown in Table F.4.4.1 and Figure F.4.4.2 below.
Source: JICA Study Team
Figure F. 4.4.1 Monitoring Stations Used to Estimate the BOD Pollution Flux in the Study Area
Apalit
San Fernando

Sector F: Water-Related Environment Management
F-19
Table F. 4.4.1 Relationship between Observed BOD Pollution Flux and Accumulated BOD Pollution Load
Monitoring Station
Drainage Area (km2)
Observed BOD (Annual Average) (mg/liter)
River Discharge (Annual Average) (m3/s)
River BOD pollution Flux (kg-BOD/ day)
Accumulated BOD Pollution Load (kg-BOD/ day)
Remarks
Apalit 7,819 2.7 297.8 69,141 132,762
- Pollution Load: accumulate upstream of PAM02 - Observed BOD: Annual average of 2003-2006 excluding strange values - River discharge: estimated by specific discharge curve
San Fernando
398 13.0 10.2 11,412 29,958
- Pollution Load: PAS0103 - Observed BOD: Annual average of 2007-2008 - River discharge: estimated by rainfall- runoff model
Source: JICA Study Team
0
10,000
20,000
30,000
40,000
50,000
60,000
70,000
80,000
0 50,000 100,000 150,000
Accumulated BOD Pollution Load(kg-BOD/day)
1
0.514
Riv
erB
OD
Poll
utio
nFl
ux
(kg-
BO
D/d
ay)
Source: JICA Study Team
Figure F. 4.4.2 Relationship between Observed BOD Pollution Flux and Accumulated BOD Pollution Load
From the figure, the reduction rate through chemical and biological decomposition processes in the water body could be assumed to be 49% on average. For Pampanga river basin, the pollution flux could be assumed as:
River BOD Pollution Flux = 0.514 x Accumulated BOD Pollution Load
Taking into account this reduction rate through chemical and biological decomposition processes in the water body, the total BOD pollution flux from the study area that reaches Manila Bay is estimated to be 53,000tons/year at present (2008) and 65,000tons/year in future (2025).
Water quality in rivers is also related to availability of water resources. It is expected that provinces in the lower reaches of Pampanga river basin may need to utilize the surface water in the future as a source for drinking water. Thus, the good quality of surface water should be maintained for its best use as drinking water supply.
Assuming constant river discharge conditions in the future, the BOD values at the present monitoring stations can be estimated by applying the reduction rate through chemical and biological decomposition processes in the water body. Table F.4.4.2 shows the estimated BOD values and water quality classification of downstream Pampanga River and San Fernando River in terms of BOD.
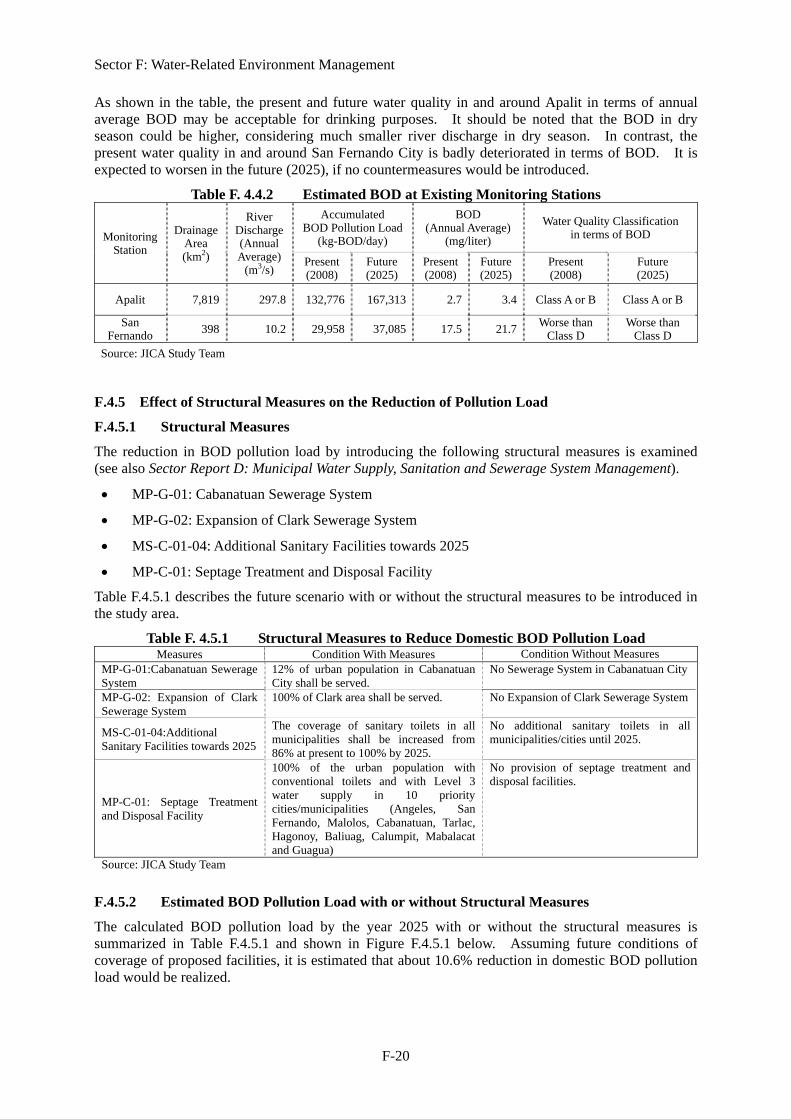
Sector F: Water-Related Environment Management
F-20
As shown in the table, the present and future water quality in and around Apalit in terms of annual average BOD may be acceptable for drinking purposes. It should be noted that the BOD in dry season could be higher, considering much smaller river discharge in dry season. In contrast, the present water quality in and around San Fernando City is badly deteriorated in terms of BOD. It is expected to worsen in the future (2025), if no countermeasures would be introduced.
Table F. 4.4.2 Estimated BOD at Existing Monitoring Stations
Monitoring Station
Drainage Area (km2)
River Discharge (Annual Average)
(m3/s)
Accumulated BOD Pollution Load
(kg-BOD/day)
BOD (Annual Average)
(mg/liter)
Water Quality Classification in terms of BOD
Present (2008)
Future (2025)
Present (2008)
Future (2025)
Present (2008)
Future (2025)
Apalit 7,819 297.8 132,776 167,313 2.7 3.4 Class A or B Class A or B
San Fernando 398 10.2 29,958 37,085 17.5 21.7 Worse than
Class D Worse than
Class D
Source: JICA Study Team
F.4.5 Effect of Structural Measures on the Reduction of Pollution Load
F.4.5.1 Structural Measures
The reduction in BOD pollution load by introducing the following structural measures is examined (see also Sector Report D: Municipal Water Supply, Sanitation and Sewerage System Management).
MP-G-01: Cabanatuan Sewerage System
MP-G-02: Expansion of Clark Sewerage System
MS-C-01-04: Additional Sanitary Facilities towards 2025
MP-C-01: Septage Treatment and Disposal Facility
Table F.4.5.1 describes the future scenario with or without the structural measures to be introduced in the study area.
Table F. 4.5.1 Structural Measures to Reduce Domestic BOD Pollution Load Measures Condition With Measures Condition Without Measures
MP-G-01:Cabanatuan Sewerage System
12% of urban population in Cabanatuan City shall be served.
No Sewerage System in Cabanatuan City
MP-G-02: Expansion of Clark Sewerage System
100% of Clark area shall be served. No Expansion of Clark Sewerage System
MS-C-01-04:Additional Sanitary Facilities towards 2025
The coverage of sanitary toilets in all municipalities shall be increased from 86% at present to 100% by 2025.
No additional sanitary toilets in all municipalities/cities until 2025.
MP-C-01: Septage Treatment and Disposal Facility
100% of the urban population with conventional toilets and with Level 3 water supply in 10 priority cities/municipalities (Angeles, San Fernando, Malolos, Cabanatuan, Tarlac, Hagonoy, Baliuag, Calumpit, Mabalacat and Guagua)
No provision of septage treatment and disposal facilities.
Source: JICA Study Team
F.4.5.2 Estimated BOD Pollution Load with or without Structural Measures
The calculated BOD pollution load by the year 2025 with or without the structural measures is summarized in Table F.4.5.1 and shown in Figure F.4.5.1 below. Assuming future conditions of coverage of proposed facilities, it is estimated that about 10.6% reduction in domestic BOD pollution load would be realized.

Sector F: Water-Related Environment Management
F-21
Annex-F F.4.5.1 to Annex-F F.4.5.2 demonstrate the reduction of the domestic BOD pollution load by sub- basin and water balance catchment, respectively.
Table F. 4.5.2 Reduction of BOD Pollution Load
Source BOD Pollution Load
(kg-BOD/day) Reduction 2008 2025 w/o 2025 wi
Domestic 142,371 187,148 167,401 10.6% Industrial 38,774 50,969 50,935 0.1% Fishpond 71,791 71,791 71,791 0.0% Livestock 24,794 34,513 34,513 0.0% Cultivated 3,153 3,153 3,153 0.0%
Total 280,883 347,574 327,793 5.7% Source: JICA Study Team
0
50,000
100,000
150,000
200,000
250,000
300,000
350,000
400,000
Dom
estic
Indu
stri
al
Fis
hpon
d
Liv
esto
ck
Cul
tivat
ed
Tot
alSource
Pol
lutio
n L
oad
(kg-
BO
D/d
ay)
2008 2025 w/o 2025 wi
Figure F. 4.5.1 Reduction of BOD Pollution Load
The present and future water quality in terms of BOD values at existing monitoring stations are shown in the following table. These were estimated based on the assumption that the river discharge condition will not change in the future and the reduction rate through chemical and biological decomposition processes in a water body is 49%.
As shown in Table F.4.5.3, BOD levels around Apalit would decrease from 3.4 mg/liter to 3.2 mg/liter in the future (2025) with the introduction of the structural measures. The effect of these measures on water quality around San Fernando City is even more significant, with an estimated decrease from 22.1 mg-BOD/liter to 19.4 mg-BOD/liter.
Table F. 4.5.3 Estimated BOD at Existing Monitoring Stations
Monitoring Station
Drainage Area (km2)
River Discharge (Annual Average)
(m3/s)
Accumulated BOD Pollution Load
(kg-BOD/day)
BOD(Annual Average)
(mg/liter)
Water Quality Classification
in terms of BOD
Present (2008)
Future(2025)
w/o
Future(2025)
wi
Present(2008)
Future(2025)
w/o
Future(2025)
wi
Present (2008)
Future (2025)
w/o
Future(2025)
wi
Apalit 7,819 297.8 132,762 170,289 160,989 2.7 3.4 3.2 Class A or B
San Fernando 398 10.2 29,958 37,782 33,088 17.5 22.1 19.4 Worse than Class D
Source: JICA Study Team
Sector F: Water-Related Environment Management
F-22
F.4.6 Summary of Results and Recommendations
The followings are concluded and recommended so far by the analysis of pollution load in the study area.
It is said that the gross BOD pollution generation in Region III contributes 25% of the total in NCR, Region III and Region IV, all of which are related to Manila Bay area. The estimated total BOD pollution flux that reaches to Manila Bay from the study area is 53,000tons/year at present (2008) and is expected to increase to 65,000tons/year in future (2025).
Domestic and industrial sources contribute about 64% of the total BOD pollution load in the study area at present (2008). This is expected to increase to 68% in the future (2025).
Special attention should be paid to the pollution load generated from fishponds, which contribute 26% of the total BOD pollution load, particularly in terms of the potential impact on Manila Bay.
The BOD pollution load density in the study area is much lower than that of the MMO river system in general.
Based on the pollution load analysis, the present and future water quality around Apalit would be acceptable for drinking purpose in terms of BOD annual average. It should be noted that the BOD in dry season could be higher, considering much smaller river discharge in dry season. The present water quality around San Fernando is badly deteriorated in terms of BOD. It is expected to worsen in the future, if no countermeasures would be introduced.
The methods of pollution load analysis used in this study could be utilized for other scenario setting such as what will happen if more sewerage treatment facilities will be constructed in more cities or municipalities, and so on.
The higher pollution load contributors such as highly urbanized areas and widely extended fishpond area are found mostly in the lower reaches of Pampanga river basin. These areas could be hot spots for water quality management in the future.
The current monitoring system for water quality is quite inadequate. More intensive monitoring should be carried out, especially in water bodies with relatively higher pollution load density, as identified in this study. This will lead to more precise assessment of the water quality condition and identification of appropriate pollution reduction measures in the future.

Sector F: Water-Related Environment Management
F-23
F.5 Issues and Concerns
F.5.1 Inadequate Water Quality Data Management
F.5.1.1 Poor Water Quality Monitoring
The water quality monitoring system has to be rationalized in order to generate sufficient reliable data on water quality in the basin. At the moment, the DENR-EMB in Region III monitors only a few surface water bodies, specifically Pampanga River and San Fernando River, while MWCI monitors Angat River. However, the DENR sampling stations are located only in the downstream reaches while MWCI sampling locations are limited to the Angat dam area. There are no stations in the upstream and midstream reaches of Pampanga and San Fernando Rivers or downstream of the Angat dam, or where potential water pollution sources are suspected. Also, the frequency of sampling appears to be irregular and the timing of sampling events at various locations is neither consistent nor synchronized across the different monitoring points of the river system. Sampling is done with the least consideration of natural hydrologic boundaries or seasonal variations in rainfall intensity and river flows.
Also, the DENR carries out monitoring only for conventional physico-chemical parameters such as pH, temperature, color, turbidity, DO, BOD, TSS, TDS and occasionally for fecal and total coliform. Other important parameters such as heavy metals, oil and grease and nitrates and phosphates, pesticides, PCBs and other persistent organic pollutants (POPs) are neglected, even where possible contamination from potential sources is suspected.
F.5.1.2 Inadequate Inventory of Pollution Sources
The DENR-EMB III has yet to undertake a complete inventory of all the water pollution sources in the basin. Stakeholders identify gasoline stations/depots, fast food restaurants, food processing plants and commercial livestock farms among the most problematic industries in the basin. However, available records show that only the industrial and commercial locators in Clark Special Economic Zone are 100% compliant with the ECC requirements and the effluent discharge permitting system. Elsewhere, the DENR-EMB estimates that barely 10% of the livestock farms and other small- and medium enterprise (SMEs) have ECCs, conduct routine effluent discharge monitoring and submits Self-Monitoring Reports (SMRs).
All toxic and hazardous waste generators also need to be inventoried, including hospitals and electronic manufacturing industries.
F.5.1.3 Inadequate Inventory of Pollution Sources
The DENR-EMB III’s equipment capability for data collection, storage and management is extremely inadequate, given the huge responsibility entailed by the CWA. At the moment, only a handful of personnel are assigned in the generation, evaluation and storage of water quality monitoring data for the entire region. The task of storage and retrieval of these field data in addition to the Self-Monitoring Reports (SMRs) that are regularly submitted by industries is overwhelming, yet the Office is severely under-staffed. At the same time, the present data banking unit is ill-equipped for systematic data retrieval and use to inform management decisions regarding water quality.
F.5.2 Contamination of Surface, Ground and Coastal Waters
The potential sources of point- and non-point pollution in the basin include domestic, industrial, livestock and fishpond aquaculture wastes. The stakeholders identified San Fernando River, Abacan River, Angat River, Quitangil River and Sapang Balen Creek amongst the most polluted receiving water bodies. As discussed in Chapter F.4, the basin contributes an estimated 53,000 tons/year of the BOD pollution load entering Manila Bay.
Specifically, as the stakeholders confirm on various consultations, the water pollution problems in the basin could be attributed to the following causes:

Sector F: Water-Related Environment Management
F-24
F.5.2.1 Inadequate Sewerage Treatment and Sanitation Facilities
The preliminary estimates indicate that in 2008, about 50% of BOD pollution load came from domestic sources. However, most residential and business establishments lack basic water pollution control facilities required by regulations such as the National Sanitation Code and the Clean Water Act. Only one complete sewage treatment plant (STP) operates in the basin, namely Clark Water Corporation’s. It caters to 80% of the residential and business locators in the Clark Special Economic Zone (CSEZ). Cabanatuan City has a piped sewerage system that will eventually connect to a treatment facility. This is designed to serve 12% of the urban population by the year 2015.
Residential and commercial septic tanks are emptied every five years or so by a handful of private de-sludging companies that operate in the basin. However, stakeholders believe that the wastes end up in unsanitary disposal facilities such as open dumpsites or, worse, emptied directly onto water bodies without any benefit of treatment.
Moreover, it is estimated that at least 15% of the basin’s population do not have access to basic toilet facilities.
F.5.2.2 Inadequate Strategies to Control Pollution from Industrial, Agricultural and Aquaculture Wastes
Stakeholders perceive that manufacturing industries, restaurant/food chains, gasoline refilling stations and livestock farms are among the serious generators of water pollution. According to preliminary estimates, industries account for 14% of the total organic pollution load. Industries may be dispersing non-organic pollutants, possibly heavy metals, grease and oil, phenols, and persistent organic pollutants (POPs).
Commercial fishponds appear to be contributing the most agricultural BOD pollution. According to preliminary estimates, as much as 26% of the total BOD load in the basin comes from fishponds.
Livestock wastes contribute 9% BOD load, according to preliminary estimates. Presently, some of the big commercial livestock farms are already equipped with state-of-the art wastewater treatment plants and anaerobic digestion facilities to control pollution. Other small- and medium-sized livestock farms have farm-level bio-digesters that can convert animal manure and other farm wastes into methane as fuel for domestic or communal use. Still, the adoption in the basin of such cleaner production options is low.
Agricultural cultivation is less problematic; it contributes only 1% to the total BOD load. However, areas devoted to rice and vegetable may be dispersing persistent organic pollutants (POPs) owing to massive use of agri-chemical inputs. Nevertheless, a preliminary research conducted by Philrice failed to show any detectable level of agri-chemical pollutants in water samples from selected paddies and farm wells in Nueva Ecija12).
F.5.2.3 Poor Solid Waste Management
Solid wastes dumped in rivers and creeks do clog as well as pollute waterways. At the same time, leachate from unsanitary landfills or dumpsites can contaminate surface and ground waters. Solid waste contributes to the total domestic and industrial pollution loads; however, data are inadequate to allow estimation in the present Study. Nevertheless, stakeholders identify the following waterways as hotspots of waste dumping activities in the basin, namely San Fernando River, Abacan River, Angat River and Quitangil River.
At present, most LGUs in the basin are hardly compliant with the requirements of the ESWM Act (RA 9003). Owing to budgetary constraints many LGUs are constrained to implement their 10-Year ESWM Plans. For most LGUs, compliance involves only the soft measures such as segregation, reduction, reuse and recycling (3Rs), and IEC activities, but even these are limited in scale. Many LGUs still rely on open dumpsites and only a few have converted to controlled dumpsites. Only a few LGUs have established materials recovery facilities (MRFs). In particular, most LGUs in the basin cannot afford the capital costs and have difficulty finding an ideal location for constructing sanitary landfills.

Sector F: Water-Related Environment Management
F-25
F.5.2.4 Over-Extraction of Groundwater
As already discussed, contamination of groundwater due to saline intrusion is a serious concern in the coastal areas of Bulacan and Pampanga. Recent studies have confirmed that the extent of saline intrusion has reached more than 40km inland from Manila Bay as far as the municipality of San Miguel, Bulacan. Saline intrusion is believed to be caused by the over-extraction of ground water in the coastal zone. The unregulated use of groundwater for irrigation and aquaculture production is said to be aggravating the situation.
F.5.2.5 Siltation of Rivers
Rapid upland denudation is responsible for sedimentation and the resulting siltation of water bodies. Monitoring results have confirmed the high TSS values in Pampanga, San Fernando and Angat Rivers.
F.5.2.6 Illegal Settlements along River Easements
Waste dumping is exacerbated due to heavy encroachment of informal settlers into riverbanks, especially along the San Fernando and Angat Rivers. More often than not, the unsanitary toilet conditions in urban poor settlements further aggravate the pollution problem, with the resulting spread of water- and vector-related diseases.
F.5.3 Institutional Constraints
F.5.3.1 Inadequate Institutional Capability
With the passage of the Clean Water Act, the Ecological Solid Waste Management Act and the strengthened Philippine EIS system, the DENR-EMB has taken on an ever expanding role as a water quality management and pollution regulatory body. Sadly, this has not been matched with corresponding budgetary allocation, manpower resources, laboratory and data processing equipment and other logistics needed by the agency.
The DENR-EMB III’s manpower and equipment capability for field monitoring and data management is extremely inadequate. At the moment, only a handful of personnel are assigned to handle water quality monitoring and data banking for the entire region. On top of this, the region’s laboratory capability is rather limited to conventional parameters and particularly constrained for testing heavy metals and other toxic substances. There are only three accredited private water testing laboratories, namely TSD Main Laboratory in Mabalacat, Angeles City Water District Laboratory in Angeles City, and CRL Environmental Corporation in Clarkfield, Pampanga. Only the latter is equipped for heavy metal analysis.
F.5.3.2 Weak Regulatory Enforcement
Clearly, the policies and laws are adequately in place but the institutional capability and mechanisms to fully enforce them are inadequate. This sad reality continues to undermine the effectiveness of regional programs for environmental management, pollution control and adjudication. Reluctantly, the EMB admits that enforcing the “polluters pay” principle and going after pollution offenders remains to be a daunting challenge. To overcome institutional constraints, the EMB relies on private and community volunteers, who are deputized as pollution control officers to augment their manpower needs.
F.5.3.3 Weak Institutional Coordination
Stakeholders also identified the lack of concrete coordination mechanisms between the DENR-EMB, the LGUs and other relevant agencies in relation to business permit application and the requisites of the Philippine EIS system and pollution regulation among industries and commercial establishments.
In particular, stakeholders point that the difficulty arises when industries and commercial establishments are issued business permits by the Municipal Mayors even in the absence of ECC, discharge and other pertinent permits from the DENR, sanitation clearance from the DOH or building permit from the DPWH.

Sector F: Water-Related Environment Management
F-26
F.5.3.4 Inadequate Public Awareness
The rise in pollution cases shows that violations of and utter disregard for anti-pollution and environmental laws continues to persist in most parts of the basin. This indicates a lack of public appreciation, awareness and personal or corporate commitment to work towards maintaining clean and safe water environment on a sustained basis.
Some agencies have on-going IEC activities in support of various environmental sustainability initiatives, such as ecological solid waste management. However, these activities tend to be limited and piecemeal. Stakeholders agree that there is a need for intensive and coordinated environmental awareness drive targeting especially the young generation.

Sector F: Water-Related Environment Management
F-27
F.6 Plan for Water-related Environmental Management
F.6.1 Goals of Water-Related Environment Management in the Basin
F.6.1.1 Related National and Regional Policies, Strategies and Thrusts
The national strategy for this sector is the coordinated management of water-related environment in order to maintain the life-sustaining functions of vital ecosystems. This is laid out in the following national imperatives:
Maintaining good public health, ecological integrity and economic viability, pursuant to Philippine Agenda 21, the country’s blueprint for sustainable development.
Enhancing water quality management, environmental compliance, solid waste management and pollution control, according to the DENR-EMB’s priority thrusts and consistent with the mandates of the Clean Water Act (RA 9275), the Philippine EIS System (PD 1586), and the Ecological Solid Waste Management Act (RA 9003).
There is a parallel inter-sector effort at the regional level to restore the ecological integrity of Manila Bay and improve the environmental quality of the river basins. This is laid out in the Operational Plan for the Manila Bay Coastal Strategy. The Supreme Court issued a continuing mandamus in 2008, which compels all relevant government agencies to urgently clean up of Manila Bay in support of the OPMBCS.
Specifically, in relation to water quality, the continuing mandamus calls for a concerted effort by concerned agencies to:
reduce by 50% the discharges of raw sewage, septage and untreated and inadequately treated wastewater from all sources by 2015;
implement integrated solid waste management programs in all LGUs by 2007;
achieve ecologically sound and sustainable aquaculture fisheries production by 2015; and
protect aquifers from contamination and salt water intrusion by increasing the coverage of water supply distribution by 50% by 2015.
F.6.1.2 Goals under the IWRM Plan
Taking these national and regional policies, strategies and thrusts into account, the water-related environmental management goals under the IWRM Plan for Pampanga river basin are two-fold:
Strengthen capacity for water quality monitoring, data management, regulatory and decision support system, and
Reduce pollution load from various sources in key areas of Pampanga river basin in order to render quality of waters fit for specified uses.
F.6.2 Projects as Countermeasures to Address the Problems and Issues on Water-related Environment Management
F.6.2.1 Project List
The programs and projects listed in Table F.6.2.1 are necessary to meet the twin goals identified for water-related environment management. Specifically, these projects are expected to address the water quality issues and concerns identified earlier in section F.6. The list includes not only the ongoing, proposed and conceptual projects under the water-related environment management but also those under inter-related sectors, namely: municipal sanitation and sewerage and watershed management.
Specifically, the projects for the water-related environment management sector are listed in Table F.6.2.2. The project profiles describing each project are found in Annex-T F.6.2.1. The locations of the projects are shown in Annex-F F.6.2.1.

Sector F: Water-Related Environment Management
F-28
Table F. 6.2.1 On-going, Proposed and Conceptual Programs and Projects to address the Issues and Concerns on Water-related Environment Management
Problems and Issues / Causes Countermeasures Programs and Projects Sector 1. Inadequate Water
Quality Data Generation and Management Poor water quality monitoring Inadequate inventory of
pollution sources Inadequate institutional
capacity Poor data management
1.1 Rationalize water quality monitoring and pollution regulatory compliance
1.2 Compile inventory of pollution sources
1.3 Upgrade management capability of DENR-EMB and other stakeholders
1.4 Upgrade the data management system
1.5 Strengthen regulatory and coordination mechanisms among the DENR-EMB, the LGUs, relevant agencies and clientele
1.6 Environmental awareness as part of school curriculum; public IEC utilizing multi-meadia
WQ-C-01: Capacity Development to Upgrade Water Quality Monitoring and Data Management Program
WQ
2. Contamination of Surface, Ground and Coastal Waters Absence of sewerage treatment
and sanitation facilities
Inadequate mitigation of
industrial, livestock, agricultural and fishpond pollution
Weak regulatory enforcement Weak inter-agency
coordination Inadequate public awareness
Poor solid waste management
Illegal settlements along river
easements
Siltation of rivers
2.1 Basic Sanitation and Sewerage Facilities Sewerage treatment facilities (STP)
in Cabanatuan City Expansion of Clark Sewerage
System Septage treatment and Disposal
Facility 2.2 Fishpond Management 2.3 Reduction of industrial and livestock
pollution Load
2.4 Optimize Access to Existing SLF;
Implement ESWMP
2.5 Clean-up of Waterways Reforestation to Reduce Sediment Yield
MP-G-01: Cabanatuan Sewerage System
MP-G-02: Expansion of Clark Sewerage System
MP-C-01: Septage Treatment and Disposal Facility
MS-C-01/02/03/04: Additional Sanitary Facilities in Bulacan, Pampanga, N. Ecija and Tarlac
WQ-C-02: Capacity Development to Improve Water Quality and Aquaculture Fisheries Management
WQ-G-02: Industrial Pollution
Control Program (IPCP) WQ-C-03: Capacity
Development to Improve Industry Adoption of Cleaner Production Options
WQ-P-01: Clean Development Mechanism (CDM)
WQ-G-01: Ecological Solid
Waste Management Program WQ-C-04- Construction of
Sanitary Landfills and Support Facilities in N. Ecija and Cluster Waste Transfer Stations in Bulacan and Pampanga
WQ-G-04: Sagip-Ilog Project
Refer to related Watershed
Management Projects
MS MS MS MS WQ WQ WQ WQ WQ WQ
Source: JICA Study Team Note: *: MS - Municipal Sanitation and Sewerage, WQ - Water-related Environmental Management
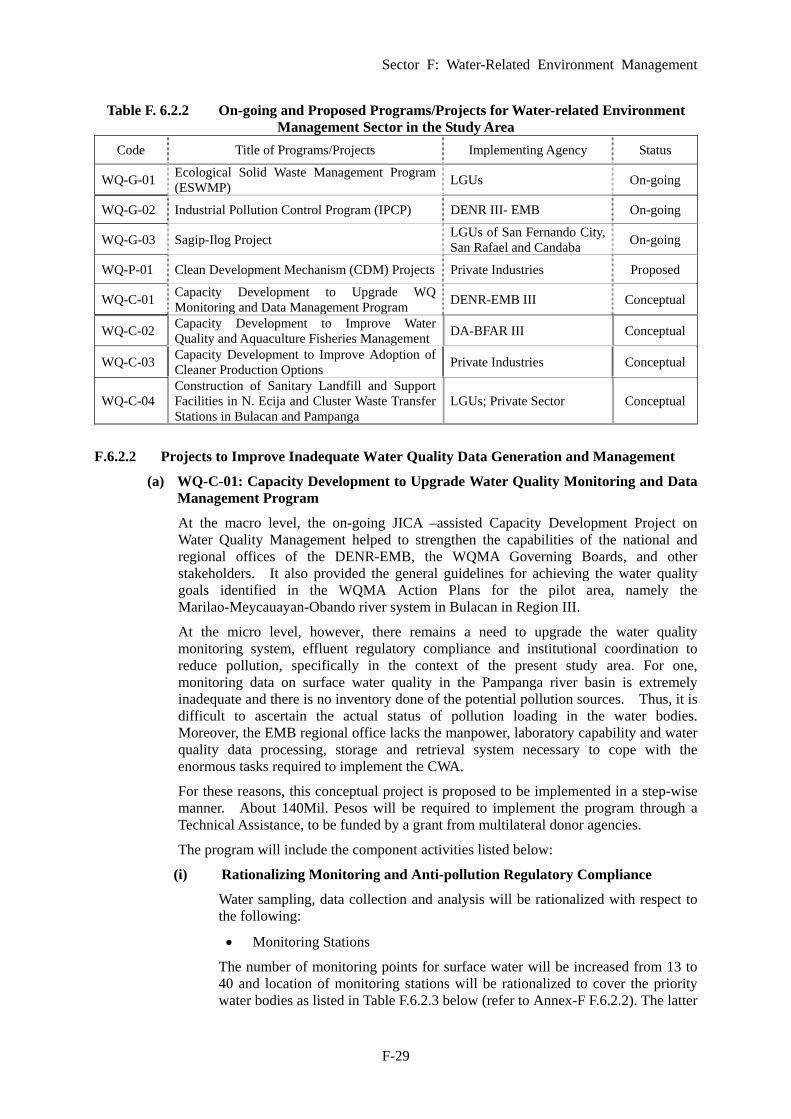
Sector F: Water-Related Environment Management
F-29
Table F. 6.2.2 On-going and Proposed Programs/Projects for Water-related Environment Management Sector in the Study Area
Code Title of Programs/Projects Implementing Agency Status
WQ-G-01 Ecological Solid Waste Management Program (ESWMP)
LGUs On-going
WQ-G-02 Industrial Pollution Control Program (IPCP) DENR III- EMB On-going
WQ-G-03 Sagip-Ilog Project LGUs of San Fernando City, San Rafael and Candaba
On-going
WQ-P-01 Clean Development Mechanism (CDM) Projects Private Industries Proposed
WQ-C-01 Capacity Development to Upgrade WQ Monitoring and Data Management Program
DENR-EMB III Conceptual
WQ-C-02 Capacity Development to Improve Water Quality and Aquaculture Fisheries Management
DA-BFAR III Conceptual
WQ-C-03 Capacity Development to Improve Adoption of Cleaner Production Options
Private Industries Conceptual
WQ-C-04 Construction of Sanitary Landfill and Support Facilities in N. Ecija and Cluster Waste Transfer Stations in Bulacan and Pampanga
LGUs; Private Sector Conceptual
F.6.2.2 Projects to Improve Inadequate Water Quality Data Generation and Management
(a) WQ-C-01: Capacity Development to Upgrade Water Quality Monitoring and Data Management Program
At the macro level, the on-going JICA –assisted Capacity Development Project on Water Quality Management helped to strengthen the capabilities of the national and regional offices of the DENR-EMB, the WQMA Governing Boards, and other stakeholders. It also provided the general guidelines for achieving the water quality goals identified in the WQMA Action Plans for the pilot area, namely the Marilao-Meycauayan-Obando river system in Bulacan in Region III.
At the micro level, however, there remains a need to upgrade the water quality monitoring system, effluent regulatory compliance and institutional coordination to reduce pollution, specifically in the context of the present study area. For one, monitoring data on surface water quality in the Pampanga river basin is extremely inadequate and there is no inventory done of the potential pollution sources. Thus, it is difficult to ascertain the actual status of pollution loading in the water bodies. Moreover, the EMB regional office lacks the manpower, laboratory capability and water quality data processing, storage and retrieval system necessary to cope with the enormous tasks required to implement the CWA.
For these reasons, this conceptual project is proposed to be implemented in a step-wise manner. About 140Mil. Pesos will be required to implement the program through a Technical Assistance, to be funded by a grant from multilateral donor agencies.
The program will include the component activities listed below:
(i) Rationalizing Monitoring and Anti-pollution Regulatory Compliance
Water sampling, data collection and analysis will be rationalized with respect to the following:
Monitoring Stations
The number of monitoring points for surface water will be increased from 13 to 40 and location of monitoring stations will be rationalized to cover the priority water bodies as listed in Table F.6.2.3 below (refer to Annex-F F.6.2.2). The latter

Sector F: Water-Related Environment Management
F-30
have been identified by stakeholders to be potentially at risk in terms of pollution.
Table F. 6.2.3 Existing and Proposed Monitoring Stations for Surface Water Quality
Name of River Existing Newly Proposed Pampanga River (Mainstream) 7 5 Pampanga River (Upstream) 4 Candaba Swamp 0 2 Rio Chico River 0 4 Angat River (Upstream, MWCI) 3 4 Angat/Labangan Floodway 3 Pasac River (Mainstream) 0 2 Abacan River 0 3 Sapang Balen 0 3 Quitangil River 0 1 San Fernando River 3 3 Mouth of Manila Bay 0 6
Total 13 40 Source: JICA Study Team, 2009.
Parameters of Interest
The selection of parameters of interest (as well as timing and frequency of sampling event) will take into consideration the potential pollutants and sources, transport processes, seasonal variations, and changes in environmental conditions of the receiving water bodies.
Where necessary and based on the inventory of pollution sources, the following parameters should also be tested in addition to conventional parameters:
- Heavy metals: Hg, Pb, Cr, Fe, Mn, Mg, Cd, As, and PCBs from industrial and commercial pollution sources
- Oil and grease from oil and gasoline depots, food manufacturers, hotels and restaurant chains
- Total N, NH4+N, NO3+N, TKN, and total PO4 from agricultural
(cultivation, livestock and aquaculture) areas
- Pesticides, other persistent organic pollutants (POPs), Cu and Zn in agri-chemical run-off from cultivation areas
Timing and Frequency
Proper timing and frequency of sampling is necessary in order to obtain real-time value of water quality parameters across sampling locations. Some parameters (e.g., BOD and bacteriological) may need to be monitored more frequently than others (e.g., heavy metals).
WQMAs, NAAs and AAs
Improved monitoring and data collection will facilitate the classification/reclassification of water bodies, as necessary as well as the designation of Water Quality Management Areas (WQMAs), Non-Attainment Areas (NAAs) and Attainment Areas (AAs) in compliance with the Clean Water Act.
Based on the initial assessment for this Study, the BOD load of Pampanga River still satisfies the criterion for its use as Class A or Class B surface water. In the near future Pampanga River could be a potential source of drinking water supply with minimum treatment required. However, some of the water bodies identified, particularly Sapang Balen, Quitangil River, Abacan River and San Fernando

Sector F: Water-Related Environment Management
F-31
River, are potential candidates as WQMAs or NAAs for BOD or other parameters.
(ii) Complete Inventory of Pollution Sources
A thorough inventory of the pollution generators shall be prepared, which would include all industries and commercial establishments in relation to their production rates and processes and waste generation. Also, all toxic, deleterious and hazardous waste generators such as hospitals and chemical manufacturers shall be profiled.
An inventory and assessment of non-point source pollution will likewise be done, especially in relation to agri-chemical use in crop cultivation and nutrients (nitrates and phosphates) in aquaculture fisheries production.
(iii) Upgrading Water Management Capability DENR-EMB III and Other Stakeholders
The capability of the DENR-EMB and other stakeholders including the Water Quality Management Area Governing Boards, industries, commercial entities, LGUs, and other public organizations to implement WQMA Action Plans will be enhanced. In particular, institutional coordination mechanisms and procedures will be strengthened by way of:
- Upgrading manpower capability and logistics support
- Streamlining and coordinating the business licensure procedures with the issuance of ECC, discharge permit and sanitation requirements
- Strengthening compliance with ECC conditions and discharge permitting regulations through the imposition of more stringent penalties against violators and more attractive incentive systems for compliant permittees
- Organizing and capacitating the WQMA governing boards and collection of WQMA funds
- Deputizing and strengthening police powers to more community leaders and volunteers as pollution control officers
- Creating a regional consortium of private and government water testing laboratories to improve capability to analyze water samples
- Intensifying public awareness on water pollution and waste management by incorporating these in school curricula and through a variety of multi-media campaigns during public community gatherings.
(iv) Upgrading the Data Management System
A sound data management system will be established for effective storage, processing, updating and retrieval of field-generated and submitted data. This will help to better inform management decisions as well as provide timely and useful information to the general public and concerned stakeholders in relation to water quality status of Pampanga river basin.
Where appropriate, the data banking system developed under the JICA-assisted Capacity Development Project on Water Quality Management may be used. Hence, the components of this system may include Database Development, Data Link/Communication System, and Water Quality (WQ) Modeling.
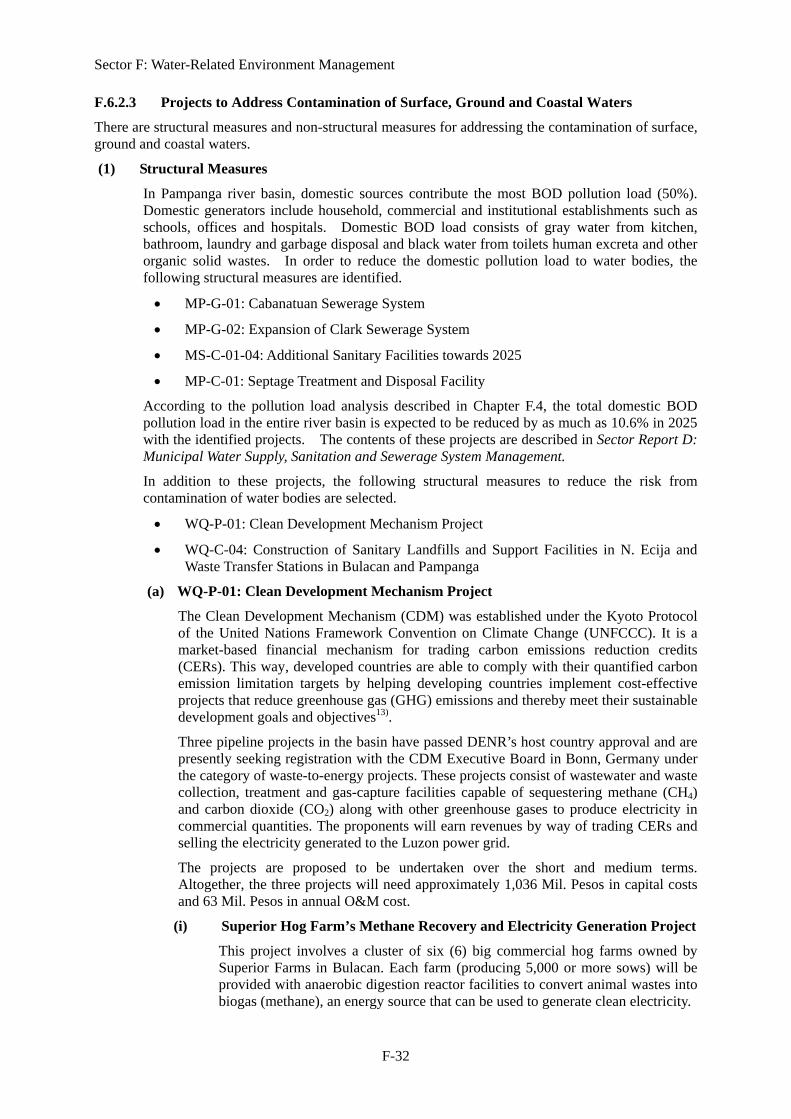
Sector F: Water-Related Environment Management
F-32
F.6.2.3 Projects to Address Contamination of Surface, Ground and Coastal Waters
There are structural measures and non-structural measures for addressing the contamination of surface, ground and coastal waters.
(1) Structural Measures
In Pampanga river basin, domestic sources contribute the most BOD pollution load (50%). Domestic generators include household, commercial and institutional establishments such as schools, offices and hospitals. Domestic BOD load consists of gray water from kitchen, bathroom, laundry and garbage disposal and black water from toilets human excreta and other organic solid wastes. In order to reduce the domestic pollution load to water bodies, the following structural measures are identified.
MP-G-01: Cabanatuan Sewerage System
MP-G-02: Expansion of Clark Sewerage System
MS-C-01-04: Additional Sanitary Facilities towards 2025
MP-C-01: Septage Treatment and Disposal Facility
According to the pollution load analysis described in Chapter F.4, the total domestic BOD pollution load in the entire river basin is expected to be reduced by as much as 10.6% in 2025 with the identified projects. The contents of these projects are described in Sector Report D: Municipal Water Supply, Sanitation and Sewerage System Management.
In addition to these projects, the following structural measures to reduce the risk from contamination of water bodies are selected.
WQ-P-01: Clean Development Mechanism Project
WQ-C-04: Construction of Sanitary Landfills and Support Facilities in N. Ecija and Waste Transfer Stations in Bulacan and Pampanga
(a) WQ-P-01: Clean Development Mechanism Project
The Clean Development Mechanism (CDM) was established under the Kyoto Protocol of the United Nations Framework Convention on Climate Change (UNFCCC). It is a market-based financial mechanism for trading carbon emissions reduction credits (CERs). This way, developed countries are able to comply with their quantified carbon emission limitation targets by helping developing countries implement cost-effective projects that reduce greenhouse gas (GHG) emissions and thereby meet their sustainable development goals and objectives13).
Three pipeline projects in the basin have passed DENR’s host country approval and are presently seeking registration with the CDM Executive Board in Bonn, Germany under the category of waste-to-energy projects. These projects consist of wastewater and waste collection, treatment and gas-capture facilities capable of sequestering methane (CH4) and carbon dioxide (CO2) along with other greenhouse gases to produce electricity in commercial quantities. The proponents will earn revenues by way of trading CERs and selling the electricity generated to the Luzon power grid.
The projects are proposed to be undertaken over the short and medium terms. Altogether, the three projects will need approximately 1,036 Mil. Pesos in capital costs and 63 Mil. Pesos in annual O&M cost.
(i) Superior Hog Farm’s Methane Recovery and Electricity Generation Project
This project involves a cluster of six (6) big commercial hog farms owned by Superior Farms in Bulacan. Each farm (producing 5,000 or more sows) will be provided with anaerobic digestion reactor facilities to convert animal wastes into biogas (methane), an energy source that can be used to generate clean electricity.

Sector F: Water-Related Environment Management
F-33
The project components will include gas capture pipelines, power engines/generators and facilities to connect to the grid. The Philippine Biosciences Co., Inc. will construct the facilities through Build-Operate-Transfer (BOT) scheme.
(ii) Metro Clark Landfill Gas Capture System
Based on the CDM registration, the SLF facility will be provided with LFG collection pipelines, pre-treatment system, electricity generation and grid connection. The Metro Clark SLF is expected to begin flaring operations in 2009, and will gradually expand the operation to approximately 70 hectares of disposal area, with an approximate capacity of 20 million tons. Depending on the output of the landfill, it is anticipated that electricity generation capacity will be added in increments, beginning in 2010, and growing to a total of approximately 6.5 MW of capacity until 2017. All gas collected during periods when power is not produced will be flared.
The capital and O&M costs of the project will be borne by the proponent.
(iii) Landfill Gas (LFG) Recovery and combustion with renewable energy generation from from Bulacan Engineered Sanitary Landfill
The Bulacan SLF methane recovery facility will operate in much the same way as the Metro Clark SLF’s. The Bulacan SLF is expected to generate as much as 5.0 MW of electricity over a ten-year project life until 2020.
The project will be financed out a loan, which VG Puyat Group, Inc. will secure from the Land Bank of the Philippines through its Carbon Finance Support Facility (CFSF).
(b) WQ-C-04: Construction of Sanitary Landfills and Support Facilities in N. Ecija and Waste Transfer Stations in Bulacan and Pampanga
(i) Sanitary landfills and pertinent facilities in N. Ecija
The construction of five suitably engineered sanitary landfills was proposed in the medium term development plan of N. Ecija. This includes one provincial SLF in Gen. Tinio and four municipal SLFs in Palayan City, San Jose City, Muñoz City and Sta. Rosa. The SLFs are expected to serve nearly 486,000 people or about 22% of the province’s total population by 2025. In addition, support MRFs, waste facilities and facility areas are proposed to be acquired, established or rehabilitated in twelve other municipalities, namely Talavera, Licab, Cattanglan, Bongabon, Cabiao, San Leonardo, Gapan, Talugtug, Rizal, Gen. Natividad, Lupao and Gabaldon.
Based on the LGUs’ estimates, these waste facilities will need a capital cost amounting to 231.0 Mil. Pesos and annual O & M cost of 22.0 Mil. Pesos. Funds will come from IRA of each LGU.
(ii) Waste Transfer Stations in Bulacan and Pampanga
It has been argued that most of the LGUs in the basin can hardly afford the cost of constructing a SLF facility. As a less costly alternative, this Study proposes the construction of four (4) waste transfer stations for a cluster of LGUs. Priority is given to highly urban LGUs in Pampanga and Bulacan, according to the list in Table F.6.2.4. The waste transfer stations will be strategically located and will be equipped with ancillary structures for sorting, compacting, composting (as may be necessary) and loading prior to final disposal. These waste facilities are expected to serve more than 2.0 million residents with a total waste generation volume of 968,504 kg/day.

Sector F: Water-Related Environment Management
F-34
Table F. 6.2.4 Particulars of the Proposed Waste Transfer Stations.
City/Mun. Urban
Population (2025)
Waste Volume (kg/d) Transfer Station
Distance to SLF (km)
Total Cost Gene- ration
Transfer Station
Capital*2 Annual O&M*3
Bulacan
Baliuag 204,993 147,312 189,540 *1 54 467 86 Calumpit 146,682 105,408 Hagonoy 189,004 135,822 281,784 694 128
Malolos City 333,821 239,890 *1 60
Pampanga
Angeles City 410,197 121,700 148,024 *1 20 366 66 Guagua 255,038 75,666
Mabalacat 136,019 40,355 107,030 37 267 48 City of San Fernando 344,985 102,352
*1
TOTAL 2,020,740 968,504 726,378 171 1,794 327 Note: *1: Two urban LGU within proximity of each other will share one (1) waste transfer station
*2: Includes cost of construction and hauling equipment *3: Includes cost of hauling and tipping fee
Source: DENR-EMB III; LGUs, 2009. JICA Master Plan on Solid Waste Management for Boracay Island and Malay Municipality, 2008.
As already mentioned, the engineered SLF in Capas, Tarlac or in SJDM, Bulacan are currently under-utilized. The maximum distance of these SLFs from the target LGUs is estimated to be about 42 km on average. Either of these facilities is therefore proposed as final disposal site in order to minimize transportation costs. The transfer stations will receive only the municipal residual wastes (or about 75% of the total volume generation), according to the conceptual plan shown in Figure F.6.2.1. Hence, strict implementation of segregation and 25% reduction at source according to RA 9003 will be a necessary support component of this project.
Source: JICA Study Team
Figure F. 6.2.1 Conceptual Plan of the Proposed Cluster Waste Transfer Stations As of this writing, the private operator of the Bulacan SLF, VG Puyat Group, Inc. is negotiating with officials of Bulacan and Pampanga to explore more affordable disposal options. One possibility is for the company to construct and operate the cluster transfer stations and provide hauling services at a cost that is more acceptable to LGUs. The project will need approximately 1,800Mil. Pesos in capital costs and 327 Mil. Pesos in annual O&M cost.
Solid Waste Generation
HHsWaste
CommecialWaste
HHsWaste
InstitutionalWaste
HHsWaste
CommecialWaste
Solid Waste Generation
HHsWaste
CommecialWaste
HHsWaste
InstitutionalWaste
HHsWaste
CommecialWaste
TS or MRF
Compacting
Sorting
Composting
TS or MRF
Compacting
Sorting
Composting
SanitaryLandfill
100% → 75%(Home composting, Recycling, etc)
75% → 30%(Composting, Recycling, Compacting)
75%
30% (Residuals)
Proposed Conceptual Plan

Sector F: Water-Related Environment Management
F-35
Project financing may come from the LGU’s revenues, in the case of Nueva Ecija, or from the landfill operators, in the case of SLFs.
(2) Non-Structural Measures
In addition to the structural measures, non-structural measures are also identified. There are five categories for the non-structural measures as follows.
Fishpond Management (Code: WQ-C-02)
Incentives for Reduction of Pollution Load (Codes: WQ-G-02, WQ-C-03)
Optimize Access to Existing SLF by Implement ESWMP (Code: WQ-G-01)
Clean-up of Waterways (Code: WQ-G-03)
Although it is difficult to analyze the quantitative effect of these non-structural measures on the reduction of pollution load at this moment, the implementation of the non-structural measures together with the structural measures is indispensible, considering the identified problems and issues.
(a) WQ-C-02: Capacity Development to Improve Water Quality and Aquaculture Fisheries Management
Current fisheries programs in the basin are concerned only with increasing productivity, with little regard for the impact on water quality due to intensive nutrient feeding and unsustainable fisheries cultural management practices. During stakeholder consultations, participants referred to the practice of feeding fish with so-called “pro-biotics” to improve water quality, productivity and therefore sustainability of the aquaculture operations. There are other aquaculture production technologies and best management practices used elsewhere, which can be introduced in the basin on a pilot basis.
This conceptual project is proposed to complement the fisheries projects of the DA-BFAR Region III and the F.I.S.H. program of the provinces of Pampanga and Bulacan. The program is conceived as an advocacy, regulatory, capability building, technology transfer and information management program, which aims to:
Enhance awareness and capability to adopt new and emerging cleaner aquaculture production technologies
Improve regulatory mechanisms by lobbying for the issuance of local ordinances in support of sustainable production practices, pursuant to the Fisheries Code
Implement research and development (R&D) to develop and pilot new sustainable, low water use-low water quality impact technologies for improved fisheries production
Implement R&D to identify effective remediation measures to improve water quality in fishpond areas with serious incidences of eutrophication, algal bloom and related fish kills and disease infestation
Institute water and fish resources monitoring and evaluation systems
This project may be implemented through technical assistance by an international donor agency at an estimated to cost 48Mil. Pesos.
(b) WQ-G-02: Industrial Pollution Control Program (IPCP)
The DENR-EMB III regulates industrial pollution by monitoring compliance with the Environmental Compliance Certificates (ECC) conditions under the Philippine EIS system. Regulation of industries also involves the issuance of Discharge Permits and monitoring of effluent discharge based on Self Monitoring Reports (SMRs). The EMB also deals with non-compliant industries through pollution adjudication. The Pollution Adjudication Board (PAB) is a quasi-judicial body created under EO 192 to decide

Sector F: Water-Related Environment Management
F-36
pollution cases. In support of the industrial pollution control, the DENR implements two programs to encourage environmental self-regulation by industries, as discussed below:
(i) Revised Industrial Eco-watch Program (RIES)
The Revised Industrial Eco-watch System (RIES) is a public disclosure program that rates industries in color codes to indicate degree of compliance to the Clean Water Act, thus:
Gold (Outstanding) – Exemplary beyond legal requirements
Silver (Excellent) – Beyond legal requirements
Green (Very Good) – More than sufficient efforts to comply with standards
Blue (Good) – Sufficient efforts to comply with standards
Red (Bad) – Insufficient efforts to comply with DENR standards
Black (Very Bad) – No effort to comply with DENR standards.
Starting in 2006, firms representing six (6) industry types, namely: Pulp and Paper Mills, Softdrinks, Bottling & Beverages, Sugar Industry, Cement Plants, Fish Processing, Power Plants have been assessed and rated. Among the active compliant participants in this program are the sugar milling, beverage manufacturing and cement industries in the basin.
The Clark Development Corporation boasts of its 100%-compliant industrial locators in Clark SEZ, Pampanga. The CDC-Environment Management Division is among the private companies deputized by the DENR as pollution control officer as a member of the Pollution Control Association of the Philippines (PACAPI).
(ii) Philippine Environmental Partnership Program (PEPP)
The PEPP supports industry self-regulation by providing a package of incentives and reward mechanisms to compliant industries. The DENR assists business establishments, particularly small and medium enterprise to adopt pollution prevention and cleaner production processes. Regulatory privileges and assistance such as relaxation of reportorial requirements, simplified requirements for securing an Environmental Compliance Certificate and flexible payment schemes are also offered under the PEPP.
As of 2008, the list of partner associations have included the key industry players in the basin such as distilleries, hotels/tourist resorts operation, cement industry, paint manufacturing, sugar milling, electronics production, etc.
Private as well as non-government organizations such as the Philippine Chamber of Commerce and Industries (PCCI), Philippine Business for Environment (PBE), Management Association of the Philippines (MAP) and (PACAPI) are fully supporting industrial self-regulation through this program.
Implementing the above programs until 2025 will cost around 153Mil. Pesos. This will be financed out of the national budget allotted for the regular operations of the DENR-EMB III.
(c) WQ-C-03: Capacity Development to Improve Industry Adoption of Cleaner Production Options
Cleaner production is one of the most promising win-win solutions to industrial pollution. It involves a wide range of best practices, environmental management systems, waste minimization, and clean technology to prevent pollution. In practice,

Sector F: Water-Related Environment Management
F-37
cleaner production modifies manufacturing processes to reduce inefficiencies and to cut back on waste and discharge, leading to better product quality and cheaper products.
Industries in the Philippines have already embarked on the so-called green growth strategy by embracing eco-efficient technologies and cleaner production options. Examples in the basin include the following:
Livestock farms in Bulacan, Pampanga and Tarlac are equipped with waste-to-energy bio-digesters to capture methane for fuel or electricity
Sugar refineries of Pampanga and Tarlac use “bagasse” as fuels for heating steam turbines
Some sugar mills re-use and recycle effluents into cooling waters
Alcohol distillery convert their effluents into liquid fertilizer
Cement factories in Bulacan co-process waste materials and by-products from other industries as alternative fuel or raw material for cement clinker production
This proposed conceptual project aims to improve the adoption of such measures and similar emerging technologies by non-compliant industries. The program will be targeted particularly at small and medium enterprises (SMEs), who need to be more globally competitive and to realize the full economic benefits of cleaner production.
The program will involve the following specific activities:
Inventory of non-compliant industries
Organization of Cleaner Production (CP) Teams from participating industries
Evaluation of participating industries’ production and environmental management systems
Needs assessment and priority setting (e.g., vis-à-vis process flow/input-output analysis)
Institutional, policy, market-based financial support mechanisms
Preparation of industry-specific Clean Production Manuals
Training and technology transfer
IEC and other promotional activities
The project cost is estimated at 60Mil. Pesos. This may be implemented through a technical assistance by an international donor agency.
(d) WQ-G-01: Ecological Solid Waste Management Program (ESWMP)
Proper management would reduce the bulk of solid wastes, prevent leachate contamination and allow conversion of biodegradable refuse into useful by-products such as fertilizers and methane. Together, these measures will contribute significantly to BOD load reduction. At present, the LGUs help reduce domestic pollution load by implementing their respective 10-Year Ecological Solid Waste Management (ESWM) Plans pursuant to RA 9003. Efforts, however, are limited due to budgetary constraints.
As shown in Table F.6.2.5, the LGU’s implement only such soft measures as segregation at source; waste reduction, recycling and reuse (the 3Rs); and IEC. More than 50% of the LGUs in the basin have Materials Recovery Facilities (MRFs) at the barangay and municipal levels for composting and handling of recyclables. Most LGUs in Pampanga and N. Ecija still resort to open dumping, although 23 LGUs have upgraded into controlled dumpsites.
It is assumed that with adequate technical assistance, the LGUs will give their ESWM

Sector F: Water-Related Environment Management
F-38
Plans a more decisive push until 2025 in response to the Supreme Court’s continuing mandamus. This is expected to lead to the closure of all open dumpsites, complete segregation at source and implementation of the 3Rs in partnership with private business, operation and maintenance of MRFs and enhanced IEC activities.
Table F. 6.2.5 Status of Implementation of ESWM Plans as of 2008.
Province No. of
Cities/Mun.
Volume Waste Generation
No. of Compliant LGUs
(TPD) %
TotalSegrega- tion/3Rs
MRFs Open
DumpsiteControlled Dumpsite
Sanitary Landfill
Pampanga 22 660.46 6 6 16 1 5 Bulacan 24 2,031.48 16 16 10 11 3 N. Ecija 32 No data 10 10 31 1 0 Tarlac 18 172.5 No data No data None 10 8
TOTAL 96 32 32 57 23
Source: Provincial Planning and Development Offices/ENR Offices. 2009.
Implementing only the soft components of the ESWM Plans in the four provinces will entail an estimated cost of Php192M. This will be financed out of the internal revenue allotment (IRA) of the respective LGUs.
The private sector is actively involved in managing the basin’s solid waste streams through structural measures. Presently, there are two adequately engineered sanitary landfills that could readily accommodate all the residual domestic wastes generated in the basin. However, One is the 100-ha SLF in Sitio Kalangitan, Capas, Tarlac, which is operated by Metro Clark Waste Management Corporation (MCWMC). The facility is installed with double lined disposal pit, a leachate treatment facility and all necessary infrastructure, including the road network, power supply, weighbridge, office and maintenance buildings, and a Material Recovery Facility (MRF). It was built in 2000 and started operating in 2004. It was designed to contain seven cells with a capacity of 20 million metric tons and a projected serviceable lifespan of 25 years. Presently, only one cell has been constructed and receives residual wastes from most of the LGUs of Tarlac; the city of Angeles; and the municipalities of Lubao, Apalit and Bacolor in Pampanga and Plaridel and Sta. Maria in Bulacan. It also accommodates all the hospital and hazardous wastes from Region III, including industrial wastes from Clark SEZ.
The other SLF is located outside of but adjacent to the basin in Brgy. Sto. Cristo, San Jose del Monte City in Bulacan. It is owned and operated by the VG Puyat Group, Inc. Built in 2009, it now operates one cell within a 52-ha land, with possible expansion area of 118.0ha. It has a design capacity of 17.1 million m3 and a lifespan of 19.1 years based on a daily acceptance rate of 2,000tpd. The facility currently receives the municipal wastes of SJDM City, the host LGU. Negotiations are in progress so the company could provide nearby LGUs in Bulacan and Pampanga affordable access to the facility.
(e) WQ-G-03: Sagip-Ilog Projects of LGUs
The “Sagip-Ilog” Program is a river clean-up drive undertaken by the LGUs in coordination with the DENR.
At present the Sagip San Fernando River of the City government of San Fernando involves only clean up activities. Future plans, however, include dredging/desilting, slope protection works, bank re-vegetation, river park development, relocation of informal settlers, regulation of industries, and construction of centralized sewage system and sewerage treatment plants.
The Sagip-Ilog Angat is an initiative of the municipality of San Rafael, Bulacan. It initiated the inventory of industrial polluters and clean-up activities in partnership with industries and the private sector.
The LGU of Candaba also initiated de-silting, clean up and advocacy campaigns against

Sector F: Water-Related Environment Management
F-39
waste dumping in Candaba Swamp.
The Sagip-Ilog projects will require 11 Mil. Pesos to sustain until 2025. The funds will come from the IRA of the respective LGUs.
Sector F: Water-Related Environment Management
F-40
References
1) UNEP, GEF and CBD. 1997. Philippine Strategy for the Conservation of Biological Diversity (PSCBD): National Biodiversity Strategy and Action Plan (NBSAP).
2) Bureau of Agricultural Statistics. 2009. 3) DENR Administrative Order 30, series of 1994. 4) NWRC. Unpublished documents, 1982 5) DENR-GEF-UNDP-PEMSEA. Operational Plan for the Manila Bay Coastal Strategy. 2005. 6) DENR: The Manila Bay, Issues, Concerns, Challenges and the Need for Immediate Action. 7) DENR-GEF-UNDP-PEMSEA. Manila Bay refined Risk Assessment. May 2004. 8) World Bank. Philippine Environment Monitor. 2003. 9) DENR/JICA: Marilao-Meycauayan-Obando River System, Water Quality Management Area, Initial 10
year WQMA Action Plan, Final Report, Preparation of Water Quality Management Area Action Plan for Three Pilot Regions, Capacity Development Project on Water Quality Management in the Republic of the Philippines. 2009.
10) MWSS/JICA: Preparatory Survey for Metro Manila Sewerage and Sanitation Improvement, Final Report. 2009.
11) WHO. Rapid Assessment of Sources of Air, Water, and Land Pollution. 1982. 12) PhilRice. Preliminary Results of Evaluation of Agri-chemical Run-off from Selected Paddy Fields and
Water Wells in Nueva Ecija (Unpublished report). 2009. 13) DENR-EMB CDM Secretariat. Quick Facts on the Clean Development Mechanism (CDM) and the
Philippines Host Country Approval. Undated.

Annex-Tables

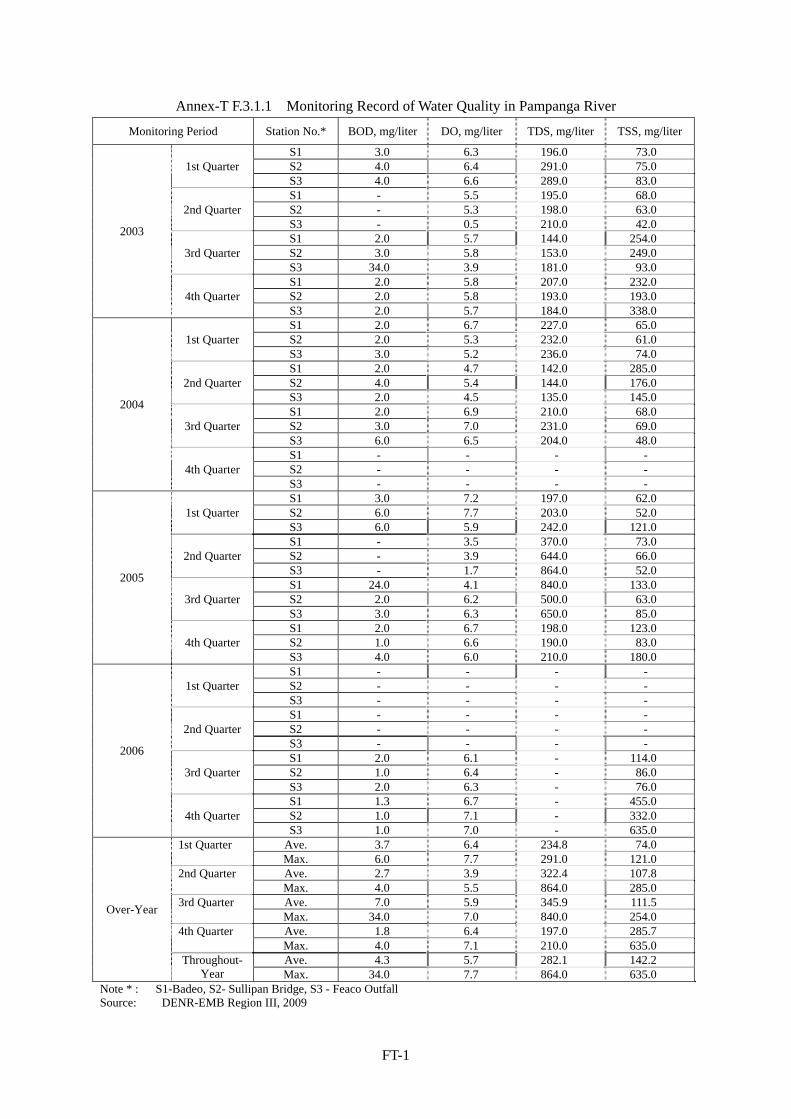
FT-1
Annex-T F.3.1.1 Monitoring Record of Water Quality in Pampanga River
Monitoring Period Station No.* BOD, mg/liter DO, mg/liter TDS, mg/liter TSS, mg/liter
2003
1st Quarter S1 3.0 6.3 196.0 73.0 S2 4.0 6.4 291.0 75.0 S3 4.0 6.6 289.0 83.0
2nd Quarter S1 - 5.5 195.0 68.0 S2 - 5.3 198.0 63.0 S3 - 0.5 210.0 42.0
3rd Quarter S1 2.0 5.7 144.0 254.0 S2 3.0 5.8 153.0 249.0 S3 34.0 3.9 181.0 93.0
4th Quarter S1 2.0 5.8 207.0 232.0 S2 2.0 5.8 193.0 193.0 S3 2.0 5.7 184.0 338.0
2004
1st Quarter S1 2.0 6.7 227.0 65.0 S2 2.0 5.3 232.0 61.0 S3 3.0 5.2 236.0 74.0
2nd Quarter S1 2.0 4.7 142.0 285.0 S2 4.0 5.4 144.0 176.0 S3 2.0 4.5 135.0 145.0
3rd Quarter S1 2.0 6.9 210.0 68.0 S2 3.0 7.0 231.0 69.0 S3 6.0 6.5 204.0 48.0
4th Quarter S1 - - - - S2 - - - - S3 - - - -
2005
1st Quarter S1 3.0 7.2 197.0 62.0 S2 6.0 7.7 203.0 52.0 S3 6.0 5.9 242.0 121.0
2nd Quarter S1 - 3.5 370.0 73.0 S2 - 3.9 644.0 66.0 S3 - 1.7 864.0 52.0
3rd Quarter S1 24.0 4.1 840.0 133.0 S2 2.0 6.2 500.0 63.0 S3 3.0 6.3 650.0 85.0
4th Quarter S1 2.0 6.7 198.0 123.0 S2 1.0 6.6 190.0 83.0 S3 4.0 6.0 210.0 180.0
2006
1st Quarter S1 - - - - S2 - - - - S3 - - - -
2nd Quarter S1 - - - - S2 - - - - S3 - - - -
3rd Quarter S1 2.0 6.1 - 114.0 S2 1.0 6.4 - 86.0 S3 2.0 6.3 - 76.0
4th Quarter S1 1.3 6.7 - 455.0 S2 1.0 7.1 - 332.0 S3 1.0 7.0 - 635.0
Over-Year
1st Quarter Ave. 3.7 6.4 234.8 74.0 Max. 6.0 7.7 291.0 121.0
2nd Quarter Ave. 2.7 3.9 322.4 107.8 Max. 4.0 5.5 864.0 285.0
3rd Quarter Ave. 7.0 5.9 345.9 111.5 Max. 34.0 7.0 840.0 254.0
4th Quarter Ave. 1.8 6.4 197.0 285.7 Max. 4.0 7.1 210.0 635.0
Throughout-Year
Ave. 4.3 5.7 282.1 142.2 Max. 34.0 7.7 864.0 635.0
Note * : S1-Badeo, S2- Sullipan Bridge, S3 - Feaco Outfall Source: DENR-EMB Region III, 2009

FT-2
Annex-T F.3.1.2 Monitoring Record of Water Quality for San Fernando River
Monitoring Period Station No.* BOD, mg/liter DO, mg/liter TDS, mg/liter TSS, mg/liter
2007
1st Quarter
Stn1 36.0 7.2 466.0 36.0 Stn2 22.0 7.7 539.0 214.0 Stn3 34.0 7.0 510.0 30.0 Stn4 5.0 7.0 201.0 71.0
3rd Quarter
Stn1 - 6.4 - 63.0 Stn2 - 7.0 - 54.0 Stn3 - 6.4 - 46.0 Stn4 - 6.3 - 62.0
4th Quarter
Stn1 13.0 5.8 - 29.0 Stn2 9.0 6.3 - 24.0 Stn3 7.0 7.0 - 21.0 Stn4 6.0 6.8 - 119.0
1st Quarter
Stn1 20.0 - - 27.0 Stn2 8.0 - - 53.0 Stn3 7.0 - - 67.0 Stn4 6.0 - - 54.0
2008
1st Quarter 2nd Quarter
Stn1 14.0 - - 21.0 Stn2 16.0 - - 32.0 Stn3 19.0 - - 21.0 Stn4 3.0 - - 25.0
3rd Quarter
Stn1 27.0 4.1 - 26.0 Stn2 24.0 3.8 - 21.0 Stn3 12.0 1.6 - 15.0 Stn4 12.0 3.1 - 19.0
4th Quarter
Stn1 25.0 3.2 - - Stn2 8.0 3.3 - - Stn3 15.0 1.8 - - Stn4 2.0 3.0 - -
1st Quarter
Stn1 6.0 3.1 - - Stn2 5.0 4.4 - - Stn3 2.0 3.1 - - Stn4 1.0 4.6 - -
Over-Year
1st Quarter Ave. 18.6 7.2 429.0 56.3 Max. 36.0 7.7 539.0 214.0
2nd Quarter Ave. 24.8 5.4 539.0 62.6 Max. 36.0 7.7 539.0 214.0
3rd Quarter Ave. 10.6 4.7 - 48.3 Max. 25.0 7.0 - 119.0
4th Quarter Ave. 6.9 3.8 - 50.3 Max. 20.0 4.6 0.0 67.0
Throughout-Year
Ave. 13.0 5.0 429.0 47.9 Max. 36.0 7.7 539.0 214.0
Note*: S1-Del Pilar Bridge, MacArthur Highway, S2-NLEX/San Felipe Foot Bridge, S3-San Jose Matulid, S4-Pederosa Bridge, McArthur Highway
Source: DENR-EMB Region III, 2009
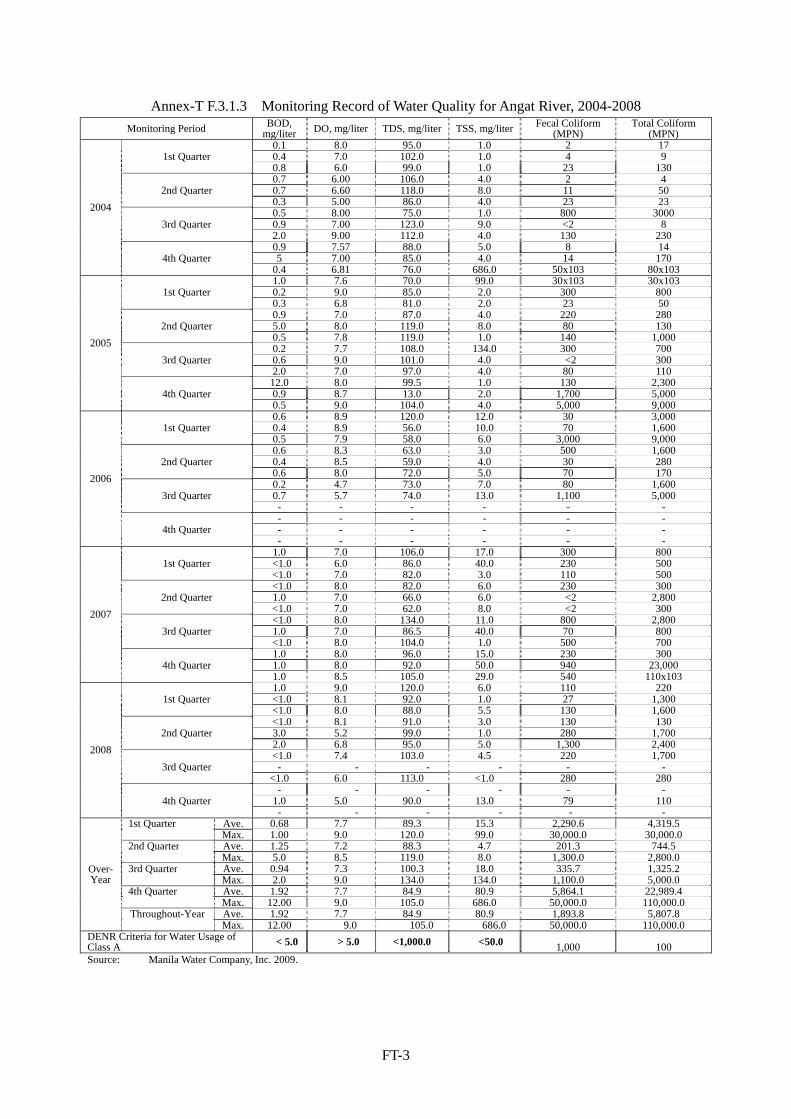
FT-3
Annex-T F.3.1.3 Monitoring Record of Water Quality for Angat River, 2004-2008
Monitoring Period BOD, mg/liter DO, mg/liter TDS, mg/liter TSS, mg/liter Fecal Coliform
(MPN) Total Coliform
(MPN)
2004
1st Quarter 0.1 8.0 95.0 1.0 2 170.4 7.0 102.0 1.0 4 90.8 6.0 99.0 1.0 23 130
2nd Quarter 0.7 6.00 106.0 4.0 2 40.7 6.60 118.0 8.0 11 50 0.3 5.00 86.0 4.0 23 23
3rd Quarter 0.5 8.00 75.0 1.0 800 3000 0.9 7.00 123.0 9.0 <2 8 2.0 9.00 112.0 4.0 130 230
4th Quarter 0.9 7.57 88.0 5.0 8 14 5 7.00 85.0 4.0 14 170
0.4 6.81 76.0 686.0 50x103 80x103
2005
1st Quarter 1.0 7.6 70.0 99.0 30x103 30x1030.2 9.0 85.0 2.0 300 800 0.3 6.8 81.0 2.0 23 50
2nd Quarter 0.9 7.0 87.0 4.0 220 280 5.0 8.0 119.0 8.0 80 130 0.5 7.8 119.0 1.0 140 1,000
3rd Quarter 0.2 7.7 108.0 134.0 300 700 0.6 9.0 101.0 4.0 <2 300 2.0 7.0 97.0 4.0 80 110
4th Quarter 12.0 8.0 99.5 1.0 130 2,300 0.9 8.7 13.0 2.0 1,700 5,000 0.5 9.0 104.0 4.0 5,000 9,000
2006
1st Quarter 0.6 8.9 120.0 12.0 30 3,000 0.4 8.9 56.0 10.0 70 1,600 0.5 7.9 58.0 6.0 3,000 9,000
2nd Quarter 0.6 8.3 63.0 3.0 500 1,600 0.4 8.5 59.0 4.0 30 280 0.6 8.0 72.0 5.0 70 170
3rd Quarter 0.2 4.7 73.0 7.0 80 1,600 0.7 5.7 74.0 13.0 1,100 5,000 - - - - - -
4th Quarter - - - - - -- - - - - -- - - - - -
2007
1st Quarter 1.0 7.0 106.0 17.0 300 800
<1.0 6.0 86.0 40.0 230 500 <1.0 7.0 82.0 3.0 110 500
2nd Quarter <1.0 8.0 82.0 6.0 230 300
1.0 7.0 66.0 6.0 <2 2,800 <1.0 7.0 62.0 8.0 <2 300
3rd Quarter <1.0 8.0 134.0 11.0 800 2,800
1.0 7.0 86.5 40.0 70 800 <1.0 8.0 104.0 1.0 500 700
4th Quarter 1.0 8.0 96.0 15.0 230 300 1.0 8.0 92.0 50.0 940 23,000 1.0 8.5 105.0 29.0 540 110x103
2008
1st Quarter 1.0 9.0 120.0 6.0 110 220
<1.0 8.1 92.0 1.0 27 1,300 <1.0 8.0 88.0 5.5 130 1,600
2nd Quarter <1.0 8.1 91.0 3.0 130 130
3.0 5.2 99.0 1.0 280 1,700 2.0 6.8 95.0 5.0 1,300 2,400
3rd Quarter <1.0 7.4 103.0 4.5 220 1,700
- - - - - -<1.0 6.0 113.0 <1.0 280 280
4th Quarter - - - - - -
1.0 5.0 90.0 13.0 79 110- - - - - -
Over- Year
1st Quarter Ave. 0.68 7.7 89.3 15.3 2,290.6 4,319.5 Max. 1.00 9.0 120.0 99.0 30,000.0 30,000.0
2nd Quarter Ave. 1.25 7.2 88.3 4.7 201.3 744.5 Max. 5.0 8.5 119.0 8.0 1,300.0 2,800.0
3rd Quarter Ave. 0.94 7.3 100.3 18.0 335.7 1,325.2 Max. 2.0 9.0 134.0 134.0 1,100.0 5,000.0
4th Quarter Ave. 1.92 7.7 84.9 80.9 5,864.1 22,989.4 Max. 12.00 9.0 105.0 686.0 50,000.0 110,000.0
Throughout-Year Ave. 1.92 7.7 84.9 80.9 1,893.8 5,807.8Max. 12.00 9.0 105.0 686.0 50,000.0 110,000.0
DENR Criteria for Water Usage of Class A < 5.0 > 5.0 <1,000.0 <50.0 1,000 100Source: Manila Water Company, Inc. 2009.
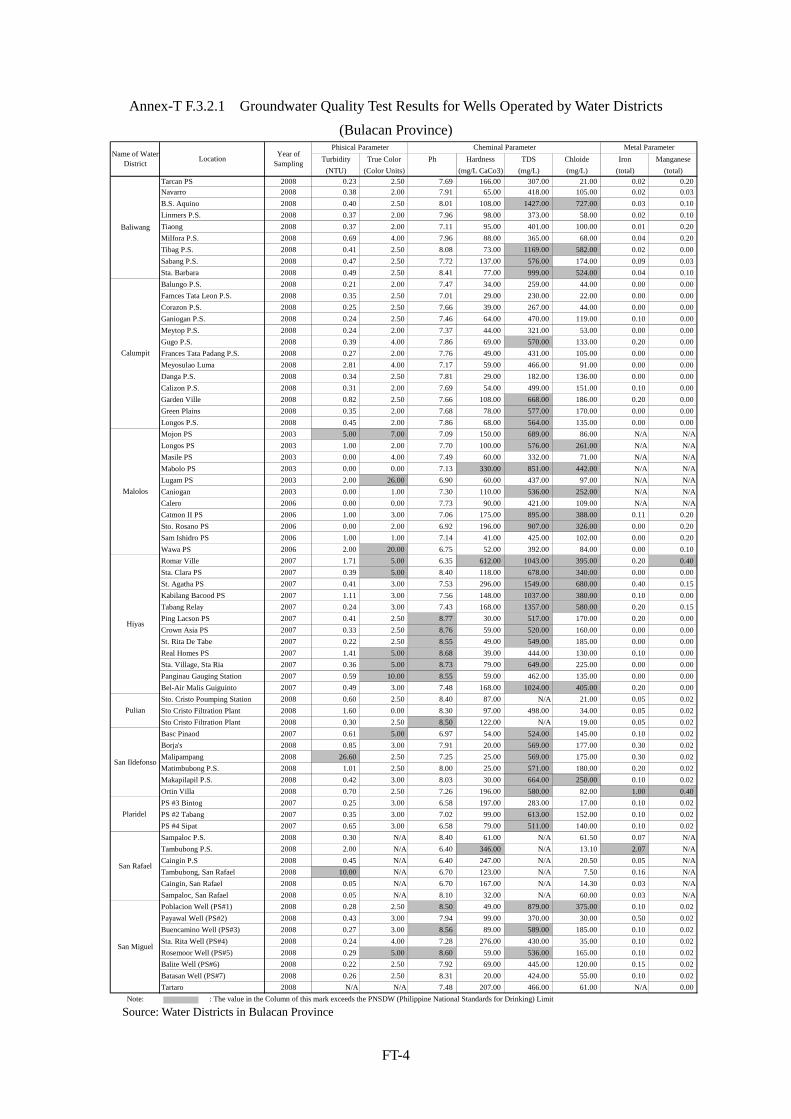
FT-4
Annex-T F.3.2.1 Groundwater Quality Test Results for Wells Operated by Water Districts
(Bulacan Province)
Turbidity True Color Ph Hardness TDS Chloide Iron Manganese
(NTU) (Color Units) (mg/L CaCo3) (mg/L) (mg/L) (total) (total)
Tarcan PS 2008 0.23 2.50 7.69 166.00 307.00 21.00 0.02 0.20
Navarro 2008 0.38 2.00 7.91 65.00 418.00 105.00 0.02 0.03
B.S. Aquino 2008 0.40 2.50 8.01 108.00 1427.00 727.00 0.03 0.10
Linmers P.S. 2008 0.37 2.00 7.96 98.00 373.00 58.00 0.02 0.10
Tiaong 2008 0.37 2.00 7.11 95.00 401.00 100.00 0.01 0.20
Milfora P.S. 2008 0.69 4.00 7.96 88.00 365.00 68.00 0.04 0.20
Tibag P.S. 2008 0.41 2.50 8.08 73.00 1169.00 582.00 0.02 0.00
Sabang P.S. 2008 0.47 2.50 7.72 137.00 576.00 174.00 0.09 0.03
Sta. Barbara 2008 0.49 2.50 8.41 77.00 999.00 524.00 0.04 0.10
Balungo P.S. 2008 0.21 2.00 7.47 34.00 259.00 44.00 0.00 0.00
Famces Tata Leon P.S. 2008 0.35 2.50 7.01 29.00 230.00 22.00 0.00 0.00
Corazon P.S. 2008 0.25 2.50 7.66 39.00 267.00 44.00 0.00 0.00
Ganiogan P.S. 2008 0.24 2.50 7.46 64.00 470.00 119.00 0.10 0.00
Meytop P.S. 2008 0.24 2.00 7.37 44.00 321.00 53.00 0.00 0.00
Gugo P.S. 2008 0.39 4.00 7.86 69.00 570.00 133.00 0.20 0.00
Frances Tata Padang P.S. 2008 0.27 2.00 7.76 49.00 431.00 105.00 0.00 0.00
Meyosulao Luma 2008 2.81 4.00 7.17 59.00 466.00 91.00 0.00 0.00
Danga P.S. 2008 0.34 2.50 7.81 29.00 182.00 136.00 0.00 0.00
Calizon P.S. 2008 0.31 2.00 7.69 54.00 499.00 151.00 0.10 0.00
Garden Ville 2008 0.82 2.50 7.66 108.00 668.00 186.00 0.20 0.00
Green Plains 2008 0.35 2.00 7.68 78.00 577.00 170.00 0.00 0.00
Longos P.S. 2008 0.45 2.00 7.86 68.00 564.00 135.00 0.00 0.00
Mojon PS 2003 5.00 7.00 7.09 150.00 689.00 86.00 N/A N/A
Longos PS 2003 1.00 2.00 7.70 100.00 576.00 261.00 N/A N/A
Masile PS 2003 0.00 4.00 7.49 60.00 332.00 71.00 N/A N/A
Mabolo PS 2003 0.00 0.00 7.13 330.00 851.00 442.00 N/A N/A
Lugam PS 2003 2.00 26.00 6.90 60.00 437.00 97.00 N/A N/A
Caniogan 2003 0.00 1.00 7.30 110.00 536.00 252.00 N/A N/A
Calero 2006 0.00 0.00 7.73 90.00 421.00 109.00 N/A N/A
Catmon II PS 2006 1.00 3.00 7.06 175.00 895.00 388.00 0.11 0.20
Sto. Rosano PS 2006 0.00 2.00 6.92 196.00 907.00 326.00 0.00 0.20
Sam Ishidro PS 2006 1.00 1.00 7.14 41.00 425.00 102.00 0.00 0.20
Wawa PS 2006 2.00 20.00 6.75 52.00 392.00 84.00 0.00 0.10
Romar Ville 2007 1.71 5.00 6.35 612.00 1043.00 395.00 0.20 0.40
Sta. Clara PS 2007 0.39 5.00 8.40 118.00 678.00 340.00 0.00 0.00
St. Agatha PS 2007 0.41 3.00 7.53 296.00 1549.00 680.00 0.40 0.15
Kabilang Bacood PS 2007 1.11 3.00 7.56 148.00 1037.00 380.00 0.10 0.00
Tabang Relay 2007 0.24 3.00 7.43 168.00 1357.00 580.00 0.20 0.15
Ping Lacson PS 2007 0.41 2.50 8.77 30.00 517.00 170.00 0.20 0.00
Crown Asia PS 2007 0.33 2.50 8.76 59.00 520.00 160.00 0.00 0.00
St. Rita De Tabe 2007 0.22 2.50 8.55 49.00 549.00 185.00 0.00 0.00
Real Homes PS 2007 1.41 5.00 8.68 39.00 444.00 130.00 0.10 0.00
Sta. Village, Sta Ria 2007 0.36 5.00 8.73 79.00 649.00 225.00 0.00 0.00
Panginau Gauging Station 2007 0.59 10.00 8.55 59.00 462.00 135.00 0.00 0.00
Bel-Air Malis Guiguinto 2007 0.49 3.00 7.48 168.00 1024.00 405.00 0.20 0.00
Sto. Cristo Poumping Station 2008 0.60 2.50 8.40 87.00 N/A 21.00 0.05 0.02
Sto Cristo Filtration Plant 2008 1.60 0.00 8.30 97.00 498.00 34.00 0.05 0.02
Sto Cristo Filtration Plant 2008 0.30 2.50 8.50 122.00 N/A 19.00 0.05 0.02
Basc Pinaod 2007 0.61 5.00 6.97 54.00 524.00 145.00 0.10 0.02
Borja's 2008 0.85 3.00 7.91 20.00 569.00 177.00 0.30 0.02
Malipampang 2008 26.60 2.50 7.25 25.00 569.00 175.00 0.30 0.02
Matimbubong P.S. 2008 1.01 2.50 8.00 25.00 571.00 180.00 0.20 0.02
Makapilapil P.S. 2008 0.42 3.00 8.03 30.00 664.00 250.00 0.10 0.02
Ortin Villa 2008 0.70 2.50 7.26 196.00 580.00 82.00 1.00 0.40
PS #3 Bintog 2007 0.25 3.00 6.58 197.00 283.00 17.00 0.10 0.02
PS #2 Tabang 2007 0.35 3.00 7.02 99.00 613.00 152.00 0.10 0.02
PS #4 Sipat 2007 0.65 3.00 6.58 79.00 511.00 140.00 0.10 0.02
Sampaloc P.S. 2008 0.30 N/A 8.40 61.00 N/A 61.50 0.07 N/A
Tambubong P.S. 2008 2.00 N/A 6.40 346.00 N/A 13.10 2.07 N/A
Caingin P.S 2008 0.45 N/A 6.40 247.00 N/A 20.50 0.05 N/A
Tambubong, San Rafael 2008 10.00 N/A 6.70 123.00 N/A 7.50 0.16 N/A
Caingin, San Rafael 2008 0.05 N/A 6.70 167.00 N/A 14.30 0.03 N/A
Sampaloc, San Rafael 2008 0.05 N/A 8.10 32.00 N/A 60.00 0.03 N/A
Poblacion Well (PS#1) 2008 0.28 2.50 8.50 49.00 879.00 375.00 0.10 0.02
Payawal Well (PS#2) 2008 0.43 3.00 7.94 99.00 370.00 30.00 0.50 0.02
Buencamino Well (PS#3) 2008 0.27 3.00 8.56 89.00 589.00 185.00 0.10 0.02
Sta. Rita Well (PS#4) 2008 0.24 4.00 7.28 276.00 430.00 35.00 0.10 0.02
Rosemoor Well (PS#5) 2008 0.29 5.00 8.60 59.00 536.00 165.00 0.10 0.02
Balite Well (PS#6) 2008 0.22 2.50 7.92 69.00 445.00 120.00 0.15 0.02
Batasan Well (PS#7) 2008 0.26 2.50 8.31 20.00 424.00 55.00 0.10 0.02
Tartaro 2008 N/A N/A 7.48 207.00 466.00 61.00 N/A 0.00
Note: : The value in the Column of this mark exceeds the PNSDW (Philippine National Standards for Drinking) Limit
Year ofSampling
Pulian
Name of WaterDistrict
Location
Baliwang
Calumpit
Malolos
Hiyas
San Ildefonso
Plaridel
San Rafael
San Miguel
Phisical Parameter Cheminal Parameter Metal Parameter
Source: Water Districts in Bulacan Province

FT-5
Annex-T F.3.2.2 Groundwater Quality Test Results for Wells Operated by Water Districts
(Pampanga Province)
Turbidity True Color Ph Hardness TDS Chloide Iron Manganese
(NTU) (Color Units) (mg/L CaCo3) (mg/L) (mg/L) (total) (total)
P.S. 1 2008 0.21 0.00 6.50 109.45 190.80 44.99 0.06 0.00
P.S. 2 2008 0.36 0.00 6.90 129.35 118.50 9.99 0.05 0.00
P.S. 3 2008 0.22 0.00 6.50 208.95 90.50 9.99 0.00 0.00
P.S. 1 2008 0.21 0.00 6.50 109.45 190.80 44.99 0.06 0.00
P.S. 2 2008 0.36 0.00 6.90 129.35 118.50 9.99 0.05 0.00
P.S. 3 2008 0.22 0.00 6.50 208.95 90.50 9.99 0.00 0.00
P.S. 7 2008 0.25 0.00 6.50 199.00 159.20 19.99 0.07 0.02
Anunas P.S. 2008 0.35 0.00 6.50 129.35 93.50 9.99 0.18 0.05
Bagong Bayan P.S. 2008 0.40 0.00 6.60 169.15 106.90 14.99 0.08 0.02
Belen Homesite P.S. 2008 0.14 0.00 6.50 119.40 104.50 4.99 0.03 0.04
Cuayan P.S. 2008 0.25 0.00 6.80 119.40 81.40 9.99 0.00 0.00
City Hall P.S. 2008 1.07 0.00 7.20 149.25 153.00 9.99 0.32 0.20
Epza P.S. 2008 1.15 0.00 7.50 179.10 153.40 4.99 0.16 0.20
Magalang Ave P.S. 2008 0.20 0.00 6.60 109.45 107.10 19.99 0.00 0.00
Mabini P.S. 2008 0.28 0.00 6.60 159.20 172.00 19.99 0.00 0.01
Mc Arthur Hiway P.S. 2008 0.15 0.00 6.50 119.40 110.30 9.99 0.08 0.01
Metrogate P.S. 2008 2.77 1.80 7.00 129.35 111.70 14.99 0.15 0.03
Old Pampang 2008 0.41 0.00 6.50 119.40 91.20 14.99 0.00 0.04
Robinsons Homes P.S. 2008 0.27 0.00 6.50 89.55 93.80 9.99 0.00 0.00
Rosewood P.S. 2008 0.64 1.20 6.60 139.30 77.90 4.99 0.05 0.00
Sapang Bato P.S. 2008 0.19 0.00 6.60 89.55 99.00 9.99 0.00 0.03
Sapalibutad P.S. 2008 1.88 1.70 7.30 0.00 148.30 9.99 0.04 0.07
Sta. Teresita P.S. 2008 0.21 0.00 6.60 0.00 96.00 4.99 0.00 0.00
Town & Country P.S. 2008 0.47 1.80 7.00 0.00 104.70 4.99 0.00 0.04
Poblacion 2008 0.27 2.50 6.85 N/A 104.00 3.00 0.00 0.00
Fortuna 2008 0.28 2.50 7.11 N/A 132.00 5.00 0.00 0.00
San Jose 2008 0.50 2.50 7.08 N/A 109.00 3.00 0.00 0.00
P-1 2008 0.32 2.50 6.71 N/A 252.00 13.00 0.00 0.06
Phase III 2008 3.56 4.00 6.96 N/A 414.00 26.00 0.19 0.00
Bodega 2008 0.53 3.00 6.75 N/A 196.00 10.00 0.00 0.00
Valdez 2008 0.65 2.50 6.72 N/A 144.00 5.00 0.00 0.00
Paguiruan 2008 0.37 2.50 6.63 N/A 156.00 5.00 0.00 0.03
San Pedro 2008 0.31 2.50 6.96 N/A 120.00 5.00 0.02 0.00
Palmayo 2008 0.33 2.50 6.93 N/A 404.00 16.00 0.00 0.00
Dampa 2008 0.10 N/A 6.82 N/A 198.00 13.00 0.33 0.23
P.S. No.7 - San Pablo 2007 0.33 0.50 7.60 100.00 142.30 9.99 0.11 0.07
P.S. No.8 - Samsaman, Betis 2007 0.20 0.50 7.20 80.00 193.10 19.99 0.05 0.07
P.S. No.10 - LM Subd. Sta. Filom 2007 0.48 2.10 6.80 80.00 171.70 19.99 0.02 0.36
P.S. No.11 - LM Subd. Sta. Anton 2007 0.34 0.60 6.50 90.00 130.20 14.99 0.16 0.20
P.S. No.12 - Bancal 2007 0.35 1.70 7.20 70.00 146.90 14.99 0.04 0.05
P.S. No.1 - San Nicolas 2007 0.27 0.50 6.80 140.00 156.50 14.99 0.04 0.59
P.S. No.5 - Sto. Cristo 2007 0.50 0.50 7.60 110.00 161.70 19.99 0.02 0.11
Pupm No.6 - San Miguel, Betis 2007 0.15 0.50 6.90 190.00 191.80 34.99 0.03 0.12
San Nicolaes P.S. 2008 0.28 2.50 7.49 108.00 230.00 10.00 0.00 0.00
Sta. Crus P.S. 2008 0.34 2.50 7.52 59.00 499.00 92.00 0.00 0.00
Sto. Tomas P.S. 2008 0.30 2.50 7.61 68.00 219.00 7.00 0.00 0.00
Sto. Nino 2008 0.28 2.50 6.95 235.00 460.00 111.00 0.00 0.00
P.S. No.1 - Palengke N/A 0.80 N/A 6.84 66.00 212.00 0.98 0.22 0.25
P.S. No.3 - Dona Maria Subd. N/A 0.80 N/A 6.58 85.00 223.00 3.90 0.26 0.05
P.S. No.4 - Cacutud 2008 N/A N/A 7.10 132.00 312.00 8.10 0.26 0.50
P.S. No.5 - Filipininana Subd. N/A 2.00 N/A 6.61 61.00 196.00 2.90 0.96 0.08
P.S. No.6 - Dona Anastacia Subd. N/A 0.80 N/A 6.60 68.00 208.00 3.90 0.32 0.22
P.S. No.7 - Canidha, Camachiles N/A 2.00 N/A 6.51 83.00 222.00 3.90 0.21 0.05
P.S. No.8 - Barangay Subd. Dau N/A 0.80 N/A 6.60 61.00 190.00 2.90 0.74 0.03
P.S. No.9 - Dela Cruz Lim Subd. N/A 2.00 N/A 6.70 50.00 163.00 0.98 0.50 0.11
P.S. No.10 - Duquit N/A 1.60 N/A 6.69 86.00 206.00 2.00 0.65 0.26
P.S. No.11 - Sta. Ines N/A 0.80 N/A 6.89 60.00 182.00 0.98 0.42 0.21
P.S. No.12 - San Rafael Village N/A 2.00 N/A 6.59 73.00 206.00 4.90 0.63 0.09
P.S. No.13 - Lemens Village N/A 0.80 N/A 6.62 80.00 196.00 3.90 0.26 0.05
P.S. No.14 - Camachiles Road N/A 2.00 N/A 6.59 80.00 214.00 4.90 0.69 0.09
Phase # 2 CRC N/A 2.00 N/A 6.61 71.00 216.00 3.90 0.61 0.11
P.S. No.1 - Metroclark N/A 0.80 N/A 7.06 81.00 266.00 3.90 0.42 0.45
P.S. No.3 - Madapdap N/A 2.00 N/A 7.04 58.00 204.00 2.90 0.61 0.44
P.S. No.4 - Madapdap N/A 0.80 N/A 6.96 70.00 213.00 3.90 0.51 0.50
P.S. No.5 - Madapdap N/A 0.80 N/A 6.90 62.00 204.00 2.90 0.62 0.46
P.S. No.7 - Madapdap N/A 2.00 N/A 7.07 57.00 174.00 2.00 0.64 0.27
P.S. No.8 - Madapdap N/A 5.00 N/A 6.81 110.00 258.00 6.40 1.40 0.90
P.S. No.9 - Madapdap N/A 2.00 N/A 7.01 84.00 239.00 2.90 0.84 0.35
P.S. No.18 - San Felipe 2008 0.31 0.50 7.20 90.00 153.30 24.99 0.04 0.03
P.S. No.3 - Del Pilar 2008 0.41 0.50 7.10 100.00 173.50 29.99 0.02 0.07
P.S. No.12 - Moras 2008 0.36 0.50 6.80 100.00 163.10 24.99 0.05 0.84
P.S. No.5 - San Pedro 2008 0.35 0.50 6.80 90.00 194.70 14.99 0.02 0.04
P.S. No.11 - Sta. Lucia 2008 0.25 2.00 6.70 110.00 183.20 24.99 0.04 0.04
P.S. No.2 - Poblacion 2008 0.33 0.50 7.10 80.00 182.70 24.99 0.17 0.06
P.S. No.4 - Dolores 2008 0.17 0.50 7.20 70.00 161.90 24.99 0.05 0.02
P.S. No.6 - Villa Barosa 2008 0.48 1.10 7.00 70.00 184.90 19.99 0.11 0.01
P.S. No.9 - Villa Del Sol 2008 0.45 0.50 6.60 90.00 157.90 19.99 0.08 0.09
P.S. No.2 - St. Jude 2008 0.47 0.50 6.70 130.00 159.80 39.99 0.01 0.74
P.S. No.20 - San Jose 2008 0.31 0.50 7.00 69.65 159.30 29.99 0.01 0.04
P.S. No.20 - Greenville 2008 0.31 0.50 6.90 89.55 140.00 19.99 0.06 0.02
P.S. No.10 - St. Francis 2008 0.36 0.50 7.10 69.65 172.90 19.99 0.02 0.02
P.S. No.15 - Quebiawan 2008 0.27 0.70 6.50 59.70 150.60 39.99 0.07 0.08
P.S. No.13 - Maimpis 2008 0.35 1.20 8.60 79.60 114.00 14.99 0.20 0.19
P.S. No.16 - Villa Isabel 2008 1.19 0.50 6.60 89.55 96.50 9.99 0.10 0.19
P.S. No.3 - Near River 2008 0.46 0.90 6.50 89.50 101.10 14.99 0.03 0.39
P.S. No.19 - San Vicente 2008 0.76 0.60 6.50 119.40 119.90 9.99 0.28 0.22
P.S. No.21 - San Fernando Subd. 2008 0.28 1.20 6.80 69.65 210.00 24.99 0.04 0.04
Note: : The value in the Column of this mark exceeds the PNSDW (Philippine National Standards for Drinking) Limit
Angeles
Florida Blanca
Guagua
Lubao
Mabalacat
San Fernando
Name of WaterDistrict
Location
Phisical Parameter Cheminal Parameter Metal Parameter
Source: Water Districts in Pampanga Province
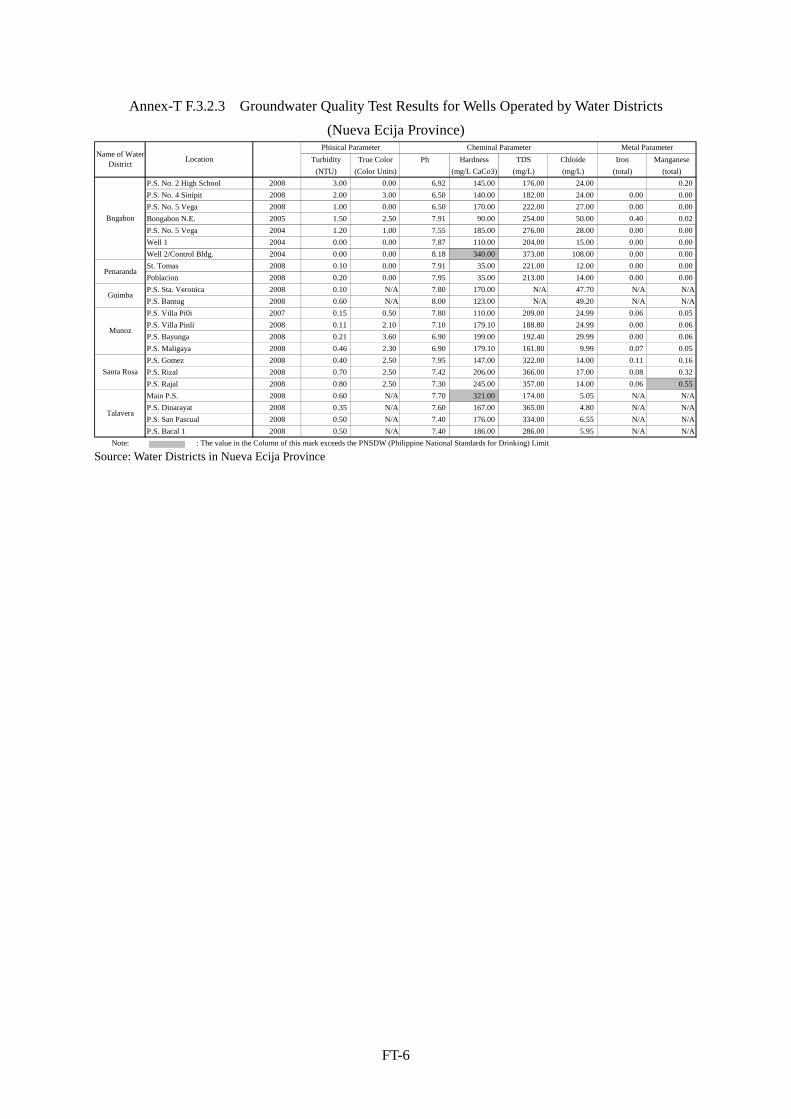
FT-6
Annex-T F.3.2.3 Groundwater Quality Test Results for Wells Operated by Water Districts
(Nueva Ecija Province)
Turbidity True Color Ph Hardness TDS Chloide Iron Manganese
(NTU) (Color Units) (mg/L CaCo3) (mg/L) (mg/L) (total) (total)
P.S. No. 2 High School 2008 3.00 0.00 6.92 145.00 176.00 24.00 0.20
P.S. No. 4 Sinipit 2008 2.00 3.00 6.50 140.00 182.00 24.00 0.00 0.00
P.S. No. 5 Vega 2008 1.00 0.00 6.50 170.00 222.00 27.00 0.00 0.00
Bongabon N.E. 2005 1.50 2.50 7.91 90.00 254.00 50.00 0.40 0.02
P.S. No. 5 Vega 2004 1.20 1.00 7.55 185.00 276.00 28.00 0.00 0.00
Well 1 2004 0.00 0.00 7.87 110.00 204.00 15.00 0.00 0.00
Well 2/Control Bldg. 2004 0.00 0.00 8.18 340.00 373.00 108.00 0.00 0.00
St. Tomas 2008 0.10 0.00 7.91 35.00 221.00 12.00 0.00 0.00
Poblacion 2008 0.20 0.00 7.95 35.00 213.00 14.00 0.00 0.00
P.S. Sta. Veronica 2008 0.10 N/A 7.80 170.00 N/A 47.70 N/A N/A
P.S. Bantug 2008 0.60 N/A 8.00 123.00 N/A 49.20 N/A N/A
P.S. Villa Pi0i 2007 0.15 0.50 7.80 110.00 209.00 24.99 0.06 0.05
P.S. Villa Pinli 2008 0.11 2.10 7.10 179.10 188.80 24.99 0.00 0.06
P.S. Bayunga 2008 0.21 3.60 6.90 199.00 192.40 29.99 0.00 0.06
P.S. Maligaya 2008 0.46 2.30 6.90 179.10 161.80 9.99 0.07 0.05
P.S. Gomez 2008 0.40 2.50 7.95 147.00 322.00 14.00 0.11 0.16
P.S. Rizal 2008 0.70 2.50 7.42 206.00 366.00 17.00 0.08 0.32
P.S. Rajal 2008 0.80 2.50 7.30 245.00 357.00 14.00 0.06 0.55
Main P.S. 2008 0.60 N/A 7.70 321.00 174.00 5.05 N/A N/A
P.S. Dinarayat 2008 0.35 N/A 7.60 167.00 365.00 4.80 N/A N/A
P.S. San Pascual 2008 0.50 N/A 7.40 176.00 334.00 6.55 N/A N/A
P.S. Bacal 1 2008 0.50 N/A 7.40 186.00 286.00 5.95 N/A N/A
Note: : The value in the Column of this mark exceeds the PNSDW (Philippine National Standards for Drinking) Limit
Name of WaterDistrict
Location
Penaranda
Talavera
Bngabon
Guimba
Santa Rosa
Phisical Parameter Cheminal Parameter Metal Parameter
Munoz
Source: Water Districts in Nueva Ecija Province

FT-7
Annex-T F.4.3.1 Pollution Load and Pollution Load Density by Water Balance Catchment
Pollution Load(kg-BOD/day)
Domestic Industrial Fishpond Livestock Cultivated Total
2008 2025 20082025w/o
2025wi
20082025w/o
2025wi
20082025w/o
2025wi
20082025w/o
2025wi
20082025w/o
2025wi
20082025w/o
2025wi
PAM01 159.2 190,003 262,555 4,706 6,360 5,996 1,282 1,732 1,732 10,964 10,964 10,964 112 156 156 7 7 7 17,071 19,219 18,855
PAM0201 1,458.1 962,182 1,321,736 23,045 30,551 30,037 6,276 8,321 8,321 5,006 5,006 5,006 6,260 8,808 8,808 656 656 656 41,242 53,341 52,826
PAM0202 52.6 8,853 12,900 186 262 262 51 71 71 12 12 12 117 165 165 7 7 7 373 517 517
PAM0203 6.6 4,497 5,761 97 116 116 27 31 31 17 17 17 8 12 12 0 0 0 150 176 176
PAM03 39.8 24,196 30,370 612 736 736 167 201 201 123 123 123 103 137 137 15 15 15 1,019 1,212 1,212
PAM0401 771.1 456,767 573,009 11,125 13,650 12,307 3,030 3,718 3,718 1,047 1,047 1,047 2,035 2,805 2,805 350 350 350 17,587 21,570 20,226
PAM0402 27.6 8,258 10,359 183 217 217 50 59 59 16 16 16 46 64 64 11 11 11 305 367 367
PAM0501 384.7 109,292 137,104 2,338 2,761 2,761 637 752 752 71 71 71 495 710 710 85 85 85 3,625 4,378 4,378
PAM0502 31.6 2,474 3,104 51 59 59 14 16 16 2 2 2 23 33 33 3 3 3 93 113 113
PAM0503 20.3 1,253 1,571 26 29 29 7 8 8 1 1 1 13 19 19 0 0 0 47 57 57
PAN01 849.4 43,547 54,630 1,044 1,190 1,190 284 324 324 24 24 24 395 572 572 39 39 39 1,787 2,149 2,149
RCH0101 1,489.5 1,027,949 1,301,785 24,544 30,066 29,043 6,684 8,188 8,159 2,331 2,331 2,331 4,087 5,672 5,672 726 726 726 38,372 46,983 45,929
RCH0102 696.4 323,977 407,405 7,382 8,976 8,894 2,011 2,444 2,444 448 448 448 2,008 2,880 2,880 406 406 406 12,255 15,153 15,072
RCH0103 408.3 233,736 293,217 5,598 6,747 6,747 1,525 1,837 1,837 457 457 457 1,286 1,799 1,799 227 227 227 9,092 11,067 11,067
RCH0104 301.1 14,357 18,011 346 386 386 94 105 105 8 8 8 157 227 227 3 3 3 608 729 729
PEN0101 51.2 24,544 30,790 582 700 700 158 191 191 50 50 50 182 247 247 27 27 27 1,000 1,214 1,214
PEN0102 269.7 35,968 45,121 835 1,013 1,013 227 276 276 76 76 76 401 555 555 28 28 28 1,567 1,948 1,948
PEN0103 248.8 13,116 16,779 317 382 382 86 104 104 11 11 11 197 275 275 0 0 0 611 772 772
COR01 712.0 74,798 93,833 1,850 2,195 2,195 504 598 598 98 98 98 495 708 708 82 82 82 3,029 3,680 3,680
ANG01 193.5 415,027 604,748 10,789 15,441 14,387 2,938 4,205 4,205 13,816 13,816 13,816 309 434 434 39 39 39 27,892 33,935 32,881
ANG0201 46.0 98,432 143,429 2,497 3,596 3,503 680 979 979 114 114 114 366 522 522 14 14 14 3,672 5,227 5,133
ANG0202 176.0 97,493 142,061 2,161 3,073 3,073 588 837 837 146 146 146 1,120 1,613 1,613 56 56 56 4,070 5,724 5,724
ANG0203 52.1 1,161 1,692 24 30 30 7 8 8 0 0 0 7 10 10 0 0 0 39 49 49
ANG0204 71.7 27,298 39,778 796 1,119 1,119 217 305 305 5 5 5 115 163 163 1 1 1 1,134 1,593 1,593
ANG03 545.9 45,038 65,604 1,647 2,245 2,245 448 611 611 7 7 7 209 298 298 1 1 1 2,312 3,161 3,161
PAS0101 137.7 108,099 138,484 2,815 3,390 3,390 767 923 923 9,063 9,063 9,063 333 439 439 27 27 27 13,004 13,841 13,841
PAS0102 198.3 240,278 307,815 5,907 7,215 7,080 1,609 1,965 1,965 10,027 10,027 10,027 1,061 1,352 1,352 38 38 38 18,642 20,596 20,461
PAS0103 398.4 787,070 1,008,298 20,463 24,734 23,270 5,573 6,736 6,733 2,344 2,344 2,344 1,438 1,920 1,920 140 140 140 29,958 35,874 34,406
PAS0104 341.9 297,798 381,502 7,498 9,311 8,950 2,042 2,536 2,536 14,904 14,904 14,904 939 1,263 1,263 103 103 103 25,486 28,118 27,756
PAS0105 47.2 39,111 50,104 891 1,120 1,119 243 305 305 232 232 232 110 154 154 22 22 22 1,498 1,833 1,832
PAS0106 115.6 45,556 58,360 1,091 1,379 1,371 297 376 376 252 252 252 239 327 327 33 33 33 1,912 2,367 2,359
PAS0107 14.4 12,542 16,068 284 358 358 77 98 98 50 50 50 33 47 47 3 3 3 448 555 555
PAS0108 117.9 22,056 28,255 640 799 799 174 217 217 69 69 69 95 130 130 6 6 6 984 1,222 1,222
Total 10,434.4 5,796,726 7,606,238 142,371 180,206 173,762 38,774 49,078 49,045 71,791 71,791 71,791 24,794 34,513 34,513 3,153 3,153 3,153 280,883 338,742 332,264
Pollution Load Density
(kg-BOD/day/km2)
Domestic Industrial Fishpond Livestock Cultivated Total
2008 2025 20082025w/o
2025wi
20082025w/o
2025wi
20082025w/o
2025wi
20082025w/o
2025wi
20082025w/o
2025wi
20082025w/o
2025wi
PAM01 159.2 1,193 1,649 29.6 40.0 37.7 8.1 10.9 10.9 68.9 68.9 68.9 0.7 1.0 1.0 0.0 0.0 0.0 107.2 120.7 118.4
PAM0201 1,458.1 660 906 15.8 21.0 20.6 4.3 5.7 5.7 3.4 3.4 3.4 4.3 6.0 6.0 0.4 0.4 0.4 28.3 36.6 36.2
PAM0202 52.6 168 245 3.5 5.0 5.0 1.0 1.4 1.4 0.2 0.2 0.2 2.2 3.1 3.1 0.1 0.1 0.1 7.1 9.8 9.8
PAM0203 6.6 682 873 14.8 17.5 17.5 4.0 4.8 4.8 2.6 2.6 2.6 1.3 1.7 1.7 0.1 0.1 0.1 22.7 26.7 26.7
PAM03 39.8 608 763 15.4 18.5 18.5 4.2 5.0 5.0 3.1 3.1 3.1 2.6 3.5 3.5 0.4 0.4 0.4 25.6 30.5 30.5
PAM0401 771.1 592 743 14.4 17.7 16.0 3.9 4.8 4.8 1.4 1.4 1.4 2.6 3.6 3.6 0.5 0.5 0.5 22.8 28.0 26.2
PAM0402 27.6 300 376 6.6 7.9 7.9 1.8 2.1 2.1 0.6 0.6 0.6 1.7 2.3 2.3 0.4 0.4 0.4 11.1 13.3 13.3
PAM0501 384.7 284 356 6.1 7.2 7.2 1.7 2.0 2.0 0.2 0.2 0.2 1.3 1.8 1.8 0.2 0.2 0.2 9.4 11.4 11.4
PAM0502 31.6 78 98 1.6 1.9 1.9 0.4 0.5 0.5 0.1 0.1 0.1 0.7 1.0 1.0 0.1 0.1 0.1 3.0 3.6 3.6
PAM0503 20.3 62 77 1.3 1.4 1.4 0.3 0.4 0.4 0.0 0.0 0.0 0.6 0.9 0.9 0.0 0.0 0.0 2.3 2.8 2.8
PAN01 849.4 51 64 1.2 1.4 1.4 0.3 0.4 0.4 0.0 0.0 0.0 0.5 0.7 0.7 0.0 0.0 0.0 2.1 2.5 2.5
RCH0101 1,489.5 690 874 16.5 20.2 19.5 4.5 5.5 5.5 1.6 1.6 1.6 2.7 3.8 3.8 0.5 0.5 0.5 25.8 31.5 30.8
RCH0102 696.4 465 585 10.6 12.9 12.8 2.9 3.5 3.5 0.6 0.6 0.6 2.9 4.1 4.1 0.6 0.6 0.6 17.6 21.8 21.6
RCH0103 408.3 573 718 13.7 16.5 16.5 3.7 4.5 4.5 1.1 1.1 1.1 3.1 4.4 4.4 0.6 0.6 0.6 22.3 27.1 27.1
RCH0104 301.1 48 60 1.1 1.3 1.3 0.3 0.3 0.3 0.0 0.0 0.0 0.5 0.8 0.8 0.0 0.0 0.0 2.0 2.4 2.4
PEN0101 51.2 479 601 11.4 13.7 13.7 3.1 3.7 3.7 1.0 1.0 1.0 3.6 4.8 4.8 0.5 0.5 0.5 19.5 23.7 23.7
PEN0102 269.7 133 167 3.1 3.8 3.8 0.8 1.0 1.0 0.3 0.3 0.3 1.5 2.1 2.1 0.1 0.1 0.1 5.8 7.2 7.2
PEN0103 248.8 53 67 1.3 1.5 1.5 0.3 0.4 0.4 0.0 0.0 0.0 0.8 1.1 1.1 0.0 0.0 0.0 2.5 3.1 3.1
COR01 712.0 105 132 2.6 3.1 3.1 0.7 0.8 0.8 0.1 0.1 0.1 0.7 1.0 1.0 0.1 0.1 0.1 4.3 5.2 5.2
ANG01 193.5 2,145 3,125 55.8 79.8 74.4 15.2 21.7 21.7 71.4 71.4 71.4 1.6 2.2 2.2 0.2 0.2 0.2 144.1 175.4 169.9
ANG0201 46.0 2,141 3,120 54.3 78.2 76.2 14.8 21.3 21.3 2.5 2.5 2.5 8.0 11.4 11.4 0.3 0.3 0.3 79.9 113.7 111.7
ANG0202 176.0 554 807 12.3 17.5 17.5 3.3 4.8 4.8 0.8 0.8 0.8 6.4 9.2 9.2 0.3 0.3 0.3 23.1 32.5 32.5
ANG0203 52.1 22 32 0.5 0.6 0.6 0.1 0.2 0.2 0.0 0.0 0.0 0.1 0.2 0.2 0.0 0.0 0.0 0.7 0.9 0.9
ANG0204 71.7 380 554 11.1 15.6 15.6 3.0 4.2 4.2 0.1 0.1 0.1 1.6 2.3 2.3 0.0 0.0 0.0 15.8 22.2 22.2
ANG03 545.9 83 120 3.0 4.1 4.1 0.8 1.1 1.1 0.0 0.0 0.0 0.4 0.5 0.5 0.0 0.0 0.0 4.2 5.8 5.8
PAS0101 137.7 785 1,006 20.4 24.6 24.6 5.6 6.7 6.7 65.8 65.8 65.8 2.4 3.2 3.2 0.2 0.2 0.2 94.5 100.5 100.5
PAS0102 198.3 1,212 1,553 29.8 36.4 35.7 8.1 9.9 9.9 50.6 50.6 50.6 5.4 6.8 6.8 0.2 0.2 0.2 94.0 103.9 103.2
PAS0103 398.4 1,976 2,531 51.4 62.1 58.4 14.0 16.9 16.9 5.9 5.9 5.9 3.6 4.8 4.8 0.4 0.4 0.4 75.2 90.1 86.4
PAS0104 341.9 871 1,116 21.9 27.2 26.2 6.0 7.4 7.4 43.6 43.6 43.6 2.7 3.7 3.7 0.3 0.3 0.3 74.6 82.2 81.2
PAS0105 47.2 828 1,061 18.9 23.7 23.7 5.1 6.5 6.5 4.9 4.9 4.9 2.3 3.3 3.3 0.5 0.5 0.5 31.7 38.8 38.8
PAS0106 115.6 394 505 9.4 11.9 11.9 2.6 3.2 3.2 2.2 2.2 2.2 2.1 2.8 2.8 0.3 0.3 0.3 16.5 20.5 20.4
PAS0107 14.4 870 1,115 19.7 24.9 24.9 5.4 6.8 6.8 3.4 3.4 3.4 2.3 3.2 3.2 0.2 0.2 0.2 31.1 38.5 38.5
PAS0108 117.9 187 240 5.4 6.8 6.8 1.5 1.8 1.8 0.6 0.6 0.6 0.8 1.1 1.1 0.1 0.1 0.1 8.3 10.4 10.4
Total 10,434.4 556 729 13.6 17.3 16.7 3.7 4.7 4.7 6.9 6.9 6.9 2.4 3.3 3.3 0.3 0.3 0.3 26.9 32.5 31.8
WaterBalance
Catchment
Area
(km2)
Population Density
(person/km2)
WaterBalance
Catchment
Area
(km2)
Population(person)
Source: JICA Study Team

FT-8
Annex-T F.6.2.1(1/6) Project Profile for Water-related Environment Management
Project Code WQ-G-01Project Title Ecological Solid Waste Management Program (ESWMP)Status of Project On-goingObjective Area All LGUs in the basinImplementing Agency Local Government UnitsObjectives To prevent potential contamination of ground, surface and coastal waters due
to improperly disposed domestic solid wastes as a regular program
Project Cost (Million Pesos) Estimated by Project Proponent Estimated by Study Team for 2011-2025
(N/A) 192 as of 2009 EIRR (N/A) Expected Source of Fund LGU equity (from 20% Development Fund)*Expected Implementation Schedule Continuing*Project Description The present activities under the LGUs’ 10-year Ecological Solid Waste Management Plans will be sustained until 2025 at the very least or improved at best. These activities consist primarily of soft measures, such as segregation at source; waste reduction, recycling and reuse; upgrading of open dumpsites into controlled dumpsites; composting; operation and maintenance of materials recovery facilities (MRFs). Besides the LGUs in the province of Tarlac, only seven other LGUs of Pampanga and Bulacan are disposing of their residual wastes in the Sanitary Landfill (SLF) in Capas, Tarlac. The two (2) smaller SLFs in SJDM City and Norzagaray are inadequately designed and are therefore operating more as controlled dumpsites until upgraded. Remarks: - *: Estimated and/or proposed by project proponent - The 100-ha sanitary landfill in Sitio Kalangitan in Capas, Tarlac has been operating since 2004 but remains
under-utilized. The LGUs plan to establish a common waste transfer station for a cluster of LGUs in order to overcome financial constraints and thereby optimize access to this facility.
- The project cost is estimated based on budget of Pampanga Province as of 2008.
Source of Information - DENR-EMB III; LGUs, 2008-2009.
Project Code WQ-G-02Project Title Industrial Pollution Control Program (IPCP)Status of Project On-goingObjective Area All industries in the basin that are covered by the Phil. EIS system Implementing Agency DENR-EMB IIIObjectives To control industrial pollution through compliance with regulatory requirements
of the Clean Water Act and the Phil. EIS system and by promoting industrial self-regulation as a regular program
Project Cost (Million Pesos) Estimated by Project Proponent Estimated by Study Team for 2011-2025
(N/A) 153 as of 2009 EIRR (N/A) Expected Source of Fund GAA* Expected Implementation Schedule Continuing*Project Description Through the program, the DENR-EMB regulates industrial pollution by way of issuing and monitoring adherence to Environmental Compliance Certificates (ECC), Discharge Permits and Self Monitoring Reports (SMRs) as well as pollution adjudication for non-compliant industries.
The agency promotes environmental self-regulation by industries under its twin programs, namely the Revised Industrial Eco-watch System (RIES) and the Philippine Environmental Partnership Program (PEPP). The former rates industries in color codes-- i.e., Gold, Silver, Green or Blue to indicate compliance and Red or Black to indicate non-compliance with the Clean Water Act. The latter provides incentives and rewards for adopting pollution prevention and cleaner production processes.
Remarks - *: Estimated and/or proposed by project proponent - The project cost is estimated based on the budget for EMB Region III in 2009. Source of Information - DENR-EMB III, 2009.

FT-9
Annex-T F.6.2.1(2/6) Project Profile for Water-related Environment Management
Project Code WQ-G-03Project Title Sagip-Ilog ProjectStatus of Project On-goingObjective Area San Fernando River, Angat River, Candaba SwampImplementing Agency Local Government UnitsObjectives To clean up waterways of solid wastes, pollutive substances, sediments and
illegal structures as a regular program
Project Cost (Million Pesos) Estimated by Project Proponent Estimated by Study Team for 2011-2025
(N/A) 11 as of 2009 EIRR (N/A) Expected Source of Fund IRA of LGUs*Expected Implementation Schedule Continuing*Project Description The “Sagip-Ilog” Program is a river clean-up drive undertaken by the LGUs in coordination with the DENR. On a smaller scale, the “Linis Estero” Program involves clean-up of creeks and small waterways.
The Sagip San Fernando River is one of the flagship environmental projects of the City government of San Fernando. Presently the project involves only clean up activities. Future plans include dredging/desilting, slope protection works, bank re-vegetation and river park development.
The Sagip-Ilog Angat initiative of the municipality of San Rafael, Bulacan involves inventory of industrial polluters and clean up activities in partnership with industries and the private sector. The LGU of Candaba for its part initiated de-silting, clean up activities and advocacy campaigns against waste dumping in Candaba Swamp.
Remarks - *: Estimated and/or proposed by project proponent - The project cost is estimated based on budget of Pampanga Province in 2008 Source of Information - LGUs, 2008-2009.

FT-10
Annex-T F.6.2.1(3/6) Project Profile for Water-related Environment Management
Project Code WQ-P-01Project Title Clean Development Mechanism (CDM) ProjectsStatus of Project ProposedObjective Area Cluster of six (6) commercial hog farms owned by Star Superior Farms in
Bulacan; Metro Clark Waste Management Corp.’s Sanitary Landfill facility in Sitio Kalangitan, Capas, Tarlac, (3) Bulacan Engineered Sanitary Landfill in Bgy. Sto. Crrito, San Jose Del Monte City, Bulacan.
Implementing Agency Private IndustriesObjectives To capture/recovery of carbon and other greenhouse gas emissions in order to
generate electricity from wastewater/organic wastes collected from hog farms and from domestic, commercial and industrial sources, respectively. The companies will eventually earn by feeding the electricity generated to the Luzon-Visayas power grid and at the same time trading their carbon credits. The proceeds can be used to refinance their operations. The companies will earn additional revenues by feeding the electricity generated to the Luzon-Visayas power grid and at the same time trading their carbon emission credits. The proceeds can be used to refinance their operations.
Project Cost (Million Pesos) Estimated by Project Proponent Estimated by Study Team for 2011-2025
1,036 as of 2009 1,036 as of 2009 EIRR For Metro Clark SLF, 4.93%*Expected Source of Fund Private sector: For livestock farms, through BOT scheme. For SLFs, the project
implementers will avail of loans through the financing windows of the World Bank/Land Bank of the Philippines Carbon Finance Support Facility *
Expected Implementation Schedule 2011-2020*Project Description
The two projects identified above consist of wastewater and waste collection, treatment and gas-capture facilities capable of sequestering methane (along with other greenhouse gases) to produce electricity in commercial quantities. The three projects have passed DENR’s host country approval and are presently being registered with the CDM Executive Board in Bonn, Germany as waste-to-energy (methane sequestration and CO2 recovery) projects. The Clark SLF facility can generate as much as 6.5 MW of electricity, while the Bulacan SLF can generate as much as 5.0 MW of electricity.
Remarks - *: Estimated and/or proposed by project proponent - The CDM was established under the Kyoto Protocol to the United Nations Framework Convention on Climate
Change. It is designed to assist developed countries to comply with their quantified greenhouse gas (GHG) emission limitation targets and at the same time help meet developing countries’ sustainable development objectives through carbon trading.
- The estimated cost does not include the cost for power generation. - The estimated annual O&M cost is 63Mil.Peoss/year.
Source of Information - DENR-EMB. Philippine Bio-Sciences Co., Inc., MCWMC. 2009.

FT-11
Annex-T F.6.2.1(4/6) Project Profile for Water-related Environment Management
Project Code WQ-C-01Project Title Capacity Development to Upgrade WQ Monitoring and Data Management
Program Status of Project ConceptualObjective Area Nine priority water bodies in PRB: Pampanga R., San Fernando/Abacan R.,
Angat R./Labangan FW, Quitangil R., Sapang Balen Cr., Pasac R., Candaba Swamp, Mouth of Manila Bay
Implementing Agency DENR-EMB IIIObjectives To build capacity for upgrading of the WQ and effluent monitoring, regulation
and data management
Project Cost (Million Pesos) Estimated by Project Proponent Estimated by Study Team for 2011-2025
(N/A) 140 as of 2009 EIRR (N/A) Expected Source of Fund (N/A) Expected Implementation Schedule (N/A) Project Description This DENR-EMB III will improve the collection and management of data on water quality by way of: - Rationalizing the system of water quality/effluent monitoring and compliance - Thorough inventory and estimation of all pollution sources - Upgrading its staff and laboratory capability - Capacity building for WQMA Governing Board, private industries and other stakeholders - Strengthening regulatory and coordination mechanisms among the DENR-EMB, the LGUs, relevant
agencies and clientele - Environmental awareness as part of school curriculum; public IEC utilizing multi-media Remarks - The project cost is estimated based on DENR-EBM III regional budget for environmental management, pollution
control, research & laboratory as of 2009. Required Action to Upgrade to a Proposed Project for Implementation- Basic project components should be determined.Source of Information - DENR-EMB III, 2009. Project Code WQ-C-02Project Title Capacity Development to Improve Water Quality and Aquaculture Fisheries
ManagementStatus of Project ConceptualObjective Area Fishpond areas in Bulacan and PampangaImplementing Agency Bureau of Fisheries and Aquatic ResourcesObjectives To protect the waters in and surrounding the fishpond areas from eutrophication
Project Cost (Million Pesos) Estimated by Project Proponent Estimated by Study Team for 2011-2025
(N/A) 48 as of 2009 EIRR (N/A) Expected Source of Fund (N/A) Expected Implementation Schedule (N/A) Project Description The project will complement the fisheries projects of the DA-BFAR Region III and the F.I.S.H. program of the provinces of Pampanga and Bulacan. The program will include assessment and carrying capacity studies, R&D, advocacy, legislative support, capability building and information management program, which aims to:
- enhance awareness and capability to adopt cleaner aquaculture production technologies - improve regulatory mechanisms through the issuance of supporting local ordinances pursuant to the
Fisheries Code - develop and pilot new or emerging low water use-low water quality impact technologies and best
management practices, such as the use of “pro-biotics” for sustainable fisheries production and disease control, including possible remediation measures for eutrophication, algal bloom and related fish kills and disease infestation
- develop appropriate indicators and institute water and fisheries resources monitoring and evaluation systems
Remarks Required Action to Upgrade to a Proposed Project for Implementation- Basic project components should be determined.Source of Information - DA-BFAR III.
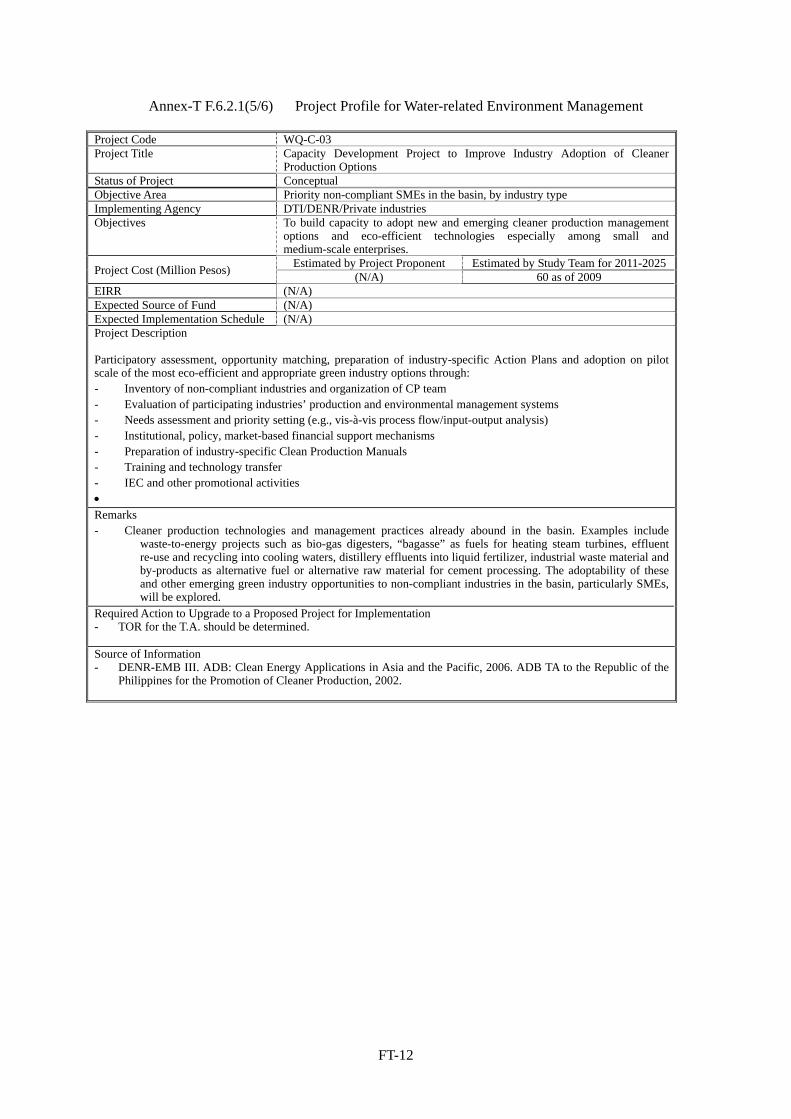
FT-12
Annex-T F.6.2.1(5/6) Project Profile for Water-related Environment Management
Project Code WQ-C-03Project Title Capacity Development Project to Improve Industry Adoption of Cleaner
Production OptionsStatus of Project ConceptualObjective Area Priority non-compliant SMEs in the basin, by industry type Implementing Agency DTI/DENR/Private industriesObjectives To build capacity to adopt new and emerging cleaner production management
options and eco-efficient technologies especially among small and medium-scale enterprises.
Project Cost (Million Pesos) Estimated by Project Proponent Estimated by Study Team for 2011-2025
(N/A) 60 as of 2009 EIRR (N/A) Expected Source of Fund (N/A) Expected Implementation Schedule (N/A) Project Description Participatory assessment, opportunity matching, preparation of industry-specific Action Plans and adoption on pilot scale of the most eco-efficient and appropriate green industry options through: - Inventory of non-compliant industries and organization of CP team - Evaluation of participating industries’ production and environmental management systems - Needs assessment and priority setting (e.g., vis-à-vis process flow/input-output analysis) - Institutional, policy, market-based financial support mechanisms - Preparation of industry-specific Clean Production Manuals - Training and technology transfer - IEC and other promotional activities Remarks - Cleaner production technologies and management practices already abound in the basin. Examples include
waste-to-energy projects such as bio-gas digesters, “bagasse” as fuels for heating steam turbines, effluent re-use and recycling into cooling waters, distillery effluents into liquid fertilizer, industrial waste material and by-products as alternative fuel or alternative raw material for cement processing. The adoptability of these and other emerging green industry opportunities to non-compliant industries in the basin, particularly SMEs, will be explored.
Required Action to Upgrade to a Proposed Project for Implementation- TOR for the T.A. should be determined.
Source of Information - DENR-EMB III. ADB: Clean Energy Applications in Asia and the Pacific, 2006. ADB TA to the Republic of the
Philippines for the Promotion of Cleaner Production, 2002.

FT-13
Annex-T F.6.2.1(6/6) Project Profile for Water-related Environment Management
Project Code WQ-C-04Project Title Construction of Sanitary Landfills and Support Facilities in Nueva Ecija and
Cluster Waste Transfer Stations in Bulacan and Pampanga Status of Project ConceptualObjective Area (1) Nueva Ecija: Gen. Tinio, Palayan City, San Jose City, Munoz City, Sta.
Rosa; (2) Bulacan: Baliuag, Calumpit, Hagonoy, Mololos City; (3 Pampanga: ) Angeles City, Guagua, Mabalacat, San Fernando City
Implementing Agency Local Government UnitsObjectives To prevent potential contamination of ground, surface and coastal waters due to
improperly disposed domestic solid wastes. The cluster transfer station is deemed as a less costly alternative to construction of SLF in each LGU.
Project Cost (Million Pesos) Estimated by Project Proponent Estimated by Study Team for 2011-2025
(N/A) 2,025 as of 2009 EIRR (N/A) Expected Source of Fund (N/A) Expected Implementation Schedule (N/A) Project Description Construction of five (5) suitably engineered Sanitary Landfills in N. Ecija and four (4) Transfer Station-cum-Materials Recovery Facilities (MRFs) for a cluster of LGUs in Bulacan and Pampanga. The Transfer Stations will have adequate support facilities for sorting, compaction composting, segregation of recyclables and handling of residuals prior to final disposal. Two complete engineered facilities are now presently operating in the basin and could serve as final disposal areas of residual wastes from the proposed Transfer Stations. One is the 100-ha Sanitary Landfill in Sitio Kalangitan, Capas, Tarlac, which started operating in 2006. The other is the newly constructed (2009) 52-ha Bulacan Engineered Sanitary Landfill in San Jose Del Monte City. The proposed facilities and coverage population are as follows. 1) Construction of five (5) suitably engineered Sanitary Landfills in N. Ecija
-Provincial sanitary landfill at Gen.Tinio -Sanitary landfill: Munoz City, San Jose City, Palayan City and St.Rosa -MRFs etc.: 12 municipalities -Coverage population: 485,802
2) Construction of four (4) Cluster Transfer Station-cum-Materials Recovery Facilities (MRFs) for a cluster of LGUs in Bulacan and Pampanga -Construction of one (1) cluster transfer stations each for: (a) Baliuag and Calumpit, (b) Hagonoy and Malolos City, (c) Angeles City and Guagua, (d) Mabalacat and San Fernando City -Coverage population: 2,020,740
Remarks: - Improved and more efficient segregation, reduction, reuse and recycling at source is prerequisite
for these facilities to function and provide benefits at optimum level. Capability of LGUs to implement these at the local level needs to be enhanced. Construction of additional satellite MRFs in the barangay and municipal levels may become necessary over time.
- The LGUs are now assisted by the DENR-EMB in implementing their Ecological Solid Waste Management Plans in compliance with RA 9003. At present, the LGUs are in various stages of implementing these plans but resources are extremely inadequate to enable the complete closure of open dumps and construction of Sanitary Landfills.
- The project cost for SLF in N. Ecija is based on the Province’s MTD as of 2009. The annual O&M cost for the SLF in N. Ecija is assumed to be 10.9% of the initial investment cost, referring to similar project, which resulted in estimated per capita cost of 45pesos/person/year.
- The annual O&M cost for the cluster waste transfer stations and final disposal is estimated at 161pesos/person/year.
Required Action to Upgrade to a Proposed Project for Implementation- F/S level study would be required. Source of Information - DENR-EMB III; LGUs, 2009. JICA Master Plan on Solid Waste Management for Boracay Island and Malay
Municipality, 2008.


Annex-Figures


FF-1
Annex-F F.2.1.1 River Basin Catchments in the Study Area
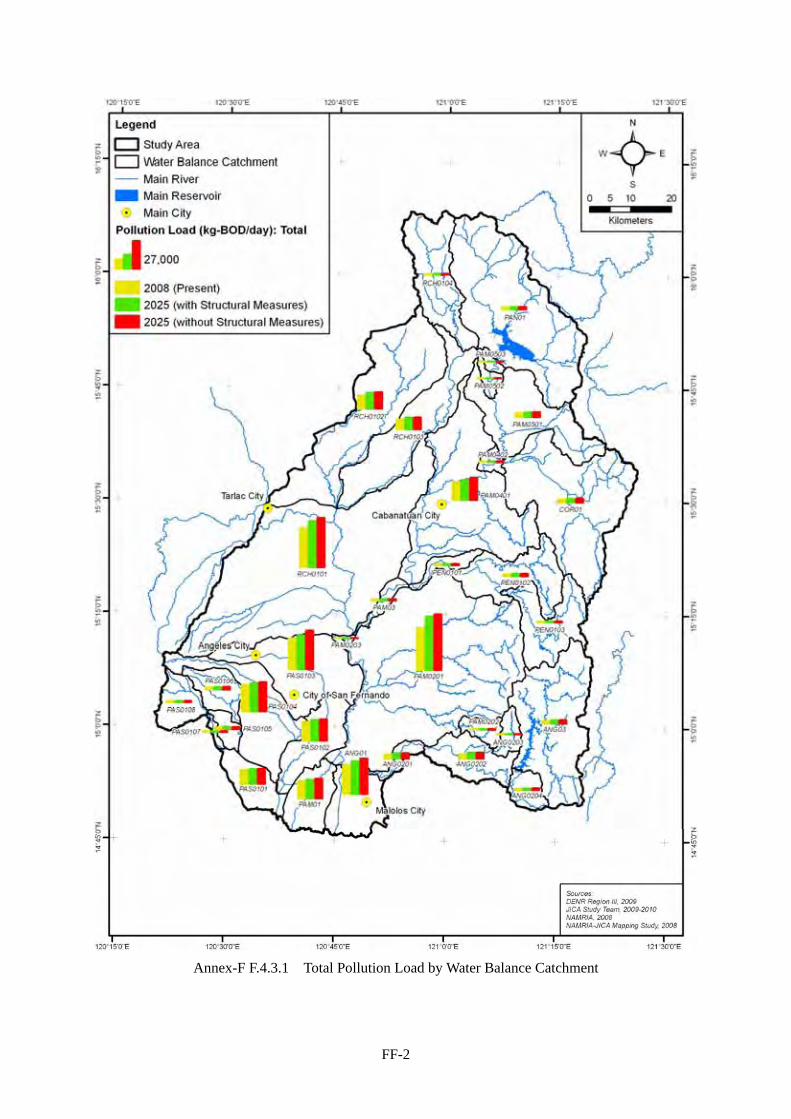
FF-2
Annex-F F.4.3.1 Total Pollution Load by Water Balance Catchment

FF-3
Annex-F F.4.3.2 Total Pollution Load Density by Water Balance Catchment

FF-4
Annex-F F.4.5.1 Reduction of Domestic Pollution Load by Sub-Basin

FF-5
Annex-F F.4.5.2 Reduction of Domestic Pollution Load by Water Balance Catchment

FF-6
Annex-F F.6.2.1(1/4) Locations of Projects for Water-related Environment Management

FF-7
Annex-F F.6.2.1(2/4) Locations of Projects for Water-related Environment Management

FF-8
Annex-F F.6.2.1(3/4) Locations of Projects for Water-related Environment Management

FF-9
Annex-F F.6.2.1(4/4) Locations of Projects for Water-related Environment Management
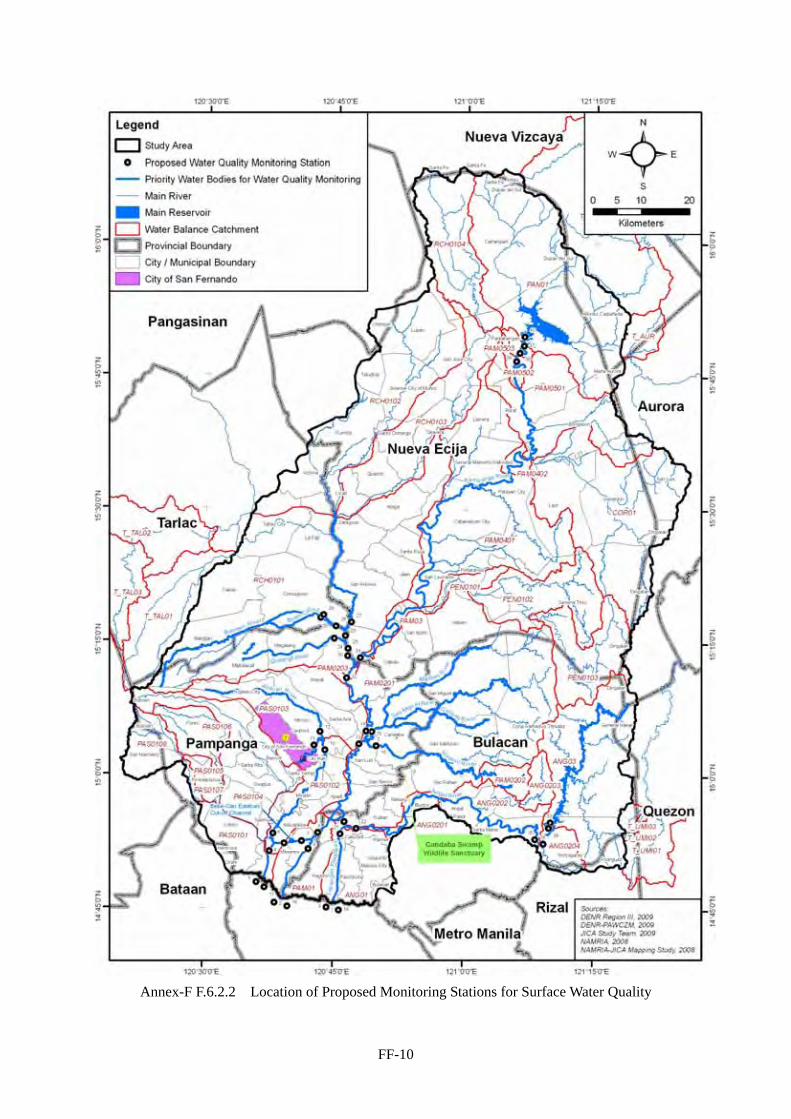
FF-10
Annex-F F.6.2.2 Location of Proposed Monitoring Stations for Surface Water Quality

Sector G
Watershed Management


i
Sector G. Watershed Management
Table of Contents
Pages
G.1 Introduction ............................................................................................................................ G-1
G.1.1 Study Area ............................................................................................................. G-1 G.1.2 Scope of the Watershed Management Study ......................................................... G-1 G.1.3 Legal and Institutional Framework of Watershed Management ........................... G-2
G.1.3.1 Policy and Legal Framework ..................................................................... G-2 G.1.3.2 Institutional Framework ............................................................................ G-3
G.2 Prevailing Watershed Conditions .......................................................................................... G-5
G.2.1 Natural Environment ............................................................................................. G-5 G.2.1.1 Land Classification .................................................................................... G-5 G.2.1.2 Land Use and Land Cover ......................................................................... G-5 G.2.1.3 Forest Cover .............................................................................................. G-6 G.2.1.4 Forest Land Allocation .............................................................................. G-7 G.2.1.5 Ecologically Sensitive Areas ..................................................................... G-8
G.2.2 Socio-economic Conditions .................................................................................. G-9 G.2.2.1 Population in the Study Area ..................................................................... G-9 G.2.2.2 Indigenous Peoples .................................................................................. G-10
G.3 Issues and Concerns ............................................................................................................. G-13
G.3.1 Watershed Degradation ....................................................................................... G-13 G.3.1.1 Poverty and Lack of Livelihood Opportunities ....................................... G-13 G.3.1.2 Illegal Logging ........................................................................................ G-13 G.3.1.3 Encroachment into Forestlands ............................................................... G-13 G.3.1.4 Illegal Land Use and Conversion ............................................................ G-14 G.3.1.5 Forest Fires .............................................................................................. G-14 G.3.1.6 Absence of Harmonized Protected Area Plans ........................................ G-14 G.3.1.7 Inadequate Information and Decision Support System ........................... G-14
G.3.2 Weak Reforestation ............................................................................................. G-14 G.3.2.1 Inadequate Tenure Security ..................................................................... G-14 G.3.2.2 Poor Performance of Reforestation Projects ........................................... G-15 G.3.2.3 Inadequate Institutional Capability .......................................................... G-15 G.3.2.4 Lack of Incentive for Private Participation and Investment in Forestry
Development ............................................................................................ G-15 G.3.3 Poor Institutional Coordination Mechanisms ..................................................... G-15
G.3.3.1 Conflicting/Overlapping Mandates ......................................................... G-15 G.3.3.2 Inadequate Devolution ............................................................................. G-15 G.3.3.3 Political Interference ............................................................................... G-15
G.4 Plan for Watershed Management........................................................................................ G-16
G.4.1 Goals of Watershed Management in the Basin ................................................... G-16 G.4.1.1 Related National and Regional Policies, Strategies and Thrusts ............. G-16 G.4.1.2 Goals under the IWRM Plan ................................................................... G-16
G.4.2 Projects as Countermeasures to Address Problems and Issues on Watershed Management ........................................................................................................ G-16

ii
G.4.2.1 Project List ............................................................................................... G-16 G.4.2.2 Projects to Address Watershed Degradation through Livelihood and
Protected Area Management .................................................................... G-18 G.4.2.3 Projects to Address Weak Reforestation .................................................. G-23 G.4.2.4 Projects to Address Poor Institutional Coordination ............................... G-25
List of Tables
List of Tables in Report
Table G. 1.1.1 Study Area ....................................................................................................... G-1 Table G. 1.3.1 List of Priority Watersheds for Support for NIS .............................................. G-3 Table G. 2.1.1 Land Classification in Pampanga River Basin ................................................ G-5 Table G. 2.1.2 Land Use and Land Cover Category in the Study Area ................................... G-6 Table G. 2.1.3 Change in Forest Cover of Region III, 1988-2003. ......................................... G-6 Table G. 2.1.4 Forest Cover versus Forest Land Classification in Pampanga River
Basin, 2003 ...................................................................................................... G-6 Table G. 2.1.5 Forest Land Use Instruments in PRB, 2008. ................................................... G-7 Table G. 2.1.6 Initial Components of the NIPAS. ................................................................... G-8 Table G. 2.1.7 Existing Mangrove in the Study Area .............................................................. G-9 Table G. 2.1.8 Species Included in the IUCN Red List for Conservation in and around
the Study Area ................................................................................................. G-9 Table G. 2.2.1 Population within the Study Area .................................................................. G-10 Table G. 2.2.2 Projected Population within the Study Area .................................................. G-10 Table G. 2.2.3 Population of Indigenous Peoples distributed in and around the Study
Area as of 2006 .............................................................................................. G-11 Table G. 2.2.4 Status of AD/AL (Ancestral Land) Delineation and Titling in and
around the Study Area as of March 9, 2010 .................................................. G-12 Table G. 3.1.1 Illegal Logging Hotspots in Pampanga River Basin ..................................... G-13 Table G. 4.2.1 On-going, Proposed and Conceptual Programs and Projects related to ........ G-17 Table G. 4.2.2 Group Category, Status and Implementing Agencies of the Programs
and Projects for Watershed Management ...................................................... G-18
List of Annex Tables
Annex-T G.2.1.1 Land Use / Land Cover Categories by Sub-Basin ..................................... GT-1 Annex-T G.3.1.2 Project Profile for Watershed Management ............................................... GT-2
List of Annex Figures
Annex-F G.2.1.1 Forest Cover in the Study Area .................................................................. GF-1 Annex-F G.2.1.2 Land Classification and Forest Cover in the Study Area ........................... GF-2 Annex-F G.4.2.1 Location of the projects for Watershed Management ................................ GF-3 Annex-F G.4.2.2 Map of Severe Erosion Areas in the Basin ................................................ GF-7

Sector G: Watershed Management
G-1
Sector G. Watershed Management
G.1 Introduction
G.1.1 Study Area
The whole study area includes the entire catchment of Pampanga river basin, which spans an area of 1,043,438ha. It covers 11 provinces and 90 cities and municipalities. Four major provinces, namely Nueva Ecija, Tarlac, Pampanga and Bulacan, comprise about 95% of the entire study area. The remaining area or roughly 5% includes minor portions of the provinces of Aurora, Zambales, Rizal, Quezon, Pangasinan, Bataan and Nueva Viscaya. Table G.1.1.1 shows the extent of the study area.
Table G. 1.1.1 Study Area
Province Area Coverage
Number of Cities/Municipalities (ha) Ratio to the study area
Nueva Ecija 501,335.0 48.0% 30
Pampanga 202,219.5 19.4% 22
Bulacan 202,056.7 19.4% 18
Tarlac 83,397.5 8.0% 6
Sub-total 95% 76 Aurora 19,473.0 1.9% 3
Zambales 7,381.1 0.7% 2
Rizal 4,220.3 0.4% 1
Quezon 3,023.4 0.3% 1
Pangasinan 2,606.9 0.2% 1
Bataan 1,401.7 0.1% 2
Nueva Viscaya 16,323.3 1.6% 4
Sub-total 5% 14 Total 1,043,438.5 100.0% 90 Source: JICA Study Team
G.1.2 Scope of the Watershed Management Study
This Report supports the Study on Integrated Water Resources Management (IWRM) for Poverty Alleviation and Economic Development in Pampanga River Basin. The watershed management sector study focuses primarily on the four major provinces listed above, namely Nueva Ecija, Tarlac, Pampanga and Bulacan. The scope of this study and the contents of this sector report include:
the legal and institutional framework governing watershed management in the Philippines and in the basin
the conditions of the natural and social environment of the watersheds within the study area
the issues and concerns that beset the watersheds, which in turn impinge on the sustainability of the water resources for various uses in the basin; and
the programs and projects that will best address the problems identified, including costs and institutional arrangements for implementing them over the short-, medium- and long term, consistent with the IWRM Plan timelines

Sector G: Watershed Management
G-2
G.1.3 Legal and Institutional Framework of Watershed Management
G.1.3.1 Policy and Legal Framework
Forestry development in the Philippines evolved a concerted response to massive deforestation experienced since the early ‘60s. Prior to 1995, the DENR began issuing tenurial instrumentsi in pursuit of sustainable forest management.
The basic policies and strategies for watershed management in the Philippines are laid down in the following national issuances:
Presidential Decree 705 of 1975 - otherwise known as the Revised Philippine Forestry Code.
Executive Order 318 of 2004 - lays down the basic strategies of sustainable forestry management anchored on a watershed-based integrated ecosystems management approach. This approach recognizes the interrelationships and interactions between and among the various ecosystems from the uplands and down to the coastal areas.
Executive Order 263 of 1995 – adopted community-based forest management (CBFM) as the national strategy to ensure the sustainable development of the country’s forest resources
DENR Administrative Order No. 96-29 – the implementing rules and regulations for CBFM; it provided the guidelines for the issuance of Community Based Forest Management Agreement (CBFMA) as a production sharing agreement between the DENR and the participating people’s organization (POs), which gives tenurial security and incentive to forest occupants to develop, utilize and manage specific portions of forest lands for a period of 25 years renewable for another 25 years.
DENR Administrative Order No. 96-29 – integrates all people-oriented forestry programs into the CBFM
DENR Administrative Order No. 99-01 – adopts the watershed and ecosystems planning framework for the sustainable management of the country’s natural resources
DENR Administrative Order No. 2005-23 – provides the mechanism for the collaborative approach to watershed management
Other legislations and circulars lend support to sustainable watershed management objectives. These include the following:
Republic Act 7586 of 1992 - sets aside unique and ecologically important areas of land and water as components of the National Integrated Protected Areas System (NIPAS) in order to protect and conserve biological diversity.
Republic Act 9147 or the Wildlife Resources Conservation Act – prohibits the destruction of important habitats and the exploitation and trade of wildlife resources that are considered to be endangered
Republic Act 8371 of 1997 or the Indigenous People’s Rights Act (IPRA) - grants ownership rights (Certificates of Ancestral Domain Titles or CADTs) over lands considered traditionally and recognized since time immemorial as ancestral domains of indigenous communities.
Joint DENR-DILG Memorandum Circular No. 98-01 and No. 2003-01 institutionalizes and strengthens the DENR-DILG-LGU partnership over devolved forest management functions.
Memorandum of Agreement of June 17, 2002 - institutionalizes the co-management endeavour between the DENR and the NIA over watersheds supporting national irrigation systems (NIS).
i These tenurial instruments include Forestland Management Agreement (FLMA), Industrial Forest Management Agreement (IFMA), Industrial Tree Plantation Lease Agreement (ITPLA) Community Forest Stewardship Agreement (CFSA), Integrated Social Forestry (ISF), and Community Forest Management Agreement (CFMA) and Forest Land Grazing Management Agreement (FLGMA).

Sector G: Watershed Management
G-3
G.1.3.2 Institutional Framework
(1) Principal Mandate
Executive Order No. 192 of 2007 gives the DENR the primary responsibility for the conservation, management, development and proper use of the environment and natural resources, including forests and watershed areas. The line and attached agencies of the DENR are specifically tasked as follows:
River Basin Control Office (RBCO) - created by virtue of EO 510 of 2006 as a national coordinating body to monitor and rationalize government agency projects and programs in the context of integrated river basin management
Forest Management Bureau (FMB) - formulates and recommends policies and/or programs for the effective protection, development, occupancy, management and conservation of forest lands and watershed
In Pampanga River basin, the DENR Regional Office is headed by the Forest Management Service (FMS). It implements the different watershed programs and projects through its field offices, according to the following specific functions:
Forest Resources Development Division – monitoring of private forest development
Forest Resources Conservation Division – forest protection and law enforcement
Community Based Forest Management Office (CBFMO) – implementation of the CBFM program
Protected Area, Wildlife and Coastal Management Division (PAWCZMD) – protection and conservation of bio-diversity and important habitats
Provincial ENR Offices (PENROs) and Community ENR offices (CENROs) – implementation of watershed projects within their respective provincial and local jurisdictions.
(2) Co-Management
In 1990, NIA and DENR agreed to co-manage the nation-wide priority watersheds in order to facilitate the proper maintenance of the national irrigation system (NIS). In the study area, seven priority watersheds including the above Pantabangan-Carrangan Watershed were delineated as shown in Table G.1.3.1. Of these priority watersheds, however, only the Pantabangan-Carrangan has ever been the focus of the watershed management efforts.
Table G. 1.3.1 List of Priority Watersheds for Support for NIS
Name of Watershed / Sub-Watershed Area Covered
(ha) Location
Angat-Maasim River WS 61,800 Angat, Norzagaray, San Ildefonso and San Rafael (Bulacan)
Bucao River Watershed 55,320 Botolan, Cabangan, San Felipe,Iba and San Marcelino, (Zambales)
Caulaman River Watershed 8,662 San Marcelino, Castillejos, Subic (Zambales) Floridablanca (Pampanga)
Upper Pampanga River Watershed 113,165 - UPRIS II 84,500 Pantabangan and Carranglan (N. Ecija) - UPRIS III 28,665 Palayan City and Bongabon (N. Ecija)
Angat-Ipo Watershed 6,600 Norzagaray and Sn. Jose del Monte (Bulacan)O'Donnell RIS 29,459 Capas, Bamban, Tarlac City (Tarlac) Porac-Gumain River WS 31,367 Porac and Floridablanca (Pampanga) Source: DENR-FMB, 2008.
The Pantabangan-Carranglan watershed of 84,400ha in the upper reaches of the existing Pantabangan storage dam was declared as the forest reserve area by virtue of Proclamation No. 561 on May 1969. The watershed was initially under jurisdiction of NIA-UPRIIS. In 1997,
Sector G: Watershed Management
G-4
NIA and NPC had agreed, based on a Memorandum of Agreement (MOA) to jointly manage the Pantabangan-Carrangan Watershed. The NIA-UPRIIS is now responsible over 10,356 ha, while NPC is responsible over 14,166ha.
In 2009, the Energy Development Corporation (EDC) joined hands with NIA-UPRIIS to rehabilitate and reforest 100 ha of the Pantabangan-Masiway watersheds. EDC is now partly owned by First Gen Corporation, which operates the Masiway dam for hydroelectric power generation. EDC will provide funds and technical assistance in the propagation and use of appropriate indigenous species for reforestation and rehabilitation.
The NPC manages the upper reaches of Pantabangan and Angat storage dams. It uses the charges (called the “Universal Consumer’s Environmental Charge”) collected from the power consumers in order to sustain its watershed management operations, which is primarily concerned with forest protection and conservation, in close coordination with the Armed Forces of the Philippines.
(3) Multi-stakeholder Collaboration
Other key watershed players in the study area include the National Irrigation Administration (NIA) and the National Power Corporation (NPC). Both agencies coordinate their efforts with the DENR, the LGUs and other stakeholders in the management of the watersheds that support Pantabangan and Angat storage dams. They sit together with the DENR, the LGUs and other stakeholders as representives in the Protected Area Management Board (PAMB) and Forest Management Councils.
An Inter-Agency Task Force composed of NIA, NPC, DENR and LGUs was organized to initiate the preparation of a comprehensive Forest Land Use Plan (FLUP) for Pantabangan under EcoGov, an umbrella organization of local environmental NGOs.
(4) Partnerships over Devolved Watershed Functions
The management of small watersheds within their respective jurisdiction has been devolved to LGUs by virtue of RA 9160 or the Local Government Code of 1991. In the basin, the LGUs actively pursue environmental and watershed projects involving urban greening, river stabilization and protection works and river park development and reforestation of priority watersheds and eco-tourism, in partnership with the academe and water districts. In addition to these functions, LGUs are involved in various capacities as members of the PAMB in the management of the NIPAs areas and other multi-sectoral councils/committees/task forces for the management of important ecosystems and biodiversity conservation areas including and the mangrove forests of Manila Bay, Pantabangan-Carranglan Watershed, Angat Watershed, Mt. Arayat National Park, Candaba Swamp, among others.
(5) Private Sector Collaboration
The private sector including the water districts, academe, private enterprise and NGOs also collaborate with the DENR and are represented in multi-stakeholder bodies and task forces. Some private companies such as the Clark Development Corporation in cooperation with other members of the Subic-Clark Alliance for Development (SCAD) are active partners in “Adopt a Watershed” program in the Mt. Pinatubo watershed areas, while private cement companies like Holcim is involved in “Adopt-a-Mountain” program in the Angat watersheds.

Sector G: Watershed Management
G-5
G.2 Prevailing Watershed Conditions
G.2.1 Natural Environment
G.2.1.1 Land Classification
The country adopts two categories for general land use classification, namely: (a) Alienable and Disposable (A&D) lands and (b) Forest or Timber Lands. A&D lands include the agricultural production land; the highly restricted agricultural zones for valuable rice land; and non-agricultural lands in built-up/urban areas. A&D lands can be titled in the name of private entities. On the other hand, forestlands are upland areas that have slopes of more than 18%. Forestlands are untitled public domains and therefore remain in the hands of the State.
Forestlands or timberlands are further classified into protection forests and production forests, according to intended or potential uses, as described below:
Protection Forests - Protection forests include the timberlands within ancestral domain claims, the mining reserves, the nature reserves, the proclaimed watersheds, and the lands that have elevations above EL. 1,000 m or have more than 50% slope. Protection of the vegetation and the slope in the protection forests in particular is important for water and soil conservation purposes.
Production Forests - Production forests are timberlands and open access areas used to generate outputs from agriculture, timber or agro-forestry, grazing and pasture, mining, industry, tourism and other economic activities.
Table G.2.1.1 shows the distribution of lands based on the above classification. Of the total drainage area of Pampanga River Basin, the A&D lands comprise nearly 666,000 hectares or 63.8% while the forestlands comprise 377,482 hectares. Of the latter, about 359,555 hectares or 34.5% of the catchment area is classified forestlands.
Table G. 2.1.1 Land Classification in Pampanga River Basin
Province Land Classification Area (ha)
Alienable and Disposable
Classified Forestland
Unclassified Forestlands
Total
Aurora 584.5 1,227.7 17,660.8 19,473.0Bataan 1,401.7 0.0 0.0 1,401.7Bulacan 119,069.3 82,987.4 0.0 202,056.7Nueva Ecija 301,333.9 200,001.1 0.0 501,335.0Nueva Vizcaya 939.7 15,383.6 0.0 16,323.3Pampanga 173,544.5 28,675.0 0.0 202,219.5Pangasinan 2,606.9 0.0 0.0 2,606.9Quezon 0.0 2,757.6 265.8 3,023.4Rizal 0.0 4,220.3 0.0 4,220.3Tarlac 66,475.9 16,921.6 0.0 83,397.5Zambales 0.0 7,381.1 0.0 7,381.1Total 665,956.5 359,555.4 17,926.7 1,043,438.5% Distribution 63.8% 34.5% 1.7% 100%Source: DENR-FMS 3, NSCB. 2006.
G.2.1.2 Land Use and Land Cover
Figure G.2.1.1 shows the existing land use and land cover categories in the study area. The agricultural area widely extends in the central part of the study area. The mountain area is characterized by forest land and/or brush land. The built-up area is in general scattered. However, around the cities of San Fernando and Angeles areas is a continuous built-up area.
The distribution of the categories of land cover in the study area is summarized in Table G.2.1.2, while the distribution of land use and land cover categories for each sub-basin is shown in Annex-T G.2.1.1. More than 40% of the total study area is cultivated area. Most of the population is concentrated in the built-up area, which is about 3% of the total study area.
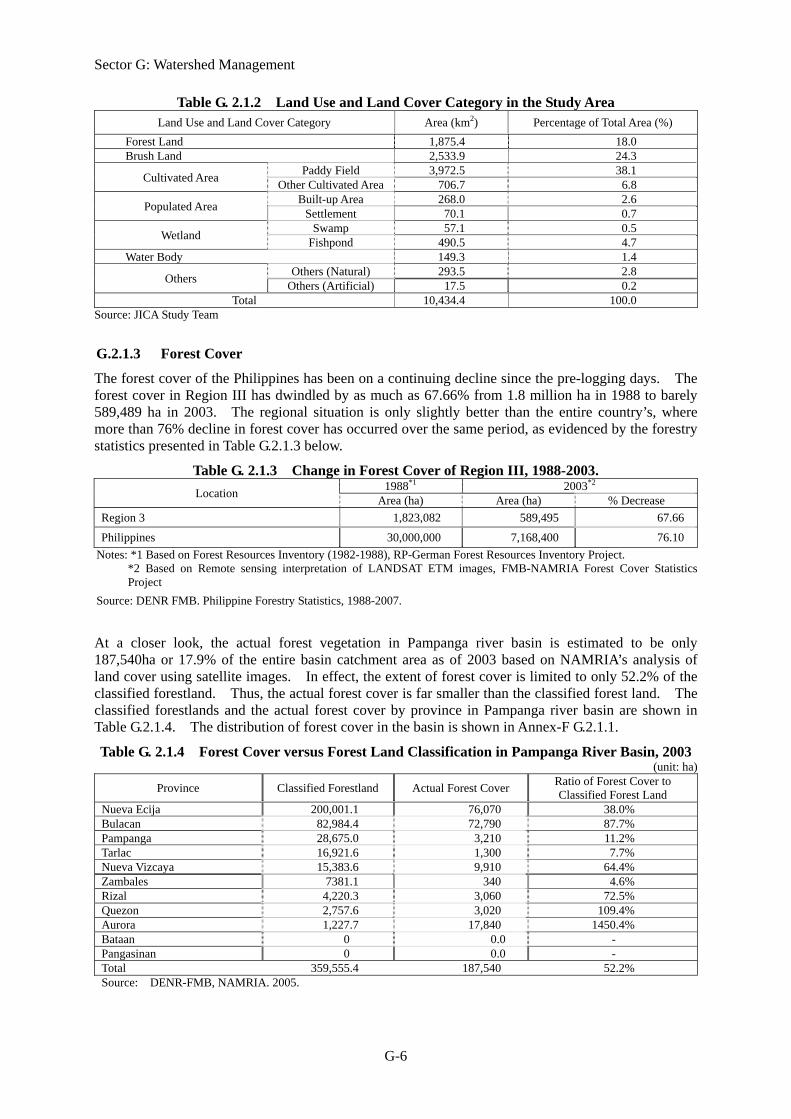
Sector G: Watershed Management
G-6
Table G. 2.1.2 Land Use and Land Cover Category in the Study Area Land Use and Land Cover Category Area (km2) Percentage of Total Area (%)
Forest Land 1,875.4 18.0 Brush Land 2,533.9 24.3
Cultivated Area Paddy Field 3,972.5 38.1
Other Cultivated Area 706.7 6.8
Populated Area Built-up Area 268.0 2.6
Settlement 70.1 0.7
Wetland Swamp 57.1 0.5
Fishpond 490.5 4.7 Water Body 149.3 1.4
Others Others (Natural) 293.5 2.8
Others (Artificial) 17.5 0.2 Total 10,434.4 100.0
Source: JICA Study Team
G.2.1.3 Forest Cover
The forest cover of the Philippines has been on a continuing decline since the pre-logging days. The forest cover in Region III has dwindled by as much as 67.66% from 1.8 million ha in 1988 to barely 589,489 ha in 2003. The regional situation is only slightly better than the entire country’s, where more than 76% decline in forest cover has occurred over the same period, as evidenced by the forestry statistics presented in Table G.2.1.3 below.
Table G. 2.1.3 Change in Forest Cover of Region III, 1988-2003.
Location 1988*1 2003*2
Area (ha) Area (ha) % Decrease
Region 3 1,823,082 589,495 67.66
Philippines 30,000,000 7,168,400 76.10
Notes: *1 Based on Forest Resources Inventory (1982-1988), RP-German Forest Resources Inventory Project. *2 Based on Remote sensing interpretation of LANDSAT ETM images, FMB-NAMRIA Forest Cover Statistics Project
Source: DENR FMB. Philippine Forestry Statistics, 1988-2007.
At a closer look, the actual forest vegetation in Pampanga river basin is estimated to be only 187,540ha or 17.9% of the entire basin catchment area as of 2003 based on NAMRIA’s analysis of land cover using satellite images. In effect, the extent of forest cover is limited to only 52.2% of the classified forestland. Thus, the actual forest cover is far smaller than the classified forest land. The classified forestlands and the actual forest cover by province in Pampanga river basin are shown in Table G.2.1.4. The distribution of forest cover in the basin is shown in Annex-F G.2.1.1.
Table G. 2.1.4 Forest Cover versus Forest Land Classification in Pampanga River Basin, 2003 (unit: ha)
Province Classified Forestland Actual Forest Cover Ratio of Forest Cover to Classified Forest Land
Nueva Ecija 200,001.1 76,070 38.0% Bulacan 82,984.4 72,790 87.7% Pampanga 28,675.0 3,210 11.2% Tarlac 16,921.6 1,300 7.7% Nueva Vizcaya 15,383.6 9,910 64.4% Zambales 7381.1 340 4.6% Rizal 4,220.3 3,060 72.5% Quezon 2,757.6 3,020 109.4% Aurora 1,227.7 17,840 1450.4% Bataan 0 0.0 - Pangasinan 0 0.0 - Total 359,555.4 187,540 52.2% Source: DENR-FMB, NAMRIA. 2005.
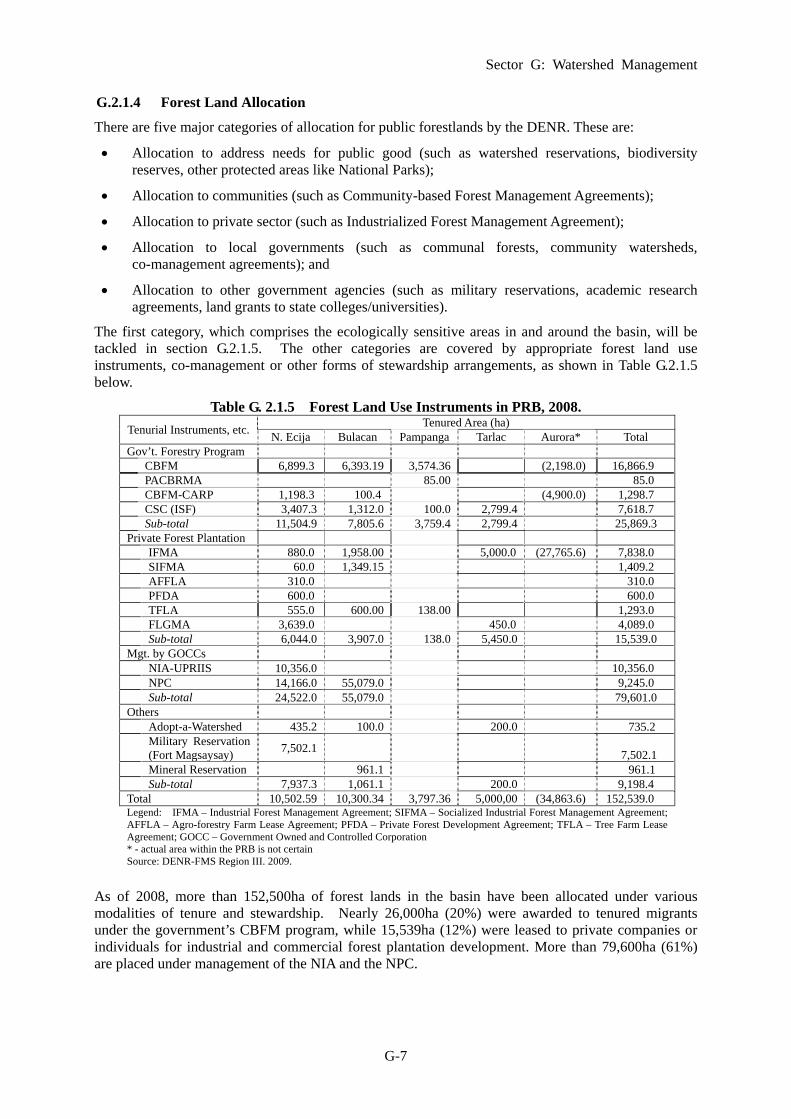
Sector G: Watershed Management
G-7
G.2.1.4 Forest Land Allocation
There are five major categories of allocation for public forestlands by the DENR. These are:
Allocation to address needs for public good (such as watershed reservations, biodiversity reserves, other protected areas like National Parks);
Allocation to communities (such as Community-based Forest Management Agreements);
Allocation to private sector (such as Industrialized Forest Management Agreement);
Allocation to local governments (such as communal forests, community watersheds, co-management agreements); and
Allocation to other government agencies (such as military reservations, academic research agreements, land grants to state colleges/universities).
The first category, which comprises the ecologically sensitive areas in and around the basin, will be tackled in section G.2.1.5. The other categories are covered by appropriate forest land use instruments, co-management or other forms of stewardship arrangements, as shown in Table G.2.1.5 below.
Table G. 2.1.5 Forest Land Use Instruments in PRB, 2008.
Tenurial Instruments, etc. Tenured Area (ha)
N. Ecija Bulacan Pampanga Tarlac Aurora* Total Gov’t. Forestry Program CBFM 6,899.3 6,393.19 3,574.36 (2,198.0) 16,866.9 PACBRMA 85.00 85.0 CBFM-CARP 1,198.3 100.4 (4,900.0) 1,298.7 CSC (ISF) 3,407.3 1,312.0 100.0 2,799.4 7,618.7 Sub-total 11,504.9 7,805.6 3,759.4 2,799.4 25,869.3 Private Forest Plantation IFMA 880.0 1,958.00 5,000.0 (27,765.6) 7,838.0 SIFMA 60.0 1,349.15 1,409.2 AFFLA 310.0 310.0 PFDA 600.0 600.0 TFLA 555.0 600.00 138.00 1,293.0 FLGMA 3,639.0 450.0 4,089.0 Sub-total 6,044.0 3,907.0 138.0 5,450.0 15,539.0 Mgt. by GOCCs NIA-UPRIIS 10,356.0 10,356.0 NPC 14,166.0 55,079.0 9,245.0 Sub-total 24,522.0 55,079.0 79,601.0 Others Adopt-a-Watershed 435.2 100.0 200.0 735.2
Military Reservation (Fort Magsaysay)
7,502.1 7,502.1
Mineral Reservation 961.1 961.1 Sub-total 7,937.3 1,061.1 200.0 9,198.4 Total 10,502.59 10,300.34 3,797.36 5,000,00 (34,863.6) 152,539.0 Legend: IFMA – Industrial Forest Management Agreement; SIFMA – Socialized Industrial Forest Management Agreement; AFFLA – Agro-forestry Farm Lease Agreement; PFDA – Private Forest Development Agreement; TFLA – Tree Farm Lease Agreement; GOCC – Government Owned and Controlled Corporation * - actual area within the PRB is not certain Source: DENR-FMS Region III. 2009.
As of 2008, more than 152,500ha of forest lands in the basin have been allocated under various modalities of tenure and stewardship. Nearly 26,000ha (20%) were awarded to tenured migrants under the government’s CBFM program, while 15,539ha (12%) were leased to private companies or individuals for industrial and commercial forest plantation development. More than 79,600ha (61%) are placed under management of the NIA and the NPC.

Sector G: Watershed Management
G-8
G.2.1.5 Ecologically Sensitive Areas
(1) Initial Components of the NIPAS
Republic Act No, 7586 or the National Integrated Protected Areas System (NIPAS) Act prescribes eight categories of protected areas, namely: (i) strict nature reserve, (ii) natural park, (iii) natural monument, (iv) wildlife sanctuary, (v) protected landscapes and seascapes, (vi) resource reserve, (vii) natural biotic areas and (viii) other categories established by law, conventions or international agreements which the Philippine Government is a signatory.
In accordance with this Act, the following three national parks and five watershed forest reserves in and around study area were included among the initial components of the national protected areas system (Table G.2.6). These sites, consisting of an aggregate area of more than 211,000ha, are subject to formal establishment or disestablishment as official NIPAS sites through congressional initiative, pursuant to the NIPAS Act.
Table G. 2.1.6 Initial Components of the NIPAS. Protected Area Location Area(ha)
National Park (NP)s Minalungao NP Gapan and Gen.Tino, Nueva Ecija 2,018.00Biak-na-Bato NP San Miguel and Doña Remedios, Trinidad, Bulacan 658.85Mt. Arayat NP Arayat and Magalang, Pampanga 3,715.23Watershed Forest Reserves Angat Watershed Forest Reserve District Montalban, San Jose, Rizal, Norzaragay, Bulacan
and Angat, san Rafael, Nueva Ecija 55,709.10
Angat Watershed and Forest Range Norzaragay, San Jose, Bulacan and Montalban, Nueva Vizcaya
6,600.00
Talavera Watershed Reservation Sta.Fe, Nueva Vizcaya, Carranglan, Luapo, San Jose Pantabangan, Nueva Ecija
37,156.00
Pantabangan-Carrangan Watershed Reservation
Pantabangan, Carranglan, Nueva Ecija 84,500.00
Doña Remedios/General Tino Watershed Doña Remedios, Bulacan, General Tino, Nueva Ecija
20,760.00
Total 211,117.18Source: 2004 Statistics on Philippine Protected Areas and Wildlife Resources, PAWB22), and Information obtained
through the interview with PAWB
Of these protected areas, only Angat and Pantabangan watersheds are currently covered by formal management system under the NIA-UPRIIS and the NPC. The rest, which consist of more than 63,000 hectares are untenured and may be considered as open access areas that are vulnerable to further encroachment, unauthorized land uses and illegal resource exploitation.
(2) Initial Components of the NIPAS
In addition to these protected areas, the Candaba Swamp and the coasts of Manila Bay within the study area deserve serious attention in terms of faunal biodiversity conservation. Candaba Swamp extends over 33,000 ha in the middle reaches of Pampanga river basin. Owing to its status as a wintering ground of international migratory bird species, it is a candidate site for registration as a wetland of international importance under the Ramsar Convention. The swamp and Manila Bay have also been nominated as Important Bird Area by the Bird Life International.
(3) Mangrove Forests
There existed some 1,276ha of mangrove forests around Manila Bay, of which 1,007ha extended over the study area, in 1994. However, recent environmental resource validation confirmed that only 414.15ha in the entire Manila Bay and 230 ha in the study area were left as of 2005, as shown in Table G.2.1.7 1). The mangrove areas have declined significantly due to conversion for residential use and fishpond aquaculture.

Sector G: Watershed Management
G-9
Table G. 2.1.7 Existing Mangrove in the Study Area Province In the year of 1994 (ha) In the Year of 2005 (ha)
Bulacan 259 10 Pampanga 748 220 Total 1,007 230 Source: Manila Bay Area Environmental Atlas, DENR,2007
(4) Wildlife (Fauna)
Department of Environment and Natural Resources (DENR) Administrative Order No. 2004-15 establishes a National List of Threatened Fauna, specifically the species of birds, mammals, reptiles and amphibians that are a priority concern for protection and conservation. . The list includes 146 species composed of 33 species of mammals, 80 species of birds, 18 species of reptiles and 15 species of amphibians. The issuance supports RA 9147 and the Philippine’s commitment to the Convention on International Trade in Endangered Species of Wild Fauna and Flora (CITES). It prohibits the collection and/or trade of any of the species in the list unless in possession of a permit granted by the DENR.
Table G.2.1.8 lists one species of mammal and seven (7) species of birds found in Pampanga river basin that are included in the International Union for the Conservation of Nature (IUCN) red list. According to this list, five of the bird species are vulnerable, one mammal and one bird species are endangered and one resident species of bird in Candaba swamp is critically endangered.
Table G. 2.1.8 Species Included in the IUCN Red List for Conservation in and around the Study Area
Taxonomy Scientific Name Common Name Conservation
Status Distribution
Area Mammals Acerodon jubatus Golden-crowned fruit bat EN Tarlac Birds Ptilinopus marchei Flame-breasted fruit dove VU Aurora
Ptilinopus merrilli Cream-bellied fruit dove VU Nueva Ecija Erythrura viridifacies Green-faced parrotfinch VU Bulacan Grus antigone Sarus crane CR Candaba swamp and
Nueva Ecija Prinoturus luconensis Green-headed racket-tailed
parrot VU Mt.Arayat and
Pampanga Tringa guttifer Nordmann’s greenshank EN Bulacan Zoothera cinerea Ashy thrush VU Bulacan
Note: Conservation Status: CR (Critically Endangered), EN (Endangered), VU(Vulnerable). Species under Appendix I of Convention on International Trade in Endangered Species of Wild Fauna and Flora (CITES) are categorized as CR, while Appendix II of CITES as EN.
Source: 2004 Statistics on Philippines Protected Areas and Wildlife Resources, Protected Areas and Wildlife Bureau(PAWB), DENR
G.2.2 Socio-economic Conditions
G.2.2.1 Population in the Study Area
Based on 2007 NSCB population census, there are presently 5.8 million people living in the study area (Table G.2.2.1). This represents 59.2% of the total population of Region III and roughly 6.5% of the country’s total population. Pampanga has the largest population of 2.2 million (about 38% of the basin’s total) followed by Nueva Ecija (1.7 million or 30% of the basin’s total), while Bulacan has 1.3 million (23%) and Tarlac 0.5 million (8%), respectively. The population is expected to grow to 7.6milllion by 2025 in the four major provinces according to the estimated growth rates shown in Table G.2.2.2. The urban to rural population ratio is assumed to remain constant until 2025.

Sector G: Watershed Management
G-10
Table G. 2.2.1 Population within the Study Area Province 1980 1990 1995 2000 2007
Bulacan 594,920 769,921 908,081 1,072,923 1,299,400 Nueva Ecija 990,542 1,222,034 1,402,016 1,549,715 1,733,849 Pampanga 1,159,123 1,503,152 1,602,261 1,839,706 2,180,084 Tarlac 260,839 322,431 345,794 396,042 472,676 Others 28,922 40,365 43,744 51,150 70,148 Whole Study Area 3,034,346 3,857,903 4,301,897 4,909,536 5,756,156 Source: (1) Population Census, NSCB. (2) JICA Study Team (estimated population within study area)
Table G. 2.2.2 Projected Population within the Study Area Province Urban:Rural Ratio 2007 2008 2015 2020 2025
Bulacan 70:30 1,299,400 1,334,500 1,585,932 1,766,134 1,944,546 Growth Rate, % 2.70 2.70 2.41 2.18 1.94 Nueva Ecija 50:50 1,733,849 1,761,894 1,960,159 2,092,188 2,210,272 Growth Rate, % 1.62 1.62 1.50 1.31 1.10 Pampanga 68:32 2,180,084 2,219,624 2,493,194 2,675,248 2,843,509 Growth Rate, % 1.81 1.81 1.62 1.42 1.35 Tarlac 44:56 472,676 480,708 536,813 573,956 607,911 Growth Rate, % 1.70 1.70 1.55 1.35 1.16 Others 70,148
Total 5,756,156 5,796,726 6,576,098 7,107,526 7,606,238 Source: JICA Study Team
G.2.2.2 Indigenous Peoples
Republic Act No.8371, otherwise known as the Indigenous Peoples Rights Act, recognizes the fundamental rights of the indigenous peoples in the country, including the ownership and possession by the IPs of their ancestral domains. Also, the act institutionalized the National Commission of Indigenous People (NCIP), which is responsible for formulation and implementation of policies as well as coordination with the DENR for issuance of Certificates of Ancestral Domain/Land Titles (CADT/CALT). CADT refers to a title recognizing the rights of possession and ownership of IPs over the identified area, while CALT refers to a title recognizing to the right of utilization of the identified lands by the members of IPs.
In the Study Area, there are 133,312 Indigenous Peoples (IPs) which is composed of five groups of tribes, as summarized below. Aeta tribe accounts for 34.2% of the total population of IPs in the Study Area, followed by group of Ibaloi, Kalanguya and Kankanaey tribes.
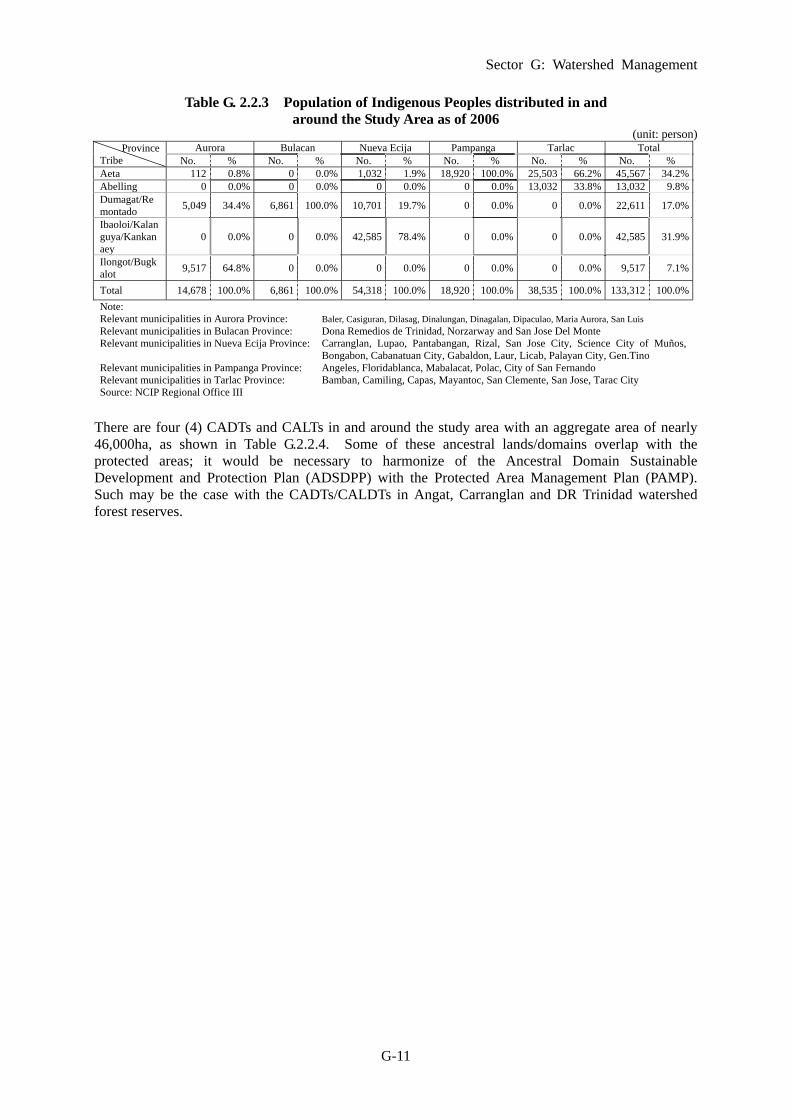
Sector G: Watershed Management
G-11
Table G. 2.2.3 Population of Indigenous Peoples distributed in and around the Study Area as of 2006
(unit: person) Province
Tribe Aurora Bulacan Nueva Ecija Pampanga Tarlac Total
No. % No. % No. % No. % No. % No. % Aeta 112 0.8% 0 0.0% 1,032 1.9% 18,920 100.0% 25,503 66.2% 45,567 34.2%Abelling 0 0.0% 0 0.0% 0 0.0% 0 0.0% 13,032 33.8% 13,032 9.8%Dumagat/Remontado
5,049 34.4% 6,861 100.0% 10,701 19.7% 0 0.0% 0 0.0% 22,611 17.0%
Ibaoloi/Kalanguya/Kankanaey
0 0.0% 0 0.0% 42,585 78.4% 0 0.0% 0 0.0% 42,585 31.9%
Ilongot/Bugkalot
9,517 64.8% 0 0.0% 0 0.0% 0 0.0% 0 0.0% 9,517 7.1%
Total 14,678 100.0% 6,861 100.0% 54,318 100.0% 18,920 100.0% 38,535 100.0% 133,312 100.0%
Note: Relevant municipalities in Aurora Province: Baler, Casiguran, Dilasag, Dinalungan, Dinagalan, Dipaculao, Maria Aurora, San Luis Relevant municipalities in Bulacan Province: Dona Remedios de Trinidad, Norzarway and San Jose Del Monte Relevant municipalities in Nueva Ecija Province: Carranglan, Lupao, Pantabangan, Rizal, San Jose City, Science City of Muños,
Bongabon, Cabanatuan City, Gabaldon, Laur, Licab, Palayan City, Gen.Tino Relevant municipalities in Pampanga Province: Angeles, Floridablanca, Mabalacat, Polac, City of San Fernando Relevant municipalities in Tarlac Province: Bamban, Camiling, Capas, Mayantoc, San Clemente, San Jose, Tarac City Source: NCIP Regional Office III
There are four (4) CADTs and CALTs in and around the study area with an aggregate area of nearly 46,000ha, as shown in Table G.2.2.4. Some of these ancestral lands/domains overlap with the protected areas; it would be necessary to harmonize of the Ancestral Domain Sustainable Development and Protection Plan (ADSDPP) with the Protected Area Management Plan (PAMP). Such may be the case with the CADTs/CALDTs in Angat, Carranglan and DR Trinidad watershed forest reserves.

Sector G: Watershed Management
G-12
Table G. 2.2.4 Status of AD/AL (Ancestral Land) Delineation and Titling in and around the Study Area as of March 9, 2010
Location Claimant
Tribe Area(ha)
A. CADTs/CALTs A1. Sitio of Karahume, Barangay of San Isidro, Municipality of San Jose del Monte, Province of Bulacanl
Dumagat 1,817.15
A2. Sitios Maugat, Kambubuyugan, Alulod/Calumpit and Tubigan, portion of Barangay Kalawakan, Municipality of DRT, Bulacan
Dumagat 19,537.68
A3. Barangays of Capintalan, Minuli, Salazar and Putlan, Municipality of Carranglan, Province of Nueva Ecija
Kalanguya 25,373.10
A4. Barrangays of Nabuklod and Mawakat, Municipality of Floridablanca, Province of Pampanga; portion of Municipality of San Marcelino and Portion of Barrangay Batiawan, Municipality of Subic, all in the Province of Zambales
Aeta 5,457.71
A5. Barangay Camias, Diaz, Inararo, Villamaria, Sapang Uwak, Porac, Pampanga and portion of So. Target, Sapang Bato, Angeles City
Aeta 18,659.73
A6. Barangays of San Nicolas, San Vicente, Anupul (portion) and Calumpangm, Municipality of Bamban, Province of Tarlac; portion of Barangay Marcos Village, Municipality of Mabalacat, Province of Pampanga
Aeta 10,323.308
A7. Barangays Belbel, Burgos, Moraza and Villar, Municipality of Botolan, Zambales Aeta 20,657.89A8. Barangays Atbu, Bacneng, Balete, Baliling, Bantinan, Baracbac, Canabuan, Imugan, Malico, Poblacion, Sta. Rosa, Sinapaoan, Tarlac, Villaflores and Unib, Municipality of Sta. Fe; Barangays Anayo, Balete, Calitlitan (portion), Canabuan, Canarem, Ocao-Capiniaan and Yaway, Municipality of Aritao; Sitio Kamaring, Barangay Cabalatan-Alang, Muncipality of Kayapa; all in the Province of Nueva Vizcaya
Kalanguya- Ikalahan
30,758.58
A9. Barangays Umiray, Lumutan, Canaway, Sablang, Magsikap, Pagsanghan, Maligaya, San Marcelino and portions of Catablingan, Minahan Norte, Mahabang Lalim, and Minahan Sur, all in the Municipality of General Nakar, Province of Quezon and portion of Brgy. Umiray, Municipality of Dingalan, Province of Aurora; portion of Municipality of Montalban, Province of Rizal; and portions of Municipalities of San Jose del Monte, Norzagaray and San Rafael, all in the Province of Bulacan
Dumagat 144,880.70
Sub-Total 277,465.85B. ADs/ALs with the survey* completed B1. Sitio Mapidya, Rio Chico, Gen. Tino, Nueva Ecija Dumagat 13,883.20
Sub-Total 13,883.20C. ADs/ALs with the on-going survey C1. Sos. Baguingan, Kawayan, Flora, Yanca, Bilad, Maragulo, and Tarucan, Capas, Tarlac Aeta 13,723.00C2. Alfonso Castañeda & Dupax Sur, Nueva Vizcaya Bugkalot 52,995.0
Sub-Total 66,718.00D. Areas undergoing social preparation D1. Barangay Kabayunan, DRT, Bulacan Dumagat 60,000.00D2. Sitio Mabaldog, Barangay Ligaya, Gabaldon, Nueva Ecija Dumagat 7,283.00
Sub-Total 67,283.00Total 425,350.05
Note*: NCIP is in charge of implementation of the profile survey for the area. Source: NCIP

Sector G: Watershed Management
G-13
G.3 Issues and Concerns
G.3.1 Watershed Degradation
G.3.1.1 Poverty and Lack of Livelihood Opportunities
The degradation of the watersheds can be traced to the lack of income-earning opportunities in the lowlands, which continues to drive migrants into the uplands in search of livelihood. This spawns a rise in destructive activities in forestlands, such as timber poaching, unregulated harvesting of forest resources, illegal land use and destructive cultivation practices, e.g, “kaingin” or slash-and-burn farming.
These activities, in turn, exacerbate soil erosion, forest fires, lowland flooding or prolonged drought, with dire social and economic consequence to both upland and lowland dwellers. The endless cycle of resource abuse and impoverishment among the poor occupants of the basin is perpetuated as the growing population continues to exert pressure on already dwindling and fragile resource base.
G.3.1.2 Illegal Logging
Timber poaching and illegal resource harvesting is still largely responsible for the shrinking forest cover. Perpetrators of illegal activities in the basin are identified to be rural folks living within the forest areas who collaborate with traders, lumber dealers and armed escorts who facilitate the transport from cutters to end users.
DENR records show that between 1995 and 2004, at least 405 cases of illegal logging activities in Region III have been filed in various courts. However, the slow resolution of these cases also becomes a disincentive and could even dampen the protection efforts among community volunteers2). Table G.3.1.1 identifies the so-called “hotspots” of illegal activities, particularly timber poaching and smuggling of forest products in Pampanga river basin.
Table G. 3.1.1 Illegal Logging Hotspots in Pampanga River Basin Province Hotspots Entry Point of Illegally Cut Logs
Bulacan Sumacbao river boundary of Bulacan and Nueva Ecija in Doña Remedios Trinidad
Doña Remedios Trinidad San Jose Del Monte City
Nueva Ecija General Tinio (Bgys. Pias and Rio Chico) and Bongabon (Bgys. Labi and Calaanan)
Carranglan-Nueva Ecija City road Baler-Pantabangan-Cabanatuan City road Baler-Bongabon-Cabanatuan City road Dingalan-Gabaldon-Palayan City road General Tinio (Fort Magsaysay and
Peñaranda watershed)
Pampanga Mount Arayat National Park (Arayat) Floridablanca Porac
None
Aurora Dingalan Dinadiawan-Quirino Road Source: DENR-Region III FMS-FRCD, undated.
G.3.1.3 Encroachment into Forestlands
In Angat river basin alone, NPC reckons that there are about 1,200 families occupying the area of protected forests. Of these families, 600 are lowland migrants and 600 are formal dwellers consisting of nomadic indigenous peoples known as the Dumagats.
DENR-Region III roughly estimated that 7 of 10 people living in upland of Pampanga river basin make their annual income below poverty threshold of 70,000pesos/household in 2005. Poverty drives both untenured migrants and indigenous peoples to participate in illegal logging, slashing/burning (called “kaingin” in Philippine) farming, wildlife hunting and other unsustainable practices in the river basin. The lack of alternative livelihoods and the absence in some areas of pro-poor upland development programs have induced poor people in the river basin to become willing partners to its destruction.

Sector G: Watershed Management
G-14
G.3.1.4 Illegal Land Use and Conversion
Squatting in upland of Pampanga river basin is a consequence of migration from the lowlands where employment opportunities are scarce and access to titled lands for habitation and production is lacking. This is the case in Nueva Ecija where illegal occupancy also results from the fraudulent land titles and the wanton selling of land rights3).
Forestlands in the river basin are also threatened by unauthorized use and land conversions. In Tarlac, for instance, about 11% of forestlands have been released to non-authorized uses such as agro-forestry, agriculture and grazing4).
G.3.1.5 Forest Fires
Forest fires are rampant especially in the upper reaches of Pantabangan storage dam (called ”Pantabangan-Carranglan watersheds”). In 2005, at least five forest fire incidents in Nueva Ecija affected 116 ha of forest vegetation. Forest fire is attributed not only on climate change but also unsustainable practices such as farming by slashing/burning of the forests, cogon gathering, hunting, and land clearing in preparation for planting.
G.3.1.6 Absence of Harmonized Protected Area Plans
The absence of harmonized plans leads to illegal and conflicting land uses, along with the consequent habitat destruction and bio-diversity loss in these sensitive areas. Of the eight initial components of the NIPAS, comprising an aggregate area of more than 200,000ha, only two PAs, namely Pantabangan-Carranglan WFR and Talavera WFR have Initial Protected Area Management Plans but these are neither comprehensive nor updated.
A thorough resource inventory, cadastral survey, ground delineation and mapping, and socio-economic censuses in these areas needs to be conducted, with the end in view of proper zoning, assignment of appropriate land/resource uses, designing effective management strategies and harmonizing the PA Plans with existing forest land use plans, ancestral domain plans and comprehensive land use plans, as the case may be.
Among indigenous communities, the single most important issue concerns alleged violations of the condition of free prior and informed consent (FPIC), which is required before any project is undertaken within the ancestral domains. This basic right of the IPs to has been guaranteed by the Indigenous People’s Rights Act (IPRA).
G.3.1.7 Inadequate Information and Decision Support System
Poor monitoring and evaluation of projects as well as lack of updated data on prevailing conditions in the watersheds is a major constraint to sound watershed management. There is no single office that takes responsibility over regular collection and updating of information about the state of the forest and its resources. A thorough census of the forest occupants has not been undertaken. Even a basic comprehensive resource inventory has not been undertaken, particularly of the ecologically sensitive areas within the basin and the actual conservation status of the biological resources. Also, updated Management Plans have not been prepared.
Moreover, there is low appreciation for watershed conservation and protection and the implications on environmental, social and economic costs. This is due to low awareness by the general public of the true state of the watershed and its resources, which translates into low participation in the efforts to conserve and protect them.
G.3.2 Weak Reforestation
Critical watersheds in the basin are rapidly being denuded; yet this is not matched with an aggressive campaign to reforest and rehabilitate them. Stakeholders identify the following four reasons for this.
G.3.2.1 Inadequate Tenure Security
Inadequate tenure security leaves substantial parts of the forestlands as “open access” areas and therefore susceptible to encroachment and further degradation. Moreover, the constant shift in forest

Sector G: Watershed Management
G-15
policies often leads to cancellation of some CBFM agreements, thus undermining efforts to improve tenurial security.
G.3.2.2 Poor Performance of Reforestation Projects
The performance of past and on-going reforestation projects in the basin is below targets. According to stakeholders, this is due to inappropriate management scheme such as one-time contract growing; inadequate technology, e.g., to improve adaptation to prevailing agro-climatic conditions and to increase the survival rate of planted species; poor maintenance and protection after planting; and inadequate seedling nurseries.
G.3.2.3 Inadequate Institutional Capability
The DENR grapples with funding, manpower and logistics constraints such that field extension work is limited in scale. As a result, organized communities end up not adequately equipped with technical and management skills to undertake forest protection and development in their tenured areas. Funding and manpower resource constraints also affect the effectiveness and competence of the LGUs to undertake devolved watershed functions.
G.3.2.4 Lack of Incentive for Private Participation and Investment in Forestry Development
The policy of total log ban and the slowdown of wood-based industries is said to be responsible for poor accomplishment among private forest concessionaires and the lack of interest by private investors to actively participate in forestry development.
G.3.3 Poor Institutional Coordination Mechanisms
G.3.3.1 Conflicting/Overlapping Mandates
Conflict arises due to unclear and overlapping mandate over watershed areas and hinders cooperation between the DENR and the LGUs. There is a need to strengthen coordination mechanisms as well as clear delineation of authority at the lowest planning level.
G.3.3.2 Inadequate Devolution
On one hand, LGUs want full devolution of forest management functions over integrated social forestry (ISF) and small watershed areas devolved to them under the Local Government Code. On the other hand, DENR cites that LGUs do not have sufficient means and technical capability, much less the willingness to undertake the devolved functions.
G.3.3.3 Political Interference
Stakeholders observe that watershed activities in the basin often take a backseat in favor of pet political projects such as big infrastructure development. Thus resources for forestry and environmental conservation projects only come in trickles.
Several illegal activities are being made in Pampanga river basin, which leads to difficulties in preserving the forest in the basin. The particular illegal activities are as described hereinafter.

Sector G: Watershed Management
G-16
G.4 Plan for Watershed Management
G.4.1 Goals of Watershed Management in the Basin
G.4.1.1 Related National and Regional Policies, Strategies and Thrusts
The national policies on watershed management are laid out in Philippine Agenda 21, the country’s blueprint for sustainable development and the 2003 Revised Master Plan for Forestry Development. Specifically, the revised MPFD aims to enhance the life-sustaining functions of vital forest ecosystems by pursuing the following objectives:
Sustainable management of the watersheds/forests by capable institutions with active participation of empowered stakeholders
Enhancement of the protective and biodiversity values of forests
Improvement of the quality of life of upland communities actively participating in sustainable forest management thru CBFM.
Enhancement and improvement of decision making processes through adoption of improved MIS, a fully relevant M & E, continuing forest resources assessment, forest resources accounting, criteria and indicator and forest certification, etc.
Enhancement of efficiency and competence in forest conservation, management and forest protection
At the regional level, the parallel thrusts are laid out in the Operation Plan for the Manila Bay Coastal Strategy (OPMBCS). Among the objectives of this Operation Plan in relation to habitat and resource degradation are: (i) to establish, restore and manage declared protected areas and critical habitats in the Manila Bay region; (ii) to increase the forest cover of the watersheds; and (iii) to rehabilitate and manage the mangrove areas.
G.4.1.2 Goals under the IWRM Plan
Consistent with the national and regional strategies and thrusts, there are twin goals set for the watershed management sector under the proposed IWRM Plan, namely:
to intensify the management, protection and maintenance of vulnerable and ecologically sensitive areas; and
to increase the forest cover of critically denuded uplands, mangrove areas and urban corridors.
G.4.2 Projects as Countermeasures to Address Problems and Issues on Watershed Management
G.4.2.1 Project List
The programs and projects listed in Table G.4.2.1 are proposed to meet the twin goals identified for watershed management. These are expected to address the watershed management issues and concerns identified earlier in Chapter G.3.

Sector G: Watershed Management
G-17
Table G. 4.2.1 On-going, Proposed and Conceptual Programs and Projects related to Problems and Issues on Watershed Management
Goals: 1) Intensify the management, protection and maintenance of vulnerable and ecologically sensitive areas 2) Increase the forest cover of critically denuded uplands, and mangrove areas and urban corridors
Problems and Issues / Causes Countermeasures Programs and Projects 1. Watershed Degradation
(1) Poverty and lack of livelihood
- Timber poaching/ unsustainable harvesting of forest resources - Encroachment - Destructive cultivation (“kaingin” farming) - Soil erosion, prolonged drought, lowland flooding, unproductive lands - Forest fires
(2) Absence of Harmonized Protected Area Management Plans
- Illegal and conflicting land uses; habitat destruction; biodiversity loss - Non-compliance with FPIC requirements in ancestral domain areas
(3) Inadequate Information and Decision Support System
1.1 Livelihood Development 1.2 Agro-forestry Development 1.3 Eco-tourism 1.4 Enhance Forest Protection and Law
Enforcement
1.5 Resettlement of Forest Occupants, where Applicable
1.6 Appropriate Upland Farming
Systems and Technologies 1.7 Improve Fire Management
Capability
1.8 Harmonization of PA Management.
plans, Ancestral Domain Plans, Forest Land Use Plans and CLUPs
1.9 Basic Resource Inventory, Mapping, Zoning, Census
1.10 Improve M&E and Data Management
1.11 Improve Public Awareness
WS-G-02: Community- based Forest Mgt. Program (CBFMP)
WS-G-03: Integrated Agro-forestry Dev’t.. Program (CBFM-CARP)
WS-G-04: Coastal Resource Mgt. Program (CRMP) WS-G-05: Protected Area Community- based Resource
Mgt. Program (CBFM-PACBRMP) WS-G-07: NIA-UPRIIS’s WS Mgt. Program WS-G-08: NPC’s WS Mgt. Program WS-G-11: Forest Mgt. Program (FMP) WS-C-04: Community-based Eco-tourism Program
WS-G-01: Forest Protection and Law Enforcement
Program WS-G-08: NPC’s WS Mgt. Program (Angat) WS-G-11: Forest Mgt. Program (FMP) WS-G-07: NIA-UPRIIS’s WS Mgt. Program WS-G-08: NPC’s WS Mgt. Program
WS-C-02: Protected Area Mgt. Program (PAMP)
2. Weak Reforestation
(1) Inadequate Tenurial Security (2) Poor Performance of Past Reforestation Projects
- Inadequate institutional capability - Inappropriate management scheme - Inadequate technology to improve species adaptation and survival rate - Inadequate seedling nurseries - Poor post-planting protection and maintenance
(3) Lack of incentive for private participation and investment in forest development
2.1 Improve Tenurial Security
2.2 Rationalize/ Streamline Forestry Projects in Tenured Areas
2.3 Provision for post-planting protection and maintenance
2.4 Selective log ban 2.5 Tax holidays and other economic
incentive systems
2.6 Adopt-a-Watershed scheme
WS-G-02: Community- based Forest Mgt. Program WS-C-01: Upland Development Program (UDP)
WS-G -12: Pampanga River Basin Rehabilitation Project (PRBRP)
WS-G-06: Private Forest Plantation Development. Program (PFPDP)
WS-G-10: Private Sector-WS Mgt. Initiatives
3. Poor Institutional Coordination
(1) Inadequate Devolution (2) Conflicting/Overlapping
Mandates (3) Political interference
3.1 Coordination Mechanisms for Full Devolution of ISF
3.2 Urban Greening
WS-G-09: Integrated Social Forestry (ISF) Projects
WS-C-03: Urban Greening Program (LGU-led WM Initiatives)
Source: JICA Study Team
There are sixteen projects under the watershed management sector as shown in Table G.4.2.2. Twelve of the projects are on-going while four (4) are conceptual projects. Six on-going projects are being implemented as regular programs of the DENR and three are regular undertakings of other relevant government agencies and three others are special projects. The project profiles describing each of these projects are found in Annex-T G.4.2.1. The locations of the projects are shown in Annex-F G.4.2.1.
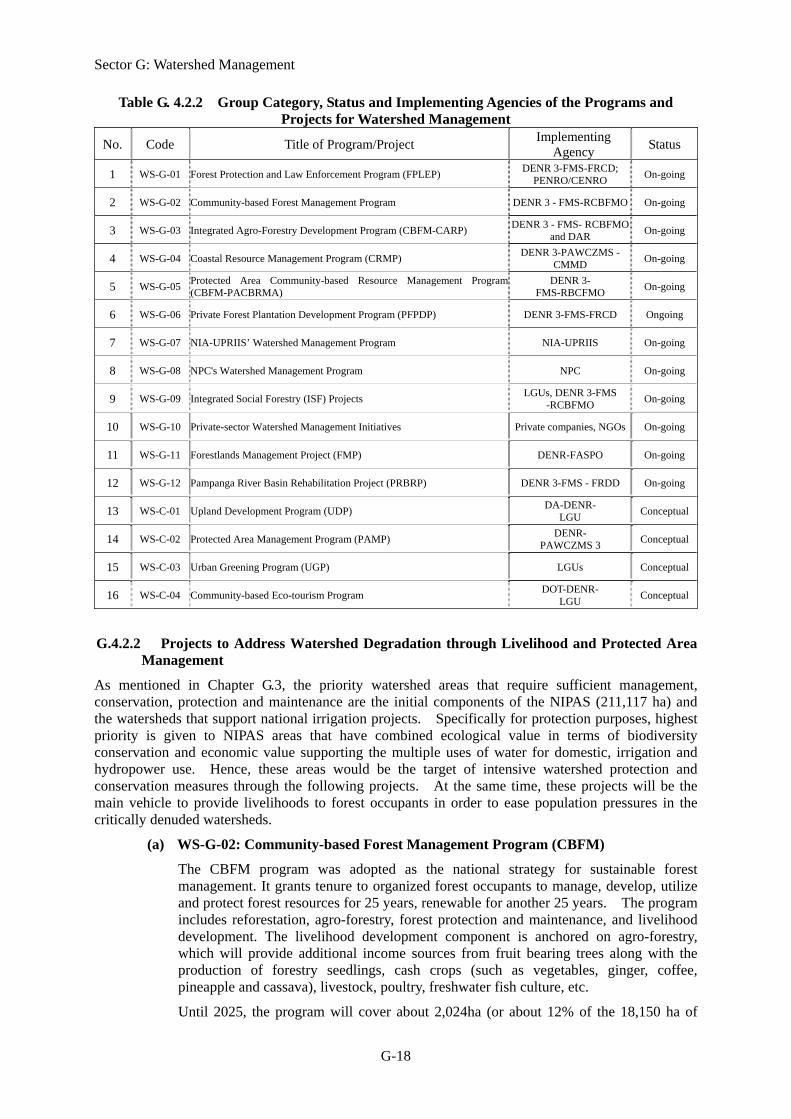
Sector G: Watershed Management
G-18
Table G. 4.2.2 Group Category, Status and Implementing Agencies of the Programs and Projects for Watershed Management
No. Code Title of Program/Project Implementing
Agency Status
1 WS-G-01 Forest Protection and Law Enforcement Program (FPLEP) DENR 3-FMS-FRCD;
PENRO/CENRO On-going
2 WS-G-02 Community-based Forest Management Program DENR 3 - FMS-RCBFMO On-going
3 WS-G-03 Integrated Agro-Forestry Development Program (CBFM-CARP) DENR 3 - FMS- RCBFMO
and DAR On-going
4 WS-G-04 Coastal Resource Management Program (CRMP) DENR 3-PAWCZMS -
CMMD On-going
5 WS-G-05 Protected Area Community-based Resource Management Program (CBFM-PACBRMA)
DENR 3- FMS-RBCFMO
On-going
6 WS-G-06 Private Forest Plantation Development Program (PFPDP) DENR 3-FMS-FRCD Ongoing
7 WS-G-07 NIA-UPRIIS’ Watershed Management Program NIA-UPRIIS On-going
8 WS-G-08 NPC's Watershed Management Program NPC On-going
9 WS-G-09 Integrated Social Forestry (ISF) Projects LGUs, DENR 3-FMS
-RCBFMO On-going
10 WS-G-10 Private-sector Watershed Management Initiatives Private companies, NGOs On-going
11 WS-G-11 Forestlands Management Project (FMP) DENR-FASPO On-going
12 WS-G-12 Pampanga River Basin Rehabilitation Project (PRBRP) DENR 3-FMS - FRDD On-going
13 WS-C-01 Upland Development Program (UDP) DA-DENR-
LGU Conceptual
14 WS-C-02 Protected Area Management Program (PAMP) DENR-
PAWCZMS 3 Conceptual
15 WS-C-03 Urban Greening Program (UGP) LGUs Conceptual
16 WS-C-04 Community-based Eco-tourism Program DOT-DENR-
LGU Conceptual
G.4.2.2 Projects to Address Watershed Degradation through Livelihood and Protected Area Management
As mentioned in Chapter G.3, the priority watershed areas that require sufficient management, conservation, protection and maintenance are the initial components of the NIPAS (211,117 ha) and the watersheds that support national irrigation projects. Specifically for protection purposes, highest priority is given to NIPAS areas that have combined ecological value in terms of biodiversity conservation and economic value supporting the multiple uses of water for domestic, irrigation and hydropower use. Hence, these areas would be the target of intensive watershed protection and conservation measures through the following projects. At the same time, these projects will be the main vehicle to provide livelihoods to forest occupants in order to ease population pressures in the critically denuded watersheds.
(a) WS-G-02: Community-based Forest Management Program (CBFM)
The CBFM program was adopted as the national strategy for sustainable forest management. It grants tenure to organized forest occupants to manage, develop, utilize and protect forest resources for 25 years, renewable for another 25 years. The program includes reforestation, agro-forestry, forest protection and maintenance, and livelihood development. The livelihood development component is anchored on agro-forestry, which will provide additional income sources from fruit bearing trees along with the production of forestry seedlings, cash crops (such as vegetables, ginger, coffee, pineapple and cassava), livestock, poultry, freshwater fish culture, etc.
Until 2025, the program will cover about 2,024ha (or about 12% of the 18,150 ha of
Sector G: Watershed Management
G-19
forestlands in Angeles City, Arayat, Magalang, Porac, DR Trinidad, Bongabon, Carrangalan. Gabaldon, Gen. Tinio, Laur, Llanera, Lupao, Pantabangan, Rizal, San Jose City that are under active Community-based Forest Management Agreement (CBFMA) tenure. It is assumed that 4% of the areas will be devoted to forest tree plantation establishment while 8% will be devoted to agro-forestry. The support activities will include protection and maintenance of newly established plantations; relocation survey and monitoring; sustenance of livelihood; and organizational development and capacity building for CBFM beneficiaries.
The program will be implemented by the DENR-FMS III under the Regional Community Based Forest Management Office (RCBFMO) at an estimated annual budget of 4.71 Mil. Pesos/year.
(b) WS-G-03: Integrated Agro-Forestry Development Program (CBFM-CARP)
The IAFD program is a special project for selected agrarian reform beneficiaries under the Comprehensive Agrarian Reform Program (CARP) in the uplands. It aims to adopt sustainable upland agricultural production through agro-forestry using the CBFM approach. It is being undertaken through a Memorandum of Understanding between the DENR and the Department of Agrarian Reform (DAR). The DAR provides funding support for agro-forestry and livelihood development while the DENR provides technical assistance to the POs.
The CARP tenured area in the basin includes 1,297ha of uplands in Bongabon, N. Ecija and Norzagaray, Bulacan. Until 2008, the project in Nueva Ecija involved coffee plantation-forest establishment with small water impounding system (SWIS) as infra support while in Bulacan, agro-forestry is integrated with poultry (native chicken) production. The beneficiaries include two POs with 79 member-households.
For the period until 2015, the CBFM-CARP will continue to expand the agro-forestry production areas into 779ha (or the remaining 60% of the CARP tenured upland areas) that have not been covered under the project. Technical support activities will include relocation survey, mapping and monitoring, organization of new POs and strengthening of their technical capabilities and sustenance of livelihood projects. The program will require an annual budget of 6.15 Mil. Pesos.
(c) WS-G-04: Coastal Resource Management Program (CRMP)
Through this program, the DENR-Protected Area and Wildlife Coastal Zone Management Services-Coastal and Marine Management Division (DENR-PAWCZMS-CMMD) will continue to: (i) rehabilitate and re-establish the mangrove forests in 539ha (or 15%) of the swamp areas; and (ii) protect 235ha of old growth mangrove forests within the coastal areas of Bulacan and Pampanga within Manila Bay. In this sense, the program supports the objectives of the Operational Plan of the Manila Bay Coastal Strategy to protect marine biodiversity and restore the important habitats of Manila Bay. The program will be done through contract reforestation scheme with the participation of coastal communities and the respective LGUs.
Other activities will include participatory coastal resource assessment, mapping, updating of municipal coastal resource data base and preparation and implementation of coastal resource management plans. The Plans would include establishment of coastal and marine sanctuaries, monitoring, law enforcement and policy support, community organization, capacity development, and IEC involving six coastal municipalities. The budget required to implement the program until 2025 is approximately 2.45 Mil. Pesos/ year.
Sector G: Watershed Management
G-20
(d) WS-G-05: Protected Area Community-based Resource Management Program (CBFM-PACBRMP)
As already mentioned, the initial components of the NIPAS are among the priority conservation areas in the basin. However, about 64,000ha of these areas are still untenured and are presently not under any formal management system. These areas include Biak na Bato National Park, DR Trinidad/Gen. Tinio WFR, Minalungao NP, Mt. Arayat NP and Talavera WFR.
Until 2025, the CBFM-PACBRMP will focus on protecting and rehabilitating 193 hectares (or about 0.3%) of these areas, subject to issuance of a Protected Area Community based Resource Management Agreement (PACBRMA). The PACBRMA will grant the occupants 25 years, renewable for another 25 years, of tenure rights and authority to manage, develop, protect and utilize forest resources within allowable zones of the protected forests. The program will be undertaken according to the following targets: forest plantation development including nursery establishment, enrichment planting and assisted natural regeneration in 64ha and agroforestry development in about 129ha. Technical support activities will involve protection of old timber stands and newly established timber and agro-forest plantations; relocation survey, mapping and monitoring; organizational development and capacity building; and sustenance of livelihood.
The program will be undertaken by the DENR-RCBFMO with a budget of 0.84 Mil. Pesos/year.
(e) WS-G-07: NIA-UPRIIS’s Watershed Management Program
The NIA-UPRIIS currently manages and protects the 10,356 ha of the Pantabangan-Carranglan Watershed Forest Reserve. The NIA-UPRIIS also co-manages and derives earnings from the established agro-forestry areas with organized POs and cooperatives.
Recently, the NIA-UPRIIS started to rehabilitate and reforest an initial 100 ha of Pantabangan-Masiway watersheds jointly with the Energy Development Corporation. EDC operates Masiway Dam for hydroelectric power generation. Under this joint venture arrangement, EDC provides funds and technical assistance in the propagation and use of indigenous species to reforest the denuded areas surrounding the dam. The NIA would help create additional income sources by hiring locals in contract reforestation.
The NIA-EDC joint venture arrangement will sustain and continue to rehabilitate about 1,500ha of denuded areas immediately surrounding the Masiway Dam until 2025. Primary activities will focus on reforestation using indigenous tree species and livelihood development through agro-forestry. Other activities will include protection (patrolling, surveillance, monitoring, fire management), nursery establishment, maintenance of newly established plantations, road grading and other infrastructure support, organizational development and stakeholder capability building, and sustenance of other livelihood projects such as production of charcoal briquettes, etc. These will entail a yearly budget of 11.98 Mil. Pesos.
(f) WS-G-08: NPC’s Watershed Management Program
The NPC is in charge of the management and prtotection of 14,166ha of Pantabangan-Carranglan WFR in N. Ecija and 55,079ha of Angat WFR in Bulacan. These watersheds support the two hydro-electric dams in the basin. The NPC organized a watershed management team for each area, namely; Pantabangan Watershed Action Team (PWAT) for the Pantabangan dam and Angat Watershed Action Team (AWAT) for the Angat dam.
Until 2025, the NPC’s program in Angat WFR will be anchored primarily on forest

Sector G: Watershed Management
G-21
protection with the strong support of the contingent from the Armed Forces of the Philippines and the Bantay Watershed volunteers. Protection activities will include patrolling and surveillance, law enforcement and public awareness campaigns focusing on identified ‘hotspots’ of illegal activities. In order to strengthen protection, the major thrusts of the program include resettlement and livelihood development involving 1,200 forest occupants. Meanwhile, current reforestation efforts will be continued in the buffer zones to cover about 1,950 ha of the Angat WFR through reforestation, and assisted natural regeneration (ANR), silvicultural management and erosion control until 2025. Other activities will also include stakeholder capability building, IEC and public awareness, monitoring and research and development on biodiversity through the Philippine Eagle Conservation Project.
In the Pantabangan area of responsibility, the NPC will continue to pursue the implementation of a comprehensive Forest Land Use Plan (FLUP) through the Inter-Agency Task Force and the Protected Area Management Board (PAMB), of which it is a member together with the DENR, the NIA-UPRIIS and the LGUs. The PWAT activities will focus on the management of forest fires, which are rampant in the Pantabangan-Carranglan area, and protection against illegal activities such as timber poaching, charcoal making and “kaingin” farming. It will also continue to implement livelihood programs for forest occupants, such as handicraft making, mushroom growing, honey bee culture and charcoal briquette production, in partnership with universities and colleges.
The program will require an annual budget of 7.14 Mil. Pesos/year, which will be financed out of the universal levy fund (ULF) collected from the consumers as environmental charge.
(g) WS-G-11: Forest Management Program (FMP)
FMP is a JICA-assisted project in the pipeline, which covers three critical river basins in the country, namely, Upper Magat-Cagayan River Basin in Region 2, Jalaur River Basin in Iloilo and Upper Pampanga River Basin, which is part of the study area. The project aims to strengthen forest management in partnership with the LGUs and the communities and to improve the economic conditions of upland dwellers through sustainable resource utilization.
The project sites in Upper Pampanga includes 44,600ha Pantabangan-Carranglan and Talavera Watersheds. The project components would include: (i) physical survey and mapping and socio-economic baseline profiling; (ii) PO formation and CBFMA acquisition; (iii) PO capacity building; (iv) forest tree plantation, silvi-pasture and agro-forestry with bio-fuel and soil conservation measures; (v) infrastructure support such as farm-to-market roads, bridges, and pipeline irrigation system for agro-forestry; (vi) policy initiative (including establishment of cost sharing mechanism and payment for environmental services); and (vii) monitoring and evaluation. The total area covered by forest plantation development in Upper Pampanga river basin is 14,133ha. It is assumed that 30% of this area will be devoted to reforestation and the rest to agro-forestry.
The project is expected to start in 2011 and end in 2020 under the DENR’s Foreign Assisted Projects Office (FASPO). The total estimated cost is 996 Mil. Pesos.
(h) WS-C-04: Community-based Eco-tourism Program
This conceptual program is proposed over the 10,984ha that comprise Candaba Swamp, Pantabangan-Carranglan watershed, and Biak-na-Bato National Park. These sites are among the protected areas or critical habitats that present a high potential for eco-tourism development. In fact, at present, these areas already enjoy tourist patronage, albeit on a limited scale. However, there is room for improving the facilities and services to improve tourist traffic and engender public support for conservation

Sector G: Watershed Management
G-22
priorities.
Eco-tourism thrives on the principle of regulated public access during particular seasons of the year, when for example, migratory birds and other important species could be the focus of tourist attraction to support conservation. Eco-tourism offers huge potential for providing additional income to organized communities through guided tours, hotel and restaurant management, trekking and camping services, souvenir items and the like, while contributing financial resources to sustain public awareness and support for the conservation of critical habitats and natural ecosystems.
Specifically, the project will include the following participatory activities: (i) Ecotourism site survey, (ii) Delineation and establishment of critical habitats/ wildlife sanctuary and/or cultural heritage sites, (iii) Market study and visitor Survey, (iv) Eco-tourism Plan formulation; (v) Phased development of initial infrastructure support for the three (3) sites (e.g., Ecopark with wildlife sanctuary, botanical garden, canopy walks, trekking, extreme sports facilities, hostels/restaurants, souvenir shops, picnic grounds, audio-visual rooms, boating/water sports areas, nature spa, etc.), (vi) Park management organizational development, stakeholder capability building and policy support; (vii) Promotion and Marketing Strategies and (viii) Sustainable Product/Enterprise Development. In addition, about 1,098ha will be reforested in phases out of funds generated from eco-tourism activities.
A technical assistance may be necessary to undertake this project at a total estimated cost of 264 Mil. Pesos. The project is proposed to be implemented by the Department of Tourism in coordination with the DENR, the concerned PAMBs and the communities. F/S level study to confirm the program components may be necessary.
(i) WS-G-01: Forest Protection and Law Enforcement Program (FPLEP)
The program is a regular undertaking of the DENR through the respective Provincial/Community ENR offices. Until 2025, about 198,377ha of untenured forestlands will be protected, particularly the so-called “hotspots” within the watershed forest reserves of Pantabangan-Carranglan, Talavera and DRT-Gen. Tinio and Mt. Arayat National Park. The program will involve apprehension, confiscation and initiation of legal proceedings in order to curb illegal forest extraction activities. It will also include prevention and management of forest fires by organized and trained community brigades through Forest Fire and Control Management (FFCM).
The program will include the following activities:
Patrolling and surveillance, with the deployment of 102 forest rangers.
Capacity building and strengthening of provincial and municipal multi-sectoral forest protection councils Forest Fire and Control Management (FFCM).
Implementation of fire management plans through community fire volunteers and members of the FFCM
Support to anti-illegal logging/timber poaching, including monitoring and court litigation
IEC activities, including on- and off-campus teach-ins and distribution of campaign materials in partnership with schools and civic organizations.
Vulnerability assessment and geo-hazard mapping in the four major 4 provinces
The program will require an estimated budget of 2.5 Mil. Pesos/year.
(j) WS-C-02: Protected Area Management Program (PAMP)
As mentioned in Chapter G.3, the priority watershed areas that require sufficient management, conservation, protection and maintenance are the initial components of the
Sector G: Watershed Management
G-23
NIPAS. These comprise a total area of 211,117ha of protection forestlands that have prime ecological value in terms of biodiversity and unique habitats.
The project is conceived as a comprehensive program with the ultimate goal of officially establishing 56,147 hectares of protection forests as NIPAS areas through congressional and executive legislation. In particular, the target protected areas would include the most critical of the initial components of the NIPAS (protected areas) in terms of conservation of biodiversity, unique ecosystem and cultural heritage: (i) Biak Na Bato NP, (ii) Minalungao NP; (iii) LT: DRT-Gen. Tinio WS; (iv) Mt. Arayat NP, and (v) Talavera Watershed Reserve.
The specific program activities will include as follows: (i) Basic resource inventory, assessment and mapping; socio-economic surveys; (ii) Designation and ground delineation of management zones; (iii) Formulation of Protected Area Management Plans; and (iv) Initial implementation of priority action plans. The latter is expected to include reforestation through assisted natural regeneration or rainforestation of about 5,000ha (or 10% of the target areas) using the community-based approach. It will also include biodiversity and wildlife conservation projects, alternative livelihoods in the multiple-use zones and IEC campaigns among organized forest communities, schools and local institutions. Eventually, the plans will be harmonized with forest land use plans and comprehensive land use plans to address conflicting land use issues. In particular, where PAs are overlapping ancestral lands, mechanisms will be pilot tested to streamline compliance with FPIC requirements and harmonize the plans with Ancestral Domain Sustainable Development Plans and Programs (ADSDPP).
A technical assistance may be necessary to undertake this project at a total estimated cost of 404 Mil.Pesos. The project is proposed to be implemented by the DENR’s Protected Area and Wildlife Bureau (DENR-PAWB). Further basic study to confirm the project components and prepare the Terms of Reference for may be required.
G.4.2.3 Projects to Address Weak Reforestation
(a) WS-G-02: Community-based Forest Management Program (CBFM)
The contents of the project are described in section G.4.2.2.
(b) WS-C-01: Upland Development Program (UDP)
The original model of the Upland Development Program was implemented by the Department of Agriculture (DA) in Mindanao to address upland poverty and provide alternative to the widespread practice of slash and burn (“kaingin”) system in the uplands. The original concept of this model UDP is sustainable upland agricultural production using appropriate soil and water conservation strategies such as Sloping Agricultural Technology (SALT) and its variants in integrated or diversified farming systems anchored on agro-forestry. It gained wide acceptance among upland farmers in Mindanao.
The UDP is conceived as one of the better options for untenured areas that have critical (30% or more) slopes, where severe soil erosion is a cause for concern. UDP is also proposed to be undertaken in priority watershed areas that support national irrigation systems, which are not yet covered by any of the on-going and proposed programs by concerned agencies (see Table G.3.1.1).
In the basin, the potential severe erosion areas comprise some 22,114ha in Bulacan, Pampanga and Tarlac (see Annex-F G.4.2.2), while watershed areas supporting other NIS which are presently not under any management scheme (namely, O’Donnell WS and Porac-Gumain WS) comprise some 60,826 ha. Only 20% of the former and 10% of the latter, or 10,505ha in total, are targeted for this project until 2025. Specifically, the proposed activities include: (i) Agro-forestry development with silvi-pasture, soil and water conservation measures through diversified farming systems covering 10,500ha;

Sector G: Watershed Management
G-24
(ii) Agro-forestry support facilities (e.g., rehabilitation of farm-to-market roads and construction of communal impounding systems (CIPs) as necessary; (iii) Physical survey and mapping, resource profiling, socio-economic survey; (iv) Enterprise development and access to microfinance for beneficiaries; (v) PO Formation, CBFMA acquisition and capacity-building; (vi) Policy initiatives and organization of Watershed Mgt. Councils; and (vii) Monitoring and evaluation.
The project is proposed to be implemented as a cooperation project among the DA-Bureau of Soils and Water Management, the NIA, the DENR and the concerned LGUs. The project is estimated to cost 980 Mil. Pesos.
F/S level study to confirm the program components may be necessary.
(c) WS-G-12: Pampanga River Basin Rehabilitation Program (PRBRP)
The PRBRP is a special project undertaken by the Forest Resources Conservation Division (FRCD) of the DENR-FMS 3 from 2004 to 2008 in response to the spate of flood events in the basin. A Pampanga River Basin Management Plan (2005-2010) was formulated under this project, with the objective of doubling the forest cover of Pampanga river basin from an estimated 24% in 2004 to 48% by 2010 (or a target of 8.8 million trees planted per year).
The program has four components: (i) reforestation for the denuded forests of 67,700 ha; (ii) erosion control through vegetative cover of 300,000 ha, riverbank protection works and stream bank stabilization through bamboo plantation; (iii) protection and maintenance for protected forests of 292,387 ha; and (iv) development of plantation road of 53 km in length and 350 units of small water impounding systems (SWIS).
It was temporarily shelved in 2009 due to budget constraints. Until then, the accomplishments involved reforestation of 4,900 and maintenance and protection of 2,900ha of newly established plantations within the forestlands in upper Pampanga River Basin. The PRBRP utilized the CBFM beneficiaries who were contracted to undertake the reforestation or planting activities while DENR provides technical and financial assistance.
For the year 2010-2012, the project will be resumed in order to carry out remaining maintenance and protection activities involving a backlog of 500 ha out of 2,000 ha of newly established tree plantations in Pampanga, N. Ecija, Bulacan and Tarlac.. The project is estimated to cost 12 Mil.Pesos.
(d) WS-G-06: Private Forest Plantation Development Program (PFPDP)
The Forest Resources Conservation Division (FRCD) of the DENR-FMS Region III regulates the forest plantation development by private entities. As discussed earlier, some 15,539ha of forestlands within the study area are leased out through various forms of forest lease contracts and management agreements with private companies or individuals. The concessionaires plant commercial species of timber and derive their income from harvested tree stands. DENR regulates the volume of timber extraction in accordance with the annual allowable cut (ACC) specified in the lease agreement.
Until 2025, the DENR-FRCD will continue increase the private forest plantation development by about 1,865ha covering the areas in Porac, Pampanga; San Miguel and DR Trininad, Bulacan; and Laur, Gabaldon, Gen. Tinio, San Jose, Palayan City and Bongabon. This will require an annual budget of 6.21Mil. Pesos.
(e) WS-G-10: Private Sector Watershed Management Initiatives
Until 2025, the private sector will restore the 735ha of denuded forests in Pampanga and Bulacan through the “Adopt-a-Watershed” program or the “Adopt-a-Mountain” program. This will have the active involvement of Clark Development Corporation, Subic-Clark
Sector G: Watershed Management
G-25
Alliance for Development, water districts and private industries such as Holcim Cement Corporation.
Specifically, these initiatives will include the following activities, namely reforestation, nursery establishment and river bank vegetation, survey and monitoring, and maintenance and protection of newly established plantations, organizational development and stakeholder capability.
The project costs shall be borne by the private agencies through volunteer work and as part of their social responsibility agenda and will require an annual budget of 2.1 Mil. Pesos/year.
G.4.2.4 Projects to Address Poor Institutional Coordination
(a) WS-G-09: Integrated Social Forestry (ISF) Projects
Until 2025, the program will reforest 1,143ha or about 15% of the total ISF-tenured areas, with initial targets identified in (a) Nueva Ecija: 50 ha of Talavera WS, 50 ha of Aulo-Cabo WS for protection, 200 ha of Carranglan WS for reforestation; (b) Tarlac: 500 ha of O’Donnell WS for reforestation. These areas are covered by certificates of stewardship contracts (CSC), which grant rights to individual households forest occupants the right to sustainably manage, develop, protect and utilize forest resources for 25-year, renewable for another 25 years.
Specifically, the program will focus on forest plantation development and management through nursery establishment, enrichment planting, ANR, silviculture in 381ha and agro-forestry in 762ha of forestlands. Other activities will include relocation survey, mapping and monitoring, stakeholder capability building and sustenance of currnet livelihood development programs for forest occupants. The required budget is 3.4Mil. Pesos/year.
(b) WS-C-03: Urban Greening Program
The Urban Greening Program is a conceptual project aimed at restoring forest cover in strategic urban spaces using appropriate timber and non-timber species in order to enhance the urban greening initiatives and provide balance to uncontrolled urban sprawl. It is expected that by 2025, about 7,256ha of urban corridors would be covered by forests, including 22km of major highways, river banks, community parks, public plazas and private subdivisions in urban settlements.
The LGUs will spearhead this program with the active involvement of the academe, business groups, NGOs and other civil society groups. LGUs have the advantage of strong local influence and could therefore mobilize a critical mass of volunteers and resources from both private and public agencies to launch a full-scale greening program in their localities. Moreover, owing to LGU’s strong presence in the lowlands rather than the uplands LGUs could be more effective partners in the watershed management by focusing their efforts in urban greening.
From preliminary estimates, the project may require about 0.1 Mil.Peos/year to cover the cost of organization, monitoring and technical support.

Sector G: Watershed Management
G-26
References
1) Manila Bay Environmental Atlas, 2005. 2) DENR III-FMS-FRCD. Undated Powerpoint Presentation. Update on Forest Protection and Law
Enforcement Operations. 3) Nueva Ecija Province. Socio-Economic Profile. 2005. 4) Tarlac Provincial Development and Physical Framework Plan. Undated.

Annex-Tables


GT-1
Annex-T G.2.1.1 Land Use / Land Cover Categories by Sub-Basin
Forest Brushland Paddy FieldOther
CultivatedArea
Built-upArea
Settlement Swamp Fishpond Water BodyOthers
(Natural)Others
(Artificial)Total
PAM01 0.7 9.7 0.5 7.4 2.3 5.5 119.4 11.7 1.9 0.1 159.2
PAM02 200.7 225.5 892.1 91.8 31.5 13.3 2.6 34.2 9.3 15.5 0.8 1,517.3
PAM03 6.8 6.5 15.7 3.0 1.2 0.8 0.0 4.2 1.6 0.0 39.8
PAM04 16.6 168.7 488.4 46.7 17.2 7.6 4.3 3.3 8.9 36.5 0.6 798.7
PAM05 88.7 186.7 128.1 2.7 7.0 0.6 0.4 0.0 3.0 19.4 0.1 436.6
PAN01 213.7 511.2 57.6 2.7 27.9 36.4 849.4
RCH01 108.8 532.3 1,795.8 223.7 67.0 25.2 19.4 13.1 17.7 83.4 9.0 2,895.3
PEN01 329.5 139.2 60.2 21.8 5.0 0.7 0.2 0.0 5.8 7.1 0.1 569.7
COR01 350.7 222.8 120.7 1.0 3.4 1.1 0.2 3.8 8.5 0.0 712.0
ANG01 2.8 56.0 1.6 16.1 1.5 6.5 85.3 7.7 15.7 0.3 193.5
ANG02 45.7 153.8 65.8 39.8 15.7 2.5 1.2 1.1 10.1 9.5 0.4 345.8
ANG03 500.2 23.3 0.8 20.7 0.9 545.9
PAS01 20.9 360.3 291.6 260.6 92.0 14.1 16.2 233.9 18.4 57.2 6.1 1,371.3
Total 1,875.4 2,533.9 3,972.5 706.7 268.0 70.1 57.1 490.5 149.3 293.5 17.5 10,434.4
Sub-Basin
Area (km2)
Source: JICA Study Team
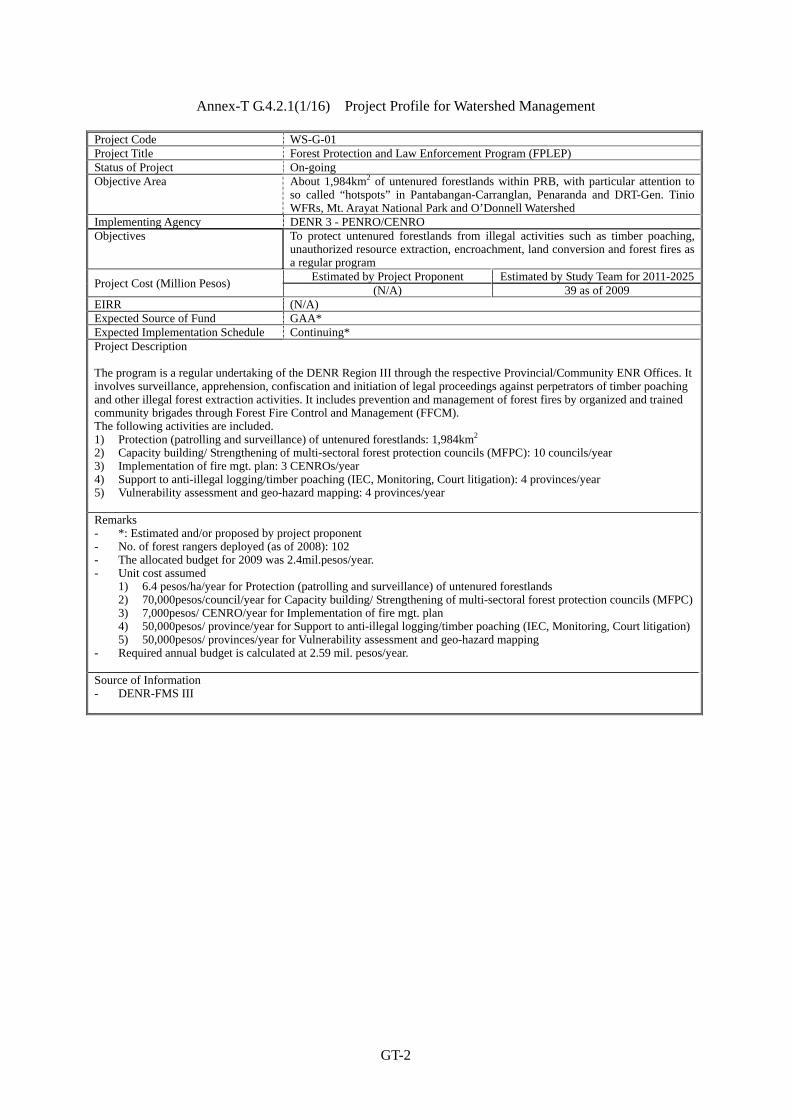
GT-2
Annex-T G.4.2.1(1/16) Project Profile for Watershed Management
Project Code WS-G-01Project Title Forest Protection and Law Enforcement Program (FPLEP) Status of Project On-goingObjective Area About 1,984km2 of untenured forestlands within PRB, with particular attention to
so called “hotspots” in Pantabangan-Carranglan, Penaranda and DRT-Gen. Tinio WFRs, Mt. Arayat National Park and O’Donnell Watershed
Implementing Agency DENR 3 - PENRO/CENROObjectives To protect untenured forestlands from illegal activities such as timber poaching,
unauthorized resource extraction, encroachment, land conversion and forest fires as a regular program
Project Cost (Million Pesos) Estimated by Project Proponent Estimated by Study Team for 2011-2025
(N/A) 39 as of 2009 EIRR (N/A) Expected Source of Fund GAA* Expected Implementation Schedule Continuing*Project Description The program is a regular undertaking of the DENR Region III through the respective Provincial/Community ENR Offices. It involves surveillance, apprehension, confiscation and initiation of legal proceedings against perpetrators of timber poaching and other illegal forest extraction activities. It includes prevention and management of forest fires by organized and trained community brigades through Forest Fire Control and Management (FFCM). The following activities are included. 1) Protection (patrolling and surveillance) of untenured forestlands: 1,984km2 2) Capacity building/ Strengthening of multi-sectoral forest protection councils (MFPC): 10 councils/year 3) Implementation of fire mgt. plan: 3 CENROs/year 4) Support to anti-illegal logging/timber poaching (IEC, Monitoring, Court litigation): 4 provinces/year 5) Vulnerability assessment and geo-hazard mapping: 4 provinces/year
Remarks - *: Estimated and/or proposed by project proponent - No. of forest rangers deployed (as of 2008): 102 - The allocated budget for 2009 was 2.4mil.pesos/year. - Unit cost assumed
1) 6.4 pesos/ha/year for Protection (patrolling and surveillance) of untenured forestlands 2) 70,000pesos/council/year for Capacity building/ Strengthening of multi-sectoral forest protection councils (MFPC)3) 7,000pesos/ CENRO/year for Implementation of fire mgt. plan 4) 50,000pesos/ province/year for Support to anti-illegal logging/timber poaching (IEC, Monitoring, Court litigation)5) 50,000pesos/ provinces/year for Vulnerability assessment and geo-hazard mapping
- Required annual budget is calculated at 2.59 mil. pesos/year.
Source of Information - DENR-FMS III

GT-3
Annex-T G.4.2.1(2/16) Project Profile for Watershed Management
Project Code WS-G-02Project Title Community Based Forest Management Program (CBFMP) Status of Project On-goingObjective Area 20.24 km2 of forestlands in Pampanga (Angeles City, Arayat, Magalang, Porac);
Bulacan (DRT); and N. Ecija (Bongabon, Carrangalan. Gabaldon, Gen. Tinio, Laur, Llanera, Lupao, Pantabangan, Rizal, San Jose City), which are under active Community-based Forest Management Agreement (CBFMA) tenure.
Implementing Agency DENR- FMS 3 - RCBFMOObjectives Sustainable forest management through granting of 25-year renewable tenurial
rights and authority to organized forest occupants to manage, develop, protect and utilize forest resources as a regular program
Project Cost (Million Pesos) Estimated by Project Proponent Estimated by Study Team for 2011-2025
(N/A) 71 as of 2009 EIRR (N/A) Expected Source of Fund GAA* Expected Implementation Schedule 1999- Continuing*Project Description The CBFM program is the national forestry program formulated in 1995, and adopted as the nationwide strategy for sustainable forest management pursuant to EO 318 of 2004. The activities include: (i) reforestation (675ha), (ii) agro-forestry (1,349ha), (iii) forest protection (2,024ha), and (iv) livelihood development. The livelihood development is anchored on agro-forestry, which provides additional income sources from fruit bearing trees along with the production of forestry seedlings, cash crops (such as vegetables, ginger, coffee, pineapple and cassava), livestock, poultry, freshwater fish culture, etc. Remarks - *: Estimated and/or proposed by project proponent - Tenured Area: 18,150 ha (Tenured area will continue to increase over time as the DENR continues to evaluate and
approve applications for CBFMA under the program.) - Actual area planted as of 2009: 1,310 ha in 10 years - Number of Beneficiaries: 40 POs; 3,020 households - Unit cost assumed
1) 13,500 pesos/ha for reforestation 2) 28,000 pesos/ha for agro-forestry 3) 2,100 pesos/ha for forest protection 4) 490,000 pesos/year for livelihood development
- Required annual budget is calculated at 4.71 mil. pesos/year. Source of Information - DENR-FMS III- CBFM Office

GT-4
Annex-T G.4.2.1(3/16) Project Profile for Watershed Management
Project Code WS-G-03Project Title Integrated Agro-forestry Development Program (IAFDP or CBFM-CARP) Status of Project On-goingObjective Area 779 ha in Bongabon, N. Ecija and Norzagaray, BulacanImplementing Agency DENR III- FMS (RCBFMO) in partnership with DARObjectives To adopt sustainable upland agricultural production through agro-forestry using
CBFM approach, in areas occupied by agrarian reform communities
Project Cost (Million Pesos) Estimated by Project Proponent Estimated by Study Team for 2011-2025
(N/A) 31 as of 2009 EIRR (N/A) Expected Source of Fund Dept. of Agrarian Reform (DAR)*Expected Implementation Schedule 2007- 2015*Project Description The IAFD program is a special CBFM program for upland agrarian reform beneficiaries under the Comprehensive Agrarian Reform Program (CARP). It is being undertaken by the DENR through a Memorandum of Understanding with the Department of Agrarian Reform (DAR). The DAR provides funding support for agro-forestry and livelihood development while the DENR provides technical assistance to the POs. The following activities are included. 1) Agro-forestry: 779ha 2) Forest protection: 779ha 3) Relocation survey, mapping & monitoring: 779ha 4) Organizational development and stakeholder capability building, Sustenance of livelihood projects, Technical support Remarks - *: Estimated and/or proposed by project proponent - Tenured Area : 1,297 ha (CBFM-CARP) in N. Ecija and Bulacan - Actual Area Planted (as of 2008): 520 ha in 2 years - Number of Beneficiaries: 2 POs; 79 households - Unit cost assumed
1) 28,000 pesos/ha for agro-forestry 2) 1,500 pesos/ha for forest protection 3) 2,500 pesos/ha for relocation survey, mapping & monitoring 4) 230,000 pesos/year for other activities
- Required annual budget is calculated at 6.15 mil. pesos/year. Source of Information: - DENR-FMS III-CBFM Office

GT-5
Annex-T G.4.2.1(4/16) Project Profile for Watershed Management
Project Code WS-G-04Project Title Coastal Resource Management Program (CRMP)Status of Project On-goingObjective Area 774 ha of mangrove areas in Pampanga and BulacanImplementing Agency DENR - PAWZCMSObjectives To reforest and rehabilitate coastal/mangrove areas as a regular program
Project Cost (Million Pesos) Estimated by Project Proponent Estimated by Study Team for 2011-2025
(N/A) 37 as of 2009 EIRR (N/A) Expected Source of Fund GAA* Expected Implementation Schedule Continuing*Project Description Through this program, the DENR-PAWCZMS-CMMD will continue to reforest logged over mangrove areas and protect old-growth mangrove forests within the coast of Bulacan and Pampanga. This lends support to the initiative of the Operational Plan of the Manila Bay Coastal Strategy which aims to conserve critical marine habitats and biodiversity within Manila Bay while providing alternative livelihood to fisher folks. The program also involves participatory coastal resource assessment, mapping, updating of municipal coastal resource database and formulation and implementation of Coastal Zone and Sea Use Plans. The following activities are included. 1) Mangrove reestablishment/rehabilitation of swamp areas (nursery establishment, reforestation, silviculture): 539ha 2) Protection and maintenance of remaining old-growth mangrove forests: 235ha 3) Protection and maintenance of newly established mangrove plantations: 539ha 4) Participatory coastal resource assessment & Preparation and implementation of coastal resource mgt. plans,
establishment of coastal and marine sanctuaries, monitoring, law enforcement and policy support, including Organizational development: community organization, capacity development, IEC: 6 municipalities
5) Technical support Remarks - *: Estimated and/or proposed by project proponent - Area reforested (as of 2008): 85 ha newly planted in 4 years - Area protected: 170 ha of old-growth mangrove forests in 4 years - Unit cost assumed
1) 33,000 pesos/ha for mangrove reestablishment/rehabilitation 2) 5,300 pesos/ha for protection and maintenance of remaining old-growth mangrove forests 3) 1,500 pesos/ha for protection and maintenance of newly established mangrove plantations 4) 265,000 pesos/year for participatory coastal resource assessment, etc. 5) 310,000 pesos/year for technical support
- Required annual budget is calculated at 2.45mil. pesos/year. Source of Information - DENR-PAWCZMS, 2008/2009.

GT-6
Annex-T G.4.2.1(5/16) Project Profile for Watershed Management
Project Code WS-G-05Project Title Protected Area Community Based Resource Management Program (PACBRMP)Status of Project On-goingObjective Area 168 ha of tenured and untenured areas within priority protected areas in N.Ecija,
Pampanga and Bulacan, subject to the issuance of PACBRMA Implementing Agency DENR - PAWZCMSObjectives Sustainable forest management which grants occupants of protected areas 25 year s
of tenure rights and authority to manage, develop, protect and utilize forest resources within allowable zones of the protected forests by virtue of the issuance of PACBRMA(a regular program)
Project Cost (Million Pesos) Estimated by Project Proponent Estimated by Study Team for 2011-2025
(N/A) 13 as of 2009 EIRR (N/A) Expected Source of Fund GAA* Expected Implementation Schedule 1999- Continuing*Project Description The program covers the buffer and multiple use zones of priority protected areas and some ancestral domains of indigenous communities. The main strategy is CBFM with timber establishment in 56ha and agro-forestry in 112ha. It is expected to provide alternative sources of income to IPs through agro-forestry. The following activities are included. 1) Forest plantation development and management (nursery establishment, enrichment planting, ANR, silviculture): 56ha 2) Agro-forestry development (nursery establishment, agro-forestry, crop production: 112ha 3) Protection of old timber stands and newly established plantation: 168ha 4) Relocation survey, mapping & monitoring: 168ha 5) Organizational development, livelihood development, technical support Remarks - *: Estimated and/or proposed by project proponent - Tenured Area: 50 ha, which is part an ancestral domain claim in Mt. Arayat, Pampanga - One PO with 107 household-members benefited - Unit cost assumed
1) 13,500 pesos/ha for Forest plantation 2) 28,000 pesos/ha for agro-forestry 3) 1,500 pesos/ha for protection of old timber stands and newly established plantation 4) 600 pesos/ha for relocation survey, mapping & monitoring 5) 490,000 pesos/year for other activities
- Required annual budget is calculated at 0.84 mil. pesos/year.
Source of Information - DENR - PAWZCMS-CMMD III, 2008/2009.

GT-7
Annex-T G.4.2.1(6/16) Project Profile for Watershed Management
Project Code WS-G-06Project Title Private Forest Plantation Development Program (PFPDP) Status of Project On-goingObjective Area 1,865ha in Pampanga (Porac); Bulacan (DRT, San Miguel) ; and N.Ecija (Laur,
Gabaldon, Gen. Tinio, San Jose, Palyan City, Bongabon) that are covered by various private forest lease agreements with commercial timber plantation companies and private individuals
Implementing Agency DENR-FRCDObjectives Sustainable forest management through granting of tenurial rights and authority to
organized forest occupants to manage, develop, protect and utilize forest resources as a regular program
Project Cost (Million Pesos) Estimated by Project Proponent Estimated by Study Team for 2011-2025
(N/A) 93 as of 2009 EIRR (N/A) Expected Source of Fund (N/A) Expected Implementation Schedule 1982- Continuing*Project Description Private forest plantation development is covered by various forms of forest lease contracts and management agreements with private companies or individuals, such as IFMA, SIFMA, AFFLA, PFDA, TFLA and FLGMA. The concessionaires plant commercial species of timber and derive their income from harvested tree stands. The DENR regulates the volume of timber extraction in accordance with the annual allowable cut (ACC) specified in the lease agreement. The following activities are included. 1) Tree plantation development (nursery establishment, timber plantation establishment, agro-forestry: 1,865ha 2) Maintenance of newly established plantations and protection of natural forests/buffer strips: 1,865ha 3) Relocation survey, mapping & monitoring: 1,865ha 4) Monitoring, regulation and capability building, technical support Remarks - *: Estimated and/or proposed by project proponent - Tenured Area: 15,539ha of production forests covered by various private forms of forest lease agreements - Actual Area Planted (as of 2008): 2,917 ha in 26years - Unit cost assumed
1) 30,000 pesos/ha for tree plantation development 2) 3,000 pesos/ha for maintenance of newly established plantations and protection of natural forests/buffer strips 3) 5,000 pesos/ha for relocation survey, mapping & assessment 4) 1,000,000 pesos/year for other activities
- Required annual budget is calculated at 6.21 mil. pesos/year.
Source of Information - DENR-FMS III – FRDD

GT-8
Annex-T G.4.2.1(7/16) Project Profile for Watershed Management
Project Code WS-G-07Project Title NIA-UPRIIS’s Watershed Management ProgramStatus of Project On-going Objective Area Protection: 10,356 ha of the Pantabangan-Carranglan Watershed Forest Reserve
(WFR) under NIA-UPRIIS management; Reforestation: 1500 ha surrounding Masiway Dam
Implementing Agency NIA-UPRIISObjectives To protect, manage, maintain and/or rehabilitate 10,356 ha of the established forests
and agro-forestry plantations in Pantabangan-Carranglan Watershed Forest Reserve (WFR); Specifically, to rehabilitate 100 ha of denuded forests around Masiway Dam as a regular program
Project Cost (Million Pesos) Estimated by Project Proponent Estimated by Study Team for 2011-2025
(N/A) 180 as of 2009 EIRR (N/A) Expected Source of Fund GAA with financial assistance from EDC *Expected Implementation Schedule 1997- Continuing*Project Description The NIA-UPRIIS co-manages (with the DENR) and derives earnings from the established agro-forestry areas with organized POs and cooperatives within the 10,356 ha of Pantabangan-Carranglan WFR. Recently, the NIA-UPRIIS started to rehabilitate and reforest an initial 100 ha of Pantabangan-Masiway watersheds jointly with the Energy Development Corporation. EDC operates the Masiway dam for hydroelectric power generation. Reforestation efforts will be sustained until 2025. Under this joint management arrangement, EDC provides funds and technical assistance in the propagation and use of indigenous species to reforest the denuded areas surrounding the dam. The NIA helps create additional income sources by hiring locals in contract reforestation. The following activities are included. 1) Protection (patrolling, surveillance, monitoring, fire management): 10,356ha 2) Plantation Development (nursery establishment, reforestation, agro-forestry): 1,500ha 3) Maintenance of newly established plantations: 1,500ha 4) Road grading, infra support etc., Maintenance works, Organizational development and stakeholder capability building,
Sustenance of livelihood project, Technical support Remarks - *: Estimated and/or proposed by project proponent - Management Area: 10,356 ha of Pantabangan-Carranglan WFR per LOI No. 1002 issued on March 1980 and
subsequent joint Memorandu of Agreement with the NPC - 100 ha of Pantabangan watershed around Masiway dam for rehabilitation under joint management with EDC - Unit cost assumed
1) 500 pesos/ha for protection 2) 28,000 pesos/ha for plantation development 3) 2,500 pesos/ha for maintenance of newly established plantation 4) 2,000,000 pesos/year for other activities
- Required annual budget is calculated at 11.98 mil. pesos/year.
Source of Information - NIA-UPRIIS, 2009
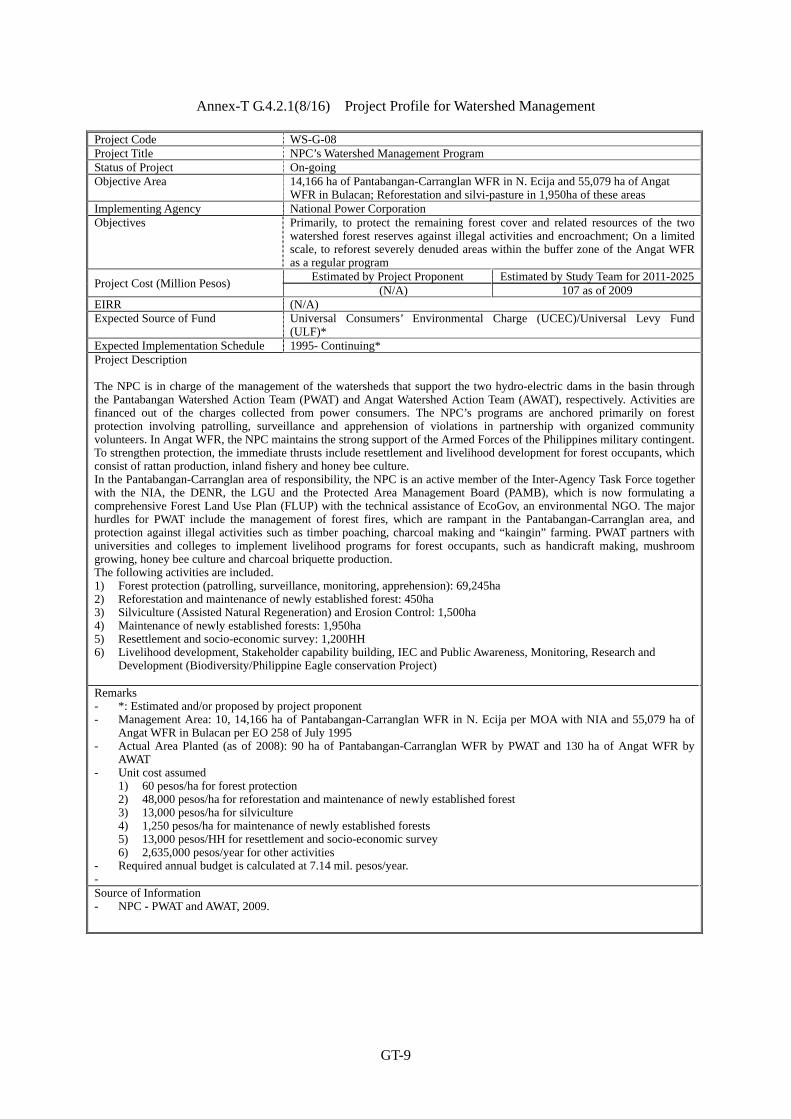
GT-9
Annex-T G.4.2.1(8/16) Project Profile for Watershed Management
Project Code WS-G-08Project Title NPC’s Watershed Management ProgramStatus of Project On-goingObjective Area 14,166 ha of Pantabangan-Carranglan WFR in N. Ecija and 55,079 ha of Angat
WFR in Bulacan; Reforestation and silvi-pasture in 1,950ha of these areas Implementing Agency National Power CorporationObjectives Primarily, to protect the remaining forest cover and related resources of the two
watershed forest reserves against illegal activities and encroachment; On a limited scale, to reforest severely denuded areas within the buffer zone of the Angat WFR as a regular program
Project Cost (Million Pesos) Estimated by Project Proponent Estimated by Study Team for 2011-2025
(N/A) 107 as of 2009 EIRR (N/A) Expected Source of Fund Universal Consumers’ Environmental Charge (UCEC)/Universal Levy Fund
(ULF)* Expected Implementation Schedule 1995- Continuing*Project Description The NPC is in charge of the management of the watersheds that support the two hydro-electric dams in the basin through the Pantabangan Watershed Action Team (PWAT) and Angat Watershed Action Team (AWAT), respectively. Activities are financed out of the charges collected from power consumers. The NPC’s programs are anchored primarily on forest protection involving patrolling, surveillance and apprehension of violations in partnership with organized community volunteers. In Angat WFR, the NPC maintains the strong support of the Armed Forces of the Philippines military contingent. To strengthen protection, the immediate thrusts include resettlement and livelihood development for forest occupants, which consist of rattan production, inland fishery and honey bee culture. In the Pantabangan-Carranglan area of responsibility, the NPC is an active member of the Inter-Agency Task Force together with the NIA, the DENR, the LGU and the Protected Area Management Board (PAMB), which is now formulating a comprehensive Forest Land Use Plan (FLUP) with the technical assistance of EcoGov, an environmental NGO. The major hurdles for PWAT include the management of forest fires, which are rampant in the Pantabangan-Carranglan area, and protection against illegal activities such as timber poaching, charcoal making and “kaingin” farming. PWAT partners with universities and colleges to implement livelihood programs for forest occupants, such as handicraft making, mushroom growing, honey bee culture and charcoal briquette production. The following activities are included. 1) Forest protection (patrolling, surveillance, monitoring, apprehension): 69,245ha 2) Reforestation and maintenance of newly established forest: 450ha 3) Silviculture (Assisted Natural Regeneration) and Erosion Control: 1,500ha 4) Maintenance of newly established forests: 1,950ha 5) Resettlement and socio-economic survey: 1,200HH 6) Livelihood development, Stakeholder capability building, IEC and Public Awareness, Monitoring, Research and
Development (Biodiversity/Philippine Eagle conservation Project) Remarks - *: Estimated and/or proposed by project proponent - Management Area: 10, 14,166 ha of Pantabangan-Carranglan WFR in N. Ecija per MOA with NIA and 55,079 ha of
Angat WFR in Bulacan per EO 258 of July 1995 - Actual Area Planted (as of 2008): 90 ha of Pantabangan-Carranglan WFR by PWAT and 130 ha of Angat WFR by
AWAT - Unit cost assumed
1) 60 pesos/ha for forest protection 2) 48,000 pesos/ha for reforestation and maintenance of newly established forest 3) 13,000 pesos/ha for silviculture 4) 1,250 pesos/ha for maintenance of newly established forests 5) 13,000 pesos/HH for resettlement and socio-economic survey 6) 2,635,000 pesos/year for other activities
- Required annual budget is calculated at 7.14 mil. pesos/year. - Source of Information - NPC - PWAT and AWAT, 2009.
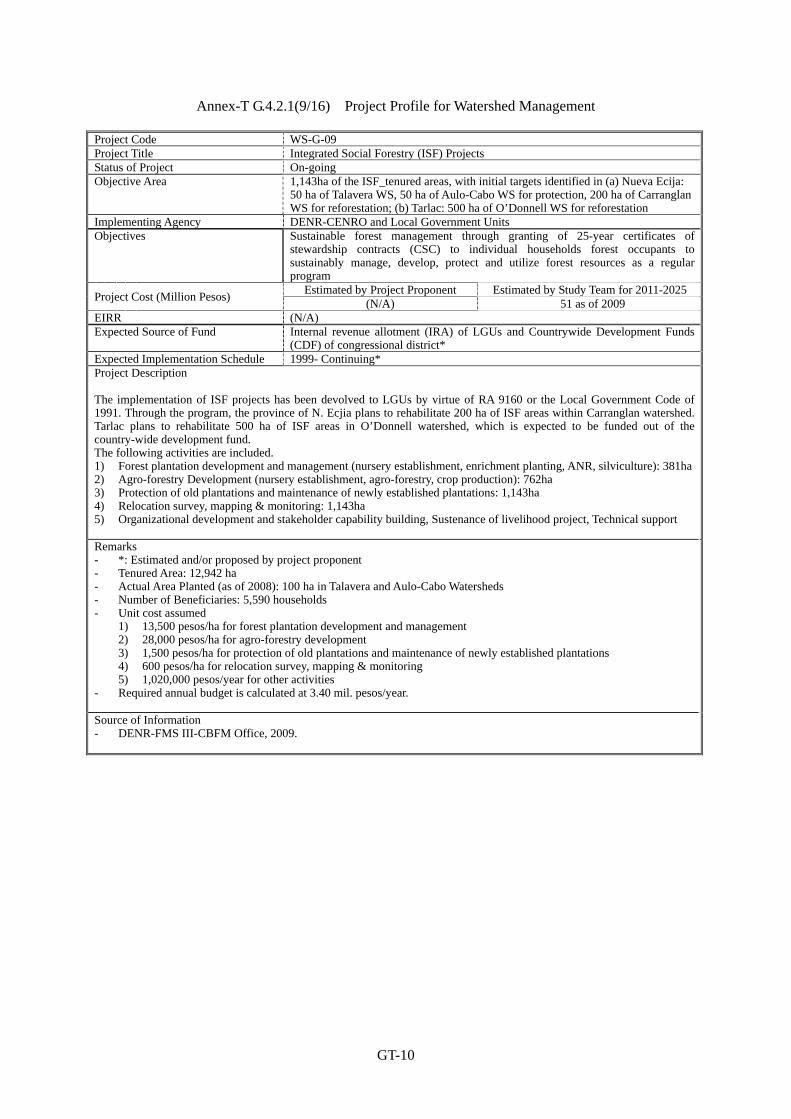
GT-10
Annex-T G.4.2.1(9/16) Project Profile for Watershed Management
Project Code WS-G-09Project Title Integrated Social Forestry (ISF) ProjectsStatus of Project On-goingObjective Area 1,143ha of the ISF_tenured areas, with initial targets identified in (a) Nueva Ecija:
50 ha of Talavera WS, 50 ha of Aulo-Cabo WS for protection, 200 ha of Carranglan WS for reforestation; (b) Tarlac: 500 ha of O’Donnell WS for reforestation
Implementing Agency DENR-CENRO and Local Government UnitsObjectives Sustainable forest management through granting of 25-year certificates of
stewardship contracts (CSC) to individual households forest occupants to sustainably manage, develop, protect and utilize forest resources as a regular program
Project Cost (Million Pesos) Estimated by Project Proponent Estimated by Study Team for 2011-2025
(N/A) 51 as of 2009 EIRR (N/A) Expected Source of Fund Internal revenue allotment (IRA) of LGUs and Countrywide Development Funds
(CDF) of congressional district*Expected Implementation Schedule 1999- Continuing*Project Description The implementation of ISF projects has been devolved to LGUs by virtue of RA 9160 or the Local Government Code of 1991. Through the program, the province of N. Ecjia plans to rehabilitate 200 ha of ISF areas within Carranglan watershed. Tarlac plans to rehabilitate 500 ha of ISF areas in O’Donnell watershed, which is expected to be funded out of the country-wide development fund. The following activities are included. 1) Forest plantation development and management (nursery establishment, enrichment planting, ANR, silviculture): 381ha2) Agro-forestry Development (nursery establishment, agro-forestry, crop production): 762ha 3) Protection of old plantations and maintenance of newly established plantations: 1,143ha 4) Relocation survey, mapping & monitoring: 1,143ha 5) Organizational development and stakeholder capability building, Sustenance of livelihood project, Technical support Remarks - *: Estimated and/or proposed by project proponent - Tenured Area: 12,942 ha - Actual Area Planted (as of 2008): 100 ha in Talavera and Aulo-Cabo Watersheds - Number of Beneficiaries: 5,590 households - Unit cost assumed
1) 13,500 pesos/ha for forest plantation development and management 2) 28,000 pesos/ha for agro-forestry development 3) 1,500 pesos/ha for protection of old plantations and maintenance of newly established plantations 4) 600 pesos/ha for relocation survey, mapping & monitoring 5) 1,020,000 pesos/year for other activities
- Required annual budget is calculated at 3.40 mil. pesos/year. Source of Information - DENR-FMS III-CBFM Office, 2009.
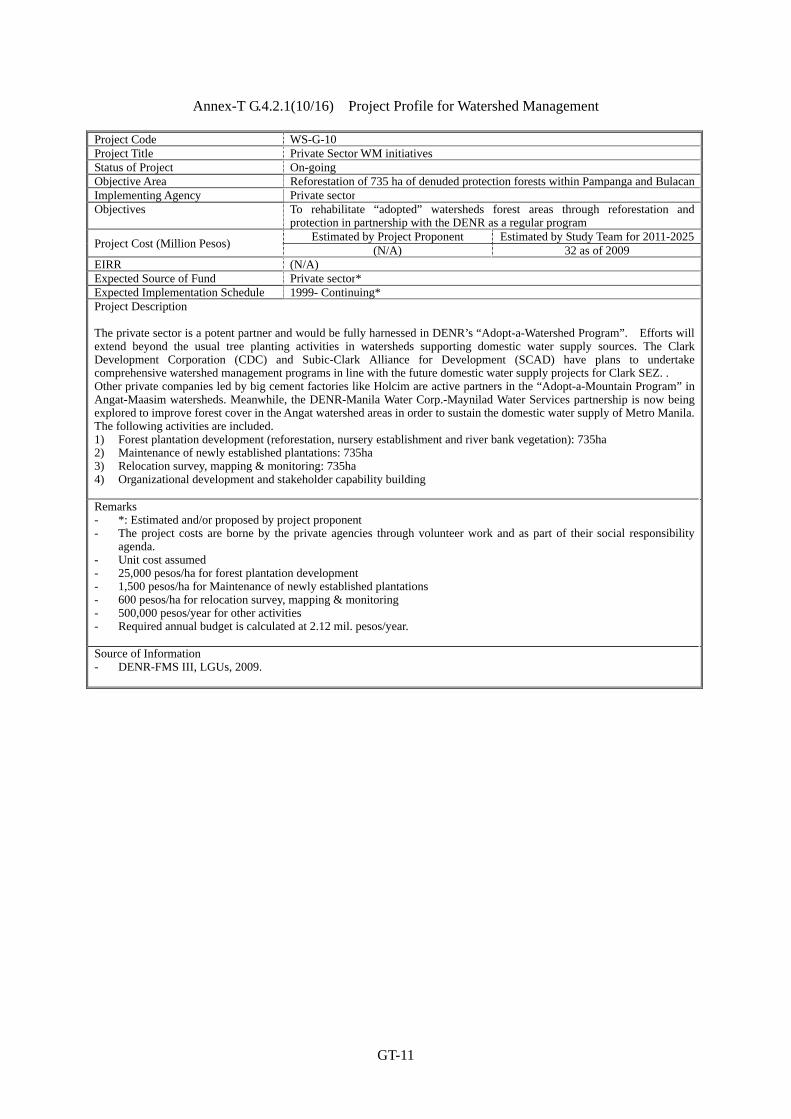
GT-11
Annex-T G.4.2.1(10/16) Project Profile for Watershed Management
Project Code WS-G-10Project Title Private Sector WM initiativesStatus of Project On-goingObjective Area Reforestation of 735 ha of denuded protection forests within Pampanga and BulacanImplementing Agency Private sectorObjectives To rehabilitate “adopted” watersheds forest areas through reforestation and
protection in partnership with the DENR as a regular program
Project Cost (Million Pesos) Estimated by Project Proponent Estimated by Study Team for 2011-2025
(N/A) 32 as of 2009 EIRR (N/A) Expected Source of Fund Private sector*Expected Implementation Schedule 1999- Continuing*Project Description The private sector is a potent partner and would be fully harnessed in DENR’s “Adopt-a-Watershed Program”. Efforts will extend beyond the usual tree planting activities in watersheds supporting domestic water supply sources. The Clark Development Corporation (CDC) and Subic-Clark Alliance for Development (SCAD) have plans to undertake comprehensive watershed management programs in line with the future domestic water supply projects for Clark SEZ. . Other private companies led by big cement factories like Holcim are active partners in the “Adopt-a-Mountain Program” in Angat-Maasim watersheds. Meanwhile, the DENR-Manila Water Corp.-Maynilad Water Services partnership is now being explored to improve forest cover in the Angat watershed areas in order to sustain the domestic water supply of Metro Manila.The following activities are included. 1) Forest plantation development (reforestation, nursery establishment and river bank vegetation): 735ha 2) Maintenance of newly established plantations: 735ha 3) Relocation survey, mapping & monitoring: 735ha 4) Organizational development and stakeholder capability building
Remarks - *: Estimated and/or proposed by project proponent - The project costs are borne by the private agencies through volunteer work and as part of their social responsibility
agenda. - Unit cost assumed - 25,000 pesos/ha for forest plantation development - 1,500 pesos/ha for Maintenance of newly established plantations - 600 pesos/ha for relocation survey, mapping & monitoring - 500,000 pesos/year for other activities - Required annual budget is calculated at 2.12 mil. pesos/year. Source of Information - DENR-FMS III, LGUs, 2009.

GT-12
Annex-T G.4.2.1(11/16) Project Profile for Watershed Management
Project Code WS-G-11Project Title Forest Mgt. Program (FMP)Status of Project On-goingObjective Area 44,600ha Pantabangan-Carranglan and Talavera Watersheds, with 14,133 ha
earmarked for reforestation and agroforestry.Implementing Agency DENR-FASPOObjectives To strengthen forest management in partnership with the LGUs and the
communities and to improve the economic conditions of upland dwellers through sustainable resource utilization.
Project Cost (Million Pesos) Estimated by Project Proponent Estimated by Study Team for 2011-2025
5,870.64 as of 2009 996 as of 2009 EIRR 20.9%* Expected Source of Fund JICA Loan*Expected Implementation Schedule 2011-2020*Project Description FMP is a 10-year JICA-assisted project in the pipeline and targeted for implementation in 2011. It covers three critical river basins in the country, namely, Upper Magat-Cagayan River Basin in Region II, Jalaur River Basin in Iloilo and Upper Pamapanga River Basin. The latter includes 44,600 ha, all of which are inside the study area. The project components include: (i) physical survey and mapping and socio-economic baseline profiling; (ii) PO formation and CBFMA acquisition; (iii) PO capacity building; (iv) forest tree plantation, silvi-pasture and agro-forestry with bio-fuel and soil conservation measures; (v) infrastructure support such as farm-to-market roads, bridges, and pipeline irrigation system for agro-forestry; (vi) policy initiative (including establishment of cost sharing mechanism and payment for environmental services); and (vii) monitoring and evaluation. The total area covered by forest plantation development in Upper Pampamga river basin is 14,133ha. It is assumed that 30% of the area is covered by reforestation and the rest is covered by agro-forestry. Remarks - *: Estimated and/or proposed by project proponent - As of August 2010, the project has been approved by the NEDA-ICC’s Technical Board. - The estimated project cost by project proponent is for entire project. - The estimated cost by Study Team is only for Upper Pampanga river basin. Source of Information - DENR-FASPO, 2009.

GT-13
Annex-T G.4.2.1(12/16) Project Profile for Watershed Management
Project Code WS-G-12Project Title Pampanga River Basin Rehabilitation Program (PRBRP) Status of Project On-goingObjective Area Protection and maintenance of 500ha out of the newly established areas (2,000 ha)
in Pampanga, Bulacan, N. Ecija and TarlacImplementing Agency DENR-FMS 3 - FRCDObjectives Protection and maintenance of remaining newly established reforestation stands as
part of the uncompleted works under the PRRB
Project Cost (Million Pesos) Estimated by Project Proponent Estimated by Study Team for 2011-2025
12 as of 2009 12 as of 2009 EIRR (N/A) Expected Source of Fund GAA* Expected Implementation Schedule 1999- Continuing*Project Description The PRBRP is a special project undertaken by the DENR-FMS 3 from 2004 to 2008 in response to the spate of flood events in the basin. It was temporarily shelved in 2009 due to budget constraints. The accomplishments involved reforestation of 4,900 and maintenance and protection of 2,900ha of newly established plantations within the forestlands in Pampanga, N. Ecija, Bulacan and Tarlac. The PRBP utilized the CBFM beneficiaries who were contracted to undertake the reforestation or planting activities while DENR provides technical and financial assistance. For the year 2010-2012, the project will be resumed in order to carry out remaining maintenance and protection activities involving a backlog of 500 ha out of 2,000 ha of newly established tree plantations. Remarks - *: Estimated and/or proposed by project proponent - Undertaken through contract reforestation scheme
Source of Information - DENR-FMS III- FRCD, 2009.

GT-14
Annex-T G.4.2.1(13/16) Project Profile for Watershed Management
Project Code WS-C-01Project Title Upland Development Program (UDP)Status of Project ConceptualObjective Area 10,505 ha of severely eroded areas and areas of watersheds supporting O’Donnell
and Porac-Gumain national irrigation systems (NIS) that are not yet covered by any on-going or proposed watershed rehabilitation program
Implementing Agency DA-Bureau of Soils and Water Management/NIA/DENR/LGUs Objectives Sustainable upland agricultural production geared at rehabilitating forest cover,
arresting soil erosion and improving water conservation through agro-forestry with the introduction of appropriate diversified farming systems and sloping agricultural land technology.
Project Cost (Million Pesos) Estimated by Project Proponent Estimated by Study Team for 2011-2025
(N/A) 980 as of 2009 EIRR (N/A) Expected Source of Fund (N/A) Expected Implementation Schedule (N/A) Project Description The original model of the Upland Development Program was implemented by the Department of Agriculture (DA) in Mindanao. It aimed to address upland poverty by replacing the widespread practice of slash and burn (“kaingin”) system with sustainable alternative farm management systems. The concept of this model UDP is sustainable upland agricultural production using appropriate soil and water conservation strategies such as Sloping Agricultural Technology (SALT) and its variants in integrated or diversified farming systems anchored on agro-forestry. It gained wide acceptance and proved successful among upland farmers in Mindanao.
The UDP is conceived as one of the better options for heavily eroded areas with critical (30% or more) slopes and watershed areas supporting other NIS where any form of management is lacking and where severe soil erosion is a cause for concern. In the basin, the potential severe erosion areas comprise some 22,114 ha while watershed areas supporting other NIS (O’Donnell and Porac-Gumain WS) which are not under any management scheme comprise some 60,826 ha. Only 20% of the former and 10% of the latter, which is 10,505ha in total, are targeted for this project until 2025. Remarks - 93,230pesos/ha is assumed for the cost estimation, referring the project cost of UDP in Southern Mindanao
( €18.3million covering 16,000 ha)
Required Action to Upgrade to a Proposed Project for Implementation- F/S level study would be required.
Source of Information - DA-UDP. 2004

GT-15
Annex-T G.4.2.1(14/16) Project Profile for Watershed Management
Project Code WS-C-02Project Title Protected Area Mgt. Program (PAMP)Status of Project ConceptualObjective Area 56,147 ha, which comprise the most critical of the initial components of the NIPAS
(protected areas) in terms of conservation of biodiversity, unique ecosystem and cultural heritage, namely: (i) Biak Na Bato NP, (ii) Minalungao NP; (iii) LT: DRT-Gen. Tinio WS; (iv) Mt. Arayat NP, and (v) Talavera Watershed Reserve.
Implementing Agency DENR-PAWCZMSObjectives To formally declare and manage these areas as NIPAS sites through congressional
and executive legislation and establishment of appropriate management mechanisms
Project Cost (Million Pesos) Estimated by Project Proponent Estimated by Study Team for 2011-2025
(N/A) 404 as of 2009 EIRR (N/A) Expected Source of Fund (N/A) Expected Implementation Schedule (N/A) Project Description The activities will include: - watershed characterization (basic resource inventory, assessment and mapping; socio-economic surveys); - designation and ground delineation of management zones; - policy and institutional support initiation though organization of PAMBs and establishment of IPAF; - formulation of Protected Area Management Plans and harmonization with ancestral domain plans, forest land use plans
and comprehensive land use plans to address conflicting land use issues - mechanisms to streamline compliance with FPIC requirements in ancestral domain areas - initial implementation of priority action plans:
community-based reforestation through assisted natural regeneration in 5,615ha of degraded forests biodiversity and wildlife conservation alternative livelihood for forest occupant IEC campaigns
Remarks - It is assumed that 33,000peso/ha is required for community-based reforestation. - It is estimated that 124mil.pesos is required for other activities. - It is assumed that 30% of the project cost is required for project management and TA. Required Action to Upgrade to a Proposed Project for Implementation- Basic project components as well as TOR for T.A. should be determined. Source of Information - DENR-PAWCZMD, 2009.
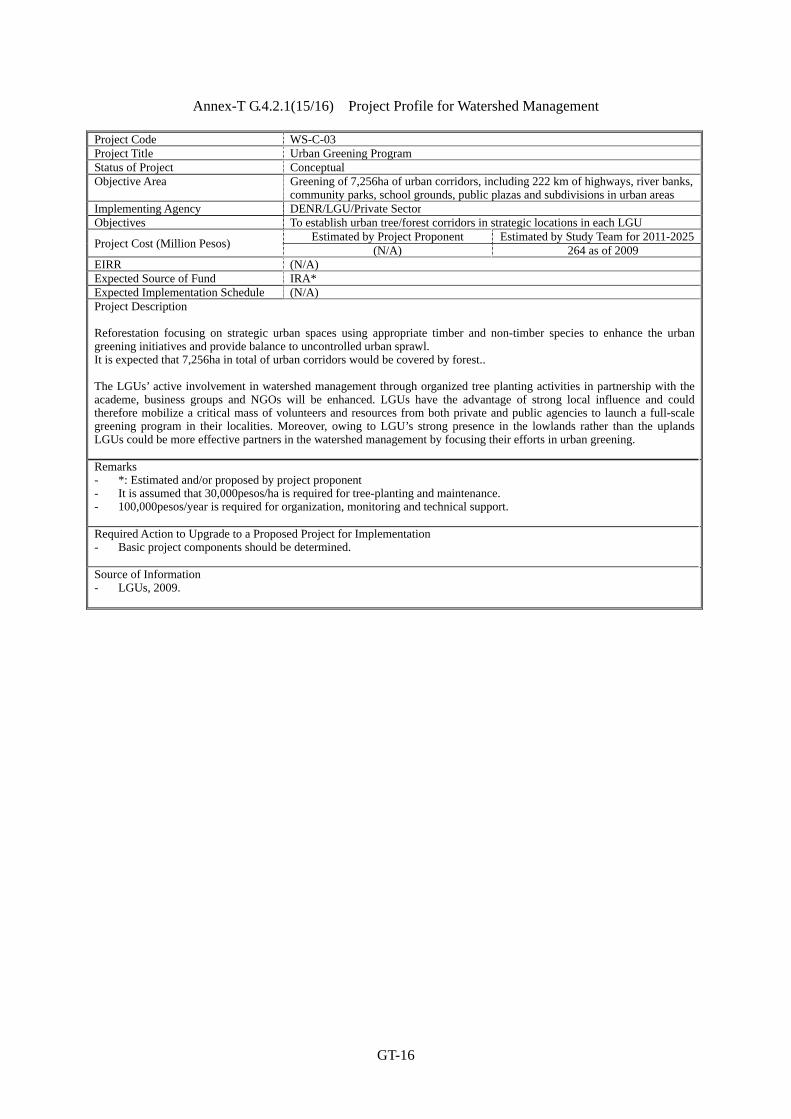
GT-16
Annex-T G.4.2.1(15/16) Project Profile for Watershed Management
Project Code WS-C-03Project Title Urban Greening ProgramStatus of Project ConceptualObjective Area Greening of 7,256ha of urban corridors, including 222 km of highways, river banks,
community parks, school grounds, public plazas and subdivisions in urban areasImplementing Agency DENR/LGU/Private SectorObjectives To establish urban tree/forest corridors in strategic locations in each LGU
Project Cost (Million Pesos) Estimated by Project Proponent Estimated by Study Team for 2011-2025
(N/A) 264 as of 2009 EIRR (N/A) Expected Source of Fund IRA* Expected Implementation Schedule (N/A) Project Description Reforestation focusing on strategic urban spaces using appropriate timber and non-timber species to enhance the urban greening initiatives and provide balance to uncontrolled urban sprawl. It is expected that 7,256ha in total of urban corridors would be covered by forest.. The LGUs’ active involvement in watershed management through organized tree planting activities in partnership with the academe, business groups and NGOs will be enhanced. LGUs have the advantage of strong local influence and could therefore mobilize a critical mass of volunteers and resources from both private and public agencies to launch a full-scale greening program in their localities. Moreover, owing to LGU’s strong presence in the lowlands rather than the uplands LGUs could be more effective partners in the watershed management by focusing their efforts in urban greening. Remarks - *: Estimated and/or proposed by project proponent - It is assumed that 30,000pesos/ha is required for tree-planting and maintenance. - 100,000pesos/year is required for organization, monitoring and technical support. Required Action to Upgrade to a Proposed Project for Implementation- Basic project components should be determined. Source of Information - LGUs, 2009.

GT-17
Annex-T G.4.2.1(16/16) Project Profile for Watershed Management
Project Code WS-C-04Project Title Community-based Eco-Tourism ProgramStatus of Project ConceptualObjective Area 10,984ha within Candaba Sawamp, Pantabangan-Carranglan WFR, and
Biak-na-Bato National Park (These areas contain critical habitats and biodiversity that presents a high potential for eco-tourism development.)
Implementing Agency Department of Tourism, Local Government Units and private sector Objectives To generate additional income for communities through eco-tourism while
contributing resources and sustaining public support for the protection and conservation of critical habitats and natural ecosystems
Project Cost (Million Pesos) Estimated by Project Proponent Estimated by Study Team for 2011-2025
(N/A) 264 as of 2009 EIRR (N/A) Expected Source of Fund (N/A) Expected Implementation Schedule (N/A) Project Description Candaba Swamp, Pantabangan-Carranglan WFR and Biak-na-Bato National Park are among the emerging and key potential ecotourism sites identified by the National Ecotourism Steering Committee. As such these areas are already enjoying tourist patronage on a limited scale, but there is room for improving the facilities and services to improve tourist traffic. Eco-tourism thrives on the principle of regulated public access during particular seasons of the year, when for example, migratory birds and other important species could be the focus of tourist attraction to support conservation. Eco-tourism will sustain public interest and support to conservation and protection efforts. There is a huge potential for providing additional income to organized communities through low-impact guided tours, hostel and restaurant management, trekking and camping services, health and wellness services, sale of souvenir items and the like. At the same time, funds generated in part could be used to finance reforestation activities. About 1,098ha will be reforested in phases out of funds generated. Remarks - It is assumed that 30,000pesos/ha is required for initial reforestation. - It is estimated that 167mil. pesos is required for other activities. - It is assumed that 30% of the project cost is required for project management. Required Action to Upgrade to a Proposed Project for Implementation- F/S level study would be required. Source of Information - DOT, NEDA Region III, 2009.


Annex-Figures


GF-1
Annex-F G.2.1.1 Forest Cover in the Study Area

GF-2
Annex-F G.2.1.2 Land Classification and Forest Cover in the Study Area

GF-3
Annex-F G.4.2.1(1/4) Location of the projects for Watershed Management

GF-4
Annex-F G.4.2.1(2/4) Location of the projects for Watershed Management

GF-5
Annex-F G.4.2.1(3/4) Location of the projects for Watershed Management

GF-6
Annex-F G.4.2.1(4/4) Location of the projects for Watershed Management

GF-7
Annex-F G.4.2.2 Map of Severe Erosion Areas in the Basin


Sector H
Water Resources Development and Management


i
Sector H. Water Resources Development and Management
Table of Contents
Pages
H.1 Introduction ............................................................................................................................ H-1
H.2 Current Status of Water Resources Development, Allocation and Distribution in the
Study Area .......................................................................................................................... H-2
H.2.1 IWRM Plan Framework ........................................................................................ H-2 H.2.2 Overview on Present Water Resources Potential and Water Usage ...................... H-2
H.2.2.1 Water Resources Potential ......................................................................... H-2 H.2.2.2 Type of Water Use ..................................................................................... H-3 H.2.2.3 Present Water Use Permit .......................................................................... H-4 H.2.2.4 Overview of Present Water Demand ......................................................... H-6 H.2.2.5 Overview of Present Water Balance .......................................................... H-6
H.2.3 Water Resource Development Facilities ............................................................... H-7 H.2.3.1 Existing Large Storage Dams .................................................................... H-7 H.2.3.2 Proposed Large Storage Dams ................................................................... H-8 H.2.3.3 Possible Storage Dam Sites for Municipal Water Supply ......................... H-9
H.2.4 Hydropower Generation ...................................................................................... H-10 H.2.4.1 Overview in Energy Sector ...................................................................... H-10 H.2.4.2 Existing Hydropower Plants in the Study Area ....................................... H-11 H.2.4.3 Proposed Hydropower Plants .................................................................. H-13
H.2.5 Water Resources Development, Allocation and Distribution in Angat-Umiray System ................................................................................................................. H-13
H.2.5.1 General .................................................................................................... H-13 H.2.5.2 Angat-Umiray System ............................................................................. H-13 H.2.5.3 Water Shortage Condition in Angat-Umiray System ............................... H-14 H.2.5.4 Water Resources Potential in Angat-Umiray System .............................. H-15 H.2.5.5 Complicated Situation on Water Use Permit and Water Allocation ........ H-15 H.2.5.6 Diversion Water Requirement in AMRIS ................................................ H-17 H.2.5.7 Preliminary Comparison between Water Allocation and Water
Resources Potential ................................................................................. H-18 H.2.5.8 Evaluation of Present Reliability of Water Supply .................................. H-18 H.2.5.9 Preparation against Extreme Flood and Flood Control Function in
Angat Storage Dam ................................................................................. H-19 H.2.5.10 Hydropower Generation in Angat Hydropower Plant ............................. H-21 H.2.5.11 Future Municipal Water Supply and Demand in MWSS Service Area ... H-23 H.2.5.12 Expected Condition in Near Future ......................................................... H-25
H.3 Water Balance Study ............................................................................................................ H-27
H.3.1 Water Resources Potential .................................................................................. H-27 H.3.1.1 Surface Water Resources Potential .......................................................... H-27 H.3.1.2 Groundwater Resources Potential ........................................................... H-30
H.3.2 Water Demand Projection ................................................................................... H-33 H.3.2.1 General .................................................................................................... H-33 H.3.2.2 Municipal Water Demand ........................................................................ H-34

ii
H.3.2.3 Industrial Water Demand ......................................................................... H-35 H.3.2.4 Irrigation Water Demand ......................................................................... H-36 H.3.2.5 Other Water Demands .............................................................................. H-37 H.3.2.6 Minimum Stream Flow Requirement ...................................................... H-38 H.3.2.7 Summary of Whole Water Demand ......................................................... H-40
H.3.3 Water Demand – Supply Balance ....................................................................... H-41 H.3.3.1 Balance of Demand and Potential for Groundwater ................................ H-41 H.3.3.2 Water Balance for Surface Water ............................................................. H-42
H.4 Plan for Water Resources Development, Allocation and Distribution ............................. H-49
H.4.1 Problems and Issues on Water Resources Development, Allocation and Distribution ......................................................................................................... H-49
H.4.1.1 Sustainable Water Source for Municipal Water Supply ........................... H-49 H.4.1.2 Securing Necessary Water Sources for Expansion of Large Irrigation
System ..................................................................................................... H-50 H.4.1.3 Inadequate Reliability of Water Supply in Angat-Umiray System .......... H-50 H.4.1.4 Expected Increase of Conflict among Water Users, Especially between
Municipal and Irrigation Water Users ..................................................... H-52 H.4.2 Projects as Components of Proposed IWRM Plan .............................................. H-52
H.4.2.1 Purpose of Water Resources Development, Allocation and Distribution H-52 H.4.2.2 Increase of Capacity of Hydropower Generation as Secondary Purpose
of Water Resources Development............................................................ H-52 H.4.2.3 Projects as the Countermeasures against the Problems and Issues on
Water Resources Development, Allocation and Distribution .................. H-53 H.4.2.4 Projects to Support Sustainable Water Source for Municipal Water
Supply ...................................................................................................... H-55 H.4.2.5 Projects to Secure Necessary Water Sources for Expansion of Large
Irrigation System ..................................................................................... H-55 H.4.2.6 Projects to Improve Inadequate Reliability of Water Supply in Angat-
Umiray System ........................................................................................ H-56 H.4.2.7 Projects to Prepare for Expected Increase of Conflict among Water
Users, especially between Municipal and Irrigation Water Users ........... H-56 H.4.3 Project Component for the Conceptual Projects ................................................. H-57
H.4.3.1 IS-C-01: Establishment of Comprehensive Groundwater Monitoring in Pampanga River Basin ............................................................................ H-57
H.4.3.2 IS-C-02: Project for Recovery of Reliability of Water Supply in Angat-Umiray System ............................................................................. H-58
H.4.3.3 IS-C-03: Enhancement of Monitoring System for Surface Water in Pampanga River ....................................................................................... H-58
H.4.3.4 IS-C-04: Capacity Development of NWRB and Relevant Agencies on Water Allocation and Distribution ........................................................... H-61
H.4.4 Preliminary Study on Alternative Approaches to Specific Issues on Water Resources Development, Allocation and Distribution ........................................ H-63
H.4.4.1 General .................................................................................................... H-63 H.4.4.2 Background and Purpose of Proposed Project ......................................... H-63 H.4.4.3 Preliminary Study on Project for Recovery of Reliability of Water
Supply in Angat-Umiray System (IS-C-02) ............................................ H-64
iii
List of Tables
List of Tables in Report
Table H. 2.1.1 Stainable Outcomes and Strategic Themes in IWRM Plan Framework .......... H-2 Table H. 2.2.1 Definition of Water Use by Water Code .......................................................... H-4 Table H. 2.2.2 Standard Criterion or Procedure for Water Use Permit Grant ......................... H-4 Table H. 2.2.3 Summary of Granted Water Use Permits in the Study Area ............................ H-5 Table H. 2.2.4 Summary of Estimated Present Water Demand in the Study Area .................. H-6 Table H. 2.3.1 Fundamental Features for Existing Storage Dams .......................................... H-8 Table H. 2.3.2 Summary of Features for Proposed Storage Dams .......................................... H-9 Table H. 2.3.3 Summary of Possible Storage Dam Sites for Municipal Water Supply ......... H-10 Table H. 2.4.1 Target and Strategy in Energy Sector ............................................................ H-10 Table H. 2.4.2 Installed Power Generating Capacity and Power Generation by Source
in 2007 ........................................................................................................... H-11 Table H. 2.4.3 Hydropower Measurable Targets ................................................................... H-11 Table H. 2.4.4 Fundamental Features of Hydropower Plants in the Study Area ................... H-12 Table H. 2.5.1 Diversion Water Requirement in AMRIS ...................................................... H-17 Table H. 2.5.2 Alternative Long-term Water Sources ........................................................... H-24 Table H. 3.1.1 Summary of Surface Water Resources Potential in Quasi-Natural
Condition ....................................................................................................... H-27 Table H. 3.1.2 Surface Water Resources Potential for Existing Storage Dams ..................... H-29 Table H. 3.1.3 Surface Water Resources Potential for Proposed Storage Dams ................... H-29 Table H. 3.1.4 Summary of Surface Water Resources Potential (Equivalent to 80%
Reliability) with Existing and Proposed Storage Dams ................................. H-29 Table H. 3.1.5 Safe and Mining Yields by NWRC ............................................................... H-30 Table H. 3.1.6 Empirical Groundwater Recharge Rate ......................................................... H-31 Table H. 3.1.7 Estimated Annual Total Recharge for Each Sub-Basin ................................. H-32 Table H. 3.1.8 Summary of Estimated Groundwater Resources Potential ............................ H-33 Table H. 3.2.1 Present and Projected Unit Water Demand .................................................... H-35 Table H. 3.2.2 Unaccounted Water ........................................................................................ H-35 Table H. 3.2.3 Summary of Present and Projected Municipal Water Demand in the
Study Area ..................................................................................................... H-35 Table H. 3.2.4 Summary of Estimated Industrial Water Demand ......................................... H-36 Table H. 3.2.5 Estimated Net Diversion Water Demands for Existing NISs ........................ H-36 Table H. 3.2.6 Estimated Total Water Demands for Existing CISs and Small Scale
Irrigations ...................................................................................................... H-36 Table H. 3.2.7 Estimated Net Diversion Water Demands for Projected Future NISs ........... H-37 Table H. 3.2.8 Estimated Total Water Demands for Projected Future CISs and Small
Scale Irrigations ............................................................................................. H-37 Table H. 3.2.9 Estimated Present and Future Irrigation Water Demand for
Groundwater Source in the Study Area ......................................................... H-37 Table H. 3.2.10 Estimated Fisheries Water Demand in the Study Area .................................. H-38 Table H. 3.2.11 Estimated Livestock Water Demand in the Study Area ................................. H-38 Table H. 3.2.12 Minimum Stream Flow Requirement Described in Resolution
No.01-0901 .................................................................................................... H-40 Table H. 3.2.13 Estimated Minimum Stream Flow Requirement at Representative
Control Points ................................................................................................ H-40 Table H. 3.2.14 Estimated Whole Water Demand in the Entire Study Area ........................... H-40 Table H. 3.3.1 Categorization of Water Demand for Groundwater ....................................... H-41 Table H. 3.3.2 Evaluation of Present and Future Risk for Groundwater Usage .................... H-41 Table H. 3.3.3 Deficit of Sustainable Local Groundwater Source ........................................ H-42 Table H. 3.3.4 Selected Options ............................................................................................ H-47

iv
Table H. 3.3.5 Summary of Available Municipal Water Supply with All Selected Options in Pampanga River Basin ................................................................. H-48
Table H. 3.3.6 Summary of Attained Safety Levels, Necessary Conditions of Water Release in Angat Storage Dam ...................................................................... H-48
Table H. 4.1.1 Evaluation of Present and Future Risk for Groundwater Usage .................... H-49 Table H. 4.2.1 On-going, Proposed and Conceptual Projects related to Problems and
Issues on Water Resources Development, Allocation and Distribution ........ H-54 Table H. 4.2.2 List of On-going, Proposed and Conceptual Programs and Projects for
Inter-Sector for Water Resources Management ............................................. H-55 Table H. 4.3.1 Recommended Measures for Enhancement of Surface Water
Monitoring System ........................................................................................ H-60 Table H. 4.4.1 Diversion Water Requirement in AMRIS for Alternative Study ................... H-65 Table H. 4.4.2 Possible Options ............................................................................................ H-67 Table H. 4.4.3 Projected Non Revenue Ratio in MWSS Master Plan in 2005 ..................... H-70 Table H. 4.4.4 Cost for Selected Options .............................................................................. H-71 Table H. 4.4.5 Comparison among Selected Options ............................................................ H-72 Table H. 4.4.6 Summary of Available Municipal Water Supply with All Selected
Options in Pampanga River Basin ................................................................. H-73 Table H. 4.4.7 Summary of Attained Safety Levels, Necessary Conditions of Water
Release in Angat Storage Dam as well as Necessary Annual Cost ............... H-74 Table H. 4.4.8 Impact on Hydropower Generation ............................................................... H-75 Table H. 4.4.9 Overall Evaluation on Alternatives ................................................................ H-76
List of Annex Tables
Annex-T H.2.2.1 Water Permits for Each Sub- Basin............................................................ HT-1 Annex-T H.2.2.2 Water Permits for Each Municipality/City ................................................. HT-2 Annex-T H.2.3.1 H-V-A relationship for Angat and Pantabangan Storage Dams ................. HT-4 Annex-T H.2.3.2 Identified Possible Large Storage Dam Sites in Previous Studies ............. HT-5 Annex-T H.2.3.3 H-V-A relationship for Proposed Storage Dams ........................................ HT-6 Annex-T H.2.4.1 List of Exiting Power Plants for Luzon Grid ............................................. HT-7 Annex-T H.2.4.2 Indicative Hydropower Development Projects .......................................... HT-8 Annex-T H.3.1.1 Explanation of the Control Points .............................................................. HT-9 Annex-T H.3.1.2 Surface Water Resources Potential in Quasi-Natural Condition .............. HT-10 Annex-T H.3.1.3 Surface Water Resources Potential (Equivalent to 80% Reliability)
with Existing and Proposed Storage Dams at Control Points .................. HT-11 Annex-T H.3.1.4 Groundwater Resources Potential ............................................................ HT-12 Annex-T H.3.2.1 Present and Projected Municipal Water Demand by City/Municipality
in the Study Area ...................................................................................... HT-13 Annex-T H.3.2.2 Present and Projected Industrial Water Demand for Surface Water
Source ...................................................................................................... HT-14 Annex-T H.3.2.3 Present and Projected Industrial Water Demand for Groundwater
Source ...................................................................................................... HT-15 Annex-T H.3.2.4 Estimated Diversion Water Demands for Existing CISs and Small
Scale Irrigations ....................................................................................... HT-16 Annex-T H.3.2.5 Estimated Diversion Water Demand for Projected Future CISs and
Small Scale .............................................................................................. HT-17 Annex-T H.3.2.6 Estimated Irrigation Water Demand for Groundwater Source by
Municipality/City ..................................................................................... HT-18 Annex-T H.3.2.7 Estimated Fisheries Water Demand by Water Balance Catchment .......... HT-19 Annex-T H.3.2.8 Estimated Livestock Water Demand by City/Municipality ..................... HT-20 Annex-T H.3.2.9 Estimated Minimum Stream Flow Requirement at Control Points ......... HT-21

v
Annex-T H.3.3.1 Evaluation of Water Usage Condition for Groundwater Source .............. HT-22 Annex-T H.3.3.2 Deficit of Sustainable Local Groundwater Source by
Municipality/City ..................................................................................... HT-23 Annex-T H.3.3.3 List of Consummative, Flow through and Reservoir Nodes in
MODSIM Modeling ................................................................................ HT-24 Annex-T H.4.1.1 Project Profile for Inter-Sector for Water Resources Management ......... HT-25
List of Figures
List of Figures in Report
Figure H. 2.2.1 Overall Present Water Balance in the Study Area ........................................... H-7 Figure H. 2.5.1 Change in Water Level in Angat Storage Dam .............................................. H-15 Figure H. 2.5.2 Water Use Permits and Water Allocation in Angat-Umiray System .............. H-16 Figure H. 2.5.3 Diversion Water Requirement in AMRIS ...................................................... H-18 Figure H. 2.5.4 Inflow and Outflow of Angat Storage Dam during Typhoon Ondoy ............ H-21 Figure H. 2.5.5 Power Generation by Main Unit and Auxiliary Unit in Angat
Hydropower Plant .......................................................................................... H-21 Figure H. 2.5.6 Monthly Power Generation in Angat Hydropower Plant .............................. H-22 Figure H. 2.5.7 Typical Hourly Operation in Angat Hydropower Plant ................................. H-22 Figure H. 2.5.8 Projected Water Demand and Water Supply Sources for MWSS Service
Areas .............................................................................................................. H-24 Figure H. 4.3.1 Schematic Diagram of Data Acquisition and Sharing for Proposed
Surface Water Monitoring System................................................................. H-59 Figure H. 4.4.1 Proposed Bayabas Storage Dam .................................................................... H-68 Figure H. 4.4.2 Proposed Balintingon Storage Dam and Conveyance to AMRIS ................. H-69
List of Annex Figures
Annex-F H.2.2.1 Location of Water Permits for Surface Water ............................................ HF-1 Annex-F H.2.2.2 Location of Water Permits for Groundwater .............................................. HF-2 Annex-F H.2.3.1 Location and Dimension of Angat Storage Dam ....................................... HF-3 Annex-F H.2.3.2 Location and Dimension of Pantabangan Storage Dam ............................ HF-4 Annex-F H.2.3.3 Location of Identified Possible Large Storage Dam Sites ......................... HF-5 Annex-F H.2.3.4 Location of Proposed Large Storage Dam Sites ........................................ HF-6 Annex-F H.2.3.5 Location of Proposed Bayabas and Maasim Storage Dams ....................... HF-7 Annex-F H.2.3.6 Location of Proposed Balintingon Storage Dam ....................................... HF-7 Annex-F H.2.3.7 Location of Proposed Balog-Balog Storage Dam ...................................... HF-8 Annex-F H.2.3.8 Location of Proposed Gumain Storage Dam ............................................. HF-8 Annex-F H.2.3.9 Location of Marimla2 and Bangat3 Sites .................................................. HF-9 Annex-F H.2.4.1 Existing Hydropower Plants in the Study Area ....................................... HF-10 Annex-F H.3.1.1 Water Balance Catchments ...................................................................... HF-11 Annex-F H.3.1.2 Control Points and Discharge in Quasi-Natural Flow Condition ............. HF-12 Annex-F H.3.1.3 Surface Water Resources Potential (Equivalent to 80% Reliability)
with Existing and Proposed Storage Dams at Control Points .................. HF-13 Annex-F H.3.1.4 Sub-Areas for Groundwater Availability in the Provinces of Bulacan,
Pampanga, Nueva Ecijia and Tarlac ........................................................ HF-14 Annex-F H.3.2.1 Schematic Flow Diagram of Existing NIS ............................................... HF-15 Annex-F H.3.2.2 Schematic Flow Diagram of Projected NIS ............................................. HF-16

vi
Annex-F H.3.3.1 Evaluation of Groundwater Usage Condition in Present Condition (2008) ....................................................................................................... HF-17
Annex-F A.3.3.2 Evaluation of Groundwater Usage Condition in Future Condition (2025) ....................................................................................................... HF-18
Annex-F A.3.3.3 MODSIM Model Setup for Water Balance Simulation for Present Condition (2008) ...................................................................................... HF-19
Annex-F A.3.3.4 MODSIM Model Setup for Water Balance Simulation for Future Condition (2025) ...................................................................................... HF-19
Annex-F A.3.3.5 Total Demand and Average Total Deficit for CISs and Other Agricultural Water Use such as Fresh Water Aquaculture in Present Condition ................................................................................................. HF-20
Annex-F A.3.3.6 Simulated Average Monthly Flow Pattern in Present Condition and Quasi-Natural Condition at around the Intake of Cong Dadong dam in the Pampanga River ............................................................................. HF-21
Annex-F A.4.2.1 Location of Projects in Water Resources Development, Allocation and Distribution ....................................................................................... HF-22
Annex-F A.4.3.1 Tentatively Proposed Monitoring Stations for Surface Water .................. HF-24

Sector H: Water Resources Development and Management
H-1
Sector H. Water Resources Development and Management
H.1 Introduction
Inter-sector problem on allocation and distribution of water resources is mainly focused in this sector report. Especially, the following topics would be discussed through analysis of water resources and water balance simulation.
Multi-purpose Water Resources Development
Bulk water supply for Municipal Use
Water Resources Management Issue
Special attention is paid to Angat-Umiray system, which is currently under critical condition for water supply for multi-users.
Firstly, in Chapter H.2, current status on water resources in Pampanga river basin is presented. The following topics are discussed.
Water resources potential and water use
Existing and potential water resources development facilities
Hydropower generation
Water shortage condition in Angat-Umiray system in detail
Secondly, in Chapter H.3, the methodology of the water balance study in the present study and its results are described.
Finally, in Chapter H.4, Plan for water resources allocation and distribution is discussed. This chapter contains the following topics.
Problem and issues identified
Necessary measures to address the problems and issues
Contents of conceptual projects
Alternative Study on Project for Recovery of Reliability of Water Supply in Angat-Umiray System

Sector H: Water Resources Development and Management
H-2
H.2 Current Status of Water Resources Development, Allocation and Distribution in the Study Area
H.2.1 IWRM Plan Framework
Medium-Term Philippine Development Plan (MTPDP)1), 2004-2010 emphasized to adopt IWRM approach as a more integrated and holistic management of water resources in Philippines. This approach involves the coordinated development and management of water, land and related resources within the hydrological boundaries, to optimize economic and social welfare without compromising the sustainability of vital ecosystems.
To promote IWRM more in Philippines, IWRM Plan Framework in Philippines2) was formulated in 2006 under the leadership of NWRB. The IWRM Plan Framework has four (4) Sustainable Outcomes and nine (9) Strategic Themes as shown in the following table.
Table H. 2.1.1 Stainable Outcomes and Strategic Themes in IWRM Plan Framework Sustainable Outcomes Strategic Themes
Effective Protection and Regulation for Water Security and Ecosystem Health
To ensure the rational, efficient and ecologically sustainable allocation of water To enhance the effectiveness in groundwater management and aquifer protection To achieve the clean and healthy water To manage and mitigate the risks brought out from climate change events and
water related disasters Sustainable Water Resources and Responsive Services for Present and Future Needs
To promote water conservation/stewardship and improve the water use efficiency To expand the access and ensure availability of affordable and responsive water
supply and sanitation services Improved Effectiveness, Accountability, and Synergy among Water Related Institutions and Stakeholders
To promote the participatory water governance and supportive enabling environment
To strengthen the knowledge management and the building capacity for IWRM
Adaptive and Proactive Response to Emerging/ Future Challenges
To explore the new pathways to water resource management: water sensitive design and water rights trading
Source: IWRM Plan Framework
The IWRM itself is not a purpose but a methodology to support proper regional development from view point of water resources management. In the present study, visions, objectives and goals of IWRM for Pampanga river basin are set, based on national and regional development policy. The IWRM Plan Framework would be utilized as check lists to support to achieve the goals of the IWRM in Pampanga river basin.
H.2.2 Overview on Present Water Resources Potential and Water Usage
H.2.2.1 Water Resources Potential
Based on the metro-hydrological analysis in the present study (see details in Sector Report A: Topography and Meteo-hydrology), the annual total precipitation and Potential Evapo-transpiration (PET) for the entire study area is estimated at 2,155mm/year and 1,315mm/year, respectively. In very rough view, the runoff volume is about 60 % of the total precipitation volume in the basin, which is equivalent that the runoff volume is about 1,300 mm/year (13,000MCM/year).
(1) Surface Water Resources Potential
The results of the simulated runoff for the last 50 years (1958-2007) described in the Sector report A show the total surface water potential in a quasi-natural flow condition as follows (refer to Chapter H.3.1 for details).
Mean annual runoff volume: 13,264MCM/year (421m3/s)
Annual runoff volume at 1/5years drought condition: 9,350MCM/year (296m3/s)
80% dependable flow: 80m3/s

Sector H: Water Resources Development and Management
H-3
It can be said that the water resources in Pampanga river basin is in general fruitful in terms of its total potential volume supported by large amount of precipitation in the basin. However, the usable water volume in a stable manner in a natural condition is quite limited in a dry season, especially for drought years. The water resources development such as construction of storage dams has been implemented in order to increase the usable water volume even in a dry season in a drought year. There exist two large storage dams in the study area as follows.
Angat storage dam (Veff =894MCM)
Pantabangan storage dam (Veff =2,775MCM)
In the study area, there are the following four major inter-basin transfer schemes.
Umiray-Angat trans-basin (Umiray river to Angat storage dam)
Aurola trans-basin (Aguang River to Pantabangan storage dam)
Casecnan trans-basin (Casecnan River to Pantabangan storage dam)
Irrigation canal from Tarlac River to TASMORIS irrigation area
Considering the above-mentioned storage dams and inter-basin transfer schemes, the present surface water resources potential with equivalent to 80% reliability is estimated as follows (refer to Chapter H.3.1 for details).
Quasi-Natural condition (incl. Tarlac river): 2,652MCM/year (84m3/s)
With existing storage dams: 4,728MCM/year (150m3/s)
With existing storage dams and trans-basin schemes: 5,835MCM/year (185m3/s)
(2) Groundwater Resources Potential
The total groundwater resource potential is estimated as follows (refer to Chapter H.3.1 for details).
Optimistic estimation (Recharge = 12% of precipitation): 1,476MCM/year
Conservative estimation (Recharge = 5% of precipitation): 615MCM/year
Part of the groundwater along coastal area in Bulacan and Pampanga provinces could be affected by saltwater intrusion. The possible affected volume is estimated at 8.5% of the potential volume.
H.2.2.2 Type of Water Use
The Water Code of the Philippines enacted in 19763) defined the type of water use. The Amended Implementing Rules and Regulations of the Water Code adopted in 20054) modified slightly its definition. The definition of the type of the water use based on the Amended Implementing Rules and Regulations of the Water Code is shown in the following table.
Sector H: Water Resources Development and Management
H-4
Table H. 2.2.1 Definition of Water Use by Water Code Type Definition
Domestic the utilization of water directly drawn from a source by a household for drinking, washing, bathing, cooking, watering of gardens or animals and other domestic uses.
Municipal
the utilization of water for supplying the water requirements of a community, whether by piped or bulk distribution for domestic and other uses, direct consumption, the drawer or abstractor of which being the national government, its subsidiary agencies, local government units, private persons, cooperatives or corporations.
Irrigation the utilization of water for producing agricultural crops. Power generation the utilization of water for producing electrical or mechanical power.
Fisheries the utilization of water for the propagation and culture of fish as a commercial enterprise or any other aqua-culture ventures.
Livestock raising the utilization of water for large herds or flocks of animals raised as a commercial enterprise.
Industrial the utilization of water in factories, industrial plants and mines including the use of water as an ingredient of a finished product.
Recreation the utilization of water for swimming pools, bath houses, boating, water skiing, golf courses and other similar facilities in resorts and other places of recreation.
Other purposes Source: Water Code, the Amended Implementing Rules and Regulations, 2005
H.2.2.3 Present Water Use Permit
The water use permit has been granted by NWRB. Applicants must get permission from NWRB before they utilize water resources by their own facilities. For each type of water use, the standard criterion or procedure for water permit grant is summarized in the following table.
Table H. 2.2.2 Standard Criterion or Procedure for Water Use Permit Grant Type Standard Criterion or Procedure for Water Permit Grant
Domestic/Municipal 0.0029 liter/s/capita (250LCD)(*1)
Irrigation 1.5 liter/s/ha for paddy field (Other crops and plants have different standard values)(*2)
Power generation The application shall be examined and approved by NWRB, While DOE issues a clearance/certificate for processing water permit. (*4)
Fisheries 3.15 and 6.30 liter/s/ha for prawns in freshwater and brackish water, respectively, and 0.9259 liter/s/ha for other than prawns (*4)
Livestock raising 0.00024 liter/s/head for cattle and swine, and 0.00000146 liter/s/head for poultry (*4)
Industrial The application shall be examined and approved by NWRB with ECC or Non-Coverage Certificate issued by DENR. (*4)
Recreation
0.6 liter/sec/ha for the planned golf course area except for the declared critical areas (Metro Manila, parts of Cavite and Bulacan, Metro Cebu, Bagio City, Angeles City, Iloilo City, Bacold City, Davao City, Cagayan de Oro City and Zamboanga City). For the critical areas, specific monthly values (0.02 - 0.29 liter/s/ha) are used.(*3)
Other purposes The application shall be examined and approved by NWRB. (*4) Note: LCD=litter per capita per day Source: (*1) NWRB: Resolution No.05-0388, March 22, 19885)
(*2) NWRB: Resolution No.0-0, August 25, 19896) (*3) NWRB: Resolution No.003-0109, January 21, 20097) (*4) Current practice by NWRB
The granted permit data have been stored in a database of NWRB with respect to purpose of water use, permitted quantity of water, etc. Utilizing the database, the granted water quantities in the study area are summarized by type of water use and sources, as shown in the following table. The trans-basin water, which is abstracted outside Pampanga river basin and conveyed to the basin, is included. The data shown in the table reflects the granted water quantity as of the end of 2007. The abandoned water use permits that are specified in the database and the identified non-functional water sources during the inventory survey for the province of Pampanga in June, 2009 conducted by NWRB are excluded. The location of the water use permits for surface water and groundwater are demonstrated in Annex-F H.2.2.1 and H.2.2.2, respectively. The water use permits by sub-basins and by municipalities/cities are summarized in Annex-T H.2.2.1 and H.2.2.2, respectively.

Sector H: Water Resources Development and Management
H-5
Table H. 2.2.3 Summary of Granted Water Use Permits in the Study Area
Type of Water Use Surface Water
(m3/s)
Surface Water (Trans-basin)
(m3/s)
Groundwater (m3/s)
Total (m3/s)
Domestic/Municipal 5.398 0.000 3.806 9.204 Municipal by MWSS 28.660 17.576 0.000 46.236 Irrigation 30.299 0.000 1.122 31.421 Irrigation by NIA 228.285 55.397 1.426 285.108 Power generation 103.000 0.000 0.000 103.000 Fisheries 0.010 0.000 0.018 0.028 Livestock 0.000 0.000 0.019 0.019 Industrial 0.116 0.000 1.149 1.265 Recreation 0.000 0.000 0.073 0.073 Other purposes 0.000 0.000 0.229 0.229 Total excl. power generation 292.768 72.973 7.842 373.583 Total 395.768 72.973 7.842 476.583 Source: NWRB
a) There are two databases for the granted water use permit in NWRB. One is the NWIN database. Another is the database managed by assessment section of Policy and Program Division for their own use. The latter is used for the analysis of the water use permit at this moment in the present study.
b) The abandoned water use permit that is specified in the database and the identified non-functional water sources during the inventory survey for the province of Pampanga in June, 2009 conducted by NWRB are excluded.
The followings could be understood from the above table.
The water volume of about 370m3/s for water uses except power generation has been granted in total. The granted water for the power generation in the study area is 103m3/s, which is usually re-used for other purposes at further downstream portion and not actually consumed. The consumable permitted water quantity in the study area could be thereby 370m3/s. This exceeds far the water resources potential in the study area.
Among the consumable permitted water quantity, only 2% is granted for groundwater sources. The groundwater is currently main source for domestic/municipal and industrial water use in the study area.
According to the granted water quantity, there are two big water users related to the study area; one is NIA for irrigation water use and another is MWSS for municipal water use for Metro Manila. About 90% of the consumable permitted water quantity is granted to NIA and MWSS.
The granted water quantity for fisheries, livestock and recreation is minimal compared to other type of water use.
Although the data for the granted water use permit are only available information to grasp the entire figure for all types of water usage in the study area, it should be noted that the granted water quantity may not represent the actual water demand but implicate the following conditions in some cases:
Full volume of the permitted water quantity for irrigation water is not actually used through a year, considering the demand pattern of irrigation water use in a year.
It is said that there is usage of water without getting permission from NWRB, especially for domestic/municipal water use.
Considering the extended area of fish pond in the study area, the granted water quantity for fisheries seems to be too small.

Sector H: Water Resources Development and Management
H-6
H.2.2.4 Overview of Present Water Demand
Based upon the available information collected in the present study, the present water demands for some categories of water use have been estimated (refer to Chapter H.3.2 for details).
The following table summarizes the estimated present water demand. It should be noted that the category of the municipal water demand includes the following type of water use; domestic, municipal, recreational and other purposes. The commercial and light industrial water demand, which may be provided by public water providers and may not be granted as industrial purpose in the water permit issued by NWRB, is also included in the category of the municipal water demand.
Table H. 2.2.4 Summary of Estimated Present Water Demand in the Study Area
Category of Water Demand Estimation
Type of Water Use defined by Water Code
Estimated Present Water Demand
(Annual average) (m3/s)
Granted Water Quantity
(m3/s)
Municipal
Domestic Municipal Recreation Other purposes
7.429 9.506
Municipal by MWSS Municipal 46.236* 46.236 Industrial Industrial 1.265* 1.265
Irrigation Irrigation Maximum 241.028 Average 113.356 Minimum 22.508
316.529
Power generation Power generation 103.000* 103.000 Fisheries (Brackish water) Fisheries 17.900 0.000 Fisheries (Fresh water) Fisheries 6.400 0.028 Livestock Livestock 0.290 0.019 Total excl. power generation and fisheries (brackish water)
174.976 373.583
Total 295.876 476.583 Note: * - It is assumed that the present demand is same as the granted water quantity. Source: JICA Study Team
The followings are noted from the above table.
Estimated annual averaged water demand for irrigation is about 40% of the granted water quantity. The granted water permit shows only the maximum quantity which may be abstracted. The actual pattern of irrigation water demand through a year should be considered when water supply-demand balance is examined.
The estimated water demand for fisheries is much larger than the currently granted water quantity.
H.2.2.5 Overview of Present Water Balance
Overall water balance between supply potential and demand is schematically shown in the following figure. It can be understood that the total potential is slightly larger than the total demand. However, the water resources and water demand for both surface water and groundwater are spatially distributed in the study area. The water shortage actually occurs for some water users, based on the detailed surface water balance simulation described in Chapter H.3.3.

Sector H: Water Resources Development and Management
H-7
Stably Usable SW(1/5years safety level)
5,835MCM/year
Unstably Usable SW
Trans‐basin
Stable Water transfer(1/5years Safety level)
1,107MCM/year
Usable GW with sustainable manner
1,350 (563)MCM/year
GW Recharge
2,648(1,103)MCM/year
Restricted GWby aquifer condition
and salt‐water intrusion
Surface Runoff
13,264MCM/year
Precipitation
22,068MCM/year
Municipal234MCM/year
Municipal(Metro Manila)1,451MCM/year
Irrigation3,556MCM/year
Livestock10MCM/year
Not usable in stable manner
Fisheries202MCM/year
Industrial36MCM/year
Industrial4MCM/year
Total5,213MCM/year
Total298MCM/year
Potential
Demand
Irrigation18MCM/year
Source: JICA Study Team
Figure H. 2.2.1 Overall Present Water Balance in the Study Area
The safety level of the following water supply is lower than 1/5years, based on the results of the water balance simulation described in Chapter H.3.3.
National Irrigation System (NIS)
AMRIS, TASMORIS, Porac-Gumain
Communal Irrigation System (CIS)
In general, the water to be abstracted in dry season is quite limited. In the dry season, the water shortage occurs every year in many CISs which utilizes local flow.
Based on the detailed analysis on balance of demand and potential for groundwater (refer to Chapter H.3.3), it is also judged that the groundwater abstraction exceeds the sustainably usable level at some municipalities/cities as follows.
At present, among seventy six (76) municipalities/cities inside the study area in provinces of Bulacan, Nueva Ecija, Pampanga and Tarlac, nine (9) municipalities/cities are at high risk and nine (11) are at risk. Many municipalities/cities located at low-land area in Bulacan as well as Angels, San-Fernando in Pampanga are at high risk.
H.2.3 Water Resource Development Facilities
H.2.3.1 Existing Large Storage Dams
There exist the following two large storage dams in the study area.
Angat storage dam
Pantabangan storage dam

Sector H: Water Resources Development and Management
H-8
Both of them are accompanied with trans-basin water transfer scheme. The fundamental features for the existing storage dams are summarized in the following table. The location maps for Angat storage dam and Pantabangan storage dam with their dimensions are presented in Annex-F H.2.3.1 and H.2.3.2, respectively. Annex-T H.2.3.1 shows the H-V-A relationship for Angat and Pantabangan storage dams.
Table H. 2.3.1 Fundamental Features for Existing Storage Dams Storage Dam Item Description
Angat
Completion year*1 September, 1967 (start of construction in 1961) Purpose*1 Municipal, Irrigation water supply, Hydropower, Flood control Dam type*1 Earth and rock fill dam Dam height*1 131m
Effective storage*1,*4 894MCM (696MCM for Municipal, Irrigation water supply, Hydropower)
Drainage area*2 546km2 Re-regulation dam*1 Ipo dam, Bustos dam
Trans-basin*1,*2,*3 Umiray-Angat trans-basin (operation started on June, 2000) (A=130km2) (Two intakes with catchment area of 31km2 have not yet been completed).
Inflow*4 Self catchment: 1,869MCM/year (observed average in 1968-2007) Umiray-Angat trans-basin: 370MCM/year (observed average in 2001-2003, 2006-2007)
Pantabangan
Completion year*5 November, 1973 (release started on February, 1974) Purpose*5 Irrigation water supply, Hydropower generation, Flood control Dam type*5 Zoned earth fill dam Dam height*5 107m
Effective storage*5 2,775MCM (total volume:3,000MCM, deal volume: 225MCM) (1,757MCM for Irrigation water supply, Hydropower)
Drainage area*2 937km2 (incl. catchment of Aurola trans-basin and Masiway dam) Re-regulation dam*5 Masiway dam
Trans-basin*2,*5 1) Aurola trans-basin (A=68km2) 2)Casecnan trans-basin (operation started on December, 2001) (A=570km2)
Inflow*6 Self catchment & Aurola trans-basin: 1,195MCM/year (observed average in 1980-2008) Casecnan trans-basin: 751MCM/year (observed average in 2002-2008)
Source: *1:NWRB/JICA, Dams in the Philippines8) *2:GIS data prepared by JICA Study Team *3: ADB, MWSS: Umiray-Angat Transbasin study9) *4:Data provided by NPC are analyzed by JICA Study Team *5:NIA,Pantabangan Dam, Briefing Kit10)
*6:Data provided by NIA are analyzed by JICA Study Team
H.2.3.2 Proposed Large Storage Dams
In the previous water resources study11), 12), 13), twenty eight (28) possible large storage dam sites have been identified in the study area and in the surroundings with possible trans-basin water transfer to the study area. The identified sites are listed in Annex-T H.2.3.2 and the locations are shown in Annex-F H.2.3.3.
Among them, the following five large storage sites have been further studied in the past and at least pre-F/S level studies with detail information on the project contents have been completed (Locations are shown in Annex-F H.2.3.4).
Bayabas storage dam
Maasim storage dam
Balintingon storage dam
Gumain storage dam
Balog-Balog storage dam

Sector H: Water Resources Development and Management
H-9
In the present study, the above five proposed storage dams are examined to clarify their potential in Chapter H.3.1. The fundamental features are summarized in the following table and the detail locations are shown in Annex-F H.2.3.5 - H.2.3.8. Annex-T H.2.3.3 shows the H-V-A relationship for the proposed storage dams.
Table H. 2.3.2 Summary of Features for Proposed Storage Dams Storage Dam Item Description
Bayabas*1
Purpose Municipal and Irrigation water supply Dam type Zoned earth and rock fill dam Dam height 110m Effective storage 144MCM*8 (total volume: 154MCM, deal volume: 10MCM) *8 Drainage area*6 52km2 Inflow*7 98MCM/year (average in 1958-2007 using simulated runoff)
Remarks Water use permit of 3.5m3/s at the proposed dam site has been granted to provincial government of Bulacan on November, 2004.
Maasim*1
Purpose Municipal and Irrigation water supply Dam type Zoned earth fill dam Dam height 47m Effective storage 95MCM (total volume: 100MCM, deal volume: 5MCM) Drainage area*6 53km2 Inflow*7 79MCM/year (average in 1958-2007 using simulated runoff) Remarks
Balintingon*2,*3
Purpose Irrigation water supply and hydropower generation Dam type Rock fill dam Dam height 138m Effective storage 488MCM (total volume:572MCM, deal volume: 84MCM) Drainage area*6 224 km2 Inflow*7 567MCM/year (average in 1958-2007 using simulated runoff)
Remarks The originally planned to be used for new Balintingon irrigation service area*2. Recently, the possibility of conveyance to AMRIS has been re-evaluated*3.
Gumain*4
Purpose Irrigation water supply
Dam type Zoned rock fill dam
Dam height 108m Effective storage 99MCM (total volume:110MCM, deal volume: 11MCM) Drainage area*6 118km2 Inflow*7 255MCM/year (average in 1958-2007 using simulated runoff)
Remarks The study was conducted before the Pinatubo eruption. Re-evaluation may be needed.
Balog-Balog*5
Purpose Irrigation and fisheries water supply, Hydropower generation, Flood control Dam type Rock fill dam Dam height 114m Effective storage 575MCM (total volume: 625MCM, deal volume: 50MCM) Drainage area*6 289km2 Inflow*7 633MCM/year (average in 1958-2007 using simulated runoff) Remarks
Source: *1: NIA/NWRB/World Bank: Water Resources Development Project, Draft Final Report, Task5, Pre-feasibility study for additional water supply to AMRIS main report, 1994. 14)
*2: NIA, Balintingon Reservoir Multipurpose Project, Feasibility Study, Vol. I, Main Report, 1983. 15) *3: CALENERGY: Balintingon Multipurpose Project, Prefeasibility Study Report, 2006. 16) *4: NIA/JICA, Feasibility Study Report on the Gumain River Irrigation Project, 1985. 17)
*5: NIA, Balog-Balog Multipurpose Project, Feasibility Study, Main Report, 1980. 18) *6: GIS data prepared by JICA Study Team *7: Simulated runoff by JICA Study Team *8: The original H-V-A curve does not seem to be correct. JICA Study Team prepared H-V-A curve based on
1/50,000 scale topographic map.
H.2.3.3 Possible Storage Dam Sites for Municipal Water Supply
Recently, Clark Development Cooperation (CDC) conducted a water resources study19) to look for future possible water sources. Several sites around the Clark Special Economic Zone were explored

Sector H: Water Resources Development and Management
H-10
in the study. Among them, the following sites have a possibility for development as a storage dam site for municipal water supply.
Marimla2
Bangat3
Locations of these sits are shown in Annex-F H.2.3.9. According to CDC, feasibility study for these sites will be conducted soon under the assistance of World Bank. If it is validated that these sites are feasible for the development as a storage dam site, these sites could be utilized not only for supplying water for the development of Clark area but also for supplying municipal water for Angels and/or other adjacent area.
Table H. 2.3.3 Summary of Possible Storage Dam Sites for Municipal Water Supply Site Item Description
Marimla2
Possible dam height*1 60m Total storage volume*1 16MCM Drainage area*2 40km2 Inflow*3 70MCM/year (average in 1958-2007 using simulated runoff) Remarks
Bangat3
Possible dam height*1 60m Total storage volume*1 50MCM Drainage area*2 33km2 Inflow*3 63MCM/year (average in 1958-2007 using simulated runoff) Remarks
Source: *1: H-V-A curves prepared by CDC, Clark Special Economic Zone Water Resources Study, Final Report, 2000. *2: GIS data prepared by JICA Study Team *3: Simulated runoff by JICA Study Team
Assuming that the dead volume is 3MCM for Marimla2 site (i.e. effective volume = 13MCM) and 10MCM for Bangat3 site (i.e. effective volume = 40MCM), the results of a simple water balance calculation show that 0.7m3/s for Marimla2 site and 1.6m3/s for Bangat3 site could be available in total with 1/10years safety level. It should be noted that actual usable water volume could be smaller if environmental flow requirement and other water users in downstream are taken into account.
H.2.4 Hydropower Generation
H.2.4.1 Overview in Energy Sector
(1) Target and Strategy in Energy Sector
According to National Energy Plan, 200620), the energy sector in the Philippines currently has the following two targets.
Energy Independence: To reach an energy self-sufficiency level of 60 percent by 2010 and beyond
Energy Sector Reform: Power Sector reforms under the Electric Power Industry Reform Act (EPIRA)21) of 2001 are designed to introduce competition and achieve reasonable electricity prices.
To realize the targets, the strategies shown in the following have been set.

Sector H: Water Resources Development and Management
H-11
Table H. 2.4.1 Target and Strategy in Energy Sector Target Goal Strategy
Energy Independence
60% self -sufficiency level by 2010 and beyond
Accelerating the exploration, development and utilization of indigenous energy resources Intensifying renewable energy resource development Increasing the use of alternative fuels Enhancing energy efficiency and conservation program Forming strategic alliances with other countries
Energy Sector Reform
Fair and reasonable energy prices in a competitive environment
Continuing privatization process
Creating an investment climate attractive to investors
Source: National Energy Plan, 2006
(2) Existing Power Generation
The installed power generating capacity and power generation by source in 2007 is presented in Table H.2.4.2. Natural gas is the most contributing source (more than 30%) for power generation. The installed capacity for coal is the largest among the sources. The hydropower contributes about 15% of total power generation.
Table H. 2.4.2 Installed Power Generating Capacity and Power Generation by Source in 2007
Oil-based Hydro Geo-
thermal Coal
Other Renewable
(Wind, Solar)
Natural Gas
Total
Power Generation (GWh)
5,148 8,563 10,215 16,837 59 18,789 59,612
(8.6%) (14.4%) (17.1%) (28.2%) (0.1%) (31.5%) (100%)Installed Capacity (MW)
3,616 3,289 1,958 4,213 26 2,834 15,937
(22.7%) (20.6%) (12.3%) (26.4%) (0.2%) (17.8%) (100%)Source: Power Sector Situationer, 200722)
(3) Existing Power Plants in Luzon Grid
In the Luzon Grid, the total installed capacity is 12,172MW (10,029MW for dependable capacity). Annex-T H.2.4.1 shows the list of exiting power plants in the Luzon Grid. Among the total installed capacity, hydropower plants have a total capacity of 2,281MW (2,034MW for dependable capacity).
(4) Hydropower Generation as Renewable Energy Potential
To achieve the target of the energy independence, the hydropower sector targets a cumulative installed capacity of 3,999.1MW from hydropower resources as one of renewable energy sources, according to National Energy Plan, 2006. This corresponds to about 780.0MW of additional capacity from the capacity of 3,219.1MW in 2005 (see Table H.2.4.3).
Table H. 2.4.3 Hydropower Measurable Targets 2005 2006 2010 2014
Installed Capacity (MW) 3,219.10 3,219.10 3,219.10 3,999.10 Luzon 2,209.80 2,209.80 2,209.80 2,509.80
Visayas 11.61 11.61 11.61 61.61 Mindanao 997.65 997.65 997.65 1,427.65
Power Generation (GWh) 8,374.00 8,563.00 12,996.00 14,741.00 Luzon 4,422.00 4,611.00 8,896.00 8,819.00
Visayas 35.00 35.00 35.00 188.00 Mindanao 3,917.00 3,917.00 4,065.00 5,734.00
Total Imported Fuel Oil Displacement in MMBFOE 14.44 14.76 22.41 25.42
in MTOE 2.08 2.13 3.24 3.67 MMBFOE: Million Barrels of Fuel Oil Equivalent, MTOE: Million Tons of Oil Equivalent Source: National Energy Plan, 2006

Sector H: Water Resources Development and Management
H-12
The total capacity of the identified hydropower projects is 2,603.5MW. This is composed of 34 large hydropower projects, twenty seven (27) mini-hydropower projects and nine micro-hydropower projects. About thirty seven (37) of these indicative projects have existing feasibility studies. There is no indicative hydropower development project in the study area, however. The indicative hydropower development projects identified in the nationwide view is shown in Annex-T H.2.4.2.
H.2.4.2 Existing Hydropower Plants in the Study Area
The following hydropower plants are located in the study area.
Angat (Installed capacity = 246MW)
Pantabangan-Masiway (Installed capacity = 112MW)
Casecnan (Installed capacity = 160MW)
The total installed capacity is 458MW, which is about 20% of the total installed capacity by hydropower plants in the Luzon Grid. The fundamental features for the existing hydropower plants are summarized in the following table.
Table H. 2.4.4 Fundamental Features of Hydropower Plants in the Study Area
Item Angat*1,*2 Pantabangan – Masiway*3,*4
Casecnan*4 Main Auxiliary Pantabangan Masiway
Installed capacity (MW) 200 46 100 12 150 Number of unit 4 5 2 1 2
Unit capacity (MW) 50 6 (unit-1,2,3)
10 (unit-4) 18 (unit-5)
50 12 75
Type of turbine Francis Francis Francis Kaplan Francis
Rated net head (m) 135 102 (unit-1,2,3) 102 (unit-4) 63 (unit-5)
70 (N/A) (N/A)
Rated flow (m3/s) 42.2 6.9 (unit-1,2,3) 7.0 (unit-4)
22.0 (unit-5) 82 70 (N/A)
Tunnel capacity (m3/s) 200 60 164 (N/A) 80 Start of Operation 1968 1968(1993*A) 1977 1980 2001
Operation NPC NIA CEWEC*B
(BOT*C with NIA)Remarks: *A: full installation
*B: CEWEC = California Energy Casecnan Water and Energy Company, Inc. *C: BOT = Build-Operation-Transfer
Source: *1: NPC, The Angat Hydroelectric Power Plant, 200423). *2: ADB, MWSS, Umiray-Angat Transbasin Study, F/S, Appendix B-Reservoir Operation, 199224) *3: NIA, Pantabangan Dam, Briefing Kit
*4: NIA, Definitive Development Plan, CMIPP-IC, Appendix-I, Meteorology and Hydrology, 200025).
(1) Angat Hydropower Plant
Angat hydropower plant is located at Angat storage dam. There are two units for hydropower generation (see Annex-F H.2.4.1). One is main unit with 200MW. Another is auxiliary unit with 46MW. In general, it is advantageous to use the main unit more frequently in terms of total hydropower generation, because the main unit has a higher head and capacity than the auxiliary unit. The main unit is usually used when NIA requires a release for their irrigation water use. However, it is operational only when the water level of Angat storage dam is higher than 180m above mean sea level by technical reasons. The elevation of 180m above mean sea level is same level to the lowest value of the lower rule curve set by NWRB. The auxiliary unit is used when the stored water is released for MWSS. The hydropower generation in Angat hydropower plant strongly relies on the water demands by NIA and MWSS and their availability in the storage dam.

Sector H: Water Resources Development and Management
H-13
(2) Pantabangan-Masiway Hydropower Plant
Pantabangan-Masiway hydropower plant consists of two power houses (see Annex-F H.2.4.1). One is located at downstream of the main body of Pantabangan storage dam with the installed capacity of 100MW. Another is located at Masiway dam, a re-regulation dam of Pantabangan storage dam, whose installed capacity is 12MW. These powerhouses utilize the stored water in Pantabangan storage dam. The hydropower generation is conducted based on the diversion water requirement of UPRIIS.
(3) Casecnan Hydropower Plant
Casecnan hydropower plant is located at outlet of Casecnan trans-basin tunnel with 26km in length (see Annex-F H.2.4.1). The installed capacity is 150MW. The hydropower generation relies on the trans-basin water transfer. The trans-basin scheme is operated by California Energy Casecnan Water and Energy Company, Inc. (CEWEC) based on a Build-Operate-Transfer (BOT) Agreement between NIA and CEWEC. NIA has to pay CEWEC an initial Water Delivery Fee of roughly 1.0billion pesos annually as guarantees to obtain all water by the trans-basin scheme for twenty (20) years from 200126).
H.2.4.3 Proposed Hydropower Plants
There are proposed installations of hydropower plant in the following proposed multi-purpose water resources development projects.
Balintingon Reservoir Multipurpose Project
Installed capacity = 30MW, Expected generated power = 119.6GWh/year
Balog-Balog Multipurpose Project
Installed capacity = 43.5MW, Expected generated power = 103.12GWh/year
After completion of the projects, it is expected that the installed capacity of 73.5MW will be added to the Luzon grid.
H.2.5 Water Resources Development, Allocation and Distribution in Angat-Umiray System
H.2.5.1 General
The water resources development such as construction of storage dams in Pampanga river basin has been implemented in order to increase the usable water volume even in a dry season or a drought year. The water resources development has successfully brought about tremendous benefit to a lot of people and regional economic growth. Irrigation in the study area has expanded very much. The developed water resources are even being utilized by the population outside the basin as a source of municipal use. Metro Manila which is the capital city of the Philippines sources its water supply from Angat-Umiray system.
However, the increase of water demand, especially for Metro Manila, requires more usable water volume in a stable manner. Recently, the water shortage becomes more serious than before due to the increase of water demand. This frequently happens in Angat-Umiray system. In this section, the water resources development and management as well as the condition of water shortage in Angat-Umiray system is focused.
H.2.5.2 Angat-Umiray System
Angat storage dam with a height of 131 meters was constructed in 1967, and its operation started in 1968. The catchment area of Angat storage dam is 546km2. The live storage volume of Angat storage dam is 894 MCM of which 696 MCM can be used for municipal and irrigation water supply and hydropower generation (see Annex-F H.2.3.1).
Ipo Dam is located at the downstream of Angat storage dam to divert water for municipal use by Metro Manila. To supply water to Ipo Dam from Angat storage dam, the following facilities are used (see Annex-F H.2.4.1):
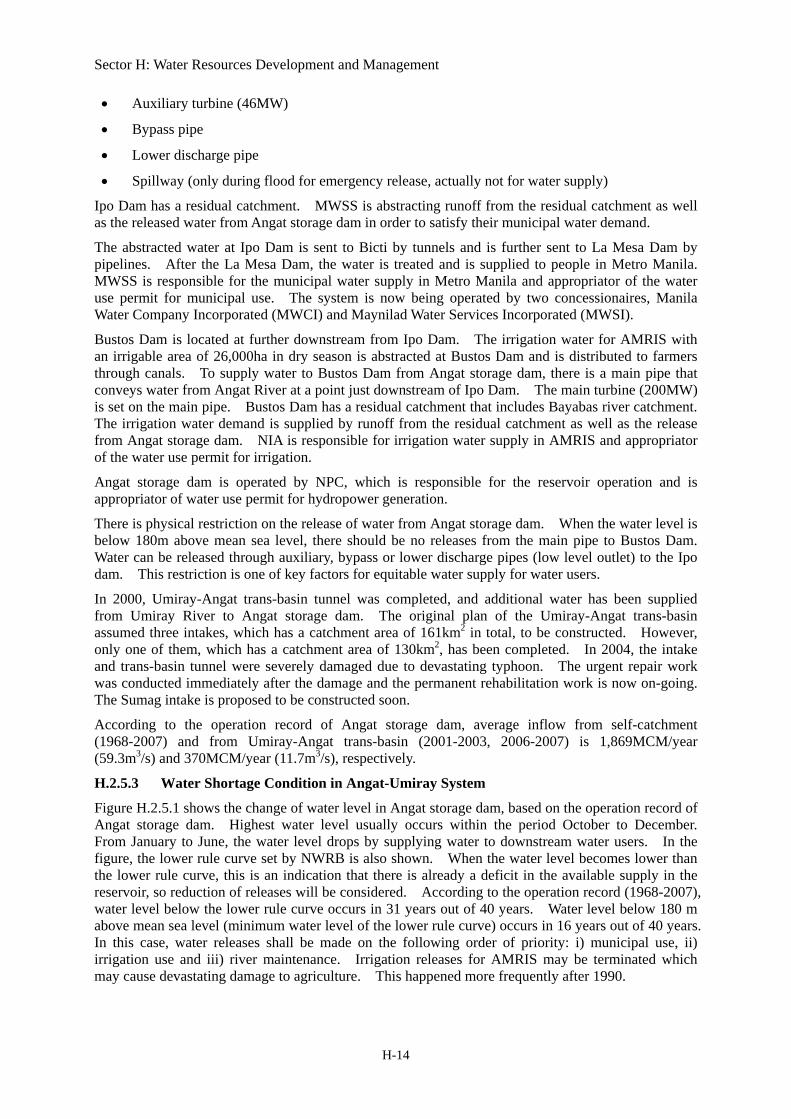
Sector H: Water Resources Development and Management
H-14
Auxiliary turbine (46MW)
Bypass pipe
Lower discharge pipe
Spillway (only during flood for emergency release, actually not for water supply)
Ipo Dam has a residual catchment. MWSS is abstracting runoff from the residual catchment as well as the released water from Angat storage dam in order to satisfy their municipal water demand.
The abstracted water at Ipo Dam is sent to Bicti by tunnels and is further sent to La Mesa Dam by pipelines. After the La Mesa Dam, the water is treated and is supplied to people in Metro Manila. MWSS is responsible for the municipal water supply in Metro Manila and appropriator of the water use permit for municipal use. The system is now being operated by two concessionaires, Manila Water Company Incorporated (MWCI) and Maynilad Water Services Incorporated (MWSI).
Bustos Dam is located at further downstream from Ipo Dam. The irrigation water for AMRIS with an irrigable area of 26,000ha in dry season is abstracted at Bustos Dam and is distributed to farmers through canals. To supply water to Bustos Dam from Angat storage dam, there is a main pipe that conveys water from Angat River at a point just downstream of Ipo Dam. The main turbine (200MW) is set on the main pipe. Bustos Dam has a residual catchment that includes Bayabas river catchment. The irrigation water demand is supplied by runoff from the residual catchment as well as the release from Angat storage dam. NIA is responsible for irrigation water supply in AMRIS and appropriator of the water use permit for irrigation.
Angat storage dam is operated by NPC, which is responsible for the reservoir operation and is appropriator of water use permit for hydropower generation.
There is physical restriction on the release of water from Angat storage dam. When the water level is below 180m above mean sea level, there should be no releases from the main pipe to Bustos Dam. Water can be released through auxiliary, bypass or lower discharge pipes (low level outlet) to the Ipo dam. This restriction is one of key factors for equitable water supply for water users.
In 2000, Umiray-Angat trans-basin tunnel was completed, and additional water has been supplied from Umiray River to Angat storage dam. The original plan of the Umiray-Angat trans-basin assumed three intakes, which has a catchment area of 161km2 in total, to be constructed. However, only one of them, which has a catchment area of 130km2, has been completed. In 2004, the intake and trans-basin tunnel were severely damaged due to devastating typhoon. The urgent repair work was conducted immediately after the damage and the permanent rehabilitation work is now on-going. The Sumag intake is proposed to be constructed soon.
According to the operation record of Angat storage dam, average inflow from self-catchment (1968-2007) and from Umiray-Angat trans-basin (2001-2003, 2006-2007) is 1,869MCM/year (59.3m3/s) and 370MCM/year (11.7m3/s), respectively.
H.2.5.3 Water Shortage Condition in Angat-Umiray System
Figure H.2.5.1 shows the change of water level in Angat storage dam, based on the operation record of Angat storage dam. Highest water level usually occurs within the period October to December. From January to June, the water level drops by supplying water to downstream water users. In the figure, the lower rule curve set by NWRB is also shown. When the water level becomes lower than the lower rule curve, this is an indication that there is already a deficit in the available supply in the reservoir, so reduction of releases will be considered. According to the operation record (1968-2007), water level below the lower rule curve occurs in 31 years out of 40 years. Water level below 180 m above mean sea level (minimum water level of the lower rule curve) occurs in 16 years out of 40 years. In this case, water releases shall be made on the following order of priority: i) municipal use, ii) irrigation use and iii) river maintenance. Irrigation releases for AMRIS may be terminated which may cause devastating damage to agriculture. This happened more frequently after 1990.

Sector H: Water Resources Development and Management
H-15
The most severe water shortage occurred in 1998. The water level at the end of 1997 did not recover at all unlike usual years, because of extremely small rainfall amount in the wet season in 1997. Irrigation releases to AMRIS were cut off from February to October 1998 and releases for municipal water supply were substantially reduced. In 2004 irrigation releases were again temporarily suspended from May to August 2004 due to deficit in municipal water supply. In 2005, NIA submitted its claim for compensation package to the NWRB against MWSS/or its concessionaires for the loss of ISF and income from palay production due to suspension of their irrigation releases. A Technical Working Group was formed to settle the issue and it was recommended thru the NWRB Board for NIA to file their claim directly with the Office of the Government Corporate Counsel, the office mandated to settle or adjudicate claims, disputes and controversies between two government-owned-and –controlled-corporations. However, this issue is not yet resolved to date.
150
160
170
180
190
200
210
220
230
Jan-
68
Jan-
69
Jan-
70
Jan-
71
Jan-
72
Jan-
73
Jan-
74
Jan-
75
Jan-
76
Jan-
77
Jan-
78
Jan-
79
Jan-
80
Jan-
81
Jan-
82
Jan-
83
Jan-
84
Jan-
85
Jan-
86
Jan-
87
Jan-
88
Jan-
89
Jan-
90
Jan-
91
Jan-
92
Jan-
93
Jan-
94
Jan-
95
Jan-
96
Jan-
97
Jan-
98
Jan-
99
Jan-
00
Jan-
01
Jan-
02
Jan-
03
Jan-
04
Jan-
05
Jan-
06
Jan-
07
Water LevelLower Rule Curve
Wat
erle
velin
Ang
atst
oarg
eda
m(m
)
Source: NPC (arranged by JICA Study Team)
Figure H. 2.5.1 Change in Water Level in Angat Storage Dam
H.2.5.4 Water Resources Potential in Angat-Umiray System
Mean annual average discharge at Bustos dam without and with Angat-Umiray trans-basin are estimated at 74m3/s and 85m3/s, respectively.
The total usable water volumes at Bustos dam and Ipo dam with safety level of 1/5years (equivalent to 80% reliability) is estimated at 64.2m3/s and 62.6m3/s, respectively, based on a simple water balance calculation described in Chapter H.3.1.
H.2.5.5 Complicated Situation on Water Use Permit and Water Allocation
The allocation of water in Angat-Umiray system is complicated. The water use permits have been historically granted to several water users. However, the actual allocation now is based on the resolutions issued from time to time. The latest water allocation at upstream of Bustos Dam is as follows.
NIA: 40m3/s (25m3/s when the conditionally allocated 15m3/s to MWSS is subtracted.)
MWSS: 46 m3/s
20.1 m3/s from Angat dam
10.9 m3/s from Umiray
15 m3/s from unutilized irrigation water (conditional allocation)
Bulacan:5.396 m3/s (Not yet actually abstracted)
1.9 m3/s from Angat dam (will be abstracted soon)
3.496 m3/s at proposed Bayabas dam site (not yet abstracted)
NPC: 58 m3/s (non-consumable)

Sector H: Water Resources Development and Management
H-16
Environmental flow =1.9 m3/s (10% of dependable flow for quasi-natural condition)
Figure H.2.5.2 shows the granted water use permits and the latest water allocation in Angat-Umiray system. The relationship between the granted water use permits and the resolutions issued are sometimes unclear as indicated in the figure.
The most senior water use permit is No.6504 for NIA (40m3/s) at Bustos Dam, which was registered in 1927 and was granted in 1979. The second is No.6508 and 6509 for MWSS (13.660m3/s in total) at Angat and Ipo Dams, 9.495m3/s of which was registered in 1967. NPC also obtained the water use permit No.6512 with 58 m3/s in 1979 based on the registration of water use in 1967.
The water allocation to MWSS has been increasing, responding to the increase of the water demand of MWSS. The increase of the allocation has been possible by issuing the series of resolution, which may be prior to the granted water use permit.
Angat River
Bayabas River
Proposed Bayabasstorage dam
Ipo dam
Angat storage dam
Bustos dam
Umiray
Umiray River
Allocation1. ENV=22. NIA=40
Water PermitMWSS Total =35.1 or 28.66 (???)2.MWSS=9.494 (No6508) at Angat dam3.MWSS=4.166 (No6509) at Ipo dam6.MWSS=15 (No11462) at Angat dam
→ MWSS=20.1 +15 (conditional) (by Res016‐0806: amend to Res02‐0389 which confirms allocation of 22m3/s to MWSS based on the MOU in 1962 between NAPCOR and MWSS. There exists no official document to clarify if the Res02‐0389 to determine the allocation of 22m3/s without water permit is the amendment to the water permits of No.6508 and 6509 or not. )
Bulacan Total =1.99. Bulacan=1.9(No20950) at Angat dam
Water PermitNIA Total =401. NIA=40(No6504) at Bustos
Water PermitMWSS Total=14.4765. MWSS=14(No7359)
→ 10.9 (amended by Res016‐0806)
7.MWSS=3.576(No14202)
Water PermitBulacan Total =3.496 (wet season)8. Bulacan=3.496(No19363)
Allocation1.MWSS=35.12. Bulacan=1.9
Allocation1.MWSS=10.9
Inter‐basin Transfer
MOU (1992) among MWSS, LWUA, BulacanBulacan will receive 2.7m3/s from MWSS by Umiray-Angat transbasin project..
By Res016-0806, 1.9m3/s has alreadybeen given to Bulacan, and exchangedwith the MWSS water permit in Angat.
Based on Water Permit (No.11462), 15m3/s is granted to MWSS with no conditional restriction.However, the resolutions (Res03-0188amend and 016-0806) states that the 15m3/s is conditionally allocated to MWSS only when AMRIS does not use it.
Water PermitNPC Total=584. NPC=58(No6521)
Source: JICA Study Team based on related Water Use Permits, Resolutions, MOUs and MOAs
Figure H. 2.5.2 Water Use Permits and Water Allocation in Angat-Umiray System
In 1988, following the result by Angat Water Supply Optimization Project (AWSOP), 15m3/s from the granted water use permit of NIA (No.6504) was conditionally reallocated to MWSS by issuing Resolution No.03-0188(amendment). The “conditional” means that MWSS can use up to a maximum of 15m3/s from Angat storage dam out of unutilized water intended for irrigation of AMRIS. In the same year, water use permit No.11462 (15m3/s) at Angat storage dam was granted to MWSS without any conditional restriction, although the Resolution No.03-0188 allowed only conditional reallocation.
In 1989, the Resolution No.02-0389 was issued to confirm the allocation of 22 m3/s to MWSS at Angat storage dam, based on the MOU in 1962 between NAPCOR(NPC) and MWSS. No water use permit for 22m3/s has been issued to MWSS and there is no official document to clarify if the Resolution No.02-0389 is an amendment of water use permits of No. 6508 and 6509 or not. With this, the total water allocation to MWSS increased to 37 m3/s including 15 m3/s conditional allocation, although total water rights of MWSS at Ipo Dam is 28.66 m3/s.

Sector H: Water Resources Development and Management
H-17
The water use permits in Umiray River have been issued separately from the complicated Angat case. Water use permit No.7359 (14m3/s) and No.14202 (3.576m3/s) were granted to MWSS in 1980 and 1994, respectively, which is 17.576m3/s in total. After completion of Umiray-Angat trans-basin project in 2000, MWSS started to claim that 9m3/s is allocated from the transferred water from Umiray River to satisfy their water demand from Ipo Dam. By this, the total water allocation to MWSS became to 46m3/s including 15m3/s conditional allocation. There was no resolution issued on this matter.
In 2006, the Resolution No.016-0806 was issued to amend the Resolution No.02-0389 and water use permit No.7359. The latest water allocation is based on the Resolution No.016-0806. At the same time, water use permit No.20950 (1.9m3/s) at Angat storage dam was granted to Bulacan Government. This grant is based on the MOU among MWSS, LWUA, and Bulacan Government in 1992, which states that Bulacan Government would receive 2.7m3/s from MWSS by Umiray-Angat trans-basin project. From the water use permit No.7359 to MWSS, 1.9m3/s was given to Bulacan Government and was exchanged with the water allocation of 22m3/s to MWSS in Angat storage dam. As a result, the allocation to MWSS at Angat storage dam was reduced to 20.1m3/s and the allocation from the transferred water from Umiray River was increased to 10.9 m3/s, so that the total allocation to MWSS does not change from 46 m3/s.
Bulacan Government was granted the water use permit No.19363 (3.496m3/s in wet season) at proposed Bayabas dam site in 2004.
After 1995, the resolutions that are related to water allocation or short-term temporal water allocation issued fifty five (55) times. The short-term temporal water allocation is determined almost on a monthly basis in a dry year. It usually reduces the allocation to AMRIS more so that the water supply to MWSS is assured considering the higher priority of municipal water use in emergency cases.
H.2.5.6 Diversion Water Requirement in AMRIS
The water use permit granted to AMRIS is 40m3/s at Bustos Dam. The 15m3/s is now conditionally allocated to MWSS. However, the annual average of the actual water demand for irrigation (irrigation diversion requirement) for AMRIS at Bustos Dam is less than 25m3/s (40-15 m3/s). The diversion water requirement in AMRIS in the driest month for the existing irrigation area would be as much as 40m3/s. However, much smaller water is required in wet season.
The study team tentatively estimated the diversion water requirement in AMRIS, based on the information given by NIA that shows the irrigation area of 26,000ha and 20,355ha in dry and wet seasons, respectively. The estimated annual average diversion water requirement is 19.2m3/s. The monthly variation of the estimated diversion water requirement in the present study is demonstrated in Table H.2.5.1 and Figure H.2.5.3. In the table and figure, the adjusted diversion water requirement used in the other studies, the adjusted historical diversion water volume, and the diversion water requirement claimed by NIA are also shown. The adjusted historical diversion water volume is calculated using the actual diversion volume and the irrigated area. The estimated annual average diversion water requirement by the study team is almost equal to the adjusted historical diversion water volume. It should be noted that the diversion water requirement claimed by NIA does not consider effective rainfall. Although estimation of effective rainfall is rather a difficult task, it can be judged that computation of irrigation diversion water requirement (IDR) without the effective rainfall parameter will result to a big amount of IDR which is not to be considered as the right amount of IDR especially during wet season.

Sector H: Water Resources Development and Management
H-18
Table H. 2.5.1 Diversion Water Requirement in AMRIS
Remarks Jan Feb Mar Apr May Jun Jul Aug Sep Oct Nov Dec Average
The Study
Estimated based on NIA's
estimate, taking effective
rainfall into consideration
(Rainfall = 80% dependable)
26,000 ha (Dry)
20,355 ha (Wet)
41.3 41.7 32.2 9.7 0.0 25.5 9.9 1.2 5.4 10.1 18.8 34.2 19.2
Adujsted Umiray‐
Angat Transbasin
F/S Study, 1992
Avergae histrical diversion
(1978‐1987)
26,000ha (Dry)
20,355ha (Wet)
33.0 30.9 25.7 13.3 4.9 13.2 15.5 11.8 16.0 13.0 23.6 32.8 19.5
Adjusted Pre‐F/S
for additional
water supply to
AMRIS, 1994
Irrigation effciency =45% for
wet and dry season
26,000ha (Dry)
20,355ha (Wet)
34.0 38.7 19.2 0.6 0.0 0.0 0.9 0.6 1.4 0.0 21.6 29.3 12.2
Avergae histrical
diversion
(1980‐2008)
26,000ha (Dry)
20,355ha (Wet)32.7 31.9 25.6 12.2 3.7 11.1 16.2 13.6 15.4 12.0 16.9 29.4 18.4
NIA
No effective rainfal l
26,000ha (Dry)
20,355ha (Wet)42.6 42.7 34.4 9.8 0.0 18.0 31.3 32.9 34.0 24.7 19.0 39.5 27.4
Note: 1) Unit: m3/s, 2) To calculate the adjusted values, the unit water demand (m3/s/ha) is firstly calculated and then
the water demand for the necessary irrigation area is calculated. 3) According to NIA, the record of intake volume may include some errors (up to 20%).
Source: JICA Study Team
0.0
5.0
10.0
15.0
20.0
25.0
30.0
35.0
40.0
45.0
Jan Feb Mar Apr May Jun Jul Aug Sep Oct Nov Dec
Demend (m
3/s)
Month
This StudyAdjusted Umiray‐Angat transbasin F/S, 1992 (Average histrical diversion(1978‐1987)Adjusted Pre‐F/S by WB, 1994Adjusted average histrical diversion (1980‐2008)NIA (No effective rainfall)
Source: JICA Study Team
Figure H. 2.5.3 Diversion Water Requirement in AMRIS
H.2.5.7 Preliminary Comparison between Water Allocation and Water Resources Potential
The total water allocation at upstream of Bustos Dam is calculated at 93m3/s (78m3/s when 15m3/s conditional allocation to MWSS is subtracted). On the other hand, mean annual average discharge at Bustos Dam with Umiray-Angat trans-basin is 85m3/s. The total water allocation (excluding 15m3/s

Sector H: Water Resources Development and Management
H-19
conditional allocation to MWSS) is slightly smaller than the annual average discharge at Bustos Dam. However, the total water allocation is much larger than 64.2 m3/s that is the total usable water volumes at Bustos Dam with safety level of 1/5years (equivalent to 80% reliability).
The study team tentatively estimated the water demand for AMRIS to be 19.2m3/s in annual average, as shown in the previous section. In this case, total available municipal water supply for MWSS with 1/5years safety level is estimated at about 41m3/s without considering water use permit to Bulacan Government at the proposed Bayabas Dam site. This means that the conditional allocation of 15m3/s is not possible to be fully supplied to MWSS with 1/5years safety level.
In the AWSOP, the water demand of AMRIS was assumed to be about 12m3/s in annual average. In this case, available municipal water supply for MWSS with 1/5years safety level is estimated at about 48m3/s without considering water use permit to Bulacan Government that has not started abstraction yet. This means that the conditional allocation of 15m3/s is possible to be fully supplied to MWSS with 1/5years safety level.
The judgment of AWSOP that 15m3/s could be reallocated to MWSS is supported only when the water demand of AMRIS is less than about 12m3/s in annual average. Actual situation is somehow different, however. The present water resources potential in Angat-Umiray system is not enough to supply all allocation with 1/5years safety level even if the actual water demand of AMRIS is taken into account.
H.2.5.8 Evaluation of Present Reliability of Water Supply
In order to examine the water balance for surface water in the study area in detail, MODSIM model26), which has been developed in Colorado State University, is introduced in the present study. The details are described in Chapter H.3.3. The following conditions are assumed for the simulation.
Municipal water demand at Ipo Dam = 46m3/s (for MWSS)
Water demand of AMRIS =19.2m3/s in annual average (Monthly variation shown in Table H.2.5.1 is considered.)
The results of the water balance simulation on the present Angat-Umiray system are as follows.
(1) Case 1
Conditions
No lower rule curve is considered.
The restriction of release for storage volume lower than 180m above mean sea level is removed.
Results
Safety level of AMRIS = 1/4years (14 shortages in 50 years)
Safety level of MWSS = 1/4years (12 shortages in 50 years)
(2) Case 2
Conditions
No lower rule curve is considered.
The restriction of release for storage volume lower than 180m above mean sea level is not removed.
Results
Safety level of AMRIS = less than 1/2years (31 shortages in 50 years)
Safety level of MWSS = 1/10years (5 shortages in 50 years)
As expected by the preliminary comparison shown in the previous section, the reliability of water supply for both AMRIS and MWSS is less than 1/5years safety level (equivalent to 80% reliability)

Sector H: Water Resources Development and Management
H-20
even if the restriction of release for storage volume lower than 180m above mean sea level is removed. It is again confirmed that the present water resources potential in Angat-Umiray system is not enough to supply all allocation with 1/5years safety level.
It is also an important finding that the restriction of release for storage volume lower than 180m above mean sea level makes significant difference of the reliabilities of water supply for AMRIS and MWSS. The reliability of water supply for AMRIS becomes less than 1/2years if the restriction is not removed, which may not be acceptable at all for farmers in AMRIS. The reliability of water supply for MWSS becomes more than 1/10years (equivalent to 90% reliability) instead. This is something like a hidden unintentional trick and seems to be too unfair.
However, it is also understandable that with the present situation, sharing equally all the storage volume at water level below 180 meters by both MWSS and AMRIS will put the sustainability of drinking water for Metro Manila at risk. The water source in Angat-Umiray system is the only major source for the municipal water supply in Metro Manila. It is really necessary to develop additional/alternate source of municipal water supply for Metro Manila for a reliable water supply for both farmers in AMRIS and the people of Metro Manila.
H.2.5.9 Preparation against Extreme Flood and Flood Control Function in Angat Storage Dam
Flood control is one of the functions of Angat storage dam through a flood operation rule. The flood operation rule is being implemented by the NPC, the owner and operator of the dam in coordination with PAGASA. Implementation of such rule must consider the water allocation for irrigation and municipal water supply by the NWRB. The proposed flood operation rule27) in 1984 has not yet been approved officially in the JOMC. However, it has long been applied practically. NWRB also sets the upper rule curve to specify the flood control volume by following the proposed flood operation rule in 1984.
There are important elevations in the proposed flood operation rule in 1984. The most important one is the surcharge elevation which is set at 213m above mean sea level. The surcharge elevation is usually set considering the safety of dam itself, and is not related to the flood control. The storage volume above the surcharge elevation must be released in order to prevent the dam from overtopping and collapsing. Releases must be conducted by keeping all the spillway gates fully opened until the inflows decrease to be equal with the dam discharge. The surcharge water level of 213 m above mean sea level must not be increased unless the PMF (Probable Maximum Flood) becomes smaller or capacity of spillway increases (both cases seldom happen).
The other important elevations are NHWL (Normal High Water Level) and FSHWL (Flood Season High Water Level). These determine the flood control volume during wet season (May 1 to November 30). The NHWL and FSHWL are set at 212m and 210m above mean sea level, respectively, which corresponds to the upper rule curve by NWRB. The storage volume between 210m and 212m above mean sea level is 42MCM. This volume is utilized for reducing peak discharge downstream of the Angat storage dam so that the flood condition is mitigated at the downstream reach.
Surprisingly, the AWSOP and other previous studies often assumed that the upper rule curve be 212m above mean sea level for wet season and 214m above mean sea level for dry season. The elevation of 214m above mean sea level is higher than the surcharge elevation set in the proposed flood operation rule in 1984. One should be aware that setting the upper rule curve higher than the proposed surcharge elevation is a matter of dam safety itself and is not a matter of flood control. It should be more carefully discussed because of the risk of dam collapse.
There is no flood control master plan in Angat River, which means that the design flood discharge in Angat River considering the flood control effect by the Angat storage dam has not yet been well defined. The proposed flood operation rule in 1984 does not show clearly the effect of the Angat storage dam on reducing the peak flood discharge. However very rough estimate by the study team was conducted as follows for further discussion:
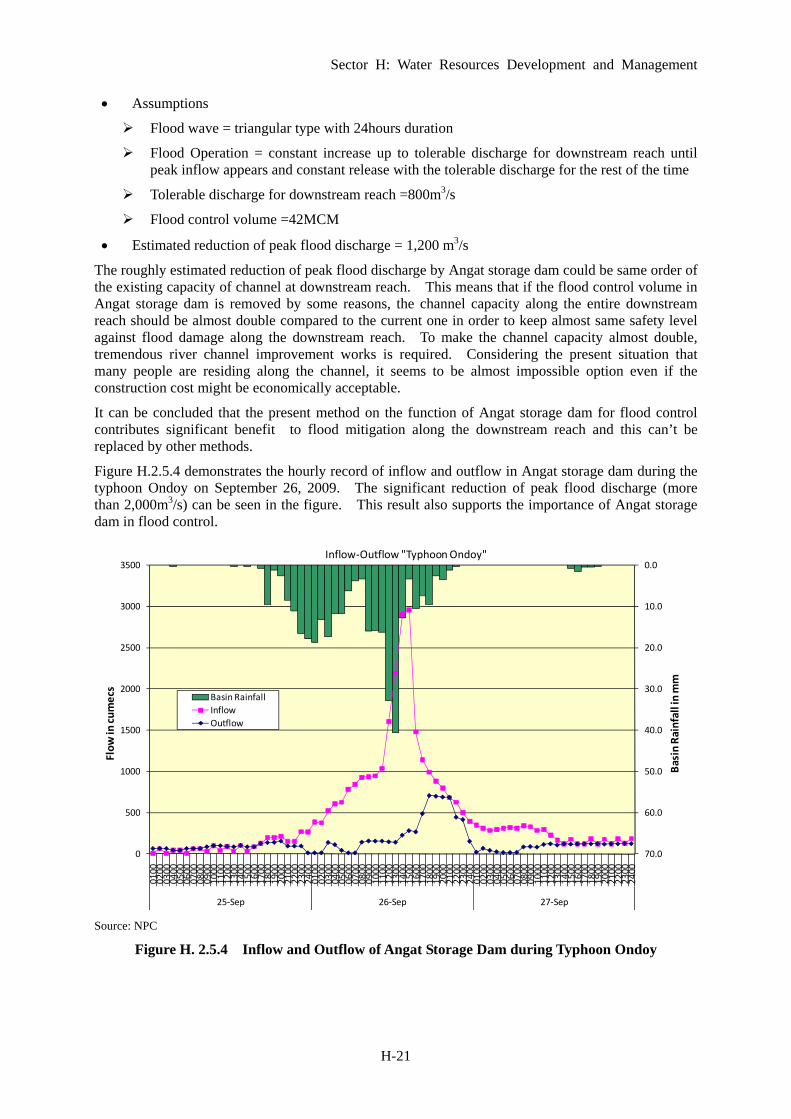
Sector H: Water Resources Development and Management
H-21
Assumptions
Flood wave = triangular type with 24hours duration
Flood Operation = constant increase up to tolerable discharge for downstream reach until peak inflow appears and constant release with the tolerable discharge for the rest of the time
Tolerable discharge for downstream reach =800m3/s
Flood control volume =42MCM
Estimated reduction of peak flood discharge = 1,200 m3/s
The roughly estimated reduction of peak flood discharge by Angat storage dam could be same order of the existing capacity of channel at downstream reach. This means that if the flood control volume in Angat storage dam is removed by some reasons, the channel capacity along the entire downstream reach should be almost double compared to the current one in order to keep almost same safety level against flood damage along the downstream reach. To make the channel capacity almost double, tremendous river channel improvement works is required. Considering the present situation that many people are residing along the channel, it seems to be almost impossible option even if the construction cost might be economically acceptable.
It can be concluded that the present method on the function of Angat storage dam for flood control contributes significant benefit to flood mitigation along the downstream reach and this can’t be replaced by other methods.
Figure H.2.5.4 demonstrates the hourly record of inflow and outflow in Angat storage dam during the typhoon Ondoy on September 26, 2009. The significant reduction of peak flood discharge (more than 2,000m3/s) can be seen in the figure. This result also supports the importance of Angat storage dam in flood control.
0.0
10.0
20.0
30.0
40.0
50.0
60.0
70.00
500
1000
1500
2000
2500
3000
3500
0100
0200
0300
0400
0500
0600
0700
0800
0900
1000
1100
1200
1300
1400
1500
1600
1700
1800
1900
2000
2100
2200
2300
2400
0100
0200
0300
0400
0500
0600
0700
0800
0900
1000
1100
1200
1300
1400
1500
1600
1700
1800
1900
2000
2100
2200
2300
2400
0100
0200
0300
0400
0500
0600
0700
0800
0900
1000
1100
1200
1300
1400
1500
1600
1700
1800
1900
2000
2100
2200
2300
2400
25‐Sep 26‐Sep 27‐Sep
Basin Rainfall in mm
Flow in cumecs
Inflow‐Outflow "Typhoon Ondoy"
Basin Rainfall
Inflow
Outflow
Source: NPC
Figure H. 2.5.4 Inflow and Outflow of Angat Storage Dam during Typhoon Ondoy
Sector H: Water Resources Development and Management
H-22
H.2.5.10 Hydropower Generation in Angat Hydropower Plant
Figure H.2.5.5 shows the generated power by the main unit and the auxiliary unit from 1996 to 2007, based on the operation record of Angat hydropower plant. The auxiliary unit produces relatively stable power compared to the main unit, which is supported not only by the almost constant demand required by MWSS but also by higher priority given to MWSS in a drought condition. The average annual powers produced by the main unit and the auxiliary unit are 252GWh/year and 184GWh/year, respectively, although the installed capacity of the main unit is about four times larger than that of the auxiliary unit.
0
10,000
20,000
30,000
40,000
50,000
60,000
70,000
80,000
90,000
100,000
Jan-96 Jan-97 Jan-98 Jan-99 Jan-00 Jan-01 Jan-02 Jan-03 Jan-04 Jan-05 Jan-06 Jan-07
Main UnitAuxiliary Unit
Gen
erat
edP
ower
(MW
h)
Source: NPC (arranged by JICA Study Team)
Figure H. 2.5.5 Power Generation by Main Unit and Auxiliary Unit in Angat Hydropower Plant
Figure H.2.5.6 shows the averaged monthly variation of total power generation in Angat hydropower plant during 1996 - 2007. It can be seen that the power generation is relatively high during October to March and low in April to September in general.
0
20,000
40,000
60,000
80,000
100,000
120,000
140,000
Jan Feb Mar Apr May Jun Jul Aug Sep Oct Nov Dec
Gen
erat
edP
ower
(MW
h)
Average
Maximum
Minimum
Source: NPC (arranged by JICA Study Team)
Figure H. 2.5.6 Monthly Power Generation in Angat Hydropower Plant
In the Luzon Grid peak demands usually happen during summer time. In case of more contributions of Angat hydropower plants to peak demands using the main unit with relatively high installed capacity, fluctuation of discharges due to peak operations may be explored. The peak operation can generate higher peak power with same released water volume in a creation time period. It has, in fact, already been implemented somehow in Angat hydropower plant. As shown in Figure H.2.5.7, the typical hourly operation record in 2008 shows that the main unit is operated only in daytime and little water is released during the night. According to NPC, this is because of the requirement from the provisions of Electric Power Industry Reform Act (EPIRA) and its IRR on WESM system, to which Angat hydropower plant is registered. If the capacity of the existing Bustos dam and Ipo dam is not

Sector H: Water Resources Development and Management
H-23
enough to re-regulate the fluctuating discharges, the released water cannot be effectively utilized for its intended purposes such as irrigation and municipal water supply.
0.0
10.0
20.0
30.0
40.0
50.0
60.0
70.0
80.0
90.0 0-
11-
22-
33-
44-
55-
66-
77-
88-
99-
1010
-11
11-1
212
-13
13-1
414
-15
15-1
616
-17
17-1
818
-19
19-2
020
-21
21-2
222
-23
23-2
4
Dis
ch
arg
e (m
3/s
)
Hour
Main
Aux
January 25, 2008
Average =40.5m3/s
Average =20.6m3/s
0.0
10.0
20.0
30.0
40.0
50.0
60.0
70.0
80.0
90.0
100.0
0-1
1-2
2-3
3-4
4-5
5-6
6-7
7-8
8-9
9-10
10-1
111
-12
12-1
313
-14
14-1
515
-16
16-1
717
-18
18-1
919
-20
20-2
121
-22
22-2
323
-24
Dis
ch
arg
e (m
3/s
)
Hour
Main
Aux
July 25, 2008
Average =33.1m3/s
Average =25.5m3/s
Source: NPC (arranged by JICA Study Team)
Figure H. 2.5.7 Typical Hourly Operation in Angat Hydropower Plant
New Angat Operation Rules which was recently approved by the NWRB Board in December 10, 2009 provides that the reservoir operational plans shall be prepared by the TWG on Angat Dam Operation and Management and approved by the NWRB for more efficient management of the reservoir and for stable water supply. Likewise, all water releases from the reservoir, in principle, shall be made by turbine discharges recommended by the TWG and approved by the NWRB, except when water level is above the NHWL. With this rule, issues on peak releases will be addressed and there will be maximization of the utilization of water resources potential in Angat – Umiray System.
H.2.5.11 Future Municipal Water Supply and Demand in MWSS Service Area
MWSS is serving the municipal water supply for Metro Manila and a part of the Provinces of Rizal and Cavite through its water service providers, Manila Water Company, Inc (MWCI) and Maynilad Water Services Inc. (MWSI). MWSS’s service areas are located out of Pampanga river basin, while their present major water source is Angat-Umiray system located in the river basin, which stores the runoff discharge of Angat River and Umiray River.
The supply of 46m3/s from Angat-Umiray system has been frequently unstable, as discussed in the previous section. There is water use conflict between the MWSS and NIA in Angat-Umiray system due to limited supply. Both MWSS and NIA have agreed to seek the additional water sources to stabilize the water supply from Angat-Umiray system. According to MWSS29), the following water sources are under investigation.
Proposed Balintingon storage dam in Balintingon multi-purpose project and conveyance to AMRIS area: Pre- F/S completed in 2006
Direct abstraction of surface water of Pampanga river at around Apalit and conveyance by pumps to AMRIS area: under investigation
Candaba River: (details unknown)
There was a proposal in 1994 for additional water sources for the Angat-Umiray system by a pre-F/S level study prepared by NIA, NWRB and World Bank. The Bayabas and Maasim storage dams were proposed to be constructed. They are, however, not included in the alternatives shown by MWSS. The promising additional sources have not yet been found.
Umiray-Angat trans-basin tunnel was damaged by the devastating flood in November, 2004. The rehabilitation work including a renovation of operation facilities for intake-conveyance system from

Sector H: Water Resources Development and Management
H-24
Umiray River is on-going and will be completed by 201130). This rehabilitation work is crucial for water supply to Metro Manila. In Umiray-Angat trans-basin project, three intakes are originally planned to be constructed. However, only one intake has been completed. If the remaining two intakes are completed, the inflow from Umiray-Angat trans-basin tunnel could be increased with about 20% of the current inflow, based on the catchment areas of the intakes.
The current supply capacity of Angat-Umiray system is not sufficient for the future water demand of the MWSS’s service area, even if the supply of 46m3/s from Angat-Umiray system will be stabilized. In order to cope with the inadequate supply capacity, the MWSS has prepared a water supply, sewerage, and sanitation master plan for Metro Manila in year 200531). In accordance with the master plan, MWSS projects for future water demand and the corresponding water supply sources up to year 2025 is shown in Figure H.2.5.8. The future additional water supply to MWSS’s service area is to be covered mainly by the water sources in Laiban Dam (1,830MLD) and Kanan No.2 Dam (3,310MLD). In the master plan, alternative long-term water sources are also discussed as shown in Table H.2.5.2. The additional interim water sources are proposed to be Putatan, Sumag and Treated Bulk Water. The option for the Sumag is to utilize the remaining intakes on Umiray River. Other options are located out of Pampanga river basin. Considering the current unstable water supply condition in the Angat-Umiray system, the water requirement of MWSS from the system should not exceed 46m3/s even after the completion of the Sumag project.
3,000
3,500
4,000
4,500
5,000
5,500
6,000
6,500
7,000
7,500
8,000
2000 2005 2010 2015 2020 2025 2030
Year
Wat
er
Dem
and
/Su
pply
(m
ld)
WATERDEMAND(mld)
WATERSUPPLY(mld)Angat and Umiray
Sumag =-188 mld
Putatan =1 00 mld
Treated Bulk Water = 300 mld
Laiban Phase 1 =1220 mld
Kanan Dam Phase 1 =1,090mld
Laiban Phase 2 =610 mld
Source: MWSS, SKM Study 2005
Figure H. 2.5.8 Projected Water Demand and Water Supply Sources for MWSS Service Areas
Table H. 2.5.2 Alternative Long-term Water Sources Option Source Combination Scheme Capacity (MLD)
Stage 1 Stage 2 Total 1 Laiban Dam + Kanan No.2 Dam 1,830 3,310 5,110 2 Kaliwa Low Dam + Agos Dam (550)/0 3,000 3,000 3 Agos Dam (alone) 1,500 1,500 3,000 4 Laiban Dam + Agos Dam 1,830 1,500 3,330 5 Kaliwa Low Dam + Kanan No.2 Dam (550)/290 3,310 3,600
Source: MWSS, SKM Study 2005
In addition to the above water resource development plan, MWSS projects to expand its services area to the province of Bulacan. A part of the coastal area of Bulacan currently suffers from the salinity intrusion to the groundwater and lowering of the groundwater level, which causes difficulties in using the groundwater as the source of drinking water. In order to cope with this problem, MWSS has

Sector H: Water Resources Development and Management
H-25
agreed with the provincial government of Bulacan to supply bulk water to the existing water districts. The project would deliver the treated bulk water of 2.7m3/s to the priority cities and municipalities of Bulacan. According to MWSS, the objective cities/municipalities for the bulk water supply project are as follows.
Outside the study area
San Jose Del Monte (Raw water of 50MLD is currently supplied from MWSS.)
Meycauayan, Marilao and Obando (Areas supplied with treated water under MWSI)
Balagtas and Bocaue (Other areas to be served)
Parts of city/municipality are within the study area
Sta.Maria, Guiguito, Malolos, Bulacan, Calumpit (Other areas to be served)
The water source of the 2.7m3/s is not yet known. However as per NWRB resolution no. 015-0816 issued on August 18, 2006, the 1.9m3/s out of 2.7m3/s is allocated to Bulacan government to be sourced from the Angat-Umiray system. The newly developed water source at the Sumag Intake could be utilized for the remaining 0.8 m3/s, based on MOU among MWSS, LWUA and Bulacan Government in 1992.
H.2.5.12 Expected Condition in Near Future
(1) Privatization of Angat Storage Dam
According to NPC, Angat storage dam is going to be sold to a private company by the middle of 2010. The control and regulation of the operation of the dam for both normal and flood condition is one of the important issues to be considered before and after the privatization because the new owner’s priority might be his own benefit or revenue from the dam. Benefits from Angat storage dam must be shared equally by the stakeholders as well as the new owner. Regulations by government agencies seem to be indispensible for operating a multi-purpose storage dam, even if there is the provision of EPRIA and its IRR for a single sector for energy.
(2) Review and Possible Revision of Flood Operation Rule
There is an on-going JICA-assisted capacity building project on Flood Forecasting and Warning System upon Dam Release (2009-2012). The main C/P agency of the project is PAGASA. One of the target dam reservoirs in the project is Angat storage dam. Although the primary purpose of the project is capacity building on flood forecasting and warning, review on the existing flood operation rule including the assessment of PMF could be conducted in the project. Based on the results of the project, it is possible for JOMC to revise the existing flood operation rule.
Considering the recent devastating floods brought by typhoons “Ondoy” and “Pepeng”, there is a possibility for PMF to increase which may require the lowering of the flood rule curve.
(3) Augmentation of Irrigation Water from UPRIIS
According to NIA, the canal improvement and extension works for main canal in UPRIIS division-4 is on-going. The extended main canal is to be connected to lower Maasim diversion dam in Massim River. The improved channel capacity would be about 3m3/s, so that the excess water from UPRIIS division-4 can be supplied to about 2,000ha of AMRIS by gravity through Lower Maasim Dam.
There is excess water in the present condition of UPRIIS, because the expansion of new irrigation area in UPRIIS division-5, which will be implemented by Casecnan Project Phase-2, has not yet been developed. The excess water from UPRIIS can be used to augment irrigation water for AMRIS until new irrigation area in UPRIIS division-5 will be fully developed. After it will be completed, there will be little excess water, especially in a drought year.
Sector H: Water Resources Development and Management
H-26
The augmentation of irrigation water from UPRIIS should be considered as a tentative measure, unless the expansion of new irrigation area in UPRIIS division-5 will be canceled or reduced.
(4) Long-term Water Source Development for MWSS Service Area
According to MWSS master plan in 2005 and project list of MWSS, Laiban Dam is the most promising long-term water source toward 2015. The Laiban dam project is supposed to be implemented by BOT scheme with San Miguel Company. However, MWSS terminated the negotiations for the joint venture proposal of San Miguel Company on March 4, 2010. At this moment, it is very unclear what will be the long-term water source for MWSS service area, especially for 2015. It is expected that any new water source development will already be late to supply the expected demand by 2015 if Laiban dam will not be implemented as it is planned. According to MWSS, as of October 2010, MWSS is still exploring the revised future water demand-supply plan for its service area.
(5) Increase of Water Demand and Proposed Water Resources Development in Angat-Umiray System
MWSS has projected that any amount of water allocation in addition to their present allocation of 46m3/s could not be accommodated by the Angat-Umiray system anymore. However, the proposed Bulacan Treated Bulk Water Supply Project assumes abstraction of 2.7m3/s and the most possible water source of it is from Angat-Umiray system. The municipal water demand from Angat-Umiray system in near future is expected to be 48.7m3/s in total.
The most promising water resources development in Angat-Umiray system in the near future is the Sumag River Diversion Project, which may add 2.2m3/s in an average year to the existing Angat-Umiray system.
(6) Evaluation of Reliability of Water Supply in Near Future
The reliability of water supply in Angat-Umiray system in near future is evaluated by the water balance model using MODSIM under the following conditions.
Municipal water demand at Ipo Dam = 48.7m3/s (46m3/s for MWSS and 2.7m3/s for Bulacan)
Water demand of AMRIS =19.2m3/s in annual average (No change. Monthly variation shown in Table H.2.5.1 is considered.)
Sumag Intake is completed.
There is no change in the upper rule curve.
The simulated results are as follows.
(a) Case 1
Conditions
No lower rule curve is considered.
The restriction of release for storage volume lower than 180m above mean sea level is removed.
Results
Safety level of AMRIS = 1/4years (14 shortages in 50 years)
Safety level of MWSS = 1/4years (13 shortages in 50 years)
(b) Case 2
Conditions

Sector H: Water Resources Development and Management
H-27
No lower rule curve is considered.
The restriction of release for storage volume lower than 180m above mean sea level is not removed.
Results
Safety level of AMRIS = less than 1/2years (31 shortages in 50 years)
Safety level of MWSS = 1/10years (5 shortages in 50 years)
It can be concluded that no significant change from the present condition on the reliability of water supply would be expected even if Bulacan starts its abstraction of 2.7m3/s from Ipo Dam after the completion of Sumag Intake. However, there will still be water shortage in almost every two years.