Embed Size (px)
Citation preview

Section 5.4.3: Risk Assessment – Flood
DMA 2000 Hazard Mitigation Plan – Putnam County, New York 5.4.3-1
February 2015
5.4.3 Flood
This section provides a profile and vulnerability assessment for the flood hazard.
5.4.3.1 Hazard Profile
This section provides profile information including description, location, extent, previous occurrences and
losses and the probability of future occurrences.
Description
Floods are one of the most common natural hazards in the U.S. They can develop slowly over a period of days
or develop quickly, with disastrous effects that can be local (impacting a neighborhood or community) or
regional (affecting entire river basins, coastlines and multiple counties or states) (Federal Emergency
Management Agency [FEMA], 2008). Most communities in the U.S. have experienced some kind of flooding,
after spring rains, heavy thunderstorms, coastal storms, or winter snow thaws (George Washington University,
2001). Floods are the most frequent and costly natural hazards in New York State in terms of human hardship
and economic loss, particularly to communities that lie within flood prone areas or flood plains of a major
water source. As defined in the NYS HMP (NYS DHSES, 2014), flooding is a general and temporary
condition of partial or complete inundation on normally dry land from the following:
Riverine overbank flooding;
Flash floods;
Alluvial fan floods;
Mudflows or debris floods;
Dam- and levee-break floods;
Local draining or high groundwater levels;
Fluctuating lake levels;
Ice-jams; and
Coastal flooding
A floodplain is defined as the land adjoining the channel of a river, stream, ocean, lake, or other watercourse or
water body that becomes inundated with water during a flood. Most often floodplains are referred to as 100-
year floodplains. A 100-year floodplain is not the flood that will occur once every 100 years, rather it is the
flood that has a one-percent chance of being equaled or exceeded each year. Thus, the 100-year flood could
occur more than once in a relatively short period of time. With this term being misleading, FEMA has
properly defined it as the one-percent annual chance flood. This one percent annual chance flood is now the
standard used by most Federal and State agencies and by the National Flood Insurance Program (NFIP)
(FEMA, 2003).
Figure 5.4.3-1 depicts the flood hazard area, the flood fringe, and the floodway areas of a floodplain.

Section 5.4.3: Risk Assessment – Flood
DMA 2000 Hazard Mitigation Plan – Putnam County, New York 5.4.3-2
February 2015
Figure 5.4.3-1. Floodplain
Source: NJDEP, Date Unknown
Many floods fall into three categories: riverine, coastal and shallow (FEMA, 2005). Other types of floods
may include ice-jam floods, alluvial fan floods, dam failure floods, and floods associated with local drainage or
high groundwater (as indicated in the previous flood definition). For the purpose of this HMP and as deemed
appropriate by the Putnam County Planning Committee, riverine/flash flooding and coastal floods are the flood
types of concern for the County. These types of flood or further discussed below.
Riverine/Flash Floods
Riverine floods are the most common flood type. They occur along a channel and include overbank and flash
flooding. Channels are defined, ground features that carry water through and out of a watershed. They may be
called rivers, creeks, streams, or ditches. When a channel receives too much water, the excess water flows over
its banks and inundates low-lying areas (FEMA 2008).
Flash floods are “a rapid and extreme flow of high water into a normally dry area, or a rapid water level rise in
a stream or creek above a predetermined flood level, beginning within six hours of the causative event (e.g.,
intense rainfall, dam failure, ice jam). However, the actual time threshold may vary in different parts of the
country. Ongoing flooding can intensify to flash flooding in cases where intense rainfall results in a rapid surge
of rising flood waters” (National Weather Service [NWS] 2009).
Coastal Flooding
Coastal floods impact communities with ocean shorelines. The lower Hudson River, including the section
bounding Putnam County, is a tidal estuary, whose waters are connected to and influenced by the Atlantic
Ocean. Coastal flooding can result from high tides or storm surges- the abnormal rise of water resulting from
storms such as hurricanes and Nor'Easters. The co-occurrence of a high tide with a storm surge, combining to
form an extraordinarily elevated storm tide, can be particularly hazardous to communities in coastal shore
locations.
Federal Flood Programs
National Flood Insurance Program
The NFIP makes federally backed flood insurance available to homeowners, renters, and business owners in
participating communities. For most participating communities, FEMA has prepared a detailed Flood

Section 5.4.3: Risk Assessment – Flood
DMA 2000 Hazard Mitigation Plan – Putnam County, New York 5.4.3-3
February 2015
Insurance Study (FIS). The study presents water surface elevations for floods of various magnitudes, including
the 1% annual chance flood and the 0.2% annual chance flood (the 500-year flood). Base flood elevations and
the boundaries of the 100- floodplains are shown on Flood Insurance Rate Maps (FIRMs), which are the
principle tool for identifying the extent and location of the flood hazard.
The FIRMs depict SFHAs - those areas subject to inundation from the 1% annual chance flood (also known as
the Base Flood or the 100-Year Flood). Those areas are defined as follows:
Zones A1-30 and AE: SFHAs that are subject to inundation by the base flood, determined using
detailed hydraulic analysis. Base Flood Elevations are shown within these zones.
Zone A (Also known as Unnumbered A-zones): SFHAs where no Base Flood Elevations or depths are
shown because detailed hydraulic analyses have not been performed,.
Zone AO: SFHAs subject to inundation by types of shallow flooding where average depths are
between 1 and 3 feet. These are normally areas prone to shallow sheet flow flooding on sloping
terrain.
Zone VE, V1-30: SFHAs along coasts that is subject to inundation by the base flood with additional
hazards due to waves with heights of 3 feet or greater. Base Flood Elevations derived from detailed
hydraulic analysis are shown within these zones.
Zone B and X (shaded): Zones where the land elevation as been determined to be above the Base
Flood Elevation, but below the 500-year flood elevation. These zones are not SFHAs.
Zones C and X (unshaded): Zones where the land elevation has been determined to be above both the
Base Flood Elevation and the 500-year flood elevation. These zones are not SFHAs.
As of February 28, 2014, there are 380 NFIP policies in Putnam County. Of those policies in Putnam County,
14 are considered repetitive loss (RL) and 2 are considered severe repetitive loss (SRL). To be eligible for the
NFIP, certain criteria must be met and claim payments must have occurred within 10 years of each other. If
there are multiple losses at the same location within 10 days of each other, these claims are counted within one
loss. NFIP information for Putnam County, as of February, 2014 (FEMA, 2014), is shown in the Vulnerability
Assessment portion of this profile.
Flood Insurance Studies (FIS)
In addition to FIRM and Digital Flood Insurance Rate Maps (DFIRM), FEMA also provides FISs for entire
counties and individual jurisdictions. These studies aid in the administration of the National Flood Insurance
Act of 1968 and the Flood Disaster Protection Act of 1973. They are narrative reports of countywide flood
hazards, including descriptions of the flood areas studied, the engineered methods used, principal flood
problems, flood protection measures, and graphic profiles of the flood sources.
A countywide FIS for Putnam County has been completed and is dated March 4, 2013. The following
discussion presents flood information as directly provided in the FEMA FIS document(s).
Village of Brewster – The East Branch Croton River has flooded the Village well fields which are
located near I-84. Tonetta Brook has been the source of problem flooding near the Brewster Railroad
Station.
Town of Carmel – An abandoned race track south of Fair Street was prone to flooding during storm
conditions. Previous flooding has been reported to have reached the level of the track surface.
Wetlands are located in areas to the north of the railroad grade on either side of Michael Brook.
Village of Cold Spring – Flooding in the Village of Cold Spring is caused primarily by backwater
effects (coastal flooding) of the Hudson River in the low-lying areas along the shore.
Section 5.4.3: Risk Assessment – Flood
DMA 2000 Hazard Mitigation Plan – Putnam County, New York 5.4.3-4
February 2015
Town of Patterson – Open areas along the East Branch Croton River, particularly in the vicinity of the
confluence of Muddy Brook, is subject to flooding. Flooding of Route 292 by Muddy Brook
Tributary 1 is also prone to flooding.
Town of Philipstown – After a heavy rainfall, Clove Creek rose five to 10 inches. This rise in channel
height causes abutments of a bridge to erode significantly. The erosion has also continued along
Clove Creek’s overbanks. It was also noted that, at another time, the channel level reached the top of
the bridge behind a restaurant located near U.S. Route 9.
Town of Southeast – The East Branch Croton River near I-84 floods low-lying floodplain areas in the
Town. Tonetta Brook has been the source of flooding along the railroad right-of-way. Holly Stream
causes localized flooding in the areas north of I-684.
Risk Mapping, Assessment, and Planning (Risk MAP)
Risk MAP is a FEMA program that provides communities with flood information and tools to enhance their
mitigation plans and take action to protect their citizens. It builds on flood hazard data and maps produced
during the Flood Map Modernization (Map Mod) program. Through more precise flood mapping products,
risk assessment tools, and planning and outreach support, Risk MAP strengthens local ability to make
informed decisions about reducing risk. It combines quality engineering with state-of-the-art flood hazard data
to assist communities in planning and preventing risk using the most current information.
Risk MAP collaborates with state, tribal, and local governments and delivers quality data that increases public
awareness and leads to action that reduces risk to property and life. Risk MAP focuses on products and
services beyond the traditional FIRMs and works with officials to help put flood risk data and assessment tools
to use. Risk MAP also helps effectively communicate risk to citizens and enable communities to enhance their
mitigation plans and actions (FEMA 2012).
The goals of Risk MAP are as follows:
Flood Hazard Data – addresses gaps in flood hazard data to form a solid foundation for risk
assessment, floodplain management, and actuarial soundness of the NFIP.
Public Awareness/Outreach – ensures that a measurable increase of the public’s awareness and
understanding of risk results in a measurable reduction of current and future vulnerability.
Hazard Mitigation Planning – leads and supports states, local, and tribal communities to effectively
engage in risk-based mitigation planning resulting in sustainable actions that reduce or eliminate risks
to life and property from natural hazards.
Enhanced Digital Platform – provides an enhanced digital platform that improves management of Risk
MAP, conserves information produced by Risk MAP, and improves communication and sharing of
risk data and related products to all levels of government and the public.
Alignment and Synergies – aligns risk analysis programs and develops synergies to enhance decision-
making capabilities through effective risk communication and management.
FEMA headquarters and regional offices lead a team of contractors and stakeholders to deliver its Risk MAP
program. The team is made up of the following:
FEMA Headquarters – responsible for overall program implementation
FEMA Regions – manage regional flood map production and help implement the Risk MAP outreach
strategy
State, Local, and Tribal entities – help ensure that updated mapping information is used to make
informed decisions regarding risk

Section 5.4.3: Risk Assessment – Flood
DMA 2000 Hazard Mitigation Plan – Putnam County, New York 5.4.3-5
February 2015
Program Management Contractor – provide general oversight for Risk MAP including integration of
activities, development and implementation of a national outreach strategy, and stakeholder relations
Production and Technical Services Contractors – update flood hazard data and maps
Customer and Data Services Contractor – provide the digital platform for sharing flood mapping
products and information
Biggert-Water Flood Insurance Reform Act of 2012 and Homeowner Flood Insurance Affordability Act of
2014
In July 2012, the U.S. Congress passed the Biggert-Water Flood Insurance Reform Act of 2012 (BW-12)
which called on FEMA and other agencies to make a number of changes to the way the NFIP is run. Key
provisions of the legislation will require the NFIP to raise rates to reflect true flood risk, make the program
more financially stable, and change how FIRM updates impact policyholders. BW-12 also eliminated the
Repetitive Flood Claims and Severe Repetitive Loss programs and made significant changes to the Flood
Mitigation Assistance (FMA) program.
On March 21, 2014, subsequent to substantial implementation of BW-12, President Obama signed the
Homeowner Flood Insurance Affordability Act (HFIAA) of 2014 into law. HFIAA of 2014 repeals certain
provisions of BW-12 that eliminated eligibility for Pre-Flood Insurance Rate Map (FIRM) subsidies for
buildings newly purchased or newly insured on or after July 6, 2012, as well as reinstatements of lapsed
policies effective on or after October 4, 2012. FEMA’s initial priority is to restore Pre-FIRM subsidies for
policyholders covered by section 3 of the HFIAA (FEMA 2014a).
While FEMA actively works to implement the new law, policyholders are encouraged to maintain and keep
current flood insurance policies. FEMA will continue working with Congress, the private Write Your Own
Insurance Companies, and other stakeholders to implement these Congressionally-mandated reforms and to
working toward our shared goals of helping families maintain affordable flood insurance, ensuring the
financial stability of the NFIP and reducing the risks and consequences of flooding nationwide. FEMA will
continue to identify and publish special flood hazards and flood risk zones as authorized and required by
Congress (FEMA 2014b). The following provides information regarding this new Act:
The new law lowers the recent rate increases on some policies, prevents some future rate increases,
and implements a surcharge on all policyholders. The Act also repeals certain rate increases that have
already gone into effect and provides for refunds to those policyholders. The Act also authorizes
additional resources for the National Academy of Sciences (NAS) to complete the affordability study.
FEMA has actively begun analyzing and prioritizing implementation of the new law. We will be
working with the private Write Your Own insurance companies in the next few weeks to seek their
input and expertise prior to issuing business practice bulletins.
It is not possible for changes to happen immediately. While the new law does require some changes to
be made retroactively, applying to certain policies written after July 6, 2012, other changes require
establishment of new programs, processes and procedures.
FEMA’s initial priority is assessing potential changes to the NFIP’s business processes to stop policy
increases for certain subsidized policyholders as outlined in the Act.
FEMA also plans to issue guidance in the months ahead for the Write Your Own insurance companies
to begin issuing refunds as outlined in the law for some policyholders who were previously impacted
by subsidy phase outs.
More information on the new law and its impacts on the NFIP will be forthcoming (FEMA 2014b).
Refunds

Section 5.4.3: Risk Assessment – Flood
DMA 2000 Hazard Mitigation Plan – Putnam County, New York 5.4.3-6
February 2015
For certain flood insurance policies affected by the Pre-Flood Insurance Rate Map (Pre-FIRM) subsidy
elimination required by BW-12, the new law mandates refunds of the excess premiums that those
policyholders were charged pursuant to the requirements of BW-12. Refunds will not affect all subsidized
policyholders who received rate increases as directed by Congress in BW-12, only policyholders for whom the
rate increases under BW-12 were revoked by the new law. Refunds will affect only a small percentage of the
overall NFIP policy base (FEMA 2014b).
Prior to restoring and refunding premiums, FEMA is required by the Homeowner Flood Insurance
Affordability Act to consult with its partner insurers (Write-Your-Own insurance companies or WYOs) to
develop guidance and rate tables. In accordance with the new law, FEMA will work to develop and finalize its
guidance and rate tables within eight months. The law provides WYO insurance companies between six and
eight months to implement the changes and update systems to implement the guidance (FEMA 2014b).
FEMA is working closely with the WYO insurance companies to develop a timetable for processing refunds
expediently. Refunds apply to policyholders in high-risk areas who were required to pay their full-risk rate
after purchasing a new flood insurance policy on or after July 6, 2012. Refunds may apply to policyholders
who renewed their policy after HFIAA was enacted on March 21, 2014 and whose premium increased more
than 18% (FEMA 2014b). Refunds do not apply to the following:
Policyholders paying the 25 percent annual rate increases, as required by Congress in BW12, for a
Pre-FIRM subsidized non-primary residence, business, Severe Repetitive Loss property, or building
that was substantially damaged or improved (FEMA 2014b).
Policyholders whose full-risk premium is less than the Pre-FIRM subsidized premium, or who were
not overcharged according to any retroactive revisions to the Pre-FIRM subsidized rates required by
the new law (FEMA 2014b).
Policyholders who saw usual, annual rate increases in 2013 or 2014, or policyholders who paid the 5 percent
fee, as required by BW-12, for the NFIP Reserve Fund, will only see a refund if their premium renewal was
after March 21, 2014 and their total premium, including the reserve fund, exceeded 18% (FEMA 2014b).
Premium Rates for Subsidized Policies
The new law requires gradual rate increases to properties now receiving artificially low (or subsidized) rates
instead of immediate increases to full-risk rates required in certain cases under BW-12. FEMA is required to
increase premiums for most subsidized properties by no less than 5% annually until the class premium reaches
its full-risk rate. It is important to note that close to 80% of NFIP policyholders paid a full-risk rate prior to
either BW-12 or HFIAA, and are minimally impacted by either law (FEMA 2014b).
With limited exceptions flood insurance premiums cannot increase more than 18 percent annually. There are
some exceptions to these general rules and limitations. The most important of these exceptions is that policies
for the following properties will continue to see up to 25% annual increases as required by BW-12 until they
reach their full-risk rate (FEMA 2014b). Other exceptions include:
Older business properties insured with subsidized rates
Older non-primary residences insured with subsidized rates
Severe Repetitive Loss Properties insured with subsidized rates; and
Buildings that have been substantially damaged or improved built before the local adoption of a Flood
Insurance Rate Map (known as Pre-FIRM properties) (FEMA 2014b).
In order to enable new purchasers of property to retain Pre-FIRM rates while FEMA is developing its
guidelines, a new purchaser will be allowed to assume the prior owner’s flood insurance policy and retain the

Section 5.4.3: Risk Assessment – Flood
DMA 2000 Hazard Mitigation Plan – Putnam County, New York 5.4.3-7
February 2015
same rates until the guidance is finalized. Also, lapsed policies receiving Pre-FIRM subsidized rates may be
reinstated with Pre-FIRM subsidized rates pending FEMA’s implementation of the rate increases required by
HFIAA (FEMA 2014b).
New Surcharge on All Policies
A new surcharge will be added to all policies to offset the subsidized policies and achieve the financial
sustainability goals of BW-12. A policy for a primary residence will include a $25 surcharge. All other policies
will include a $250 surcharge. The fee will be included on all policies, including full-risk rated policies, until
all Pre-FIRM subsidies are eliminated (FEMA 2014b).
Grandfathering
The new law repeals a provision of BW-12 that required FEMA, upon the effective date of a new or updated
FIRM, to phase in premium increases over five years by 20%a year to reflect the current risk of flood to a
property, effectively eliminating FEMA’s ability to grandfather properties into lower risk classes (FEMA
2014b).
Also for newly mapped in properties, the new law sets first year premiums at the same rate offered to
properties located outside the Special Flood Hazard Area (preferred risk policy rates). With limited exceptions,
flood insurance premiums cannot increase more than 18% annually (FEMA 2014b).
Flood Insurance Advocate
The new law requires FEMA to designate a Flood Insurance Advocate to advocate for the fair treatment of
NFIP policy holders (FEMA 2014b). The Advocate will:
Educate property owners and policyholders on individual flood risks; flood mitigation; measures to
reduce flood insurance rates through effective mitigation; the flood insurance rate map review and
amendment process; and any changes in the flood insurance program as a result of any newly enacted
laws;
Assist policy holders and property owners to understand the procedural requirements related to
appealing preliminary flood insurance rate maps and implementing measures to mitigate evolving
flood risks;
Assist in the development of regional capacity to respond to individual constituent concerns about
flood insurance rate map amendments and revisions;
Coordinate outreach and education with local officials and community leaders in areas impacted by
proposed flood insurance rate map amendments and revisions; and Aid potential policy holders in
obtaining and verifying accurate and reliable flood insurance rate information when purchasing or
renewing a flood insurance policy (FEMA 2014b).
Other Provisions
The new law permits FEMA to account for property specific flood mitigation that is not part of the insured
structure in determining a full-risk rate. The law requires that residential basement floodproofing be
considered when developing full-risk rates after a map changes increasing the Base Flood Elevation in an area
where residential basement floodproofing is permitted (FEMA 2014b).
The law mandates that FEMA develop an installment plan for non-escrowed flood insurance premiums, which
will require changes to regulations and the Standard Flood Insurance Policy contract. The law increases
maximum deductibles. The law encourages FEMA to minimize the number of policies where premiums
Section 5.4.3: Risk Assessment – Flood
DMA 2000 Hazard Mitigation Plan – Putnam County, New York 5.4.3-8
February 2015
exceed 1-percent of the coverage amount, and requires FEMA to report such premiums to Congress (FEMA
2014b).
Draft Affordability Framework
The new law requires FEMA to prepare a draft affordability framework, which is due to Congress 18 months
after completion of the affordability study required by BW-12. The Affordability Study required by BW-12 is
underway and is being conducted by the National Academies of Sciences, as specified in the BW-12 law
(FEMA 2014b). In developing the affordability framework, FEMA must consider:
Accurate communication to customers of the flood risk,
Targeted assistance based on financial ability to pay,
Individual and community actions to mitigate flood risk or lower cost of flood insurance,
The impact of increases in premium rates on participation in NFIP, and
The impact of mapping update on affordability of flood insurance (FEMA 2014b).
The affordability framework will include proposals and proposed regulations for ensuring flood insurance
affordability among low-income populations (FEMA 2014b).
Mapping
The HFIAA requires the Technical Mapping Advisory Council (TMAC) to review the new national flood
mapping program authorized under the 2012 and 2014 flood insurance reform laws. The law requires the
Administrator to certify in writing to Congress that FEMA is utilizing “technically credible” data and mapping
approaches. The law also requires FEMA to submit the TMAC review report to Congress (FEMA 2014b).
FEMA will be looking to the TMAC for recommendations on how best to meet the legislatively mandated
mapping requirements for the new mapping program including the identification of residual risk areas, coastal
flooding information, land subsidence, erosion, expected changes in flood hazards with time, and others
(FEMA 2014b).
As the new national flood mapping program is being established, FEMA expects there will be opportunities to
make incremental improvements to current procedures as it provides flood hazard data and information under
the NFIP. FEMA will make those improvements where necessary to ensure all ongoing changes to flood
hazards continue to be effectively communicated, mitigated, and properly insured against (FEMA 2014b).
The law lifts the $250,000 limit on the amount that FEMA can spend to reimburse homeowners for successful
map appeals based on a scientific or technical error. Federal rulemaking is required in order to implement this
provision (FEMA 2014b).
FEMA is authorized to account for reconstruction or improvements of flood protection, not just new
construction. It authorizes FEMA to consider the existing present value of a levee when assessing adequate
progress for the reconstruction of an existing flood protection system. The law extends certain provisions
related to NFIP requirements in areas restoring disaccredited flood protection systems to coastal levees and
clarifies that the levee needs to be considered without regard to the level of federal funding for the original
construction or the restoration (FEMA 2014b).
The law exempts mapping fees for flood map changes due to habitat restoration projects, dam removal, culvert
re-design or installation, or the installation of fish passages. It also requires FEMA to consider the effects of
non-structural flood control features, such as dunes, and beach and wetland restoration when it maps the
special flood hazard area (FEMA 2014b).

Section 5.4.3: Risk Assessment – Flood
DMA 2000 Hazard Mitigation Plan – Putnam County, New York 5.4.3-9
February 2015
The law requires FEMA to enhance coordination with communities before and during mapping activities and
requires FEMA to report certain information to members of Congress for each State and congressional district
affected by preliminary maps (FEMA 2014b).
Implementation of Section 3 - Repeal of Certain Rate Increases
As part of the implementation of HFIAA and provide relief to qualifying policyholders who received rate
increases under earlier legislative program changes, on April 15, 2014, FEMA issued a National Flood
Insurance Program bulletin to its private sector, Write Your Own insurance company partners on how to adjust
rates for certain Pre-Flood Insurance Rate Map properties as described by Section 3 of the Act. This action
begins to implement FEMA’s first priority to stop policy increases for certain subsidized policyholders as
outlined in the Act (FEMA 2014a).
Beginning May 1, 2014, for all new applications for flood insurance and renewal of flood insurance policies
for properties covered by Section 3, FEMA will require its Direct Servicing Agent and Write Your Own
companies to use the October 1, 2013 Pre-FIRM subsidized rates when more favorable for properties covered
by Section 3 (FEMA 2014a).
Implementation of Section 5 – October 1, 2014 Program Rate Changes
On March 29, 2014, FEMA issued a NFIP bulletin (linked below) to its private sector, Write Your Own
insurance company partners, which included the October 1, 2014 program rate changes that revise premium
rate tables to comply with Section 5 of the HFIAA of 2014. Section (5) of the Act prohibits FEMA from
increasing premiums more than 15 percent a year within a single risk class and not more than 18 percent for an
individual policy. In every case, these rates are the same or lower than the October 1, 2013 premium rates.
The HFIAA Section 5 premium rates are to be used for all new and renewal policies effective on or after
October 1, 2014 (FEMA 2014a).
FEMA will also use these rate tables to calculate premium refunds required under Section (3) of HFIAA.
Additionally, to the extent a policyholder was charged a premium in excess of the premium increase caps
mandated under Section 5 of HFIAA, FEMA will use these rate tables to calculate the refund. FEMA will
continue consulting with WYO companies to finalize refund guidance for facilitating refunds under Sections 3
and 5 of HFIAA. FEMA anticipates finalizing its guidance by July 2014 with refunds beginning in fall 2014
(FEMA 2014a).
Community Rating System (CRS) Program
The CRS is a voluntary program within the NFIP encouraging floodplain management activities that exceed
the minimum NFIP requirements. Flood insurance premiums are discounted to reflect the reduced flood risk to
meet the CRS goals of reducing flood losses, facilitating accurate insurance rating, and promoting awareness
of flood insurance in the community.
For participating communities, flood insurance premium rates are discounted in increments of 5%. For
example, a Class 1 community receives a 45% premium discount, and a Class 9 community receives a 5%
discount. Class 10 communities do not participate in the CRS and therefore do not receive a discount. The
CRS classes for local communities are based on 18 creditable activities in the following categories:
Public information
Mapping and regulations
Flood damage reduction
Flood preparedness

Section 5.4.3: Risk Assessment – Flood
DMA 2000 Hazard Mitigation Plan – Putnam County, New York 5.4.3-10
February 2015
CRS activities (discussed below) can help save lives and reduce property damage. Communities participating
in the CRS represent a significant portion of the nation’s flood risk; over 66% of the NFIP’s policy base is
located in these communities. Small and large communities participate in and receive premium discounts
through the CRS. These communities represent a mixture of flood risks, including both coastal and riverine
flood risks. The Insurance Services Office (ISO) administers the CRS program under contract to FEMA.
As of October 2013, there were 39 communities within New York State participating in the CRS program. Of
these CRS communities, none is located within Putnam County.
Extent
In the case of riverine or flash flooding, once a river reaches flood stage, the flood extent or severity categories
used by the NWS include minor flooding, moderate flooding, and major flooding. Each category has a
definition based on property damage and public threat:
Minor Flooding - minimal or no property damage, but possibly some public threat or inconvenience.
Moderate Flooding - some inundation of structures and roads near streams. Some evacuations of
people and/or transfer of property to higher elevations are necessary.
Major Flooding - extensive inundation of structures and roads. Significant evacuations of people
and/or transfer of property to higher elevations (NWS, 2011).
The severity of a flood depends not only on the amount of water that accumulates in a period of time, but also
on the land's ability to manage this water. One element is the size of rivers and streams in an area; but an
equally important factor is the land's absorbency. When it rains, soil acts as a sponge. When the land is
saturated or frozen, infiltration into the ground slows and any more water that accumulates must flow as runoff
(Harris, 2001).
Location
New York State has significant exposure to water and is a major casual element of the flood hazard. Water
exposure in the State includes the following:
Over 52,000 miles of rivers and streams
Nearly 8,000 acres of reservoirs, ponds, and lakes (excluding the Great Lakes)
Over 1,600 square miles of inland water (excluding the boundary water areas of Long Island Sound
and New York Harbor)
577 miles of Great Lakes shoreline, and
Over 117 miles of Atlantic Ocean shoreline (NYS DHSES, 2014).
Flooding is the primary natural hazard in New York State because the State exhibits a unique blend of
climatological and meteorological features that influence the potential for flooding. These factors include
topography, elevations, latitude and water bodies and waterways. Flooding is the primary natural hazard in
New York State and they occur in every part of the State. Some areas are more flood-prone than others, but no
area is exempt, including Putnam County. It is estimated that approximately 700,000 people live in these
floodprone areas, while millions more work, travel through, or use recreational facilities located in areas
subject to flooding (NYS DHSES, 2014).
Riverine/Flash Flooding
In some parts of New York State, annual spring floods result from snowmelt, and the extent of flooding
depends on the depth of winter snowpack and spring weather patterns. In the northeast portions of the State,

Section 5.4.3: Risk Assessment – Flood
DMA 2000 Hazard Mitigation Plan – Putnam County, New York 5.4.3-11
February 2015
winter thaws, sometimes combined with rain, can also cause significant flooding. Riverine flooding is most
severe in the Delaware, Susquehanna, Chemung, Erie-Niagara, Genesee, Allegany, Hudson, Mohawk, and
Lake Champlain river basins (NYS DHSES, 2014). Putnam County is located within the Hudson River Basin.
However, river basins are not the only areas of the State exposed to flood hazards. New York State has over
3,000 miles of marine and lacustrine coastline that are often causes of flooding. This includes the areas
adjacent to Lake Erie, Lake Ontario, the St. Lawrence and Niagra Rivers, Hudson River estuary, the Kill van
Kull and Arthur Kill, Long Island Sound, and the Atlantic Ocean and their connecting bays, harbors, shallows
and marshes. See Section 4 (County Profile) for information regarding the watersheds and drainage basins
found within Putnam County.
Flash flooding can occur throughout any region of New York State; however, the distinctive flash flood event
that is characterized by fast moving water and damaging impacts requires a steep topography. Areas of steep
topography are found in the Allegany-Catskill plateau, which runs the entire width of New York State’s
Southern Tier, and the Adirondack Mountains to the north (NYS DHSES, 2014).
Figure 5.4.3-2 illustrates the flood zones as depicted in the FEMA DFIRM database for Putnam County.

Section 5.4.3: Risk Assessment – Flood
DMA 2000 Hazard Mitigation Plan – Putnam County, New York 5.4.3-12
February 2015
Figure 5.4.3-2. FEMA Flood Zones for Putnam County
Source: FEMA

Section 5.4.3: Risk Assessment – Flood
DMA 2000 Hazard Mitigation Plan – Putnam County, New York 5.4.3-13
February 2015
Previous Occurrences and Losses
Many sources provided historical information regarding previous occurrences and losses associated with
flooding events throughout New York State and areas within Putnam County. With so many sources reviewed
for the purpose of this HMP, loss and impact information for many events could vary depending on the source.
Therefore, the accuracy of monetary figures discussed is based only on the available information identified
during research for this HMP. The NYS HMP indicated that New York State experienced 52 major flood
events that resulted in a FEMA disaster declaration between 1954 and 2013. The State also experienced 101
undeclared flood occurrences dating back to 1635 (NYS DHSES, 2014).
Between 1953 and 2013, New York State was included in 41 flood major disaster (DR) or emergency (EM)
declaration. These declarations were classified as one or a combination of the following: coastal storms, high
tides, heavy rain, flash flooding, flood, flooding, hurricane, wave action, ice storm, Nor’Easter, inland
flooding, tornadoes, landslides, and winds. Generally, these disasters cover a wide region of the State;
therefore, they may have impacted many counties. However, not all counties were included in the disaster
declarations and emergencies. Of those events, the NYS HMP and other sources indicate that Putnam County
has been declared as a disaster or emergency area as a result of nine flood events (FEMA, 2014).
Figure 5.4.3-3 shows the FEMA disaster declarations (DR) (and does not indicate emergency (EM)
declarations) for flooding events in New York State, from 1954 to 2013. This figure indicates that Putnam
County was included in four disaster declarations. However, this differs from information obtained from
FEMA, which indicated Putnam County was included in 9 declarations.

Section 5.4.3: Risk Assessment – Flood
DMA 2000 Hazard Mitigation Plan – Putnam County, New York 5.4.3-14
February 2015
Figure 5.4.3-3. Presidential Disaster Declarations for Flooding Events, 1954 to 2013
Source: NYS DHSES, 2014
Note: The black oval indicates the approximate location of Putnam County.
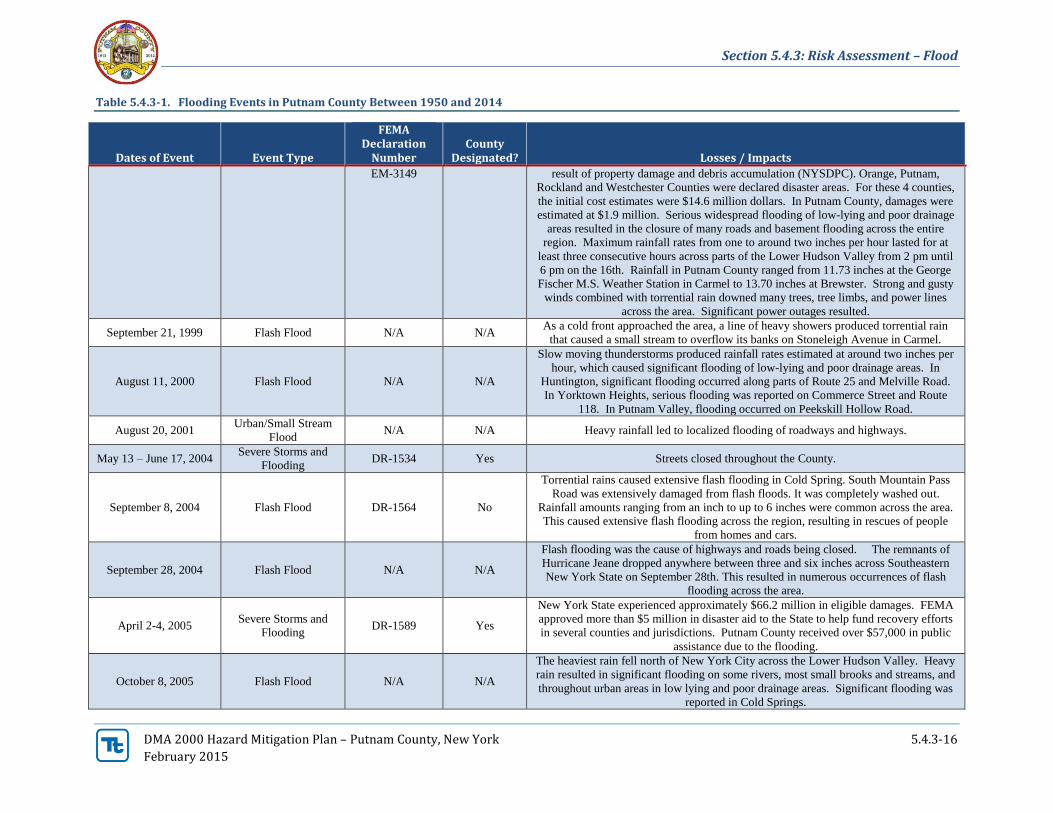
For this HMP, known flooding events that have impacted Putnam County between 1950 and 2014 are
identified in Table 5.4.3-1. With flooding documentation for New York State and Putnam County being so
extensive, not all sources have been identified or researched. Therefore, Table 5.4.3-1 may not include all events
that have occurred in the County.

Section 5.4.3: Risk Assessment – Flood
DMA 2000 Hazard Mitigation Plan – Putnam County, New York 5.4.3-15
February 2015
Table 5.4.3-1. Flooding Events in Putnam County Between 1950 and 2014
Dates of Event Event Type
FEMA Declaration
Number County
Designated? Losses / Impacts
September 11-14, 1971
Severe Storms and
Flooding
(Tropical Storm
Doria)
DR-311 Yes
Doria brought heavy rain to the New York City and southeastern portion of the State.
Four-day precipitation totals ranged from 4.5 to seven inches. Flooding was widespread
in the area of heaviest rainfall. Heavy property damage was experienced in Westchester
County, eastern Orange County, and the Catskill-Hudson sector of the mid-Hudson
Valley. Locally severe damage from road washouts and deposition of mud, rocks, and
debris occurred near the slopes of Mt. Beacon in Dutchess County. This storm caused
seven deaths and $147.6 million in damage throughout its path. New York State
experienced approximately $7.4 million in total eligible damages. Damage estimates in
Putnam County were not available.
September 25-27, 1975
Severe Storms, Heavy
Rain, Landslides,
Flooding
(Hurricane Eloise)
DR-487 Yes
A week long rainfall event resulted in considerable flooding in the area. Hardest hit
counties included: Broome, Cayuga, Chemung, Chenango, Madison, Onondaga,
Oswego, and Tioga. Rainfall totals ranged from four to seven inches, with totals over
10 inches in southeastern New York State (including Putnam County). New York State
experienced approximately $25 million in property damages and two fatalities. Damage
estimates in Putnam County were not available.
January 19-20, 1996 Severe Storms,
Flooding DR-1095 Yes
The storm brought heavy rains and caused significant snowmelt. Street and poor
drainage flooding became a major problem due to the rains and snowmelt. River and
stream flooding occurred in the afternoon of the 19th and continued through the next
day. Several roofs collapsed during the new few days in response to an extremely
heavy load of water brought on a previous blizzard and the heavy rains. Flooding was
so widespread and severe that the event was known was the Deluge of ’96. The storm
and related flooding temporarily closed many roads, closed businesses, and killed 10
people throughout the State. Total damages in New York State reached $160 million.
In Putnam County, flooding blocked a major north-south highway, Route 9, and also
blocked roads near Cold Spring. Damage estimates in Putnam County were not
available.
July 13, 1996 Flood N/A N/A Torrential rain caused flooding of low lying and poor drainage areas, streams, and rivers
across the area. No rainfall reports were available from Putnam County.
October 8-9, 1996
Heavy Rains and
Flooding
(Remnants of Tropical
Storm Josephine)
N/A N/A
The remnants of Tropical Storm Josephine moved rapidly northeast and passed east of
Long Island on the 9th. It produced one to three inches of rain that caused localized
flooding of streets and poor drainage areas across the region. It also brought gusty
winds, with gusts ranging from 40 to 50 mph. Damage estimates in Putnam County
were not available.
October 19, 1996
Severe Storms,
Flooding, Heavy
Rains, High Winds
(also known as a
Nor’Easter)
DR-1146 No
High winds and heavy rain impacted the area on the 19th which downed numerous trees
and power lines. Peak wind gusts ranged from 30 mph to 55 mph. Strong east winds
blowing over a long distance caused tides to average three to six feet above normal.
Three to five inches of rain fell, with isolated higher amounts. Damage estimates in
Putnam County were not available.
September 16-18, 1999 Hurricane Floyd DR-1296; Yes New York State experienced approximately $62.2 million in eligible damages as a
Section 5.4.3: Risk Assessment – Flood
DMA 2000 Hazard Mitigation Plan – Putnam County, New York 5.4.3-16
February 2015
Table 5.4.3-1. Flooding Events in Putnam County Between 1950 and 2014
Dates of Event Event Type
FEMA Declaration
Number County
Designated? Losses / Impacts
EM-3149 result of property damage and debris accumulation (NYSDPC). Orange, Putnam,
Rockland and Westchester Counties were declared disaster areas. For these 4 counties,
the initial cost estimates were $14.6 million dollars. In Putnam County, damages were
estimated at $1.9 million. Serious widespread flooding of low-lying and poor drainage
areas resulted in the closure of many roads and basement flooding across the entire
region. Maximum rainfall rates from one to around two inches per hour lasted for at
least three consecutive hours across parts of the Lower Hudson Valley from 2 pm until
6 pm on the 16th. Rainfall in Putnam County ranged from 11.73 inches at the George
Fischer M.S. Weather Station in Carmel to 13.70 inches at Brewster. Strong and gusty
winds combined with torrential rain downed many trees, tree limbs, and power lines
across the area. Significant power outages resulted.
September 21, 1999 Flash Flood N/A N/A As a cold front approached the area, a line of heavy showers produced torrential rain
that caused a small stream to overflow its banks on Stoneleigh Avenue in Carmel.
August 11, 2000 Flash Flood N/A N/A
Slow moving thunderstorms produced rainfall rates estimated at around two inches per
hour, which caused significant flooding of low-lying and poor drainage areas. In
Huntington, significant flooding occurred along parts of Route 25 and Melville Road.
In Yorktown Heights, serious flooding was reported on Commerce Street and Route
118. In Putnam Valley, flooding occurred on Peekskill Hollow Road.
August 20, 2001 Urban/Small Stream
Flood N/A N/A Heavy rainfall led to localized flooding of roadways and highways.
May 13 – June 17, 2004 Severe Storms and
Flooding DR-1534 Yes Streets closed throughout the County.
September 8, 2004 Flash Flood DR-1564 No
Torrential rains caused extensive flash flooding in Cold Spring. South Mountain Pass
Road was extensively damaged from flash floods. It was completely washed out.
Rainfall amounts ranging from an inch to up to 6 inches were common across the area.
This caused extensive flash flooding across the region, resulting in rescues of people
from homes and cars.
September 28, 2004 Flash Flood N/A N/A
Flash flooding was the cause of highways and roads being closed. The remnants of
Hurricane Jeane dropped anywhere between three and six inches across Southeastern
New York State on September 28th. This resulted in numerous occurrences of flash
flooding across the area.
April 2-4, 2005 Severe Storms and
Flooding DR-1589 Yes
New York State experienced approximately $66.2 million in eligible damages. FEMA
approved more than $5 million in disaster aid to the State to help fund recovery efforts
in several counties and jurisdictions. Putnam County received over $57,000 in public
assistance due to the flooding.
October 8, 2005 Flash Flood N/A N/A
The heaviest rain fell north of New York City across the Lower Hudson Valley. Heavy
rain resulted in significant flooding on some rivers, most small brooks and streams, and
throughout urban areas in low lying and poor drainage areas. Significant flooding was
reported in Cold Springs.

Section 5.4.3: Risk Assessment – Flood
DMA 2000 Hazard Mitigation Plan – Putnam County, New York 5.4.3-17
February 2015
Table 5.4.3-1. Flooding Events in Putnam County Between 1950 and 2014
Dates of Event Event Type
FEMA Declaration
Number County
Designated? Losses / Impacts
April 14-18, 2007
Severe Storms and
Inland and Coastal
Flood
(also identified as a
Nor’Easter)
DR-1692 Yes
A Nor'Easter occurred during April 15th and 16th. It brought heavy rain and high
winds that caused widespread and significant river, stream, and urban flooding of low
lying and poor drainage areas. Many small rivers, streams, and brooks rose over their
banks within 12 hours of the heavy rainfall. New York State experienced millions in
eligible damages. FEMA gave out more than $61 million in assistance to affected
counties within the State. The Taconic State Parkway and I-84 intersection near Miller
Hill Road was flooded.
July 23, 2008 Flash Flood N/A N/A Torrential rainfall and flash flooding occurred. Water rescues were performed on Rte. 6
near Lake Mahopac in Mahopac.
July 27, 2008 Flash Flood N/A N/A Mud Pond Road, along with portions of Route 6 and Croton Falls Road were flooded
over and impassable in Mahopac.
September 6, 2008 Flash Flood N/A N/A
Periods of torrential rain from heavy showers and thunderstorms caused flash flooding
in many locations, which included urban, small stream and river flooding. Stoneyleigh
Ave. was closed between Hughson Rd. and Drewville Rd. in Carmel due to flooding.
August 28, 2011 Flood
(Hurricane Irene)
DR-4020; EM-
3328 Yes
Copious amounts of tropical moisture within the storm produced extended periods of
heavy rainfall, which resulted in widespread moderate to major flooding across the area.
July 28, 2012 Flash Flood N/A N/A Heavy rain caused two feet of water to accumulate on Rt. 311 at Cushman Rd. in
Towners.
October 28, 2012 Flood
(Hurricane Sandy)
DR-4085;
EM-3351 Yes
Hurricane Sandy caused 60 deaths and widespread property damages of over $42
billion. Widespread power outages affected over two million people and lasted for up
to two weeks. Putnam County received more than $1.5 million in public assistance to
fund emergency efforts, remove debris, and rebuild infrastructure.
May 23, 2013 Heavy Rain and Flood N/A N/A 2.16 inches of rain fell in Putnam County.
July 14-15, 2014 Heavy Rain and Flash
Flooding N/A N/A
Severe thunderstorms hit the area, bringing lightning strikes, hail, downed trees and
flooding in homes. Heavy rain flooded major roads in parts of the Tri-State area. A
flash flood watch was issued for New York City, Long Island, Westchester, Rockland,
and Putnam Counties. Between 1.23 inches and 3.10 inches of rain fell in Putnam
County Source(s): FEMA 2014; NOAA-NCDC 2014; Chas Sells Inc.; USACE; MARFC; Kocin; Herbert; Revkin 1996; NYSDHSES 2014; SHELDUS 2013
Note (1): Monetary figures within this table were U.S. Dollar (USD) figures calculated during or within the approximate time of the event. If such an event would occur in the present day, monetary
losses would be considerably higher in USDs as a result of increased U.S. Inflation Rates.
DR Federal Disaster Declaration
EM Federal Emergency Declaration
FEMA Federal Emergency Management Agency IA Individual Assistance
K Thousand ($)
M Million ($) MARFC Middle Atlantic River Forecast Center
N/A Not applicable
NCDC National Climate Data Center
NOAA National Oceanic Atmospheric Administration
NWS National Weather Service NYS DHSES New York State Division of Homeland Security & Emergency Services
PA Public Assistance
SHELDUS Spatial Hazard Events and Losses Database for the U.S. USACE U.S. Army Corps of Engineers

Section 5.4.3: Risk Assessment – Flood
DMA 2000 Hazard Mitigation Plan – Putnam County, New York 5.4.3-18
February 2015
Probability of Future Events
Given the history of flood events that have impacted Putnam County, it is apparent that future flooding of
varying degrees will occur. Based on the previous occurrences of flooding events and the fact that the elements
required for flooding exist in the County, many people and properties are at risk from flood hazards in the
future.
In Section 5.3, the identified hazards of concern for Putnam County were ranked. The probability of
occurrence, or likelihood of the event, is one parameter used for hazard rankings. Based on historical records
and input from the Planning Committee, the probability of occurrence for flood in the county is considered
‘frequent’ (likely to occur within 25 years).
It is estimated that the county will continue to experience direct and indirect impacts of floods annually. Some
of the flooding events may induce secondary hazards such as: water quality and supply concerns and
experience evacuations, infrastructure deterioration and failure, utility failures, power outages, transportation
delays/accidents/inconveniences and public health concerns.
The NYSDEC conducted a vulnerability assessment that depicted how vulnerable a county may be to flood
hazards. This was determined by a rating score; each county accumulated points based on the value of each
vulnerability indicator. The higher the indication for flood exposure, the more points assigned, resulting in a
final rating score. The result of this assessment presented an indication of a county’s vulnerability to the flood
hazard. Putnam County’s rating is 18, out of a possible 35. The rating was based on number of NFIP
insurance policies, number of NFIP claims, total amount of NFIP claims, total amount of NFIP policy
coverage, number of repetitive flood loss properties, and number of flood disasters (NYS DHSES, 2011).
Climate Change Impacts
Climate change is beginning to affect both people and resources in New York State, and these impacts are
projected to continue growing. Impacts related to increasing temperatures and sea level rise are already being
felt in the State. ClimAID: the Integrated Assessment for Effective Climate Change in New York State
(ClimAID) was undertaken to provide decision-makers with information on the State’s vulnerability to climate
change and to facilitate the development of adaptation strategies informed by both local experience and
scientific knowledge (New York State Energy Research and Development Authority [NYSERDA], 2011).
Each region in New York State, as defined by ClimAID, has attributes that will be affected by climate change.
Putnam County is part of Region 5, East Hudson and Mohawk River Valleys. Some of the issues in this
region, affected by climate change, include: more frequent heat waves and above 90°F days, more heat-related
deaths, increased frequency of heavy precipitation and flooding, decline in air quality, etc. (NYSERDA, 2011).
Temperatures in New York State are warming, with an average rate of warming over the past century of 0.25°
F per decade. Average annual temperatures are projected to increase across New York State by 2° F to 3.4° F
by the 2020s, 4.1° F to 6.8° F by the 2050s, and 5.3° F to 10.1° F by the 2080s. By the end of the century, the
greatest warming is projected to be in the northern section of the State (NYSERDA, 2014).
Regional precipitation across New York State is projected to increase by approximately one to eight-percent by
the 2020s, three to 12-percent by the 2050s, and four to 15-percent by the 2080s. By the end of the century,
the greatest increases in precipitation are projected to be in the northern areas of the State (NYSERDA, 2014).
Sea level rise projections that do not include significant melting of polar ice sheets suggest one to five inches
of rise by the 2020s; five to 12 inches by the 2050s; and eight to 23 inches by the 2080s. Scenarios that

Section 5.4.3: Risk Assessment – Flood
DMA 2000 Hazard Mitigation Plan – Putnam County, New York 5.4.3-19
February 2015
include rapid melting of polar ice projects four to 10 inches by the 2020s; 17 to 29 inches by the 2050s; and 37
to 55 inches by the 2080s (NYSERDA, 2011).
In Region 5, it is estimated that temperatures will increase by 3.5ºF to 7.1ºF by the 2050s and 4.1ºF to 11.4ºF
by the 2080s (baseline of 47.6ºF). Precipitation totals will increase between 2 and 15% by the 2050s and 3 to
17% by the 2080s (baseline of 38.6 inches). Table 5.4.3-2 displays the projected seasonal precipitation change
for the East Hudson and Mohawk River Valleys ClimAID Region (NYSERDA, 2014).
Table 5.4.3-2. Projected Seasonal Precipitation Change in Region 5, 2050s (% change)
Winter Spring Summer Fall
5 to +15 -5 to +10 -5 to +5 -5 to +10
Source: NYSERDA, 2011
The projected increase in precipitation is expected to fall in heavy downpours and less in light rains. The
increase in heavy downpours has the potential to affect drinking water; heighten the risk of riverine flooding;
flood key rail lines, roadways and transportation hugs; and increase delays and hazards related to extreme
weather events (NYSERDA, 2011).
The projected increase in sea level rise has the potential to increase risk of storm surge-related flooding along
the coast; expand areas at-risk of coastal flooding; increase vulnerability of energy facilities located in coastal
areas; flood transportation and telecommunication facilities; and cause saltwater intrusion into some freshwater
supplies near the coasts. This could impact several municipalities in Putnam County, including Cold Spring
and Philipstown. High water levels, strong winds, and heavy precipitation resulting from severe coastal storms
already cause billions of dollars in damages and disrupt transportation and utility distribution systems. Sea
level rise will lead to more frequent and extensive coastal flooding. Warming ocean waters raise sea level
through thermal expansion and have the potential to strengthen the most powerful storms (NYSERDA, 2011).
Increasing air temperatures intensify the water cycle by increasing evaporation and precipitation. This can
cause an increase in rain totals during events with longer dry periods in between those events. These changes
can have a variety of effects on the State’s water resources (NYSERDA, 2011).
Over the past 50 years, heavy downpours have increased and this trend is projected to continue. This can
cause an increase in localized flash flooding in urban areas and hilly regions. Flooding has the potential to
increase pollutants in the water supply and inundate wastewater treatment plants and other vulnerable facilities
located within floodplains. Less frequent rainfall during the summer months may impact the ability of water
supply systems. Increasing water temperatures in rivers and streams will affect aquatic health and reduce the
capacity of streams to assimilate effluent wastewater treatment plants (NYSERDA, 2011).
Figure 5.4.3-4 displays the project rainfall and frequency of extreme storms in New York State. The amount
of rain fall in a 100-year event is projected to increase, while the number of years between such storms (return
period) is projected to decrease. Rainstorms will become more severe and more frequent (NYSERDA, 2011).

Section 5.4.3: Risk Assessment – Flood
DMA 2000 Hazard Mitigation Plan – Putnam County, New York 5.4.3-20
February 2015
Figure 5.4.3-4. Projected Rainfall and Frequency of Extreme Storms
Source: NYSERDA, 2011
Total precipitation amounts have slightly increased in the Northeast U.S., by approximately 3.3 inches over the
last 100 years. There has also been an increase in the number of two-inch rainfall events over a 48-hour period
since the 1950s (a 67-percent increase). The number and intensity of extreme precipitation events are
increasing in New York State as well. More rain heightens the danger of localized flash flooding, streambank
erosion and storm damage (Cornell University College of Agriculture and Life Sciences, 2011).
Section 5.4.3: Risk Assessment – Flood
DMA 2000 Hazard Mitigation Plan – Putnam County, New York 5.4.3-21
February 2015
5.4.3.2 Vulnerability Assessment
To understand risk, a community must evaluate what assets are exposed and/or vulnerable in the identified
hazard area. For the flood hazard, the 1-percent and 0.2-percent annual chance flood event boundaries are
identified as the flood hazard areas. The following text evaluates and estimates the potential impact of
flooding for Putnam County including:
Overview of vulnerability
Data and methodology used for the evaluation
Impact on: (1) life, health and safety of residents, (2) general building stock, (3) critical facilities, (4)
economy, and (5) future growth and development
Effect of climate change on vulnerability
Further data collections that will assist understanding this hazard over time
Overview of Vulnerability
To assess risk, exposure and potential losses were calculated for the riverine flood hazard areas for the 1- and
0.2-percent annual chance flood events. The flood hazard exposure and loss estimate analysis is presented
below.
Data and Methodology
The 1- and 0.2-percent annual chance flood events were examined to evaluate the County’s exposure and
vulnerability to the flood hazard. These flood events are generally those considered by planners and evaluated
under federal programs such as the NFIP.
The FEMA DFIRM dated March 2013 was used to evaluate exposure for the 1- and 0.2-percent annual chance
flood events, and determine potential future losses for the 1-percent annual chance event in Putnam County. A
2-meter elevation dataset was used as the terrain and the 1-percent annual chance flood depth grid was
developed using the base flood and cross-section elevations for the detailed study areas. Hazus-MH was used
to develop the depth grid for all other areas of the SFHA using a 1/3 Arc Second elevation model from USGS.
The depth grid was integrated into HAZUS-MH and the model was run to estimate potential losses at the
structure level using the County’s custom building inventory.
The HAZUS-MH model uses 2000 U.S. Census demographic data. This data was not updated for this
analysis; however, the 2010 U.S. Census data was used to estimate population exposure to provide the
best available output. Impact on Life, Health and Safety
The impact of flooding on life, health and safety is dependent upon several factors including the severity of the
event and whether or not adequate warning time is provided to residents. Exposure represents the population
living in or near floodplain areas that could be impacted should a flood event occur. Additionally, exposure
should not be limited to only those who reside in a defined hazard zone, but everyone who may be affected by
the effects of a hazard event (e.g., people are at risk while traveling in flooded areas, or their access to
emergency services is compromised during an event). The degree of that impact will vary and is not strictly
measurable.
To estimate the population exposed to the 1-percent and 0.2-percent flood events, the floodplain boundaries
were overlaid upon the 2010 Census population data in GIS (U.S. Census 2010). The 2010 Census blocks

Section 5.4.3: Risk Assessment – Flood
DMA 2000 Hazard Mitigation Plan – Putnam County, New York 5.4.3-22
February 2015
with their centroid in the flood boundaries were used to calculate the estimated population exposed to this
hazard.
Census blocks do not follow the boundaries of the floodplain and can grossly over or under estimate the
population exposed when using the centroid or intersect of the Census block with the flood zones. Further, the
seasonal population that may visit or temporarily reside in the planning area is not captured in the Census
population and may underestimate the population exposed. The limitations of these analyses are recognized,
and as such the results are only used to provide a general estimate.
The calculation for the 0.2-percent annual chance flood event is cumulative in nature, as the population
exposed to the 1-percent flood event will also be exposed to the 0.2-percent annual chance flood event. Using
this approach, it was estimated that less than one-percent of people are exposed to the 1-percent annual chance
event and less than one-percent of people are exposed to the 0.2-percent annual chance flood event. The
difference in population exposure for both events was minimal. For this project, the potential population
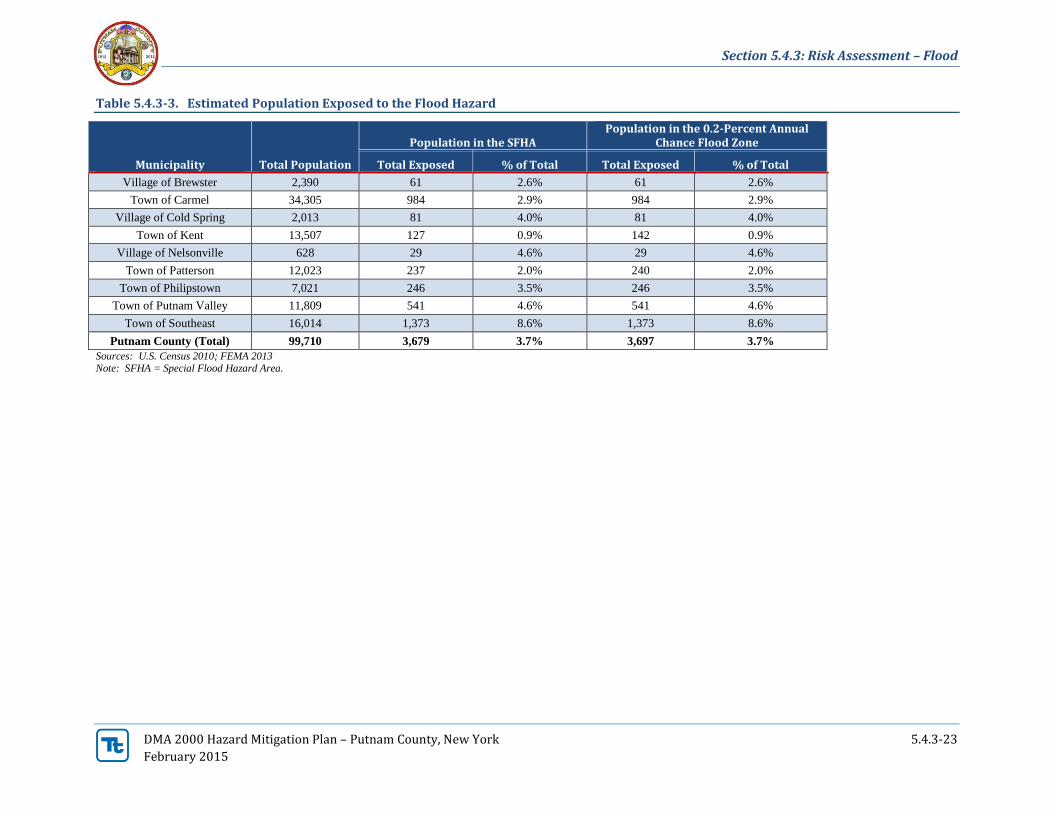
impacted is used as a guide. Table 5.4.3-3 lists the estimated population located within the 1- and 0.2-percent
annual chance flood boundaries by jurisdiction.
Section 5.4.3: Risk Assessment – Flood
DMA 2000 Hazard Mitigation Plan – Putnam County, New York 5.4.3-23
February 2015
Table 5.4.3-3. Estimated Population Exposed to the Flood Hazard
Municipality
Total Population
Population in the SFHA Population in the 0.2-Percent Annual
Chance Flood Zone
Total Exposed % of Total Total Exposed % of Total
Village of Brewster 2,390 61 2.6% 61 2.6%
Town of Carmel 34,305 984 2.9% 984 2.9%
Village of Cold Spring 2,013 81 4.0% 81 4.0%
Town of Kent 13,507 127 0.9% 142 0.9%
Village of Nelsonville 628 29 4.6% 29 4.6%
Town of Patterson 12,023 237 2.0% 240 2.0%
Town of Philipstown 7,021 246 3.5% 246 3.5%
Town of Putnam Valley 11,809 541 4.6% 541 4.6%
Town of Southeast 16,014 1,373 8.6% 1,373 8.6%
Putnam County (Total) 99,710 3,679 3.7% 3,697 3.7%
Sources: U.S. Census 2010; FEMA 2013 Note: SFHA = Special Flood Hazard Area.

Section 5.4.3: Risk Assessment – Flood
DMA 2000 Hazard Mitigation Plan – Putnam County, New York 5.4.3-24
February 2015
Of the population exposed, the most vulnerable include the economically disadvantaged and the
population over the age of 65. Economically disadvantaged populations are more vulnerable because
they are likely to evaluate their risk and make decisions to evacuate based on the net economic impact to
their family. The population over the age of 65 is also more vulnerable because they are more likely to
seek or need medical attention which may not be available due to isolation during a flood event and they
may have more difficulty evacuating.
The total number of injuries and casualties resulting from flooding is generally limited based on advance
weather forecasting, blockades and warnings. Therefore, injuries and deaths generally are not anticipated
if proper warning and precautions are in place. Ongoing mitigation efforts should help to avoid the most
likely cause of injury, which results from persons trying to cross flooded roadways or channels during a
flood.
Impact on General Building Stock
After considering the population exposed and vulnerable to the flood hazard, the built environment was
evaluated. Exposure in the flood zone includes those buildings located in the flood zone. Potential damage is
the modeled loss that could occur to the exposed inventory, including structural and content value.
The total land area located in the 1-percent and 0.2-percent annual chance flood zones was calculated for each
jurisdiction, as presented in Table 5.4.3-4 below.
Table 5.4.3-4. Total Land Area Located in the Flood Zones (Acres)
Municipality Total Area
(acres)
1% Flood Event Hazard Area
0.2% Flood Event Hazard Area
Area (acres)
% of Total
Area (acres) % of Total
Village of Brewster 286.03 27.50 9.6% 30.98 10.8%
Town of Carmel 26,134.25 3,554.29 13.6% 3,598.33 13.8%
Village of Cold Spring 544.04 208.26 38.3% 215.57 39.6%
Town of Kent 27,296.41 1,001.29 3.7% 1,040.91 3.8%
Village of Nelsonville 670.88 15.95 2.4% 18.92 2.8%
Town of Patterson 20,901.86 2,814.71 13.5% 2,962.21 14.2%
Town of Philipstown 31,985.92 2,269.78 7.1% 2,338.12 7.3%
Town of Putnam Valley 27,478.36 731.21 2.7% 817.94 3.0%
Town of Southeast 22,161.23 3,163.86 14.3% 3,259.13 14.7%
Putnam County (Total) 157,458.97 13,786.85 8.8% 14,282.12 9.1%
Source: FEMA 2013 Note: % = Percent; Flood area is inclusive of water bodies
To provide a general estimate of the structural/content replacement value exposure, the 1- and 0.2-percent
DFIRM flood boundaries were overlaid upon the County’s updated building stock inventory at the structure
level. The buildings with their centroid in the flood boundary were totaled for each municipality. Table 5.4.3-5
summarizes these results. In summary, there are 359 buildings located in the 1-percent annual chance flood
boundary with an estimated $324 million of building/contents exposed. This represents approximately 1.8% of
the County’s total general building stock replacement value inventory (greater than $17 billion).
There 437 buildings located in the 0.2-percent annual chance flood boundary with an estimated $380 million of
building/contents exposed. This represents approximately 2.1% of the County’s total general building stock
replacement value inventory.

Section 5.4.3: Risk Assessment – Flood
DMA 2000 Hazard Mitigation Plan – Putnam County, New York 5.4.3-25
February 2015
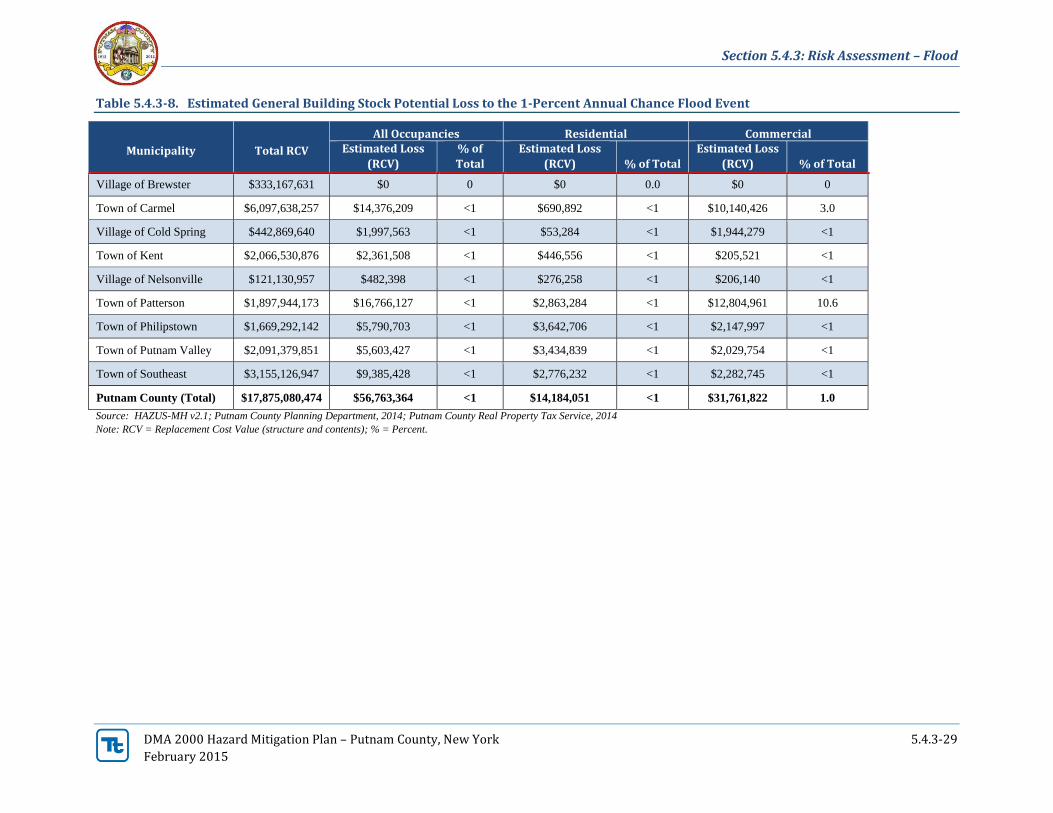
The HAZUS-MH model estimated potential damages to the buildings in Putnam County at the structure level
using the custom County structure inventory developed for this plan update. The potential damage estimated
by HAZUS-MH to the general building stock inventory associated with the 1-percent annual chance flood is
$56 million or less than one-percent of the total building stock replacement value.

Section 5.4.3: Risk Assessment – Flood
DMA 2000 Hazard Mitigation Plan – Putnam County, New York 5.4.3-26
February 2015
Table 5.4.3-5. Estimated General Building Stock Exposure to the 1-Percent and 0.2-Percent Annual Chance Flood Events – All Occupancies
Municipality Total #
Buildings
Total RCV (Structure and
Contents)
Total (All Occupancies)
1% Chance Event 0.2% Chance Event
# Buildings
% Total RCV
% Total
# Buildings % Total RCV % Total
Village of Brewster 406 $333,167,631 1 0.2 $841,593 0.3 2 0.5 $1,970,417 0.6
Town of Carmel 10,170 $6,097,638,257 33 0.3 $74,317,050 1.2 49 0.5 $85,470,896 1.4
Village of Cold Spring 679 $442,869,640 16 2.4 $15,597,861 3.5 21 3.1 $18,439,392 4.2
Town of Kent 5,021 $2,066,530,876 14 0.3 $17,993,277 0.9 19 0.4 $24,878,710 1.2
Village of Nelsonville 261 $121,130,957 7 2.7 $2,886,334 2.4 9 3.4 $4,059,992 3.4
Town of Patterson 3,393 $1,897,944,173 63 1.9 $60,741,456 3.2 71 2.1 $73,873,088 3.9
Town of Philipstown 2,768 $1,669,292,142 81 2.9 $44,746,860 2.7 100 3.6 $52,987,944 3.2
Town of Putnam Valley 4,520 $2,091,379,851 83 1.8 $50,180,733 2.4 100 2.2 $58,796,572 2.8
Town of Southeast 4,128 $3,155,126,947 61 1.5 $57,366,378 1.8 66 1.6 $59,950,333 1.9
Putnam County (Total) 31,346 $17,875,080,474 359 1.1 $324,671,542 1.8 437 1.4 $380,427,343 2.1
Source: HAZUS-MH v2.1; Putnam County Planning Department, 2014; Putnam County Real Property Tax Service, 2014
Note: RCV = Replacement Cost Value; # = Number; % = Percent.

Section 5.4.3: Risk Assessment – Flood
DMA 2000 Hazard Mitigation Plan – Putnam County, New York 5.4.3-27
February 2015
Table 5.4.3-6. Estimated General Building Stock Exposure to the 1-Percent and 0.2-Percent Annual Chance Flood Events – Residential Occupancy Class
Municipality
Total # Buildings
(all occupancies)
Total RCV (Structure and
Contents)
Residential
1% Chance Event 0.2% Chance Event
# Buildings
% Total RCV
% Total
# Buildings
% Total RCV
% Total
Village of Brewster 406 $333,167,631 0 0 $0 0 0 0 $0 0
Town of Carmel 10,170 $6,097,638,257 21 0.2 $9,057,749 0.1 35 0.3 $16,209,960 0.3
Village of Cold Spring 679 $442,869,640 14 2.1 $11,150,081 2.5 18 2.7 $13,092,448 3.0
Town of Kent 5,021 $2,066,530,876 9 0.2 $5,596,136 0.3 10 0.2 $6,142,002 0.3
Village of Nelsonville 261 $121,130,957 6 2.3 $2,304,878 1.9 8 3.1 $3,478,536 2.9
Town of Patterson 3,393 $1,897,944,173 46 1.4 $18,357,914 1.0 52 1.5 $21,259,717 1.1
Town of Philipstown 2,768 $1,669,292,142 70 2.5 $31,780,891 1.9 87 3.1 $38,481,873 2.3
Town of Putnam Valley 4,520 $2,091,379,851 77 1.7 $36,039,227 1.7 94 2.1 $44,655,066 2.1
Town of Southeast 4,128 $3,155,126,947 41 1.0 $22,061,561 0.7 46 1.1 $24,645,516 0.8
Putnam County (Total) 31,346 $17,875,080,474 284 0.9 $136,348,438 0.8 350 1.1 $167,965,118 0.9
Source: HAZUS-MH v2.1; Putnam County Planning Department, 2014; Putnam County Real Property Tax Service, 2014
Note: RCV = Replacement Cost Value; # = Number; % = Percent.

Section 5.4.3: Risk Assessment – Flood
DMA 2000 Hazard Mitigation Plan – Putnam County, New York 5.4.3-28
February 2015
Table 5.4.3-7. Estimated General Building Stock Exposure to the 1-Percent and 0.2-Percent Annual Chance Flood Events – Commercial Occupancy Class
Municipality
Total # Buildings
(all occupancies)
Total RCV (Structure and
Contents)
Commercial
1% Chance Event 0.2% Chance Event
# Buildings
% Total RCV
% Total
# Buildings % Total RCV % Total
Village of Brewster 406 $333,167,631 0 0 $0 0.0 1 0.2 $1,128,824 0.3
Town of Carmel 10,170 $6,097,638,257 10 0.1 $54,847,294 0.9 12 0.1 $58,848,930 1.0
Village of Cold Spring 679 $442,869,640 2 0.3 $4,447,780 1.0 3 0.4 $5,346,944 1.2
Town of Kent 5,021 $2,066,530,876 3 0.1 $6,693,603 0.3 6 0.1 $9,926,226 0.5
Village of Nelsonville 261 $121,130,957 1 0.4 $581,456 0.5 1 0.4 $581,456 0.5
Town of Patterson 3,393 $1,897,944,173 13 0.4 $38,518,495 2.0 15 0.4 $48,748,324 2.6
Town of Philipstown 2,768 $1,669,292,142 11 0.4 $12,965,969 0.8 13 0.5 $14,506,071 0.9
Town of Putnam Valley 4,520 $2,091,379,851 5 0.1 $13,295,633 0.6 5 0.1 $13,295,633 0.6
Town of Southeast 4,128 $3,155,126,947 5 0.1 $13,166,149 0.4 5 0.1 $13,166,149 0.4
Putnam County (Total) 31,346 $17,875,080,474 50 0.2 $144,516,379 0.8 61 0.2 $165,548,557 0.9
Source: HAZUS-MH v2.1; Putnam County Planning Department, 2014; Putnam County Real Property Tax Service, 2014
Note: RCV = Replacement Cost Value; # = Number; % = Percent.
Section 5.4.3: Risk Assessment – Flood
DMA 2000 Hazard Mitigation Plan – Putnam County, New York 5.4.3-29
February 2015
Table 5.4.3-8. Estimated General Building Stock Potential Loss to the 1-Percent Annual Chance Flood Event
Municipality Total RCV
All Occupancies Residential Commercial Estimated Loss
(RCV)
% of
Total
Estimated Loss
(RCV) % of Total
Estimated Loss
(RCV) % of Total
Village of Brewster $333,167,631 $0 0 $0 0.0 $0 0
Town of Carmel $6,097,638,257 $14,376,209 <1 $690,892 <1 $10,140,426 3.0
Village of Cold Spring $442,869,640 $1,997,563 <1 $53,284 <1 $1,944,279 <1
Town of Kent $2,066,530,876 $2,361,508 <1 $446,556 <1 $205,521 <1
Village of Nelsonville $121,130,957 $482,398 <1 $276,258 <1 $206,140 <1
Town of Patterson $1,897,944,173 $16,766,127 <1 $2,863,284 <1 $12,804,961 10.6
Town of Philipstown $1,669,292,142 $5,790,703 <1 $3,642,706 <1 $2,147,997 <1
Town of Putnam Valley $2,091,379,851 $5,603,427 <1 $3,434,839 <1 $2,029,754 <1
Town of Southeast $3,155,126,947 $9,385,428 <1 $2,776,232 <1 $2,282,745 <1
Putnam County (Total) $17,875,080,474 $56,763,364 <1 $14,184,051 <1 $31,761,822 1.0
Source: HAZUS-MH v2.1; Putnam County Planning Department, 2014; Putnam County Real Property Tax Service, 2014
Note: RCV = Replacement Cost Value (structure and contents); % = Percent.

Section 5.4.3: Risk Assessment – Flood
DMA 2000 Hazard Mitigation Plan – Putnam County, New York 5.4.3-30
February 2015
NFIP Statistics
In addition to total building stock modeling, individual data available on flood policies, claims, Repetitive
Loss Properties (RLP) and severe RLP (SRLs) were analyzed. FEMA Region 2 provided a list of residential
properties with NFIP policies, past claims and multiple claims (RLPs). According to the metadata provided:
“The (sic National Flood Insurance Program) NFIP Repetitive Loss File contains losses reported from
individuals who have flood insurance through the Federal Government. A property is considered a
repetitive loss property when there are two or more losses reported which were paid more than $1,000 for
each loss. The two losses must be within 10 years of each other & be as least 10 days apart. Only losses
from (sic since) 1/1/1978 that are closed are considered.”
SRLs were then examined for the County. According to section 1361A of the National Flood Insurance
Act, as amended (NFIA), 42 U.S.C. 4102a, an SRL property is defined as a residential property that is covered
under an NFIP flood insurance policy and:
Has at least four NFIP claim payments (including building and contents) over $5,000 each, and the
cumulative amount of such claims payments exceeds $20,000; or
For which at least two separate claims payments (building payments only) have been made with the
cumulative amount of the building portion of such claims exceeding the market value of the building.
For both of the above, at least two of the referenced claims must have occurred within any 10- year
period, and must be greater than 10 days apart.
Table 5.4.3-11 and Figure 5.4.3-5 summarize the NFIP policies, claims and repetitive loss statistics for
Putnam County. According to FEMA, Table 5.4.3-9 summarizes the occupancy classes of the repetitive loss
and severe repetitive loss properties in the County. The majority of the repetitive loss occupancy class is
single family residences (92.9%). The number of severe repetitive loss properties is split between other
residential and non-residential (50%) (FEMA, 2014). This information is current as of February 28th, 2014.
The location of the properties with policies, claims and repetitive and severe repetitive flooding were
geocoded by FEMA with the understanding that there are varying tolerances between how closely the
longitude and latitude coordinates correspond to the location of the property address, or that the indication of
some locations are more accurate than others.
Table 5.4.3-9. Occupancy Class of Repetitive Loss Structures in Putnam County
Occupancy Class
Total Number of Repetitive Loss (RL)
Properties
Total Number of Severe Repetitive Loss (SRL)
Properties Total
(RL + SRL)
Single Family 13 1 14
Condo 0 0 0
2-4 Family 0 0 0
Other Residential 1 0 1
Non Residential 0 1 1
Putnam County 14 2 16
Source: FEMA Region 2, 2014 Note: Policies, claims, repetitive loss and severe repetitive loss statistics provided by FEMA Region 2, and are current as of February 28,
2014.
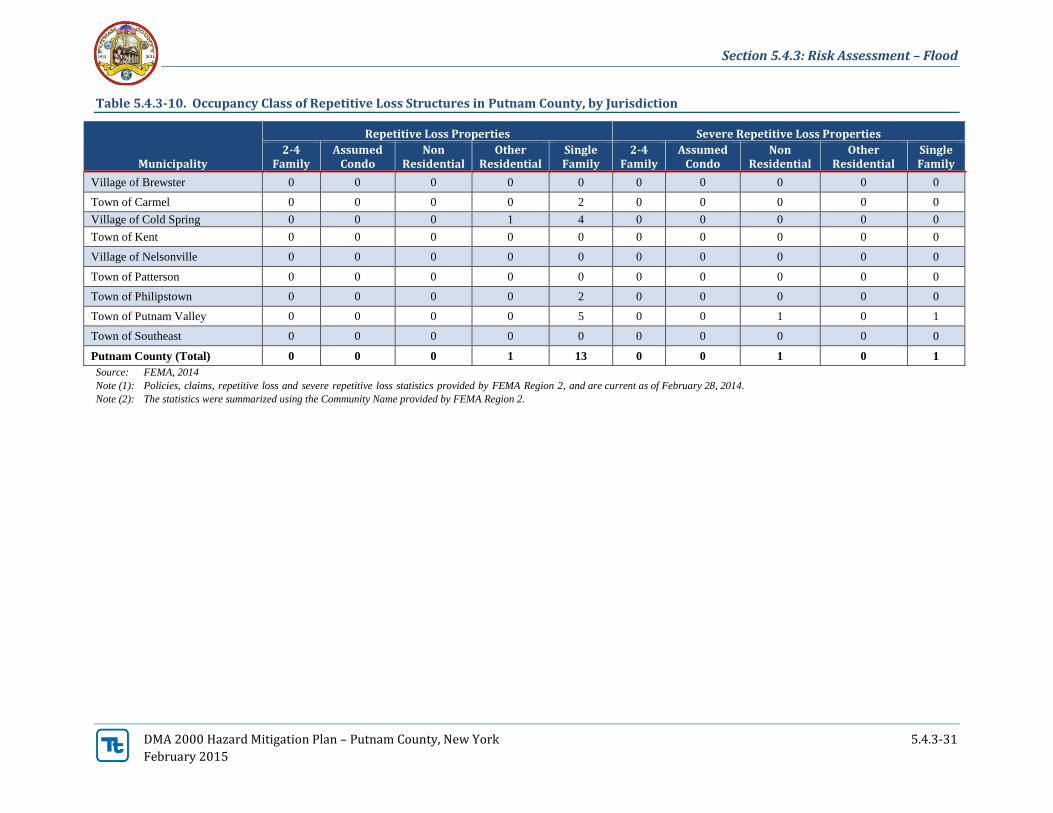
Section 5.4.3: Risk Assessment – Flood
DMA 2000 Hazard Mitigation Plan – Putnam County, New York 5.4.3-31
February 2015
Table 5.4.3-10. Occupancy Class of Repetitive Loss Structures in Putnam County, by Jurisdiction
Municipality
Repetitive Loss Properties Severe Repetitive Loss Properties
2-4 Family
Assumed Condo
Non Residential
Other Residential
Single Family
2-4 Family
Assumed Condo
Non Residential
Other Residential
Single Family
Village of Brewster 0 0 0 0 0 0 0 0 0 0
Town of Carmel 0 0 0 0 2 0 0 0 0 0
Village of Cold Spring 0 0 0 1 4 0 0 0 0 0
Town of Kent 0 0 0 0 0 0 0 0 0 0
Village of Nelsonville 0 0 0 0 0 0 0 0 0 0
Town of Patterson 0 0 0 0 0 0 0 0 0 0
Town of Philipstown 0 0 0 0 2 0 0 0 0 0
Town of Putnam Valley 0 0 0 0 5 0 0 1 0 1
Town of Southeast 0 0 0 0 0 0 0 0 0 0
Putnam County (Total) 0 0 0 1 13 0 0 1 0 1
Source: FEMA, 2014
Note (1): Policies, claims, repetitive loss and severe repetitive loss statistics provided by FEMA Region 2, and are current as of February 28, 2014.
Note (2): The statistics were summarized using the Community Name provided by FEMA Region 2.

Section 5.4.3: Risk Assessment – Flood
DMA 2000 Hazard Mitigation Plan – Putnam County, New York 5.4.3-32
February 2015
Table 5.4.3-11. NFIP Policies, Claims and Repetitive Loss Statistics
Municipality # Policies
(1)
# Claims (Losses)
(1) Total Loss
Payments (2)
# Rep. Loss
Prop. (1)
Severe Rep. Loss
Prop. (1)
# Policies in the
1% Flood Boundary (3)
Village of Brewster 5 6 $41,240.74 0 0 0
Town of Carmel 81 72 $276,035.76 2 0 5
Village of Cold Spring 17 23 $1,904,171.94 5 0 10
Town of Kent 26 12 $28,811.47 0 0 2
Village of Nelsonville 4 2 $32,205.41 0 0 4
Town of Patterson 37 7 $133,664.53 0 0 15
Town of Philipstown 82 36 $1,119,896.61 2 0 16
Town of Putnam Valley 80 62 $1,424,804.40 5 2 15
Town of Southeast 48
4
$27,544.31
0 0 10
Putnam County (Total) 380 224 $4,988,375.17
14 2 77
Source: FEMA, 2014
Note (1) Policies, claims, repetitive loss and severe repetitive loss statistics provided by FEMA and are current as of February 28, 2014 and are summarized by Community Name. Please note the
total number of repetitive loss properties excludes the severe repetitive loss properties. The number of claims represents claims closed by 2/28/2014.
Note (2) Total building and content losses from the claims file provided by FEMA Region 2.
Note (3) The policies inside and outside of the flood zones is based on the latitude and longitude provided by FEMA Region 2 in the policy file.
Note (4) FEMA noted that where there is more than one entry for a property, there may be more than one policy in force or more than one GIS possibility.

Section 5.4.3: Risk Assessment – Flood
DMA 2000 Hazard Mitigation Plan – Putnam County, New York 5.4.3-33
February 2015
Figure 5.4.3-5. NFIP Repetitive Loss Areas
Source: FEMA Region 2, 2014

Section 5.4.3: Risk Assessment – Flood
DMA 2000 Hazard Mitigation Plan – Putnam County, New York 5.4.3-34
February 2015
Impact on Critical Facilities
HAZUS-MH was used to estimate the flood loss potential to critical facilities exposed to the flood risk. Using
depth/damage function curves, HAZUS estimates the percent of damage to the building and contents of
critical facilities. Table 5.4.3-12 t h r o u g h Table 5.4.3-14 summarizes the number of critical facilities
located in the FEMA flood zones by type and by jurisdiction. Table 5.4.3-14 lists the critical facilities and
utilities located in the FEMA flood zones and the percent damage HAZUS-MH 2.1 estimates to the
facility as a result of the 1- and 0.2-percent annual chance events.
In cases where short-term functionality is impacted by a hazard, other facilities of neighboring municipalities
may need to increase support response functions during a disaster event. Mitigation planning should consider
means to reduce impact to critical facilities and ensure sufficient emergency and school services remain when a
significant event occurs. Actions addressing shared services agreements are included in Section 9 (Mitigation
Strategies) of this plan.
Table 5.4.3-12. Number of Critical Facilities Located in the 1-Percent Annual Chance Flood Boundaries
Municipality
Facility Types
Bo
at
Fa
cili
tie
s
Da
m
Ele
ctri
c
Go
ve
rnm
en
t
Hig
hw
ay
Bri
dg
e
Na
tura
l G
as
Ra
il B
rid
ge
Ra
il F
aci
lity
UD
F
Wa
ste
wa
ter
Village of Brewster 0 0 0 0 0 0 0 1 0 1
Town of Carmel 0 9 0 0 0 1 0 0 5 5
Village of Cold Spring 1 1 0 0 0 0 0 0 0 1
Town of Kent 0 4 0 0 2 0 0 0 0 0
Village of Nelsonville 0 0 0 0 0 0 0 0 0 0
Town of Patterson 0 4 0 0 3 0 1 0 0 0
Town of Philipstown 0 2 0 0 0 0 0 0 0 0
Town of Putnam Valley 0 2 0 1 0 0 0 0 0 0
Town of Southeast 0 5 1 0 0 0 0 1 0 0
Putnam County (Total) 1 27 1 1 5 1 1 2 5 7
Source: FEMA, 2013; Planning Committee
Note: UDF = User Defined

Section 5.4.3: Risk Assessment – Flood
DMA 2000 Hazard Mitigation Plan – Putnam County, New York 5.4.3-35
February 2015
Table 5.4.3-13. Number of Critical Facilities Located in the 0.2-Percent Annual Chance Flood Boundaries
Municipality
Facility Types
Bo
at
Co
mm
erc
ial
Da
m
Ele
ctri
c
Go
ve
rnm
en
t
Hig
hw
ay
Bri
dg
e
Po
tab
le W
ate
r
Ra
il B
rid
ge
Ra
il F
aci
lity
UD
F
Wa
ste
wa
ter
Village of Brewster 0 0 0 0 0 0 0 0 0 1 0
Town of Carmel 0 0 9 0 0 0 1 0 0 0 5
Village of Cold Spring 1 0 1 0 0 0 0 0 0 0 0
Town of Kent 0 0 4 0 0 2 0 0 0 0 0
Village of Nelsonville 0 0 0 0 0 0 0 0 0 0 0
Town of Patterson 0 1 4 0 0 3 1 1 1 0 0
Town of Philipstown 0 0 3 0 0 0 0 0 0 0 0
Town of Putnam Valley 0 0 2 0 1 0 0 0 0 0 0
Town of Southeast 0 0 5 1 0 0 0 0 0 1 0
Putnam County (Total) 1 1 28 1 1 5 2 1 1 2 5
Source: FEMA, 2013; Planning Committee
Note: UDF – User Defined Facility

Section 5.4.3: Risk Assessment – Flood
DMA 2000 Hazard Mitigation Plan – Putnam County, New York 5.4.3-36
February 2015
Table 5.4.3-14. Critical Facilities Located in the 1-Percent and 0.2-Percent Annual Chance Flood Boundaries and Estimated Potential Damage
Source: HAZUS-MH 2.1
Note:
x = Facility located within the DFIRM boundary.
- = No loss calculated by HAZUS
NA = Not calculated in HAZUS
Please note it is assumed the wells and pump stations have electrical equipment and openings are three-feet above grade. If depth of water is less than 3 feet, no estimated damages are calculated.
(1) HAZUS-MH 2.1 provides a general indication of the maximum restoration time for 100% operations. Clearly, a great deal of effort is needed to quickly restore essential facilities to full
functionality; therefore this will be an indication of the maximum downtime (HAZUS-MH 2.1 User Manual).
Name Municipality Type
Exposure Potential Loss from 1%
Flood Event
1% Event 0.2% Event
% Structure Damage
% Content Damage
Brewster Metro North Brewster Rail Facility X - -
Par Street Pump Station Brewster Wastewater X - -
No name provided Carmel UDF X - -
No name provided Carmel UDF X - -
No name provided Carmel UDF X - -
No name provided Carmel UDF X - -
No name provided Carmel UDF X - -
Carmel waste water Carmel Wastewater X 8 -
Cen Hud - Stillwater Road Carmel Natural Gas X - -
SD2 Kelly Road Pump Carmel Wastewater X - -
SD2 Putnam Plaza Pump Station Carmel Wastewater X 8 -
SD4 Pumpstation Carmel Wastewater X - -
Sewer Plant 2 Primary Setting Tank Carmel Wastewater X 0 -
Boathouse Cold Spring Boat X - -
West Street Pump Station Cold Spring Wastewater X X - -
Ludington Court 1 Kent Highway Bridge X X - -
Ludington Court 2 Kent Highway Bridge X X - -
Brimstone Road Patterson Highway Bridge X X - -
Dorsett Hollow Water Treatment Plant Patterson Potable Water X
FRONT STREET PUMP STATION Patterson Wastewater X - -
NYS Route 164 Patterson Rail Bridge X X - -
Patterson Automotive Patterson Commercial X - -
Patterson Automotive Patterson Natural Gas X - -
Route 22 Bridge Patterson Highway Bridge X X - -
Route 311 Bridge Patterson Highway Bridge X X - -
GOVERNMENT Putnam Valley Government X X 0 0
NYSEG - Putnam Lake Southeast Electric X X 12 -
Southeast station Southeast Rail Facility X X - -

Section 5.4.3: Risk Assessment – Flood
DMA 2000 Hazard Mitigation Plan – Putnam County, New York 5.4.3-37
February 2015
(2) In some cases, a facility may be located in the DFIRM flood hazard boundary; however HAZUS did not calculate potential loss. This may be because the depth of flooding does not amount
to any damages to the structure according to the depth damage function used in HAZUS for that facility type.
(3) Dams located in the floodplain are not listed in the table above. HAZUS does not calculate potential losses to a dam as a result of a flood event.

Section 5.4.3: Risk Assessment – Flood
DMA 2000 Hazard Mitigation Plan – Putnam County, New York 5.4.3-38 February 2015
Impact on the Economy
For impact on economy, estimated losses from a flood event are considered. Losses include but are not
limited to general building stock damages, agricultural losses, business interruption, impacts to tourism and
tax base to Putnam County. Damages to general building stock can be quantified using HAZUS-MH as
discussed above. Other economic components such as loss of facility use, functional downtime and social
economic factors are less measurable with a high degree of certainty.
Flooding can cause extensive damage to public utilities and disruptions to the delivery of services. Loss of
power and communications may occur; and drinking water and wastewater treatment facilities may be
temporarily out of operation. Flooded streets and road blocks make it difficult for emergency vehicles to
respond to calls for service. Floodwaters can wash out sections of roadway and bridges (Foster, Date
Unknown).
Direct building losses are the estimated costs to repair or replace the damage caused to the building. Refer to
the ‘Impact on General Building Stock’ subsection which discusses these potential losses. These dollar value
losses to the County’s total building inventory replacement value, in addition to damages to roadways and
infrastructure, would greatly impact the local economy.
HAZUS-MH estimates the amount of debris generated from the 1-percent annual chance event. The model
breaks down debris into three categories: 1) finishes (dry wall, insulation, etc.); 2) structural (wood, brick,
etc.) and 3) foundations (concrete slab and block, rebar, etc.). The distinction is made because of the different
types of equipment needed to handle the debris. Table 5.4.3-15 summarizes the debris HAZUS-MH 2.1
estimates for these events.
Table 5.4.3-15. Estimated Debris Generated from the 1-Percent Flood Event
Municipality
1% Flood Event
Total
(tons)
Finish
(tons)
Structure
(tons)
Foundation
(tons)
Village of Brewster 82 79 2 1
Town of Carmel 2,386 975 793 617
Village of Cold Spring 263 167 59 37
Town of Kent 118 81 20 17
Village of Nelsonville 22 21 1 0
Town of Patterson 868 789 46 33
Town of Philipstown 875 616 155 104
Town of Putnam Valley 310 299 6 4
Town of Southeast 1,248 726 306 217
Putnam County (Total) 6,171 3,753 1,388 1,031
Source: HAZUS-MH 2.1
Effect of Climate Change on Vulnerability
Climate is defined not simply as average temperature and precipitation but also by the type, frequency and
intensity of weather events. Both globally and at the local scale, climate change has the potential to alter the
prevalence and severity of extremes such as flood events. While predicting changes of flood events under a
changing climate is difficult, understanding vulnerabilities to potential changes is a critical part of estimating
future climate change impacts on human health, society and the environment (U.S. Environmental Protection
Agency [EPA], 2006).

Section 5.4.3: Risk Assessment – Flood
DMA 2000 Hazard Mitigation Plan – Putnam County, New York 5.4.3-39 February 2015
Future Growth and Development
As discussed in Section 4, areas targeted for future growth and development have been identified across the
County. Any areas of growth could be potentially impacted by the flood hazard if located within the
identified hazard areas. It is the intention of the County to discourage development in vulnerable areas or to
encourage higher regulatory standards on the local level.
Additional Data and Next Steps
A HAZUS-MH flood analysis was conducted for Putnam County using the most current and best available
data including updated building and critical facility inventories, and DFIRM. For future plan updates, more
accurate exposure and loss estimates can be produced by replacing the national default demographic inventory
with 2010 U.S. Census data when it becomes available in the HAZUS-MH model.
FEMA’s Risk Mapping, Assessment, and Planning (Risk MAP) program provides the flood depth and
analysis grids as part of the publicly available DFIRM deliverable. When these depth grids are available for
Putnam County, they can be incorporated into HAZUS and used to recalculate the potential losses to the
County’s inventory for these recurrence intervals.
Specific mitigation actions addressing improved data collection and further vulnerability analysis is included
in Volume II, Section 9 of this plan.