Embed Size (px)
Citation preview
SECTION 5.4.3 – EARTHQUAKE
DMA 2000 Hazard Mitigation Plan Update – Mercer County, New Jersey 5.4.3-2June 2016
5.4.3 EARTHQUAKE
2016 HMP UPDATE CHANGES
The hazard profile has been significantly enhanced to include a detailed hazard description, location, extent,
previous occurrences, probability of future occurrence, and potential change in climate and its impacts on
the earthquake hazard is discussed. The earthquake hazard is now located in Section 5 of the plan update.
New and updated figures from federal and state agencies are incorporated. The 2010 U.S. Census data has
been incorporated, where appropriate.
Previous occurrences were updated with events that occurred between 2008 and 2015.
A vulnerability assessment was conducted for the earthquake hazard using FEMA’s HAZUS-MH
earthquake model; it now directly follows the hazard profile.
The following section provides the hazard profile (hazard description, location, extent, previous occurrences and
losses, probability of future occurrences, and impact of climate change) and vulnerability assessment for the
earthquake hazard in Mercer County.
5.4.3.1 PROFILE
Hazard Description
An earthquake is the sudden movement of the Earth’s surface caused by the release of stress accumulated within
or along the edge of the Earth’s tectonic plates, a volcanic eruption, or by a manmade explosion (Federal
Emergency Management Agency [FEMA] 2001; Shedlock and Pakiser 1997). Most earthquakes occur at the
boundaries where the Earth’s tectonic plates meet (faults); less than 10% of earthquakes occur within plate
interiors. New Jersey is in an area where the rarer plate interior-related earthquakes occur. As plates continue
to move and plate boundaries change geologically over time, weakened boundary regions become part of the
interiors of the plates. These zones of weakness within the continents can cause earthquakes in response to
stresses that originate at the edges of the plate or in the deeper crust (Shedlock and Pakiser 1997).
According to the U.S. Geological Society (USGS) Earthquake Hazards Program, an earthquake hazard is any
disruption associated with an earthquake that may affect residents’ normal activities. This includes surface
faulting, ground shaking, landslides, liquefaction, tectonic deformation, tsunamis, and seiches; each of these
terms is defined below:
Surface faulting: Displacement that reaches the earth's surface during a slip along a fault. Commonlyoccurs with shallow earthquakes—those with an epicenter less than 20 kilometers.
Ground motion (shaking): The movement of the earth's surface from earthquakes or explosions. Groundmotion or shaking is produced by waves that are generated by a sudden slip on a fault or sudden pressureat the explosive source and travel through the Earth and along its surface.
Landslide: A movement of surface material down a slope. Liquefaction: A process by which water-saturated sediment temporarily loses strength and acts as a
fluid, like the wet sand near the water at the beach. Earthquake shaking can cause this effect.Liquefaction susceptibility is determined by the geological history, depositional setting, and topographicposition of the soil (Stanford 2003). Liquefaction effects may occur along the shorelines of the ocean,rivers, and lakes and they can also happen in low-lying areas away from water bodies in locations wherethe ground water is near the earth’s surface.
Tectonic Deformation: A change in the original shape of a material caused by stress and strain.

SECTION 5.4.3 – EARTHQUAKE
DMA 2000 Hazard Mitigation Plan Update – Mercer County, New Jersey 5.4.3-3June 2016
Tsunami: A sea wave of local or distant origin that results from large-scale seafloor displacementsassociated with large earthquakes, major sub-marine slides, or exploding volcanic islands.
Seiche: The sloshing of a closed body of water, such as a lake or bay, from earthquake shaking (USGS2012a).
Location
Earthquakes are most likely to occur in the northern parts of New Jersey, where significant faults are
concentrated; however, low-magnitude events can and do occur in many other areas of the State, including
Mercer County. The National Earthquake Hazard Reduction Program (NEHRP) developed five soil
classifications defined by their shear-wave velocity that impact the severity of an earthquake. The soil
classification system ranges from A to E, as noted in Table 5.4.3-1, where A represents hard rock that reduces
ground motions from an earthquake and E represents soft soils that amplify and magnify ground shaking and
increase building damage and losses. Studies have not yet been conducted by NJGWS to determine the NEHRP
classifications for Mercer County; however, other New Jersey agencies have compiled similar data on soil
classification for the county.
Table 5.4.3-1. NEHRP Soil Classifications
Soil Classification Description
A Hard Rock
B Rock
C Very dense soil and soft rock
D Stiff soils
E Soft soils
Source: FEMA 2013
New Jersey Department of Transportation (NJDOT) compiled a report on seismic design consideration for
bridges in New Jersey, dated March 2012. In the report, NJDOT classifies the seismic nature of soils according
to the American Association of State Highway and Transportation Officials (AASHTO) Guide Specifications
for Bridge Seismic Design (SGS). For the purpose of seismic analysis and design, sites can be classified into
Soil Classes A, B, C, D, E and F, ranging from hard rock to soft soil and special soils (similar to the NEHRP
soil classifications with an additional class F); refer to Table 5.4.3-2.
Table 5.4.3-2. NJDOT Soil Classifications
Soil Classification Description
A-B Rock sites
C Very dense soil
D Dense soil
E Soft soil
FSpecial soil requiring site-specific
analysis
Source: NJDOT 2012

SECTION 5.4.3 – EARTHQUAKE
DMA 2000 Hazard Mitigation Plan Update – Mercer County, New Jersey 5.4.3-4June 2016
NJDOT also developed a Geotechnical Database Management System, which contains soil boring data across
New Jersey. The soil boring logs were then used to classify soil sites. Through this analysis, NJDOT developed
a map of soil site classes according to ZIP codes in New Jersey where each ZIP code was assigned a class based
on its predominant soil condition. In Mercer County, about half the county was rated as a Category C and the
other half as Category D. A very small portion of the county is considered Category B. Figure 5.4.3-1 provides
a visual confirmation of this information.
Figure 5.4.3-1. ZIP Code-Based Soil Site Class Map
Source: NJDOT 2012
Note: Mercer County is indicated by the black circle.
Soil Classes A and B are rock sites
Soil Class C is very dense soil
Soil Class D is dense soil
Soil Class E is soft soil
Soil Class F is special soil requiring site-specific analysis

SECTION 5.4.3 – EARTHQUAKE
DMA 2000 Hazard Mitigation Plan Update – Mercer County, New Jersey 5.4.3-5June 2016
Liquefaction has been responsible for tremendous amounts of damage in historical earthquakes around the world.
Shaking behavior and liquefaction susceptibility of soils are determined by their grain size, thickness,
compaction, and degree of saturation. These properties, in turn, are determined by the geologic origin of the
soils and their topographic position. Although this data has been calculated for parts of New Jersey, NJGWS
has not yet completed this for Mercer County, New Jersey. Based on the analyses for the neighboring counties
of Monmouth, Middlesex, and Somerset, it is likely that Mercer County has similar susceptibility. Once test
boring samples are conducted and calculated for Mercer County, more accurate data regarding liquefaction
vulnerability in specific areas will be able to be determined.
Liquefaction occurs in saturated soils and when it occurs, the strength of the soil decreases and the ability of a
soil deposit to support foundations for buildings and bridges is reduced. Shaking from earthquakes often triggers
an increase in water pressure which can trigger landslides and the collapse of dams. For information regarding
dam failures, refer to Section 5.4.1 (Dam Failure) and for landslides refer to Section 5.4.6 (Geological Hazards).
On the other side, earthquakes contribute to landslide hazards. Earthquakes create stresses that make weak
slopes fail. Earthquakes of magnitude 4.0 or greater have been known to trigger landslides.
Fractures or fracture zones along with rocks on adjacent sides have broken and moved upward, downward, or
horizontally are known as faults (Volkert and Witte 2015). Movement can take place at faults and cause an
earthquake. Earthquake epicenters in eastern North America and the New Jersey area, however, do not typically
occur on known faults. The faults in these areas are the result of tectonic activity from over 200 million years
ago. Many faults can be located in New Jersey, and one of the most well-known faults in the state is the Ramapo
Fault, which separates the Piedmont and Highlands Physiographic Provinces.
The Ramapo Fault is part of a system of northeast striking, southeast-dipping faults, which runs from
southeastern New York State to the Hudson River at Stony Point, through eastern Pennsylvania and beyond.
The fault is a hairline fracture, 50 miles long, and is located 35 miles from New York City. Seismographic
stations, part of the Advanced National Seismic System, are used to monitor earthquakes and ground motion
near important buildings and critical infrastructure along this fault (Lamont-Doherty 2004; Pasfield Unknown).
Numerous minor earthquakes have been recorded in the Ramapo Fault zone, a 10 to 20 mile wide area lying
adjacent to and west of the actual fault (Dombroski 2005). Figure 5.4.3-2 shows the location of the Ramapo
Fault Line and its relation to Mercer County. Please note that even though the Ramapo Fault is not located in
the county, the county might feel the effects of an earthquake along this fault line.

SECTION 5.4.3 – EARTHQUAKE
DMA 2000 Hazard Mitigation Plan Update – Mercer County, New Jersey 5.4.3-6June 2016
Figure 5.4.3-2. Ramapo Fault Line in New Jersey
Source: Dombroski 2005
Note: The red circle indicates the approximate location of Mercer County.
Extent
An earthquake’s magnitude and intensity are used to describe the size and severity of the event. Magnitude
describes the size at the focus of an earthquake and intensity describes the overall felt severity of shaking during
the event. The earthquake’s magnitude is a measure of the energy released at the source of the earthquake and
is expressed by ratings on the Richter scale and/or the moment magnitude scale. The Richter Scale measures
magnitude of earthquakes and has no upper limit; however, it is not used to express damage (USGS 2012c).
Table 5.4.3-3 presents the Richter scale magnitudes and corresponding earthquake effects.

SECTION 5.4.3 – EARTHQUAKE
DMA 2000 Hazard Mitigation Plan Update – Mercer County, New Jersey 5.4.3-7June 2016
Table 5.4.3-3. Richter Magnitude Scale
Richter Magnitude Earthquake Effects
2.5 or less Usually not felt, but can be recorded by seismograph
2.5 to 5.4 Often felt, but causes only minor damage
5.5 to 6.0 Slight damage to buildings and other structures
6.1 to 6.9 May cause a lot of damage in very populated areas
7.0 to 7.9 Major earthquake; serious damage
8.0 or greater Great earthquake; can totally destroy communities near the epicenter
Source: Michigan Tech University Date Unknown
The moment magnitude scale (MMS) is used to describe the size of an earthquake. It is based on the seismic
moment and is applicable to all sizes of earthquakes (USGS 2012d). The Richter Scale is not commonly used
anymore, as it has been replaced by the MMS which is a more accurate measure of the earthquake size (USGS
2012c). The MMS uses the following classifications of magnitude:
Great—Mw > 8
Major—Mw = 7.0 - 7.9
Strong—Mw = 6.0 - 6.9
Moderate—Mw = 5.0 - 5.9
Light—Mw = 4.0 - 4.9
Minor—Mw = 3.0 - 3.9
Micro—Mw < 3
The intensity of an earthquake is based on the observed effects of ground shaking on people, buildings, and
natural features, and varies with location. The Modified Mercalli (MMI) scale expresses intensity of an
earthquake and describes how strong a shock was felt at a particular location in values. Table 5.4.3-4 summarizes
earthquake intensity as expressed by the Modified Mercalli scale. Table 5.4.3-5 displays the MMI scale and its
relationship to the areas peak ground acceleration.
Table 5.4.3-4. Modified Mercalli Intensity Scale
MercalliIntensity Shaking Description
I Not Felt Not felt except by a very few under especially favorable conditions.
II Weak Felt only by a few persons at rest, especially on upper floors of buildings.
III WeakFelt quite noticeably by persons indoors, especially on upper floors of buildings. Many people do notrecognize it as an earthquake. Standing motor cars may rock slightly. Vibrations similar to thepassing of a truck. Duration estimated.
IV LightFelt indoors by many, outdoors by few during the day. At night, some awakened. Dishes, windows,doors disturbed; walls make cracking sound. Sensation like heavy truck striking building. Standingmotor cars rocked noticeably.
V ModerateFelt by nearly everyone; many awakened. Some dishes, windows broken. Unstable objectsoverturned. Pendulum clocks may stop.
VI StrongFelt by all, many frightened. Some heavy furniture moved; a few instances of fallen plaster. Damageslight.
VII Very StrongDamage negligible in buildings of good design and construction; slight to moderate in well-builtordinary structures; considerable damage in poorly built or badly designed structures; some chimneysbroken.

SECTION 5.4.3 – EARTHQUAKE
DMA 2000 Hazard Mitigation Plan Update – Mercer County, New Jersey 5.4.3-8June 2016
Table 5.4.3-4. Modified Mercalli Intensity Scale
MercalliIntensity Shaking Description
VIII SevereDamage slight in specially designed structures; considerable damage in ordinary substantial buildingswith partial collapse. Damage great in poorly built structures. Fall of chimneys, factory stacks,columns, monuments, walls. Heavy furniture overturned.
IX ViolentDamage considerable in specially designed structures; well-designed frame structures thrown out ofplumb. Damage great in substantial buildings, with partial collapse. Buildings shifted off foundations.
X ExtremeSome well-built wooden structures destroyed; most masonry and frame structures destroyed withfoundations. Rails bent.
Source: USGS 2014
Table 5.4.3-5. Modified Mercalli Intensity and PGA Equivalents
Modified Mercalli
Intensity Acceleration (%g) (PGA) Perceived Shaking Potential Damage
I < .17 Not Felt None
II .17 – 1.4 Weak None
III .17 – 1.4 Weak None
IV 1.4 – 3.9 Light None
V 3.9 – 9.2 Moderate Very Light
VI 9.2 – 18 Strong Light
VII 18 – 34 Very Strong Moderate
VIII 34 – 65 Severe Moderate to Heavy
IX 65-124 Violent Heavy
X >124 Extreme Very Heavy
Source: Freeman et al. (Purdue University) 2004
Note: PGA Peak Ground Acceleration
Most damage and loss caused by an earthquake is directly or indirectly the result of ground shaking. Modern
intensity scales use terms that can be physically measured with seismometers, such as the acceleration, velocity,
or displacements (movement) of the ground. The most common physical measure is peak ground acceleration
(PGA). PGA is one of the most important measures used to quantify ground motion. PGA is a good index of
hazard to buildings because there is a strong correlation between it and the damage a building might experience
(NYCEM 2003).
PGA expresses the severity of an earthquake and is a measure of how hard the earth shakes, or accelerates, in a
given geographic area. PGA is expressed as a percent acceleration force of gravity (%g). For example, 1.0%g
PGA in an earthquake (an extremely strong ground motion) means that objects accelerate sideways at the same
rate as if they had been dropped from the ceiling. 10%g PGA means that the ground acceleration is 10% that of
gravity (NJOEM 2011). Damage levels experienced in an earthquake vary with the intensity of ground shaking
and with the seismic capacity of structures, as noted in Table 5.4.3-6.
Table 5.4.3-6. Damage Levels Experienced in Earthquakes
Ground MotionPercentage Explanation of Damages
1-2%gMotions are widely felt by people; hanging plants and lamps swing strongly, but damage levels, if any,are usually very low.

SECTION 5.4.3 – EARTHQUAKE
DMA 2000 Hazard Mitigation Plan Update – Mercer County, New Jersey 5.4.3-9June 2016
Table 5.4.3-6. Damage Levels Experienced in Earthquakes
Ground MotionPercentage Explanation of Damages
Below 10%g Usually causes only slight damage, except in unusually vulnerable facilities.
10 - 20%gMay cause minor-to-moderate damage in well-designed buildings, with higher levels of damage inpoorly designed buildings. At this level of ground shaking, only unusually poor buildings would besubject to potential collapse.
20 - 50%gMay cause significant damage in some modern buildings and very high levels of damage (includingcollapse) in poorly designed buildings.
≥50%g May causes higher levels of damage in many buildings, even those designed to resist seismic forces.
Source: NJOEM 2011
Note: %g Peak Ground Acceleration
National maps of earthquake shaking hazards have been produced since 1948. They provide information
essential to creating and updating the seismic design requirements for building codes, insurance rate structures,
earthquake loss studies, retrofit priorities and land use planning used in the U.S. Scientists frequently revise
these maps to reflect new information and knowledge. Buildings, bridges, highways and utilities built to meet
modern seismic design requirements are typically able to withstand earthquakes better, with less damages and
disruption. After thorough review of the studies, professional organizations of engineers update the seismic-risk
maps and seismic design requirements contained in building codes (Brown et al., 2001).
The USGS updated the National Seismic Hazard Maps in 2014, which superceded the 2008 maps. New seismic,
geologic, and geodetic information on earthquake rates and associated ground shaking were incorporated into
these revised maps. The 2014 map represents the best available data as determined by the USGS. According to
the data, Mercer County has a PGA between 3%g and 5%g; however, the PGA drops to between 2%g and 3%g
almost immediately south of the county borders (USGS 2014). The 2014 PGA map can be found at
http://earthquake.usgs.gov/hazards/products/conterminous/2014/2014pga10pct.pdf
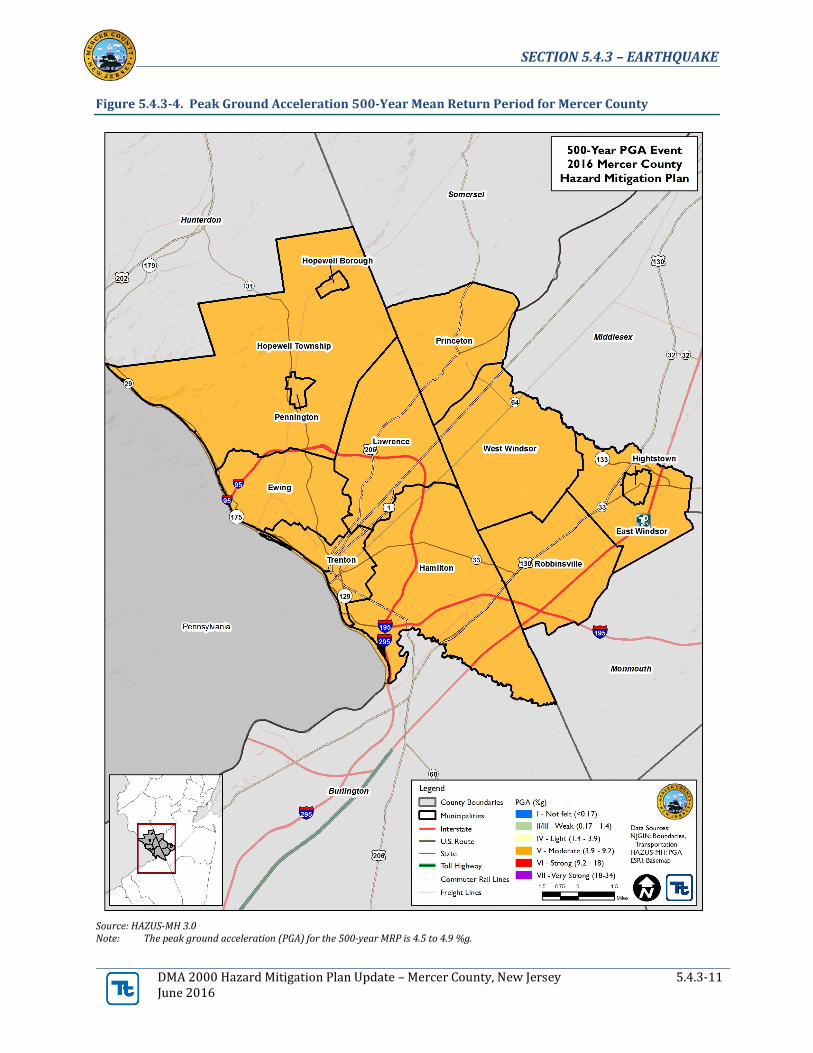
A probabilistic assessment was conducted for the 100-, 500- and 2,500-year mean return periods (MRP) in
HAZUS-MH 3.0 to analyze the earthquake hazard for Mercer County. The HAZUS-MH analysis evaluates the
statistical likelihood that a specific event will occur and associated estimated consequences. Figure 5.4.3-3
through Figure 5.4.3-5 illustrates the geographic distribution of PGA (g) across the county for the 100-, 500- and
2,500-year MRP events by U.S. Census-tract.

SECTION 5.4.3 – EARTHQUAKE
DMA 2000 Hazard Mitigation Plan Update – Mercer County, New Jersey 5.4.3-10June 2016
Figure 5.4.3-3. Peak Ground Acceleration 100-Year Mean Return Period for Mercer County
Source: HAZUS-MH 3.0Note: The peak ground acceleration (PGA) for the 100-year MRP is 1.1 to 1.2 %g.
SECTION 5.4.3 – EARTHQUAKE
DMA 2000 Hazard Mitigation Plan Update – Mercer County, New Jersey 5.4.3-11June 2016
Figure 5.4.3-4. Peak Ground Acceleration 500-Year Mean Return Period for Mercer County
Source: HAZUS-MH 3.0Note: The peak ground acceleration (PGA) for the 500-year MRP is 4.5 to 4.9 %g.

SECTION 5.4.3 – EARTHQUAKE
DMA 2000 Hazard Mitigation Plan Update – Mercer County, New Jersey 5.4.3-12June 2016
Figure 5.4.3-5. Peak Ground Acceleration 2,500-Year Mean Return Period for Mercer County
Source: HAZUS-MH 3.0Note: The peak ground acceleration (PGA) for the 2,500-year MRP is 15.0 to 16.9 %g.

SECTION 5.4.3 – EARTHQUAKE
DMA 2000 Hazard Mitigation Plan Update – Mercer County, New Jersey 5.4.3-13June 2016
Previous Occurrences and Losses
Historically, New Jersey and Mercer County have not experienced a major earthquake. However, there have
been a number of earthquakes of relatively low intensity. The majority of earthquakes that have occurred in
New Jersey have occurred along faults in the central and eastern Highlands, with the Ramapo fault being the
most seismically active fault in the region (Volkert and Witte 2015); Mercer County can be impacted by
earthquakes in the New Jersey Highlands. Small earthquakes may occur several times a year and generally do
not cause significant damage. The largest earthquake to impact Mercer County was a magnitude 5.3 quake that
was west of New York City. It was felt from New Hampshire to Pennsylvania (Stover and Coffman 1993;
NJGWS 2014).
For the 2016 HMP update, known earthquake events that have impacted Mercer County or that have had its
epicenter in the county, between 2008 and 2015 are identified in Appendix E. The State of New Jersey has not
been included in any FEMA major disaster (DR) or emergency (EM) declarations for earthquake events (see
Table 5.4.3-7). For events that occurred prior to 2008, see the 2011 Mercer County HMP. Figure 5.4.3-6
illustrates earthquake events where the epicenters were located in Mercer County. The figure shows that two
earthquakes had epicenters in the county (NJGWS 2015).
Table 5.4.3-7. FEMA DR and EM Declarations Since 2008 for Earthquake Events in Mercer County
FEMA DeclarationNumber Date(s) of Event Event Type Location
No DR or EM Declarations were recorded for Mercer County during this time period.
Source: FEMA 2015

SECTION 5.4.3 – EARTHQUAKE
DMA 2000 Hazard Mitigation Plan Update – Mercer County, New Jersey 5.4.3-14June 2016
Figure 5.4.3-6. Earthquakes with Epicenters in Mercer County, 1783 to 2015
Source: NJDEP 2014

SECTION 5.4.3 – EARTHQUAKE
DMA 2000 Hazard Mitigation Plan Update – Mercer County, New Jersey 5.4.3-15June 2016
Probability of Future Occurrences
Earthquakes cannot be predicted and may occur any time of the day or year. The probability of damaging
earthquakes affecting Mercer County is low. However, there is a definite threat of major earthquakes that could
cause widespread damage and casualties in the county and throughout New Jersey. Major earthquakes are
infrequent in the state and county and may occur only once every few hundred years or longer, but the
consequences of major earthquakes would be very high.
According to the New Jersey Geological and Water Survey (NJGWS), since 2008, Mercer County has had no
earthquakes with epicenters in the county. The county has less than a 2 percent chance of having an earthquake
with an epicenter somewhere in Mercer County in any given year; however, it has nearly a 30 percent chance of
feeling an earthquake (regardless of the epicenter’s location) in any given year. The table below shows the
probability of future earthquakes impacting the county, as based on NJGWS historical data.
Table 5.4.3-7. Probability of Future Earthquake Events
Hazard Type
Number ofOccurrences
Between 1783and 2015
Rate ofOccurrence
orAnnual
Number ofEvents
(average)
RecurrenceInterval (in
years)(#
Years/Numberof Events)
Probability ofEvent in anygiven year
Percent chanceof occurrence inany given year
Earthquake withEpicenter insideCounty
2 0.01 86.50 0.01 1.16%
Earthquakes Felt bythe County (includingthose with epicentersoutside the County)
51 0.30 3.39 0.29 29.48%
Source: NJGWS 2015
In Section 5.3, the identified hazards of concern for Mercer County were ranked. The probability of occurrence,
or likelihood of the event, is one parameter used for hazard rankings. Based on historical records and input from
the Planning Committee, the probability of occurrence for earthquake events in the county is considered
‘occasional' (hazard event is likely to occur within 100 years see Table 5.3-3). Although earthquakes happen
frequently (likely to occur within 25 years), the level of historic impact is minimal; therefore, for the purposes
of the risk ranking a lower probability category was assigned (occasional).
Climate Change Impacts
Providing projections of future climate change for a specific region is challenging. Shorter term projections are
more closely tied to existing trends making longer term projections even more challenging. The further out a
prediction reaches the more subject to changing dynamics it becomes. The potential impacts of global climate
change on earthquake probability are unknown. Some scientists feel that melting glaciers could induce tectonic
activity. As ice melts and water runs off, tremendous amounts of weight are shifted on the Earth’s crust. As
newly freed crust returns to its original, pre-glacier shape, it could cause seismic plates to slip and stimulate
volcanic activity according to research into prehistoric earthquakes and volcanic activity. National Aeronautics
and Space Administration (NASA) and USGS scientists found that retreating glaciers in southern Alaska might
be opening the way for future earthquakes (New Jersey State HMP 2014).
Secondary impacts of earthquakes could be magnified by future climate change. Soils saturated by repetitive
storms could experience liquefaction during seismic activity because of the increased saturation. Dams storing

SECTION 5.4.3 – EARTHQUAKE
DMA 2000 Hazard Mitigation Plan Update – Mercer County, New Jersey 5.4.3-16June 2016
increased volumes of water from changes in the hydrograph could fail during seismic events. There are currently
no models available to estimate these impacts (New Jersey State HMP 2014).
5.4.3.2 VULNERABILITY ASSESSMENT
To understand risk, a community must evaluate what assets are exposed or vulnerable to the identified hazard.
For the earthquake hazard, the entire county has been identified as the exposed hazard area. Therefore, all assets
in Mercer County (population, structures, critical facilities and lifelines), as described in the County Profile
(Section 4), are potentially vulnerable. The following section includes an evaluation and estimation of the
potential impact of the earthquake hazard on Mercer County including the following:
Overview of vulnerability Data and methodology used for the evaluation Impact on: (1) life, health and safety of residents, (2) general building stock, (3) critical facilities, (4)
economy, and (5) future growth and development Effect of climate change on vulnerability Change of vulnerability as compared to that presented in the 2011 Mercer County HMP Further data collections that will assist understanding this hazard over time
Overview of Vulnerability
Earthquakes usually occur without warning and can impact areas a great distance from their point of origin. The
extent of damage depends on the density of population and building and infrastructure construction in the area
shaken by the quake. Some areas may be more vulnerable than others based on soil type, the age of the buildings
and building codes in place. Compounding the potential for damage – historically, Building Officials Code
Administration (BOCA) used in the Northeast were developed to address local concerns including heavy snow
loads and wind; seismic requirements for design criteria are not as stringent compared to the west coast’s reliance
on the more seismically-focused Uniform Building Code). As such, a smaller earthquake in the Northeast can
cause more structural damage than if it occurred out west.
Ground shaking is the primary cause of earthquake damage to man-made structures. Damage can be increased
when soft soils amplify ground shaking. Soils influence damage in different ways. One way is that soft soils
amplify the motion of earthquake waves, producing greater ground shaking and increasing the stresses on
structures. Another way is that loose, wet, sandy soils may lose strength and flow as a fluid when shaken,
causing foundations and underground structures to shift and break (Stanford 2003).
Damage from earthquakes depends on the location, depth, and magnitude of the earthquake; the thickness and
composition of soil and bedrock beneath the area in question; and the types of building structures. Soils influence
damage in two ways. Soft soils amplify the motion of earthquake waves, producing greater ground shaking and
increasing the stresses on structures. Loose, wet, sandy soils may lose strength and flow as a fluid when shaken
(this is known as liquefaction). This causes foundations and underground structures to shift and break.
The entire population, general building stock inventory and infrastructure of the county is at risk of being
damaged or experiencing losses due to impacts of an earthquake. Potential losses associated with the earth
shaking were calculated for Mercer County for three probabilistic earthquake events, the 100-year, 500- and
2,500-year mean return periods (MRP). The impacts on population, existing structures, critical facilities and the
economy within Mercer County are presented below, following a summary of the data and methodology used.
Data and Methodology
A probabilistic assessment was conducted for Mercer County for the 100-, 500- and 2,500-year MRPs through
a Level 2 analysis in HAZUS-MH 3.0 to analyze the earthquake hazard and provide a range of loss estimates for

SECTION 5.4.3 – EARTHQUAKE
DMA 2000 Hazard Mitigation Plan Update – Mercer County, New Jersey 5.4.3-17June 2016
Mercer County. The probabilistic method uses information from historic earthquakes and inferred faults,
locations and magnitudes, and computes the probable ground shaking levels that may be experienced during a
recurrence period by Census tract. NEHRP soil type data from the NJGWS is not available for Mercer County,
so HAZUS-MH default data was used.
In addition to the probabilistic scenarios mentioned, an annualized loss run was conducted in HAZUS-MH 3.0
to estimate the annualized general building stock dollar losses for the county. The annualized loss methodology
combines the estimated losses associated with ground shaking for eight return periods: 100, 250, 500, 750, 1,000,
1,500, 2,000, 2,500-year, which are based on values from the USGS seismic probabilistic curves. Annualized
losses are useful for mitigation planning because they provide a baseline upon which to 1) compare the risk of
one hazard across multiple jurisdictions and 2) compare the degree of risk of all hazards for each participating
jurisdiction.
As noted in the HAZUS-MH Earthquake User Manual ‘Uncertainties are inherent in any loss estimation
methodology. They arise in part from incomplete scientific knowledge concerning earthquakes and their effects
upon buildings and facilities. They also result from the approximations and simplifications that are necessary
for comprehensive analyses. Incomplete or inaccurate inventories of the built environment, demographics and
economic parameters add to the uncertainty. These factors can result in a range of uncertainly in loss estimates
produced by the HAZUS Earthquake Model, possibly at best a factor of two or more.’ However, HAZUS’
potential loss estimates are acceptable for the purposes of this HMP.
The building stock in HAZUS-MH was updated using the custom building inventory generated for the county.
The occupancy classes available in HAZUS-MH 3.0 were condensed into the following categories (residential,
commercial, industrial, agricultural, religious, government, and educational) to facilitate the analysis and the
presentation of results. Residential loss estimates address both multi-family and single family dwellings.
Impacts to critical facilities and utilities were also evaluated. The model estimated potential losses to buildings
at the Census-tract level; which for Mercer County align with municipal boundaries.
Data used to assess this hazard include data available in the HAZUS-MH 3.0 earthquake model and professional
knowledge.
Impact on Life, Health and Safety
Overall, the entire population of Mercer County is exposed to an earthquake event. The impact of earthquakes
on life, health and safety is dependent upon the severity of the event. Risk to public safety and loss of life from
an earthquake in Mercer County is minimal with higher risk occurring in buildings as a result of damage to the
structure, or people walking below building ornamentation and chimneys that may be shaken loose and fall as a
result of the quake.
Populations considered most vulnerable are those located in/near the built environment, particularly near
unreinforced masonry construction. In addition, the vulnerable population includes the elderly (persons over the
age of 65) and individuals living below the U.S. Census poverty threshold. These socially vulnerable populations
are most susceptible, based on a number of factors including their physical and financial ability to react or
respond during a hazard and the location and construction quality of their housing. Refer to Section 4 (County
Profile) for the vulnerable population statistics in Mercer County.
Residents may be displaced or require temporary to long-term sheltering due to the event. The number of people
requiring shelter is generally less than the number displaced as some displaced persons use hotels or stay with
family or friends following a disaster event. HAZUS-MH estimated sheltering needs for the earthquake hazard.
HAZUS-MH estimates there will be no displaced households or people seeking short-term shelter as a result of

SECTION 5.4.3 – EARTHQUAKE
DMA 2000 Hazard Mitigation Plan Update – Mercer County, New Jersey 5.4.3-18June 2016
the 100-year event. Table 5.4.3-8 summarizes the population HAZUS-MH estimates will be displaced or will
require short-term sheltering for 500- and 2,500-year MRP by municipality.
Table 5.4.3-8. Estimated Displaced Households and Population Seeking Short-Term Shelter from
500- and 2,500-year MRP Events by Municipality
Municipality
500-Year MRP 2,500-Year MRPDisplaced
HouseholdsPeople Requiring
Short-Term ShelterDisplaced
HouseholdsPeople Requiring
Short-Term Shelter
East Windsor Township 3 2 39 21
Ewing Township 3 2 35 21
Hamilton Township 6 3 77 41
Hightstown Borough 1 0 8 5
Hopewell Borough 0 0 2 1
Hopewell Township 0 0 5 3
Lawrence Township 3 2 42 23
Pennington Borough 0 0 0 0
Princeton 2 2 30 20
Robbinsville Township 1 1 13 7
Trenton City 5 5 65 60
West Windsor Township 2 1 25 13
Mercer County Total 27 17 341 215
Source: HAZUS-MH 3.0Note: The number of displaced households and persons seeking shelter was calculated using the 2010 U.S. Census data (HAZUS-MH 3.0default demographic data).
According to the 1999-2003 NYCEM Summary Report (Earthquake Risks and Mitigation in the New York /
New Jersey / Connecticut Region), there is a strong correlation between structural building damage and the
number of injuries and casualties from an earthquake event. Further, the time of day also exposes different
sectors of the community to the hazard. For example, HAZUS-MH considers the residential occupancy at its
maximum at 2:00 a.m., where the educational, commercial and industrial sectors are at their maximum at 2:00
p.m., and peak commute time is at 5:00 p.m. Whether directly impacted or indirectly impact, the entire
population will have to deal with the consequences of earthquakes to some degree. Business interruption could
keep people from working, road closures could isolate populations, and loss of functions of utilities could impact
populations that suffered no direct damage from an event itself.
There are no injuries or casualties estimated for the 100-year event. Table 5.4.3-9 and Table 5.4.3-10 summarize
the county-wide injuries and casualties estimated for the 500- and 2,500-year MRP earthquake events,
respectively.
Table 5.4.3-9. Estimated Number of Injuries and Casualties from the 500-Year MRP Earthquake Event
Level of Severity
Time of Day
2:00 AM 2:00 PM 5:00 PM
Injuries 7 11 8
Hospitalization 1 1 1
Casualties 0 0 0
Source: HAZUS-MH 3.0

SECTION 5.4.3 – EARTHQUAKE
DMA 2000 Hazard Mitigation Plan Update – Mercer County, New Jersey 5.4.3-19June 2016
Table 5.4.3-10. Estimated Number of Injuries and Casualties from the 2,500-Year MRP Earthquake
Event
Level of Severity
Time of Day
2:00 AM 2:00 PM 5:00 PM
Injuries 76 98 77
Hospitalization 12 18 13
Casualties 2 3 2
Source: HAZUS-MH 3.0
Impact on General Building Stock
After considering the population vulnerable to the earthquake hazard, the value of general building stock exposed
to and damaged by 100-, 500- and 2,500-year MRP earthquake events was evaluated. In addition, annualized
losses were calculated using HAZUS-MH 3.0. The entire county’s general building stock is considered at risk
and exposed to this hazard.
The HAZUS-MH 3.0 model estimates the value of the exposed building stock and the loss (in terms of damage
to the exposed stock). Refer to the County Profile (Section 4) for general building stock statistics (structure and
contents).
For this plan update, a HAZUS-MH probabilistic model was run to estimate annualized dollar losses for Mercer
County. Annualized losses are useful for mitigation planning because they provide a baseline upon which to 1)
compare the risk of one hazard across multiple jurisdictions and 2) compare the degree of risk of all hazards for
each participating jurisdiction. Please note that annualized loss does not predict what losses will occur in any
particular year. The estimated annualized losses are approximately $888,000 per year (building and contents)
for the county.
According to NYCEM, where earthquake risks and mitigation were evaluated in the New York, New Jersey and
Connecticut region, most damage and loss caused by an earthquake is directly or indirectly the result of ground
shaking (NYCEM, 2003). NYCEM indicates there is a strong correlation between PGA and the damage a
building might experience. The HAZUS-MH model is based on the best available earthquake science and aligns
with these statements. HAZUS-MH 3.0 methodology and model were used to analyze the earthquake hazard
for the general building stock for Mercer County. See Figure 5.4.3-3 through Figure 5.4.3-5 earlier in this profile
that illustrates the geographic distribution of PGA (g) across the county for 100-, 500- and 2,500-year MRP
events at the Census-tract level.
In addition, according to NYCEM, a building’s construction determines how well it can withstand the force of
an earthquake. The NYCEM report indicates that un-reinforced masonry buildings are most at risk during an
earthquake because the walls are prone to collapse outward, whereas steel and wood buildings absorb more of
the earthquake’s energy. Additional attributes that contribute to a building’s capability to withstand an
earthquake’s force include its age, number of stories and quality of construction. HAZUS-MH considers
building construction and the age of buildings as part of the analysis.
Potential building damage was evaluated by HAZUS-MH 3.0 across the following damage categories (none,
slight, moderate, extensive and complete). Table 5.4.3-11 provides definitions of these five categories of damage
for a light wood-framed building; definitions for other building types are included in HAZUS-MH technical
manual documentation. General building stock damage for these damage categories by occupancy class and
building type on a County-wide basis is summarized below for the 100-, 500- and 2,500-year events.

SECTION 5.4.3 – EARTHQUAKE
DMA 2000 Hazard Mitigation Plan Update – Mercer County, New Jersey 5.4.3-20June 2016
Table 5.4.3-11. Example of Structural Damage State Definitions for a Light Wood-Framed Building
DamageCategory Description
SlightSmall plaster or gypsum-board cracks at corners of door and window openings and wall-ceiling intersections;small cracks in masonry chimneys and masonry veneer.
ModerateLarge plaster or gypsum-board cracks at corners of door and window openings; small diagonal cracks acrossshear wall panels exhibited by small cracks in stucco and gypsum wall panels; large cracks in brick chimneys;toppling of tall masonry chimneys.
ExtensiveLarge diagonal cracks across shear wall panels or large cracks at plywood joints; permanent lateral movementof floors and roof; toppling of most brick chimneys; cracks in foundations; splitting of wood sill plates and/orslippage of structure over foundations; partial collapse of room-over-garage or other soft-story configurations.
CompleteStructure may have large permanent lateral displacement, may collapse, or be in imminent danger of collapsedue to cripple wall failure or the failure of the lateral load resisting system; some structures may slip and falloff the foundations; large foundation cracks.
Source: HAZUS-MH Technical Manual
Tables 5.4.3-12 through 5.4.3-13 summarize the damage estimated for the 100-, 500- and 2,500-year MRP
earthquake events. Damage loss estimates include structural and non-structural damage to the building and loss
of contents.
Table 5.4.3-12. Estimated Buildings Damaged by General Occupancy for 500-year and 2,500-year
MRP Earthquake Events
Category
Average Damage State
500-Year MRP 2,500-Year MRP
None Slight Moderate Extensive Complete None Slight Moderate Extensive Complete
Residential104,112(90.8%)
1,066239
(<1%)27
(<1%)3
(<1%)94,222
(82.2%)8,753
(7.6%)2,104
(1.8%)325
(<1%)43
(<1%)
Commercial5,853
(5.1%)128
(<1%)37
(<1%)4
(<1%)0
(0.0%)5,095(4.4%)
595(<1%)
279(<1%)
49(<1%)
5(<1%)
Industrial249
(<1%)6
(<1%)2
(<1%)0
(0.0%)0
(0.0%)214
(<1%)26
(<1%)14
(<1%)3
(<1%)0
(0.0%)
Education,Government,Religious andAgricultural
2,858(2.5%)
61(<1%)
19(<1%)
2(<1%)
0(0.0%)
2,484(2.2%)
289(<1%)
139(<1%)
25(<1%)
3(<1%)
Source: HAZUS-MH 3.0

SECTION 5.4.3 – EARTHQUAKE
DMA 2000 Hazard Mitigation Plan Update – Mercer County, New Jersey 5.4.3-21June 2016
Table 5.4.3-13. Estimated Buildings Damaged by General Occupancy for the 500- and 2,500-Year MRP Earthquake Events
MunicipalityTotal Replacement Cost
Value
Estimated Total Damages*Percent of Total Building
and Contents *
Annualized Loss 500-Year 2,500-Year Annualized Loss 500-Year 2,500-Year
East Windsor Township $7,746,784,091 $56,762 $3,392,744 $60,170,538 <1% <1% <1%
Ewing Township $17,879,816,009 $121,088 $7,489,770 $125,594,028 <1% <1% <1%
Hamilton Township $24,077,604,811 $160,214 $9,767,844 $169,022,886 <1% <1% <1%
Hightstown Borough $1,711,313,462 $13,289 $800,631 $14,068,310 <1% <1% <1%
Hopewell Borough $640,923,271 $4,324 $262,940 $4,609,018 <1% <1% <1%
Hopewell Township $9,846,579,837 $63,414 $3,868,237 $67,465,264 <1% <1% <1%
Lawrence Township $15,770,815,489 $108,145 $6,641,555 $113,867,741 <1% <1% <1%
Pennington Borough $1,149,994,332 $7,189 $441,970 $7,679,417 <1% <1% <1%
Princeton $10,614,447,542 $78,989 $4,886,390 $82,336,428 <1% <1% <1%
Robbinsville Township $7,322,503,629 $47,782 $2,829,651 $51,979,041 <1% <1% <1%
Trenton City $20,211,655,411 $129,446 $8,021,417 $135,864,393 <1% <1% <1%
West Windsor Township $13,285,838,892 $97,587 $5,940,020 $102,787,662 <1% <1% <1%
Mercer County Total $130,258,276,775 $888,229 $54,343,169 $935,444,726 <1% <1% <1%
Source: HAZUS-MH 3.0*Total Damages is the sum of damages for all occupancy classes (residential, commercial, industrial, agricultural, educational, religious, and government).

SECTION 5.4.3 – EARTHQUAKE
DMA 2000 Hazard Mitigation Plan Update – Mercer County, New Jersey 5.4.3-22June 2016
Table 5.4.3-13. Estimated Buildings Damaged by General Occupancy for the 500- and 2,500-Year MRP Earthquake Events
(Continued)
MunicipalityTotal Replacement Cost
Value
Estimated ResidentialDamage
Estimated CommercialDamage
500-Year 2,500-Year 500-Year 2,500-Year
East Windsor Township $7,746,784,091 $2,030,516 $37,952,090 $740,622 $11,762,484
Ewing Township $17,879,816,009 $3,384,133 $59,953,714 $1,604,018 $25,139,647
Hamilton Township $24,077,604,811 $5,658,334 $101,848,008 $2,626,229 $41,797,231
Hightstown Borough $1,711,313,462 $427,081 $8,037,184 $194,166 $3,140,045
Hopewell Borough $640,923,271 $192,283 $3,489,375 $59,998 $942,778
Hopewell Township $9,846,579,837 $2,849,757 $51,000,919 $636,545 $10,303,997
Lawrence Township $15,770,815,489 $4,046,007 $72,722,009 $1,602,594 $25,438,575
Pennington Borough $1,149,994,332 $354,607 $6,306,350 $81,785 $1,282,147
Princeton $10,614,447,542 $2,493,478 $45,294,516 $711,934 $11,285,508
Robbinsville Township $7,322,503,629 $2,588,965 $48,075,695 $186,084 $2,966,026
Trenton City $20,211,655,411 $4,284,272 $76,147,074 $3,208,866 $50,726,166
West Windsor Township $13,285,838,892 $3,307,634 $60,422,463 $2,071,155 $33,555,076
Mercer County Total $130,258,276,775 $31,617,066 $571,249,395 $13,723,994 $218,339,677
Source: HAZUS-MH 3.0

SECTION 5.4.3 – EARTHQUAKE
DMA 2000 Hazard Mitigation Plan Update – Mercer County, New Jersey 5.4.3-23June 2016
HAZUS-MH estimates no damages for the 100-year earthquake event. It is also estimated that there may be $54
million in damages to buildings in the county as a result of a 500-year earthquake event. These includes
structural damage, non-structural damage and loss of contents, representing less than 1% of the total improved
value for general building stock in Mercer County. For a 2,500-year MRP earthquake event, HAZUS-MH
estimates greater than $935 million (<1%) of the total general building stock improved value. Residential and
commercial buildings account for most of the damage for earthquake events.
Earthquakes can cause secondary hazard events such as fires. Zero fires are anticipated as a result of the 100-,
500- and 2,500-year MRP events.
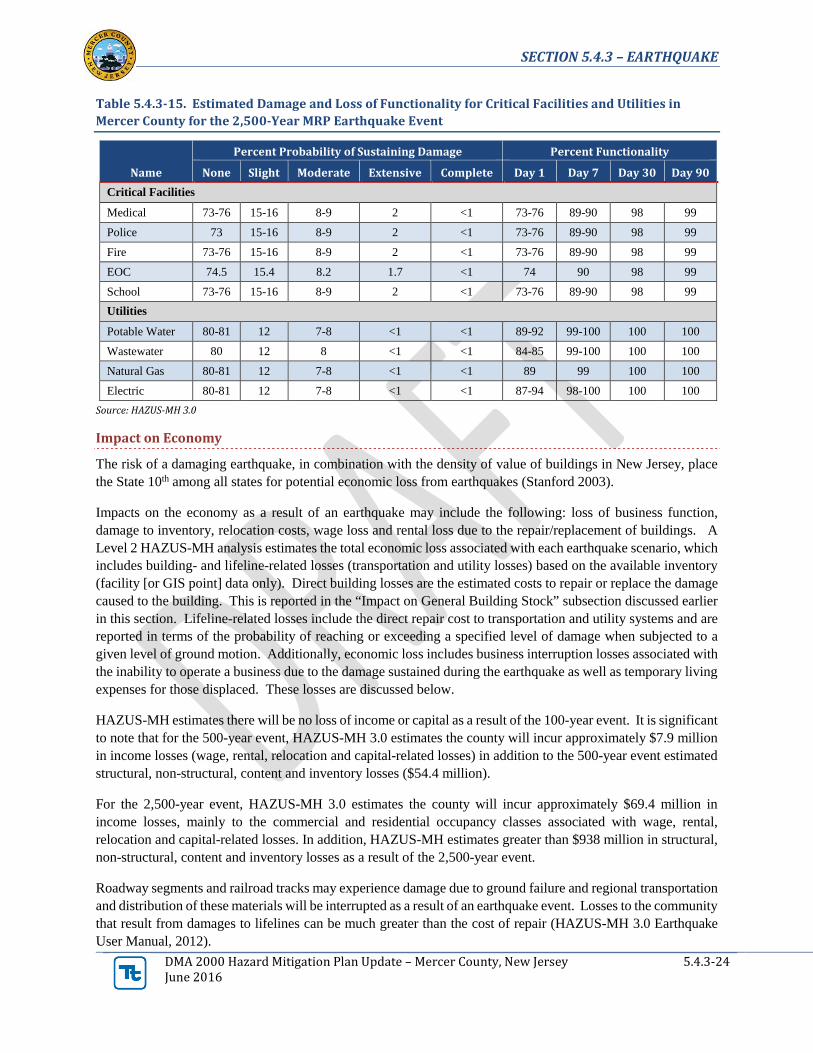
Impact on Critical Facilities
After considering the general building stock exposed to, and damaged by, 100-, 500- and 2,500-year MRP
earthquake events, critical facilities were evaluated. All critical facilities (essential facilities, transportation
systems, lifeline utility systems, high-potential loss facilities and user-defined facilities) in Mercer County are
considered exposed and potentially vulnerable to the earthquake hazard. Refer to subsection “Critical Facilities”
in Section 4 (County Profile) of this HMP update for a description of the critical facilities in the county.
HAZUS-MH 3.0 estimates the probability that critical facilities may sustain damage as a result of 100-, 500- and
2,500-year MRP earthquake events. Additionally, HAZUS-MH estimates percent functionality for each facility
days after the event. As a result of a 100-Year MRP event, HAZUS-MH 3.0 estimates that emergency facilities
(police, fire, EMS and medical facilities), schools, utilities and specific facilities identified by Mercer County as
critical will be nearly 100% functional. Therefore, the impact to critical facilities is not significant for the 100-
year event.
Table 5.4.3-14 and Table 5.4.3-15 lists the percent probability of critical facilities sustaining the damage category
as defined by the column heading and percent functionality after the event for the 500-year and 2,500-year MRP
earthquake events.
Table 5.4.3-14. Estimated Damage and Loss of Functionality for Critical Facilities and Utilities in
Mercer County for the 500-Year MRP Earthquake Event
Name
Percent Probability of Sustaining Damage Percent Functionality
None Slight Moderate Extensive Complete Day 1 Day 7 Day 30 Day 90
Critical Facilities
Medical 95-96 3 1 <1 0 95-96 99 100 100
Police 95 3 1 <1 0 95-96 99 100 100
Fire 95-96 3 1 <1 0 95-96 99 100 100
EOC 95.6 3.2 1 <1 0 96 99 100 100
School 95-96 3 1 <1 0 95-96 99 100 100
Utilities
Potable Water 98-99 1 <1 0 0 99-100 100 100 100
Wastewater 98-99 1 <1 0 0 99 100 100 100
Natural Gas 98-99 1 <1 0 0 99 100 100 100
Electric 99 1 <1 0 0 99-100 100 100 100
Source: HAZUS-MH 3.0
SECTION 5.4.3 – EARTHQUAKE
DMA 2000 Hazard Mitigation Plan Update – Mercer County, New Jersey 5.4.3-24June 2016
Table 5.4.3-15. Estimated Damage and Loss of Functionality for Critical Facilities and Utilities in
Mercer County for the 2,500-Year MRP Earthquake Event
Name
Percent Probability of Sustaining Damage Percent Functionality
None Slight Moderate Extensive Complete Day 1 Day 7 Day 30 Day 90
Critical Facilities
Medical 73-76 15-16 8-9 2 <1 73-76 89-90 98 99
Police 73 15-16 8-9 2 <1 73-76 89-90 98 99
Fire 73-76 15-16 8-9 2 <1 73-76 89-90 98 99
EOC 74.5 15.4 8.2 1.7 <1 74 90 98 99
School 73-76 15-16 8-9 2 <1 73-76 89-90 98 99
Utilities
Potable Water 80-81 12 7-8 <1 <1 89-92 99-100 100 100
Wastewater 80 12 8 <1 <1 84-85 99-100 100 100
Natural Gas 80-81 12 7-8 <1 <1 89 99 100 100
Electric 80-81 12 7-8 <1 <1 87-94 98-100 100 100
Source: HAZUS-MH 3.0
Impact on Economy
The risk of a damaging earthquake, in combination with the density of value of buildings in New Jersey, place
the State 10th among all states for potential economic loss from earthquakes (Stanford 2003).
Impacts on the economy as a result of an earthquake may include the following: loss of business function,
damage to inventory, relocation costs, wage loss and rental loss due to the repair/replacement of buildings. A
Level 2 HAZUS-MH analysis estimates the total economic loss associated with each earthquake scenario, which
includes building- and lifeline-related losses (transportation and utility losses) based on the available inventory
(facility [or GIS point] data only). Direct building losses are the estimated costs to repair or replace the damage
caused to the building. This is reported in the “Impact on General Building Stock” subsection discussed earlier
in this section. Lifeline-related losses include the direct repair cost to transportation and utility systems and are
reported in terms of the probability of reaching or exceeding a specified level of damage when subjected to a
given level of ground motion. Additionally, economic loss includes business interruption losses associated with
the inability to operate a business due to the damage sustained during the earthquake as well as temporary living
expenses for those displaced. These losses are discussed below.
HAZUS-MH estimates there will be no loss of income or capital as a result of the 100-year event. It is significant
to note that for the 500-year event, HAZUS-MH 3.0 estimates the county will incur approximately $7.9 million
in income losses (wage, rental, relocation and capital-related losses) in addition to the 500-year event estimated
structural, non-structural, content and inventory losses ($54.4 million).
For the 2,500-year event, HAZUS-MH 3.0 estimates the county will incur approximately $69.4 million in
income losses, mainly to the commercial and residential occupancy classes associated with wage, rental,
relocation and capital-related losses. In addition, HAZUS-MH estimates greater than $938 million in structural,
non-structural, content and inventory losses as a result of the 2,500-year event.
Roadway segments and railroad tracks may experience damage due to ground failure and regional transportation
and distribution of these materials will be interrupted as a result of an earthquake event. Losses to the community
that result from damages to lifelines can be much greater than the cost of repair (HAZUS-MH 3.0 Earthquake
User Manual, 2012).

SECTION 5.4.3 – EARTHQUAKE
DMA 2000 Hazard Mitigation Plan Update – Mercer County, New Jersey 5.4.3-25June 2016
Earthquake events can significantly impact road bridges. These are important because they often provide the
only access to certain neighborhoods. Since softer soils can generally follow floodplain boundaries, bridges that
cross watercourses should be considered vulnerable. A key factor in the degree of vulnerability will be the age
of the facility or infrastructure, which will help indicate to which standards the facility was built. HAZUS-MH
estimates the long-term economic impacts to the county for 15-years after the 2,500-year earthquake event. In
terms of the transportation infrastructure, HAZUS-MH estimates $10 million in direct repair costs to bridges,
highway, railways, bus, and airport facilities. There are no losses computed by HAZUS-MH for business
interruption due to transportation or utility lifeline losses.
HAZUS-MH 3.0 also estimates the volume of debris that may be generated as a result of an earthquake event to
enable the study region to prepare and rapidly and efficiently manage debris removal and disposal. Debris
estimates are divided into two categories: (1) reinforced concrete and steel that require special equipment to
break it up before it can be transported, and (2) brick, wood and other debris that can be loaded directly onto
trucks with bulldozers (HAZUS-MH Earthquake User’s Manual).
For the 100-year MRP event, HAZUS-MH 3.0 estimates 0 tons of debris will be generated. For the 500-year
MRP event, HAZUS-MH 3.0 estimates more than 18,000 tons of debris will be generated. For the 2,500-year
MRP event, HAZUS-MH 3.0 estimates greater than 135,000 tons of debris will be generated. Table 5.4.3-16
summarizes the estimated debris generated as a result of these events by municipality.
Table 5.4.3-16. Estimated Debris Generated by the 500- and 2,500-year MRP
Earthquake Events
Municipality
500-Year 2,500-Year
Brick/
Wood
(tons)
Concrete/
Steel
(tons)
Brick/
Wood
(tons)
Concrete/
Steel
(tons)
East Windsor Township 909 292 $6,208 $3,140
Ewing Township 1,824 606 $12,140 $6,394
Hamilton Township 3,064 915 $20,500 $9,571
Hightstown Borough 215 59 $1,459 $650
Hopewell Borough 67 15 $447 $156
Hopewell Township 1,084 260 $7,185 $2,713
Lawrence Township 1,828 517 $12,195 $5,486
Pennington Borough 110 23 $729 $240
Princeton 1,102 309 $7,366 $3,304
Robbinsville Township 697 143 $4,730 $1,528
Trenton City 1,712 463 $11,344 $4,818
West Windsor Township 1,416 386 $9,505 $4,132
Mercer County Total 14,029 3,987 $93,808 $42,133
Source: HAZUS-MH 3.0
Future Growth and Development
As discussed in Section 4, areas targeted for future growth and development have been identified across the
county. It is anticipated that the human exposure and vulnerability to earthquake impacts in newly developed
areas will be similar to those that currently exist within the county. Current building codes require seismic
provisions that should render new construction less vulnerable to seismic impacts than older, existing
construction that may have been built to lower construction standards.

SECTION 5.4.3 – EARTHQUAKE
DMA 2000 Hazard Mitigation Plan Update – Mercer County, New Jersey 5.4.3-26June 2016
Change of Vulnerability
Mercer County continues to be vulnerable to the earthquake hazard. However, there are differences between the
potential loss estimates between this plan update to the results in the 2011 HMP. For the 2016 HMP update,
probabilistic scenarios were evaluated using a Level 2 HAZUS-MH analysis. In addition, a more current and
accurate building stock inventory was used for this HMP update.
Effect of Climate Change on Vulnerability
Providing projections of future climate change for a specific region is challenging. Some scientists feel that
melting glaciers could induce tectonic activity. As ice melts and water runs off, tremendous amounts of weight
are shifted on the Earth’s crust. As newly freed crust returns to its original, pre-glacier shape, it could cause
seismic plates to slip and stimulate volcanic activity according to research into prehistoric earthquakes and
volcanic activity. National Aeronautics and Space Administration (NASA) and USGS scientists found that
retreating glaciers in southern Alaska might be opening the way for future earthquakes.
Secondary impacts of earthquakes could be magnified by future climate change. Soils saturated by repetitive
storms could experience liquefaction during seismic activity because of the increased saturation. Dams storing
increased volumes of water from changes in the hydrograph could fail during seismic events. There are currently
no models available to estimate these impacts.
Additional Data and Next Steps
A Level 2 HAZUS-MH earthquake analysis was conducted for Mercer County using the default model data,
with the exception of the updated building and critical facility inventories. Additional data needed to further
refine and enhance the county’s vulnerability assessment include NEHRP soils, liquefaction and landslide-
susceptible areas to be integrated into the HAZUS-MH model.