Embed Size (px)
Citation preview

1
Section 2.1 The Basics of Probability Theory
Get Started – How do you simplify fractions?
Key Terms:
Fractions Numerator Denominator
Summary:
In probability calculations you must understand what the parts of a fraction contain as well as
how you can reduce a fraction to lowest terms. A fraction is one number divided by another
used to represent a part of a whole. One good visual representation of a fraction is a pizza.
The numerator or top of a fraction represents the parts – as in the above examples, the numerator
is the number of pieces of pizza. The denominator is the bottom of the fraction and represents
how many ways we have divided the whole. For the fraction ½ one is the numerator or number
of pieces and two, the denominator, is the number of ways we divided that pizza.
Simplifying fractions is to divide both the top and bottom of the fraction by a common number in
order to reduce it to lowest terms.
Get Started – How do you simplify fractions?
• How do you calculate probability by counting outcomes in a sample space? • What does it mean to count elements in a set systematically? • How do you use systematic listing to compute probabilities? • What is the relationship between probability and odds?
2
Guided Example 1 Practice Simplify each fraction:
a. 1830
Solution To reduce this fraction, we divide both top and bottom by the greatest common factor, 6.
18 18 630 30 6
35
÷=
÷
=
b. 918
Solution To reduce this fraction, we divide both top and bottom by the greatest common factor, 9.
9 9 918 18 9
12
÷=
÷
=
c. 3648
Solution To reduce this fraction, we divide both top and bottom by the greatest common factor, 12.
36 36 1248 48 12
34
÷=
÷
=
Simplify each fraction:
a. 1852
b. 210
c. 30100
3
How do you calculate probability by counting outcomes in a sample space?
Key Terms:
Theoretical Probability Experimental Probability
Random Experiment Trial
Sample Space Event
Equally likely
Summary
In this section we will discuss the difference between experimental and theoretical probability. Suppose we toss a tack of experimental probability where the class tosses a tack 10 times, then 10 more times, then 150 times and records the number of times the tack lands point up. This is an example of experimental probability. Theoretical probability is what we expect to happen, where experimental probability is what actually happens when we try it out. The probability is still calculated the same way, using the number of possible ways an outcome can occur divided by the total number of outcomes. As more trials (the number of times an experiment is performed) are conducted, the experimental probability generally gets closer to the theoretical probability. When two events have the same probability, they are equally likely. Here are more vocabulary that will help you understand this section: A random experiment is an activity or an observation whose outcome cannot be predicted ahead of time. A trial is one repetition of a random experiment. The sample space is the set of all possible outcomes for a random experiment. An event is a subset of the sample space.
Notes
4
Guided Example 2 Practice
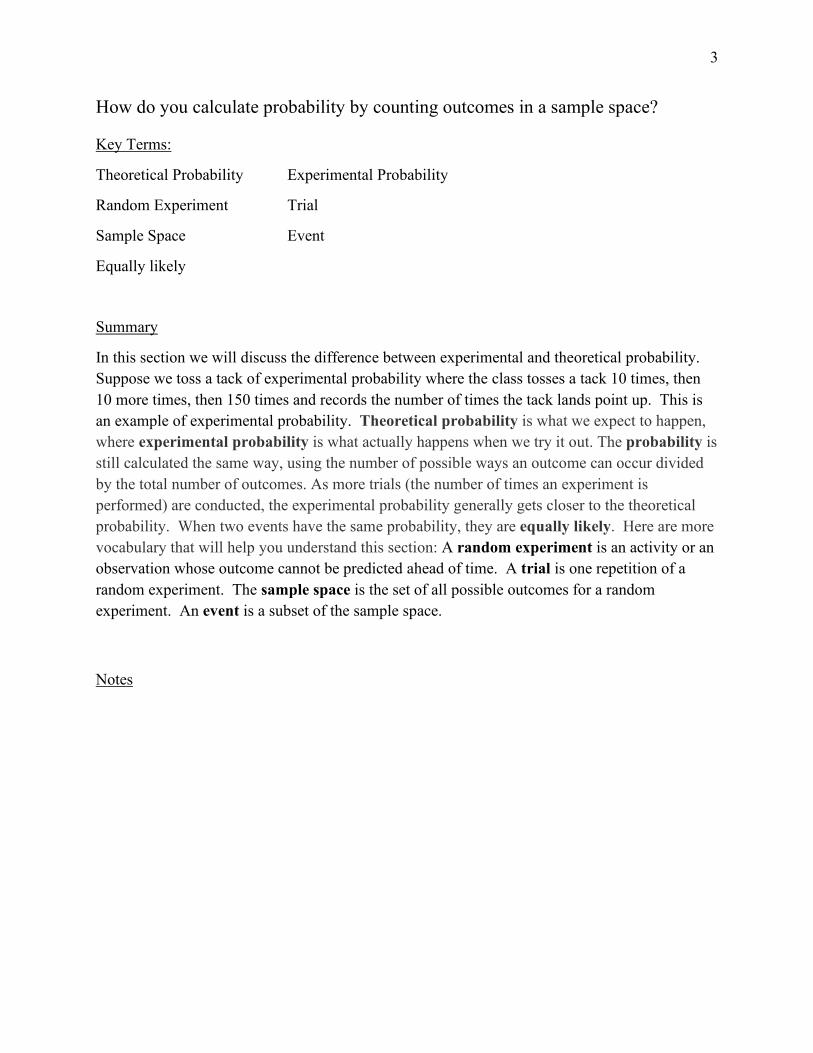
Your instructor takes out a coin and flips it 50 times. She gets 26 heads and 24 tails. a. Find the sample space of this experiment. Solution The sample space is a set consisting of all possible outcomes of the experiment where the coin is flipped. When the coin is flipped, the outcome is either heads or tail. Therefore, we could write the sample space as {heads, tails}S = You might also write the sample space as {H,T}S = where H represents heads and T represents tails. Abbreviations like this are often used to simplify the problem. However, make sure you define your abbreviations if they are not obvious from the context of the problem. b. Find the theoretical probability of getting
heads. Solution For theoretical probability, we will assume that getting heads and getting tails are equally likely. To find the probability of heads, we simply count the number of outcomes in the sample space corresponding to the event and divide by the number of outcomes in the sample space,
( ) 1( )( ) 2
n HP Hn S
= =
The probability of getting heads is 1
2 . As a decimal we could write this as 0.5. As a percent we would write 50%.
A company conducts an experiment in which they ask 200 consumers their preference in soft drinks. Sixty of the consumers prefer Coke, 65 prefer Pepsi, and the rest prefer some other soft drink. a. Find the sample space of this experiment. b. Find the theoretical probability that a
consumer prefers Coke.
5
c. Find the experimental probability of getting heads.
Solution When an experiment is conducted to determine probability, we can still utilize
( )( )( )
n HP Hn S
=
However, in this context n(H) refers to the number of times we obtained heads in the experiment and n(S) is the number of times the experiment was conducted. Using the numbers from the experiment,
26( )50
P H =
This may be reduced to 13
25 . This is equivalent to the decimal 0.52 and the percent 52%.
c. Find the experimental probability that a consumer prefers Coke.
Guided Example 3 Practice
In 2015, the IRS audited 1,228,117 individual tax returns. They did not audit another 145,633,100 individual tax returns. If an individual tax return is randomly selected, what is the probability that the return was audited? Solution Let’s think about this problem as an experiment. In this experiment, the IRS will select an individual tax return. The outcomes for this experiment are “audited” or “not audited”. Therefore, the sample space is { }audited, not auditedS = From the data given in the problem statement, these outcomes are not equally likely since more tax returns were not audited than audited.
In a recent poll, 235 representatives in Congress indicated that they support reversing net neutrality regulations. The same poll indicated that 200 representatives opposed reversing net neutrality regulations. If a representative is chosen at random from this group, what is the probability that they will support reversing net neutrality regulations?
6
The number of times the experiment was performed is 1,228,117 + 145,633,100 or 146,686,217. The probability of being audited is
1, 228,117(audited) 0.0084146,686,217
P = ≈
or approximately 0.84%.
What does it mean to counts elements in a set systematically?
Key Terms Repetition Summary One of the ways we can count arrangements of objects is to simply try to list all of the possibilities in a systematic way. For instance, suppose we have a group of fruit: apple, banana, cherry, and dates. You are asked to list your favorite two fruit in order. How many ways is there to choose two fruit where the order makes a difference. Use the first letter of the fruit’s name to indicate the fruit. So, one possible selection might be ab meaning your favorite choice is apple and the second favorite is banana. This would be counted differently from ba which means the favorite is banana and the second favorite is apple. Following this pattern, the possibilities are
ab, ac, ad, ba, bc, bd, ca, cb, cd, da, db, dc
The total number of ways to rank the favorite two fruits is 12 ways. Notice that aa is not allowed in this context. We would say that repetition is not allowed when this happens. As another example, suppose we are flipping a penny and a nickel. How many combinations of flips are there? If we use H for heads and T for tails, then writing HT indicates H on the penny and T on the nickel. Writing TH would indicate tails on the penny and heads on the nickel. Listing out the possible combinations gives
HT, TH, TT, HH
for a total of 4 ways. Notes
7
Guided Example 4 Practice
Suppose you are given the set
S = {A, B, C} List all the ways you may select two members from S where repetition is not allowed, and order is important. For example, AA is not allowed, and BA a different selection from AB. Solution We may not repeat letters and the order of the letters makes a difference.
AB, BA, BC, CB, AC, CA
Suppose you are given the set
S = {A, B, C, D} List all the ways you may select three members from S where repetition is not allowed, and order is important. For example, AAA and BBA are not allowed, and CBA a different selection from ABC.
Guided Example 5 Practice
Assume you are rolling two dice; the first one is red, and the second one is green. Use a systematic listing to determine the number of ways you can roll a total of 8 on the two dice. Solution Each die has one through six dots on the six different faces. If the first die showed one dot, nothing we could get on the second die could add to a total of eight dots. However, if the red die showed two dots and the green die showed six dots, the total would be eight dots. We indicate this possibility by writing the ordered pair (2, 6). Similarly, (6, 2) would also add to eight and indicate six dots on the red die and two dots on the green die. By examining different possibilities, we can write out all of the possibilities that add to eight:
(2, 6), (6, 2), (3, 5), (5, 3), (4, 4)
Assume you are rolling two dice; the first one is red, and the second one is green. Use a systematic listing to determine the number of ways you can roll a total of 7 on the two dice.
8
How do you use systematic listing to compute probabilities?
Key Terms
Probability of outcome A, P(A) Systematic listing
Summary
With theoretical probability, you can find the chance that an outcome occurs by taking the number of ways for that event to occur and divide it by the total number of outcomes in the sample space.
Notes
Guided Example 6 Practice
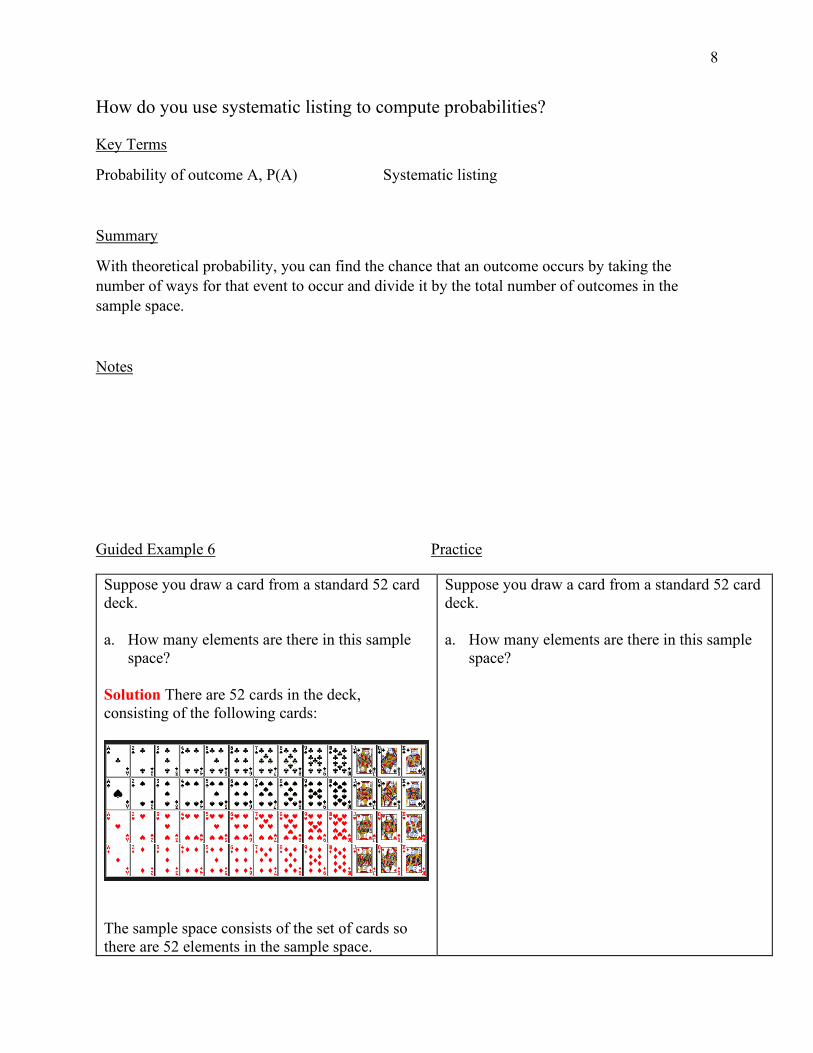
Suppose you draw a card from a standard 52 card deck. a. How many elements are there in this sample
space? Solution There are 52 cards in the deck, consisting of the following cards:
The sample space consists of the set of cards so there are 52 elements in the sample space.
Suppose you draw a card from a standard 52 card deck. a. How many elements are there in this sample
space?
9
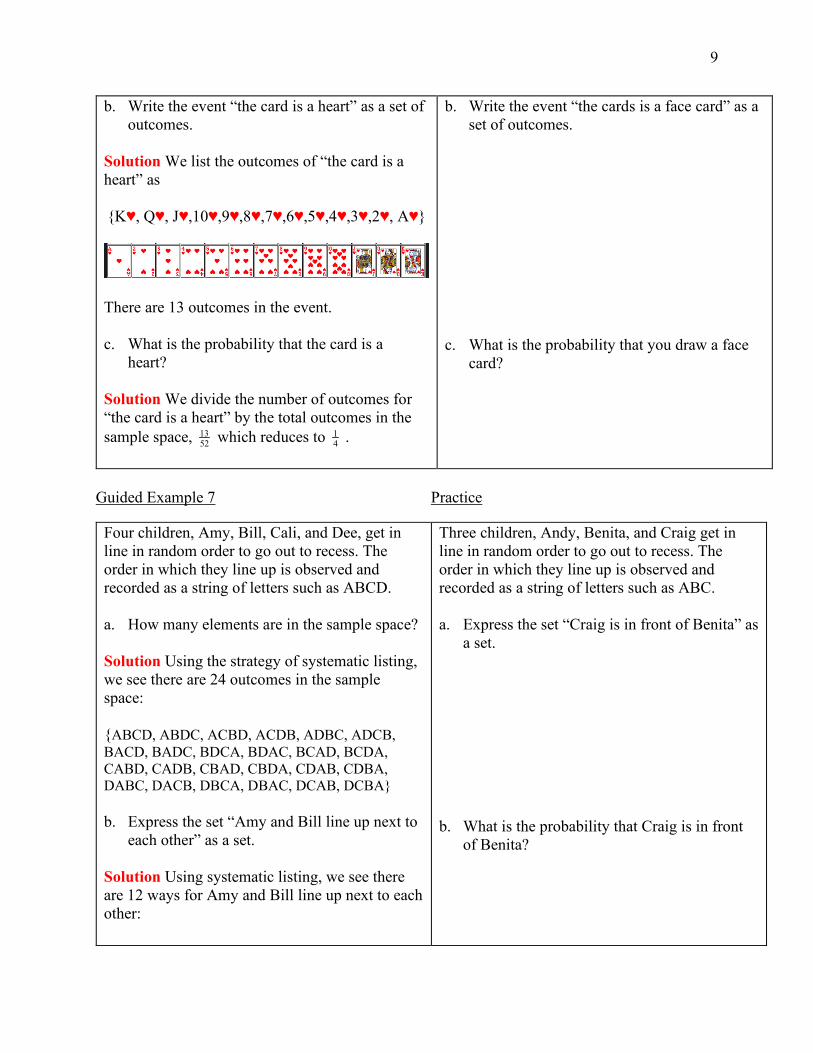
b. Write the event “the card is a heart” as a set of outcomes.
Solution We list the outcomes of “the card is a heart” as {K♥, Q♥, J♥,10♥,9♥,8♥,7♥,6♥,5♥,4♥,3♥,2♥, A♥}
There are 13 outcomes in the event. c. What is the probability that the card is a
heart? Solution We divide the number of outcomes for “the card is a heart” by the total outcomes in the sample space, 13
52 which reduces to 14 .
b. Write the event “the cards is a face card” as a set of outcomes.
c. What is the probability that you draw a face
card?
Guided Example 7 Practice
Four children, Amy, Bill, Cali, and Dee, get in line in random order to go out to recess. The order in which they line up is observed and recorded as a string of letters such as ABCD. a. How many elements are in the sample space? Solution Using the strategy of systematic listing, we see there are 24 outcomes in the sample space: {ABCD, ABDC, ACBD, ACDB, ADBC, ADCB, BACD, BADC, BDCA, BDAC, BCAD, BCDA, CABD, CADB, CBAD, CBDA, CDAB, CDBA, DABC, DACB, DBCA, DBAC, DCAB, DCBA} b. Express the set “Amy and Bill line up next to
each other” as a set. Solution Using systematic listing, we see there are 12 ways for Amy and Bill line up next to each other:
Three children, Andy, Benita, and Craig get in line in random order to go out to recess. The order in which they line up is observed and recorded as a string of letters such as ABC. a. Express the set “Craig is in front of Benita” as
a set. b. What is the probability that Craig is in front
of Benita?

10
{ABCD, ABDC, BACD, BADC, CABD, CBAD, CDAB, CDBA, DABC, DBAC, DCAB, DCBA} c. What is the probability that Amy and Bill will
line up next to each other? Solution We divide the number of outcomes for “Amy and Bill will line up next to each other by the total outcomes in the sample space: 12
24 which reduces to 1
2 .
c. What is the probability that Andy and Benita will line up next to each other?
Guided Example 8 Practice
Suppose a carrier of sickle-cell anemia and a person without the sickle-cell gene have a child. a. Write the Punnett square for this situation.
Solution The Punnett square is a square diagram that is used to predict the genotypes of a particular cross or breeding experiment. In a 2 by 2 Punnett square, each parent has two genotypes. Let C be a carrier genotype and N a non-carrier genotype of a disease. A person with the disease must have both carrier genotypes or CC. Carriers of the disease will have one carrier genotype and one noncarrier genotype, CN or NC. People who do not have the disease and are not carriers have two non-carrier genotypes, NN. Create a square that shows the first parent as a carrier CN, and second parent as a non-carrier NN.
Second Parent N N
First C CN CN Parent N NN NN
Suppose a carrier of sickle-cell anemia and a person with sickle-cell anemia have a child. a. Write the Punnett square for this situation.
11
b. What is the probability that the child has sickle-cell anemia?
Solution Because someone with the disease is represented by CC, there is no possible outcomes of “with the disease” so the probability the child has the disease is 0
4 0= . c. What is the probability that the child is a
carrier of sickle-cell anemia? Solution CN denotes carrier, so the probability the child is a carrier is 2
4 which reduces to 12 .
d. What is the probability that the child carries
no sickle-cell genes?
Solution NN denotes no sickle cell genes, so the probability the child carries no sickle cell genes is 24 which reduces to 1
2 .
b. What is the probability that the child has sickle-cell anemia?
c. What is the probability that the child is a carrier
of sickle-cell anemia? d. What is the probability that the child carries no
sickle-cell genes?
What is the relationship between probability and odds?
Key Terms Odds Odds in favor Odds against
Summary Many people mistake odds for probability but they are not the same thing!! Odds compare the success rate to the failure rate instead of success rate to a total. Odds in favor of success compare the probability of success to the probability of failure by comparing the number of successes to the number of failures, Odds in Favor of Success Number of Successes to Number of Failures=
This may be written in words, as a ratio, or as a fraction. For example, odds of 3 to 1 might be written as 3:1 or 3
1 .
Odds against success compare the probability of failure to the probability of a success, Odds against Success Number of Failures to Number of Successes=
12
Like odds in favor, the result may be written in words, as a ratio, of as a fraction. Another way of computing odds is to divide the probabilities,
(success)Odds in Favor of Success =(failure)(failure)Odds against Success =(success)
PPPP
Notes

13
Guided Example 9 Practice
A sales tax increase is being proposed to help pay down debt in the city of Prescott. A survey indicates the residents are split over the sales tax increase.
Support Increase
Oppose Increase
Live in North Prescott 1000 1100
Live in South Prescott 1500 1300
Suppose a person is randomly selected from North Prescott. a. What is the probability that the person
supports the tax increase? Solution There are 2100 total people surveyed from North Prescott and 1000 of those support the increase, so the
1000(N Prescott and supports increase)21001021
P =
=
b. What are the odds in favor of supporting the
tax increase? Solution The odds compare those in favor to those that oppose, so the odds they are from North Prescott and supports increase is 1000
1100 or 1011 .
A sales tax increase is being proposed to help pay down debt in the city of Prescott. A survey indicates the residents are split over the sales tax increase.
Support Increase
Oppose Increase
Live in North Prescott 1000 1100
Live in South Prescott 1500 1300
Suppose a person is randomly selected from South Prescott. a. What is the probability that the person
supports the tax increase? b. What are the odds in favor of supporting the
tax increase?
14
Guided Example 10 Practice
The favorite in a horse race is listed as having odds of 2 to 1. If these odds represent the odds against winning, what is the probability that the horse will win the race? Solution The odds against winning relates the number of failures (losses) to the number of successes (wins). To find the solution we must find the total number of outcomes (which is the denominator of a probability fraction and NOT an odds fraction). By adding the wins and losses, 1 + 2, we get 3 total possible outcomes. The calculation of probability of a win (or success) is to divide the number of wins by total outcomes, so 1 win divided by 3 total outcomes:
1(win)3
P =
To find the probability of losing, take 2 losses
divided by 3 total outcomes to get 2(loss)3
P = .
The longshot in a horse race is listed as having odds of 40 to 1. If these odds represent the odds against winning, what is the probability that the horse will win the race?