Embed Size (px)
Citation preview
1
Section 2.1 The Basics of Probability Theory
Get Started – How do you simplify fractions?
Key Terms:
Fractions Numerator Denominator
Summary:
In probability calculations you must understand what the parts of a fraction contain as well as
how you can reduce a fraction to lowest terms. A fraction is one number divided by another
used to represent a part of a whole. One good visual representation of a fraction is a pizza.
The numerator or top of a fraction represents the parts – as in the above examples, the numerator
is the number of pieces of pizza. The denominator is the bottom of the fraction and represents
how many ways we have divided the whole. For the fraction ½ one is the numerator or number
of pieces and two, the denominator, is the number of ways we divided that pizza.
Simplifying fractions is to divide both the top and bottom of the fraction by a common number in
order to reduce it to lowest terms.
Get Started – How do you simplify fractions?
• How do you calculate probability by counting outcomes in a sample space? • What does it mean to count elements in a set systematically? • How do you use systematic listing to compute probabilities? • What is the relationship between probability and odds?

2
Guided Example 1 Practice Simplify each fraction:
a. 1830
Solution To reduce this fraction, we divide both top and bottom by the greatest common factor, 6.
18 18 630 30 6
35
÷=
÷
=
b. 918
Solution To reduce this fraction, we divide both top and bottom by the greatest common factor, 9.
9 9 918 18 9
12
÷=
÷
=
c. 3648
Solution To reduce this fraction, we divide both top and bottom by the greatest common factor, 12.
36 36 1248 48 12
34
÷=
÷
=
Simplify each fraction:
a. 1852
b. 210
c. 30100

3
How do you calculate probability by counting outcomes in a sample space?
Key Terms:
Theoretical Probability Experimental Probability
Random Experiment Trial
Sample Space Event
Equally likely
Summary
In this section we will discuss the difference between experimental and theoretical probability. Suppose we toss a tack of experimental probability where the class tosses a tack 10 times, then 10 more times, then 150 times and records the number of times the tack lands point up. This is an example of experimental probability. Theoretical probability is what we expect to happen, where experimental probability is what actually happens when we try it out. The probability is still calculated the same way, using the number of possible ways an outcome can occur divided by the total number of outcomes. As more trials (the number of times an experiment is performed) are conducted, the experimental probability generally gets closer to the theoretical probability. When two events have the same probability, they are equally likely. Here are more vocabulary that will help you understand this section: A random experiment is an activity or an observation whose outcome cannot be predicted ahead of time. A trial is one repetition of a random experiment. The sample space is the set of all possible outcomes for a random experiment. An event is a subset of the sample space.
Notes

4
Guided Example 2 Practice
Your instructor takes out a coin and flips it 50 times. She gets 26 heads and 24 tails. a. Find the sample space of this experiment. Solution The sample space is a set consisting of all possible outcomes of the experiment where the coin is flipped. When the coin is flipped, the outcome is either heads or tail. Therefore, we could write the sample space as {heads, tails}S = You might also write the sample space as {H,T}S = where H represents heads and T represents tails. Abbreviations like this are often used to simplify the problem. However, make sure you define your abbreviations if they are not obvious from the context of the problem. b. Find the theoretical probability of getting
heads. Solution For theoretical probability, we will assume that getting heads and getting tails are equally likely. To find the probability of heads, we simply count the number of outcomes in the sample space corresponding to the event and divide by the number of outcomes in the sample space,
( ) 1( )( ) 2
n HP Hn S
= =
The probability of getting heads is 1
2 . As a decimal we could write this as 0.5. As a percent we would write 50%.
A company conducts an experiment in which they ask 200 consumers their preference in soft drinks. Sixty of the consumers prefer Coke, 65 prefer Pepsi, and the rest prefer some other soft drink. a. Find the sample space of this experiment. b. Find the theoretical probability that a
consumer prefers Coke.
5
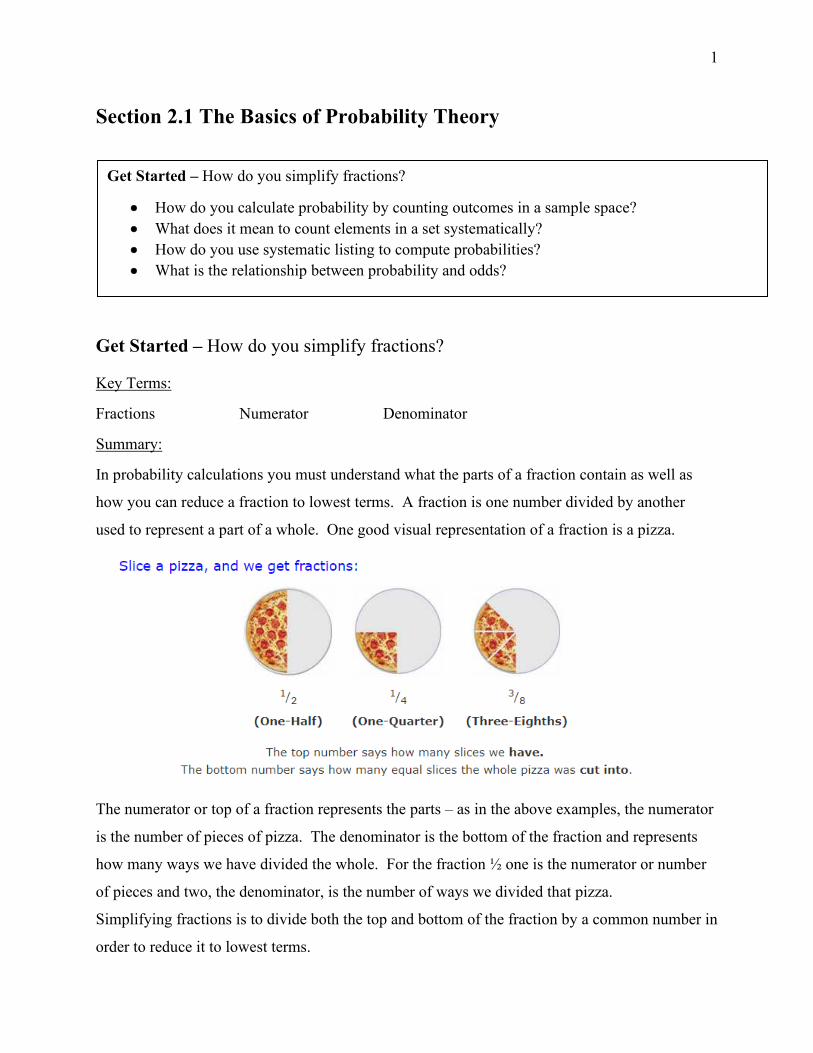
c. Find the experimental probability of getting heads.
Solution When an experiment is conducted to determine probability, we can still utilize
( )( )( )
n HP Hn S
=
However, in this context n(H) refers to the number of times we obtained heads in the experiment and n(S) is the number of times the experiment was conducted. Using the numbers from the experiment,
26( )50
P H =
This may be reduced to 13
25 . This is equivalent to the decimal 0.52 and the percent 52%.
c. Find the experimental probability that a consumer prefers Coke.
Guided Example 3 Practice
In 2015, the IRS audited 1,228,117 individual tax returns. They did not audit another 145,633,100 individual tax returns. If an individual tax return is randomly selected, what is the probability that the return was audited? Solution Let’s think about this problem as an experiment. In this experiment, the IRS will select an individual tax return. The outcomes for this experiment are “audited” or “not audited”. Therefore, the sample space is { }audited, not auditedS = From the data given in the problem statement, these outcomes are not equally likely since more tax returns were not audited than audited.
In a recent poll, 235 representatives in Congress indicated that they support reversing net neutrality regulations. The same poll indicated that 200 representatives opposed reversing net neutrality regulations. If a representative is chosen at random from this group, what is the probability that they will support reversing net neutrality regulations?

6
The number of times the experiment was performed is 1,228,117 + 145,633,100 or 146,686,217. The probability of being audited is
1, 228,117(audited) 0.0084146,686,217
P = ≈
or approximately 0.84%.
What does it mean to counts elements in a set systematically?
Key Terms Repetition Summary One of the ways we can count arrangements of objects is to simply try to list all of the possibilities in a systematic way. For instance, suppose we have a group of fruit: apple, banana, cherry, and dates. You are asked to list your favorite two fruit in order. How many ways is there to choose two fruit where the order makes a difference. Use the first letter of the fruit’s name to indicate the fruit. So, one possible selection might be ab meaning your favorite choice is apple and the second favorite is banana. This would be counted differently from ba which means the favorite is banana and the second favorite is apple. Following this pattern, the possibilities are
ab, ac, ad, ba, bc, bd, ca, cb, cd, da, db, dc
The total number of ways to rank the favorite two fruits is 12 ways. Notice that aa is not allowed in this context. We would say that repetition is not allowed when this happens. As another example, suppose we are flipping a penny and a nickel. How many combinations of flips are there? If we use H for heads and T for tails, then writing HT indicates H on the penny and T on the nickel. Writing TH would indicate tails on the penny and heads on the nickel. Listing out the possible combinations gives
HT, TH, TT, HH
for a total of 4 ways. Notes
7
Guided Example 4 Practice
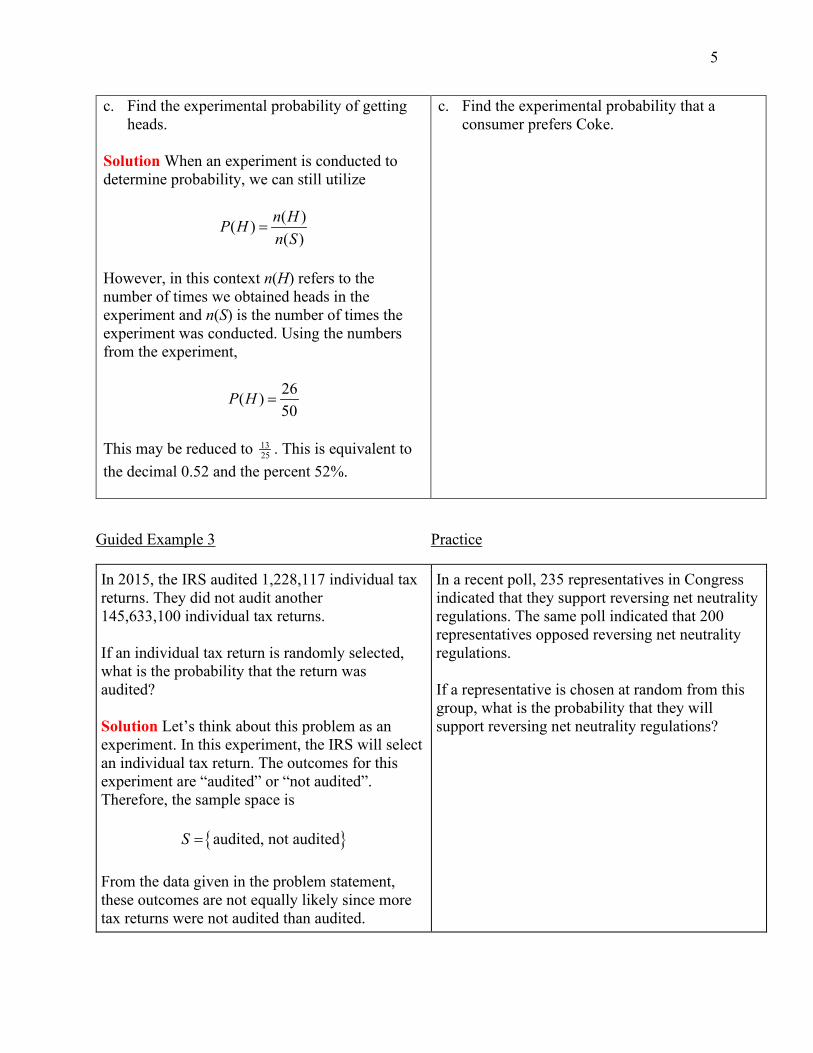
Suppose you are given the set
S = {A, B, C} List all the ways you may select two members from S where repetition is not allowed, and order is important. For example, AA is not allowed, and BA a different selection from AB. Solution We may not repeat letters and the order of the letters makes a difference.
AB, BA, BC, CB, AC, CA
Suppose you are given the set
S = {A, B, C, D} List all the ways you may select three members from S where repetition is not allowed, and order is important. For example, AAA and BBA are not allowed, and CBA a different selection from ABC.
Guided Example 5 Practice
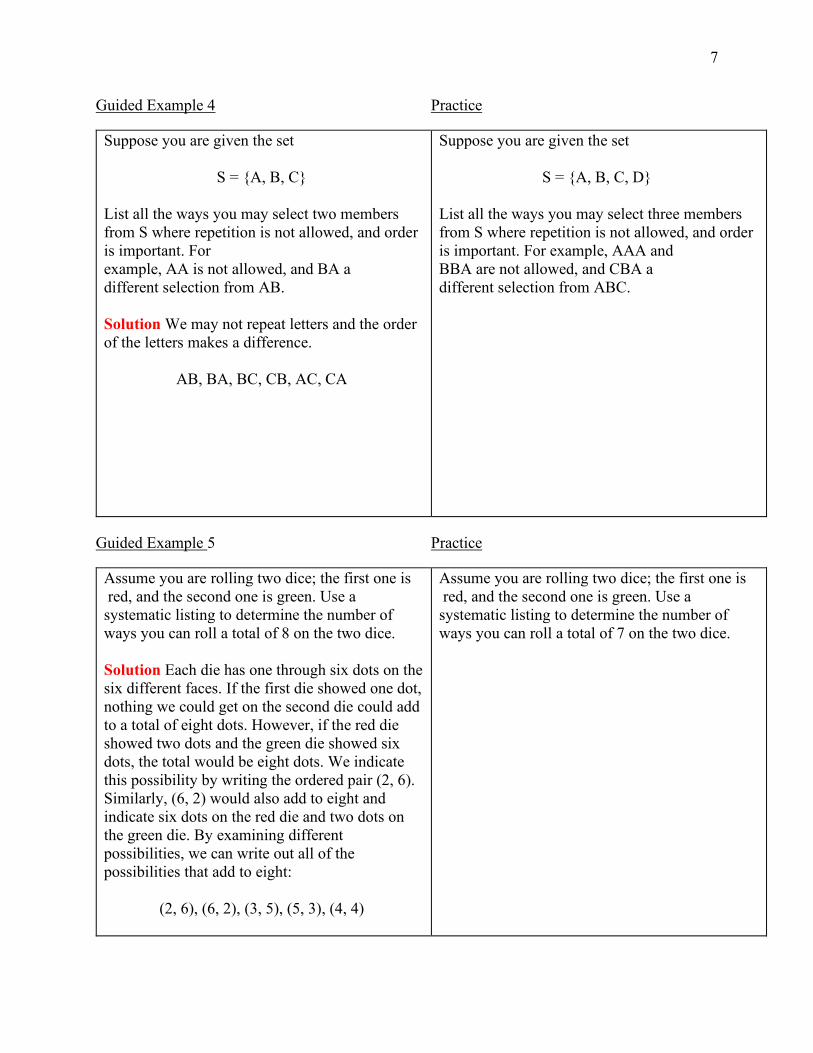
Assume you are rolling two dice; the first one is red, and the second one is green. Use a systematic listing to determine the number of ways you can roll a total of 8 on the two dice. Solution Each die has one through six dots on the six different faces. If the first die showed one dot, nothing we could get on the second die could add to a total of eight dots. However, if the red die showed two dots and the green die showed six dots, the total would be eight dots. We indicate this possibility by writing the ordered pair (2, 6). Similarly, (6, 2) would also add to eight and indicate six dots on the red die and two dots on the green die. By examining different possibilities, we can write out all of the possibilities that add to eight:
(2, 6), (6, 2), (3, 5), (5, 3), (4, 4)
Assume you are rolling two dice; the first one is red, and the second one is green. Use a systematic listing to determine the number of ways you can roll a total of 7 on the two dice.

8
How do you use systematic listing to compute probabilities?
Key Terms
Probability of outcome A, P(A) Systematic listing
Summary
With theoretical probability, you can find the chance that an outcome occurs by taking the number of ways for that event to occur and divide it by the total number of outcomes in the sample space.
Notes
Guided Example 6 Practice
Suppose you draw a card from a standard 52 card deck. a. How many elements are there in this sample
space? Solution There are 52 cards in the deck, consisting of the following cards:
The sample space consists of the set of cards so there are 52 elements in the sample space.
Suppose you draw a card from a standard 52 card deck. a. How many elements are there in this sample
space?

9
b. Write the event “the card is a heart” as a set of outcomes.
Solution We list the outcomes of “the card is a heart” as {K♥, Q♥, J♥,10♥,9♥,8♥,7♥,6♥,5♥,4♥,3♥,2♥, A♥}
There are 13 outcomes in the event. c. What is the probability that the card is a
heart? Solution We divide the number of outcomes for “the card is a heart” by the total outcomes in the sample space, 13
52 which reduces to 14 .
b. Write the event “the cards is a face card” as a set of outcomes.
c. What is the probability that you draw a face
card?
Guided Example 7 Practice
Four children, Amy, Bill, Cali, and Dee, get in line in random order to go out to recess. The order in which they line up is observed and recorded as a string of letters such as ABCD. a. How many elements are in the sample space? Solution Using the strategy of systematic listing, we see there are 24 outcomes in the sample space: {ABCD, ABDC, ACBD, ACDB, ADBC, ADCB, BACD, BADC, BDCA, BDAC, BCAD, BCDA, CABD, CADB, CBAD, CBDA, CDAB, CDBA, DABC, DACB, DBCA, DBAC, DCAB, DCBA} b. Express the set “Amy and Bill line up next to
each other” as a set. Solution Using systematic listing, we see there are 12 ways for Amy and Bill line up next to each other:
Three children, Andy, Benita, and Craig get in line in random order to go out to recess. The order in which they line up is observed and recorded as a string of letters such as ABC. a. Express the set “Craig is in front of Benita” as
a set. b. What is the probability that Craig is in front
of Benita?

10
{ABCD, ABDC, BACD, BADC, CABD, CBAD, CDAB, CDBA, DABC, DBAC, DCAB, DCBA} c. What is the probability that Amy and Bill will
line up next to each other? Solution We divide the number of outcomes for “Amy and Bill will line up next to each other by the total outcomes in the sample space: 12
24 which reduces to 1
2 .
c. What is the probability that Andy and Benita will line up next to each other?
Guided Example 8 Practice
Suppose a carrier of sickle-cell anemia and a person without the sickle-cell gene have a child. a. Write the Punnett square for this situation.
Solution The Punnett square is a square diagram that is used to predict the genotypes of a particular cross or breeding experiment. In a 2 by 2 Punnett square, each parent has two genotypes. Let C be a carrier genotype and N a non-carrier genotype of a disease. A person with the disease must have both carrier genotypes or CC. Carriers of the disease will have one carrier genotype and one noncarrier genotype, CN or NC. People who do not have the disease and are not carriers have two non-carrier genotypes, NN. Create a square that shows the first parent as a carrier CN, and second parent as a non-carrier NN.
Second Parent N N
First C CN CN Parent N NN NN
Suppose a carrier of sickle-cell anemia and a person with sickle-cell anemia have a child. a. Write the Punnett square for this situation.

11
b. What is the probability that the child has sickle-cell anemia?
Solution Because someone with the disease is represented by CC, there is no possible outcomes of “with the disease” so the probability the child has the disease is 0
4 0= . c. What is the probability that the child is a
carrier of sickle-cell anemia? Solution CN denotes carrier, so the probability the child is a carrier is 2
4 which reduces to 12 .
d. What is the probability that the child carries
no sickle-cell genes?
Solution NN denotes no sickle cell genes, so the probability the child carries no sickle cell genes is 24 which reduces to 1
2 .
b. What is the probability that the child has sickle-cell anemia?
c. What is the probability that the child is a carrier
of sickle-cell anemia? d. What is the probability that the child carries no
sickle-cell genes?
What is the relationship between probability and odds?
Key Terms Odds Odds in favor Odds against
Summary Many people mistake odds for probability but they are not the same thing!! Odds compare the success rate to the failure rate instead of success rate to a total. Odds in favor of success compare the probability of success to the probability of failure by comparing the number of successes to the number of failures, Odds in Favor of Success Number of Successes to Number of Failures=
This may be written in words, as a ratio, or as a fraction. For example, odds of 3 to 1 might be written as 3:1 or 3
1 .
Odds against success compare the probability of failure to the probability of a success, Odds against Success Number of Failures to Number of Successes=

12
Like odds in favor, the result may be written in words, as a ratio, of as a fraction. Another way of computing odds is to divide the probabilities,
(success)Odds in Favor of Success =(failure)(failure)Odds against Success =(success)
PPPP
Notes

13
Guided Example 9 Practice
A sales tax increase is being proposed to help pay down debt in the city of Prescott. A survey indicates the residents are split over the sales tax increase.
Support Increase
Oppose Increase
Live in North Prescott 1000 1100
Live in South Prescott 1500 1300
Suppose a person is randomly selected from North Prescott. a. What is the probability that the person
supports the tax increase? Solution There are 2100 total people surveyed from North Prescott and 1000 of those support the increase, so the
1000(N Prescott and supports increase)21001021
P =
=
b. What are the odds in favor of supporting the
tax increase? Solution The odds compare those in favor to those that oppose, so the odds they are from North Prescott and supports increase is 1000
1100 or 1011 .
A sales tax increase is being proposed to help pay down debt in the city of Prescott. A survey indicates the residents are split over the sales tax increase.
Support Increase
Oppose Increase
Live in North Prescott 1000 1100
Live in South Prescott 1500 1300
Suppose a person is randomly selected from South Prescott. a. What is the probability that the person
supports the tax increase? b. What are the odds in favor of supporting the
tax increase?

14
Guided Example 10 Practice
The favorite in a horse race is listed as having odds of 2 to 1. If these odds represent the odds against winning, what is the probability that the horse will win the race? Solution The odds against winning relates the number of failures (losses) to the number of successes (wins). To find the solution we must find the total number of outcomes (which is the denominator of a probability fraction and NOT an odds fraction). By adding the wins and losses, 1 + 2, we get 3 total possible outcomes. The calculation of probability of a win (or success) is to divide the number of wins by total outcomes, so 1 win divided by 3 total outcomes:
1(win)3
P =
To find the probability of losing, take 2 losses
divided by 3 total outcomes to get 2(loss)3
P = .
The longshot in a horse race is listed as having odds of 40 to 1. If these odds represent the odds against winning, what is the probability that the horse will win the race?

15
Section 2.2 Fundamental Counting Principle How do you use tree diagrams to represent counting situations graphically?
Key Terms Tree diagram Summary A tree diagram is a graphical representation of choices that allow us to see how a combination of choices may be made. A tree is built of sets of branches that represent the different choices that can be made. For instance, suppose we are flipping a penny and a nickel. List all the possible combinations of flips and rolls. The tree starts with two branches representing heads or tails on the penny. The second set of branches starts from where each of the previous branches terminate. Since the nickel can result in heads or tail, this leads to two branches for this flip. Reading this tree diagram from left to right, we can quickly list out all the possible flips of the two coins: HH, HT, TH, TT. Suppose we are flipping a coin and rolling a die. What would the tree diagram look like in this context?
• How do you use tree diagrams to represent counting situations graphically? • How do you determine the number of branches in a tree diagram without drawing the
tree? • How do you use the fundamental counting principle and slot diagrams to organize
information? • How do you solve counting problems with special conditions?

16
This tree diagram allows us to quickly list out the twelve possible ways: H1, H2, H3, H4, H5, H6, T1, T2, T3, T4, T5, T6. Notes

17
Guided Example 1 Draw a tree diagram that shows the different ways to flip a penny, nickel, dime, and quarter. In how many ways can you get exactly 0 tails? Solution Draw a tree diagram where each set of branches represents a different coin. If you examine the tree, you can see that only one branch has 0 tails. This is the branch corresponding to HHHH.
Practice Draw a tree diagram that shows the different ways to flip a penny, nickel, and dime. In how many ways can you get exactly 1 head?

18
How do you determine the number of branches in a tree diagram without drawing the tree?
Key Terms None Summary In the previous objective, we used tree diagrams to help us list out all the possibilities for a set of choices. If we do not need to list out every possibility in a tree, then we can avoid it and visualize the tree. For instance, if we need to know the number of ways a penny and nickel can be flipped we can visualize the tree without drawing it. The first set of branches would correspond to flipping the penny. From these two branches, we need another two branches indicating how many ways there is to flip the nickel. This gives us a tree with a total of 2×2 = 4 total branches. In the situation where we are flipping a coin and rolling a die, we would first draw two branches corresponding to the heads or tails on the coin. Then from each of these branches we would draw six more branches corresponding to the six possible rolls on the die. This would give us a total of 2×6 = 12 total branches on the tree. Notes

19
Guided Example 2 Practice How many different two-digit numbers can you form using the digits 1, 2, 3, 4, 5, and 6 without repetition? For example, 11 is not allowed. Solution Imagine a tree where the first set of branches corresponds to the first digit and the second set of branches corresponds to the second digit. This means that the first digit corresponds to six branches and from each of these branches are five branches (since we cannot repeat the digit). The total number of digits (branches) is 6×5 or 30.
How many different three-digit numbers can you form using the digits 1, 2, 3, 4, 5, and 6 without repetition? For example, 111 or 223 is not allowed.
Guided Example 3 Practice A committee is being formed from five people, Abe, Bob, Cate, Diane, and Ed. How many ways can a two-person committee be formed with a chairperson and vice chairperson? Assume that no person can have two positions. Solution Imagine a tree where each set of branches corresponds to choosing a chairperson or a vice chairperson. In choosing a chairperson, we need five branches. Since one person cannot be chairperson and vice chairperson, there are four branches that correspond to the vice chairperson. This means the total number of branches is 5×4 = 20.
An executive committee is being formed from six people, Abe, Bob, Cate, Diane, Ed, and Fiona. How many ways can a three-person committee be formed with a president, vice president, and treasurer? Assume that no person can have two positions.

20
Guided Example 4 Practice The license plate of a robber’s getaway car began with the letters A, D, and V, but an eyewitness could not remember the order. The rest of the plate had the numbers 2, 3, and 6, but again the eyewitness did not recall the order. How many license plates must the police investigate to find the car? Solution The tree for this problem would have six sets of branches. The first three sets of branches correspond to the letters. There are three branches corresponding to the first letter, two branches corresponding to the second letter, and one branch to the third letter for a total of six branches. Similarly, there are three branches corresponding to the first number, two branches to the second letter and one branch to the last number. This gives a total of six branches. These branches begin at the end of the branches for the letters. This gives a total of 6×6 or 36 possibilities for letters and numbers.
The license plate of a robber’s getaway car began with the numbers 1, 2 and 9, but an eyewitness could not remember the order. The rest of the plate had the letters A, V, X, and Y, but again the eyewitness did not recall the order. How many license plates must the police investigate to find the car?
Guided Example 5 Practice Four students, Alice, Bob, Carol, and David, want to sit in the front row of class. The front row has four seats. In how many ways can the students be seated if the men sit in the seats on the outside? Solution For this problem, a tree would be created where each set of branches corresponds to each of the four seats. Starting with the first seat, there would be two branches corresponding to Bob and David. From that branch, the second seat would have two branches corresponding to Alice and Carol. Once we have chosen the people for the first two seats, there is only one more branch for the third seat (the other woman) and only one more branch for the fourth seat (the other man). This tree would have a total of 2×2××1×1 =4.
Four students, Alice, Bob, Carol, and David, want to sit in the front row of class. The front row has four seats. In how many ways can the students be seated if the men do not sit together?
21
How do you use the fundamental counting principle and slot diagrams to organize information?
Key Terms Fundamental counting principle Summary
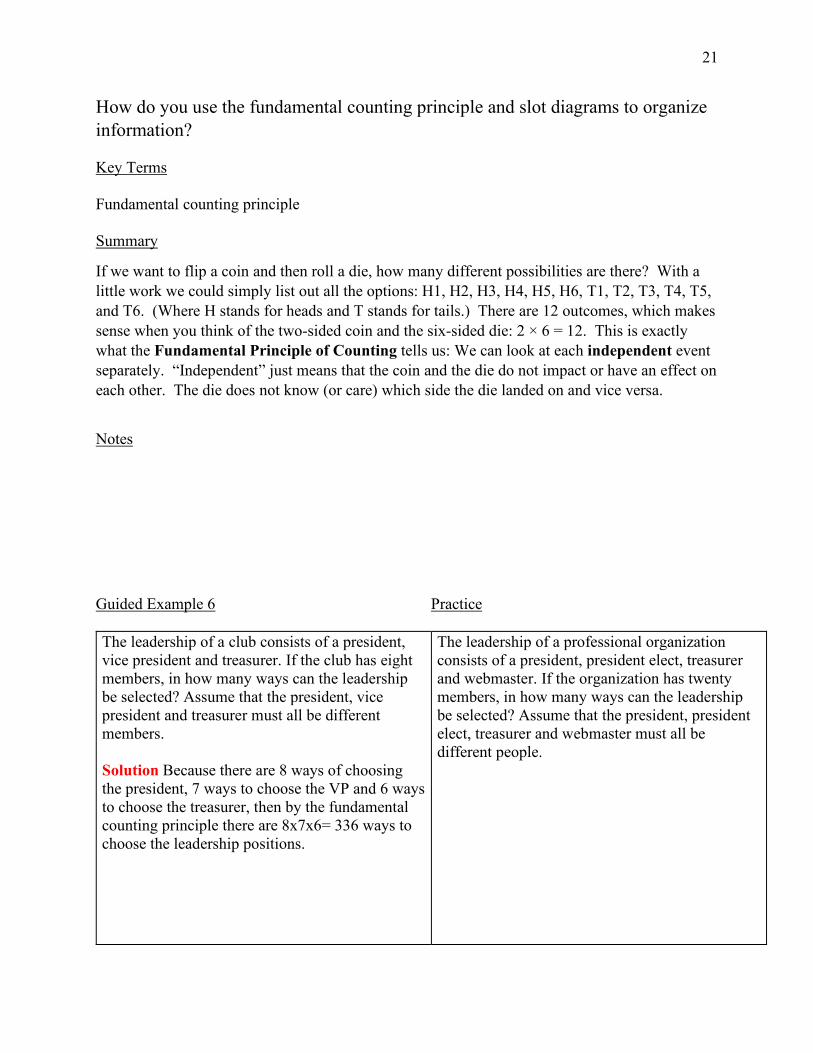
If we want to flip a coin and then roll a die, how many different possibilities are there? With a little work we could simply list out all the options: H1, H2, H3, H4, H5, H6, T1, T2, T3, T4, T5, and T6. (Where H stands for heads and T stands for tails.) There are 12 outcomes, which makes sense when you think of the two-sided coin and the six-sided die: 2 × 6 = 12. This is exactly what the Fundamental Principle of Counting tells us: We can look at each independent event separately. “Independent” just means that the coin and the die do not impact or have an effect on each other. The die does not know (or care) which side the die landed on and vice versa.
Notes Guided Example 6 Practice The leadership of a club consists of a president, vice president and treasurer. If the club has eight members, in how many ways can the leadership be selected? Assume that the president, vice president and treasurer must all be different members. Solution Because there are 8 ways of choosing the president, 7 ways to choose the VP and 6 ways to choose the treasurer, then by the fundamental counting principle there are 8x7x6= 336 ways to choose the leadership positions.
The leadership of a professional organization consists of a president, president elect, treasurer and webmaster. If the organization has twenty members, in how many ways can the leadership be selected? Assume that the president, president elect, treasurer and webmaster must all be different people.

22
Guided Example 7 Practice How many possibilities are there when an 8-sided dice is rolled twice? Solution Because each of the dice is independent, then by the fundamental counting principle there are 8*8 = 64 possibilities.
How many possibilities are there when an 8-sided dice is rolled three times?
Guided Example 8 Practice Using the digits 0, 1, 2, ...8, 9, determine how many 5-digit numbers can be constructed if zero cannot be used for the first digit and digits may be repeated. Solution Because we have 10 digits to put into each of the 5 slots because all ten digits can be repeated, we only need to look at the first slot as a different case. We must remove one of the possibilities, so that first digit only has 9 choices. Therefore, 9*10*10*10*10 = 90,000
Using the digits 0, 1, 2, ...8, 9, determine how many 6-digit numbers can be constructed if zero cannot be used for the first digit and digits may not be repeated.
Guided Example 9 Practice A multiple-choice test has 6 questions. Each question has 5 answer choices, with one correct answer per question. If you select one of these choices for each question and leave nothing blank, in how many ways can you answer the questions on the test? Solution Because we have 5 answers to put in the 6 different slots, and answers can be repeated, then there are 5*5*5*5*5*5= 15,625
A multiple-choice test has 10 questions. Each question has 4 answer choices, with one correct answer per question. If you select one of these choices for each question and leave nothing blank, in how many ways can you answer the questions on the test?

23
Guided Example 10 Practice In California, special license plates are issued to vehicles manufactured after 1922 which are at least 25 years old and of historical interest. One type of special license plate has three numbers followed by one letter. How many such license plates are possible? Solution Because there are three slots to place numbers and 1 slot to place a letter, we have 4 slots to fill. The numbers can be repeated so there are 10 possible outcomes in each of those slots and 26 letters to place in the last slot. The number of outcomes is: 10*10*10*26 = 26,000
Standard license plates in Arizona have seven characters. If a character is a letter or number from 0 through 9, how many possible standard license plates are there in Arizona?
How do you solve counting problems with special conditions?
Key Terms None Summary There are many different situations in which you must use the fundamental counting principle to compute the number of ways something can occur and you are going to view and complete examples of many of these to help you decide which is the best to use. Notes Guided Example11 Practice In an experiment, two men and two women will sit in four seats in a row.
In an experiment, three men and three women will sit in six seats in a row.

24
a. In how many ways can the people be seated with no restrictions?
Solution Because there are no restrictions, we can use a simple slot diagram and the fundamental counting principle for this problem with 4x3x2x1=24 being the number of ways these people can be seated. b. In how many ways can the people be seated if
the men must sit together and the women must sit together?
Solution Let’s first look at the situation where a woman occupies the first seat. There are 2 women who could occupy that seat. Because the women must sit together, there is only one way to occupy the next seat. In the next seat, a man must occupy the seat and there are 2 different men to occupy it. A man must be in the last seat so there are 2x1x2x1 ways if a woman is in the first seat. Now assume a man is in the first seat. The slot diagram would be the same so we must multiply the result by 2. There are 2(2x1x2x1) = 8 ways to seat these people. c. In how many ways can we seat the people if
the men and women must alternate? Solution Let’s first look at the situation where a woman occupies the first seat. There are 2 women who could occupy that seat. In the next seat, a man must occupy the seat and there are 2 different men to occupy it. Now in the third seat, it must be a woman and there is only a single woman who could occupy the seat. then a man must be in the next seat so there are 2x2x1x1 ways if a woman is in the first seat. Now assume a man is in the first seat. The slot diagram would be the same so we must multiply the result by 2. There are 2(2x2x1x1) = 8 ways to seat these people.
a. In how many ways can the people be seated with no restrictions?
b. In how many ways can the people be seated if
the men must sit together and the women must sit together?
c. In how many ways can we seat the people if
the men and women must alternate?

25
Section 2.3 Permutations and Combinations Getting Started – What is a factorial?
When we apply the Multiplication Principle and do not allow repetition, the number of choices in each part of the product drops by 1. This leads to products like 5 4 3 2 1⋅ ⋅ ⋅ ⋅ or 8 7 6 5 4 3 2 1⋅ ⋅ ⋅ ⋅ ⋅ ⋅ ⋅ .
This type of product occurs so often that it is assigned its own symbol.
Factorial Notation
For any positive integer n,
( )( )! 1 2 3 2 1n n n n= − − ⋅ ⋅
The value of 0! is defined to be 1.
Let’s look at how we might apply this to an application.
Suppose a production line requires six workers to carry out six different jobs. Each worker can only do one job at a time. Once a worker is selected for a job, the other jobs must be carried out by the remaining workers. To find the number of ways we can assign workers to jobs, calculate the product
first second third fourth fifth sixthjob job job job job job
7206 5 4 3 2 1⋅ ⋅ ⋅ ⋅ ⋅ =
The number of ways to make each choice drops by one in each factor since each worker can only do one job. In effect, we can’t choose the same worker twice. This is often indicated by saying that we want to assign workers without repetition.
Instead of multiplying these factors out, we can utilize factorials and write it as 6! This may then be computed on a calculator such as a TI graphing calculator. The factorial symbol is located under the MATH button in the PRB submenu.
Getting Started – What is a factorial? • How do you determine the difference between a combination and permutation? • How do you calculate the number of permutations of n objects taken r at a time using
factorial notation and slot diagrams? • How do you calculate the number of combinations of n objects taken r at a time? • How do you decide which counting technique is appropriate?

26
Notes

27
Guided Example 1 Practice
Evaluate each of the expressions involving factorials. a. 8! Solution Using the definition of factorial, this is equal to 8 7 6 5 4 3 2 1 40320⋅ ⋅ ⋅ ⋅ ⋅ ⋅ ⋅ =
b. 16! Solution Using the definition of factorial, this is equal to 1316 15 14 3 2 1 2.092 10⋅ ⋅ ⋅ ⋅ ⋅ ⋅ ⋅ ≈ ×
This is an incredibly huge number. The calculator uses scientific notation to display it. The E13 indicates 1310× . You would write this down by moving the decimal place 13 places to the right.
Evaluate each of the expressions involving factorials. a. 5! b. 20!

28
c. 100!98!
Solution Both of the numbers in the fraction are beyond most calculator’s ability to calculate. However, if we use the definition of factorial we note an interesting pattern.
100! 100 99 98 97 3 2 198! 98 97 3 2 1
⋅ ⋅ ⋅ ⋅ ⋅ ⋅ ⋅ ⋅=
⋅ ⋅⋅ ⋅ ⋅ ⋅
Many of the factors on top match up with identical factors on the bottom. These may be reduced leaving
100! 100 99 990098!
= ⋅ =
c. 82!80!
How do you determine the difference between a combination and permutation?
Key Terms Permutations Combinations
Summary:
Permutation and Combination are two other techniques we use for counting things. They are usually used when we are selecting a subset of our original set and when we are NOT ALLOWED TO REPEAT the same item. For example, when dealing a hand of cards, you can’t be dealt the same exact card twice.
The difference between Permutations and Combinations is that for Permutations, the order of selection matters, and for Combinations it does not. This sounds easy enough, but it is usually very tricky to determine which is which. When working on problems be sure to check your answers. When you get a problem wrong, try using another technique then THINK about why you were incorrect the first time. It is OK to be wrong as long as you learn from your mistakes.

29
Let’s start with permutations, or all possible ways of doing something. We’re using the fancy-pants term “permutation”, so we’re going to care about every last detail, including the order of each item. Let’s say we have 8 people:
1:Alice 2:Bob 3:Charlie 4:David 5:Eve 6:Frank 7:George 8:Horatio
How many ways can we award a 1st, 2nd and 3rd place prize among eight contestants? (Gold / Silver / Bronze)
We’re going to use permutations since the order we hand out these medals matters. Here’s how it breaks down:
• Gold medal: 8 choices: A B C D E F G H (Clever how I made the names match up with letters, eh?). Let’s say A wins the Gold.
• Silver medal: 7 choices: B C D E F G H. Let’s say B wins the silver. • Bronze medal: 6 choices: C D E F G H. Let’s say… C wins the bronze.
We picked certain people to win, but the details don’t matter: we had 8 choices at first, then 7, then 6. The total number of options was 8 · 7 · 6 = 336.
Combinations are easy going. Order doesn’t matter. You can mix it up and it looks the same. Let’s say I’m a cheapskate and can’t afford separate Gold, Silver and Bronze medals. In fact, I can only afford empty tin cans.
How many ways can I give 3 tin cans to 8 people?
Well, in this case, the order we pick people doesn’t matter. If I give a can to Alice, Bob and then Charlie, it’s the same as giving to Charlie, Alice and then Bob. Either way, they’re equally disappointed.

30
So, if we have 3 tin cans to give away, there are 3*2*1 or 6 variations for every choice we pick. If we want to figure out how many combinations we have, we just create all the permutations and divide by all the repeats. In our case, we get 336 permutations (from above), and we divide by the 6 repeats for each permutation and get 336/6 = 56. Notes

31
Guided Example 2 Practice Calculate:
a. 5 5P
Solution 5 5
5! 5! 120 120(5 5)! 0! 1
P = = = =−
Remember that 0! 1=
b. 6 4C
Solution 6 4
6! 720 152!4! 2 24
C = = =⋅
Calculate:
a. 6 4P
b. 5 3C
Guided Example 3 Practice a. How many permutations are there of the
letters d, a, i, l, and y? Solution There are 5 letters in the word, so
5 5 120P =.
b. How many permutations are there of the
letters d, a, i, l, and y if the letters are selected three at a time?
Solution We are putting the 5 letters into 3 slots,
so 5 3 60P = .
a. How many permutations are there of the letters c, a, t, and s?
b. How many permutations are there of the
letters c, a, t, and s if the letters are selected two at a time??

32
Guided Example 4 Practice Dealing three cards from a standard deck of cards, how many ways can I get three hearts? Solution There are 13 hearts in the deck, the order I am dealt the cards does not matter, so we use combination and calculate
13 313! 286
(13 3)!3!C = =
−
There are 286 different ways to get 3 hearts.
Dealing three cards from a standard deck of cards, how many ways can I get three kings?
How do you calculate the number of permutations of n objects taken r at a time using factorial notation and slot diagrams?
Key Terms: Permutations Summary:
If we have 24 books, how many ways can we choose four of the books? It depends on what we are going to do with the books. Are we going to display them on a bookshelf or are we going to donate them to a fundraiser?
If we are organizing them on a shelf then there is an implied order, there will be a first book, a 2nd book, and so on. This indicates that we should use the Permutation formula. We have 24 total books so n = 24 and we are selected a subset of 4 books, r = 4.
24 4 225,024P =

33
There are 255,024 different ways of selecting four books out of a group of 24 books and lining them up.
If you thought this was a Fundamental Principle of Counting problem, you were correct. We can approach this problem from either angle. For your first book you have 24 to choose. Then for the 2nd there are only 23 left, then 22, and finally 21. Therefore, the total number of arrangements would be 24 × 23 × 22 × 21 = 255,024. Factorial says to multiply all whole numbers from the chosen number down to 1. The symbol is "!" So we can write 24 × 23 × 22 × 21 as 24!/20! Notes Guided Example 5 Practice The US Senate has 100 Senators. A Senate committee is to be formed where the committee is led by a chairman and vice chairman. How many ways is there to select the leadership of the committee? Solution There are two important things to note in this problem. We are choosing 2 seats, but each seat has a different responsibility. Order matters!!
This is a permutation of 100 2 9900P = . You can use a slot diagram for this problem as well: 100 99 9900⋅ =
The leadership of a club consists of a president, vice president and treasurer. If the club has eight members, in how many ways can the leadership be selected? Assume that the president, vice president and treasurer must all be different members.

34
How do you calculate the number of combinations of n objects taken r at a time?
Key Terms Combinations Summary If Shaquille O’Neal runs into 20 fans, but only has 16 autographed photographs to give away, how many different ways can he give away the photographs? To get a photo you just have to be one of the 16 fans he chooses. It doesn’t matter if you are the first or the 16th, either way you will get a photograph. The order does not matter. Therefore, it is a Combination problem. Then n = 20 and r = 16. Thus, the number of ways Shaquille O’Neal can give away 16 photos is: 20 16 4854C = There are 4,845 different ways that Shaquille O’Neal can give away 16 autographed photos. Notes

35
Guided Example 6 Practice A nine-person anniversary planning committee for a community college is to be formed. Two of the members must come from 12 administrators. Three of the members must be chosen from 25 faculty members. Four of the members will be selected from 15 staff members. How many possible committees are there? Solution We are going to use a combination of the Fundamental Counting Principle and combinations as we have three different groups we want to combine:
12 2 25 3 15 4 66 2300 1365 207,207,000C C C⋅ ⋅ = ⋅ ⋅ =
A Senate committee is to be formed from 52 Republican Senators and 48 Democratic Senators. If three of the members must be Republicans and two of the members must be Democrats, how many possible committees are there?
Guided Example 7 Practice A Senate committee is to be formed from 52 Republican Senators and 48 Democratic Senators. The chairman and vice chairman must be chosen from Republicans. Two committee members must be chosen from the remaining Republican Senators and two more from the Democratic Senators. How many possible committees are there? Solution We are going to use a combination of the fundamental counting principle, combinations, and permutations as we have three separate events that we need to combine into a single group. First the chair and vice chair must be chosen, and because each job is unique, order matters:
52 2 2652P = The two committee members must be chosen from the remaining 50 senators and order does not matter as the jobs are the same:
50 2 1225C =
A Senate committee is to be formed from 52 Republican Senators and 48 Democratic Senators. The chairman and vice chairman must be chosen from Republicans. The remaining four members of the committee are chosen from the rest of the Senate. How many possible committees are there?

36
Similarly, for the Democrats, two committee members from the 48 senators:
48 2 1128C = Combining the three events using Fundamental Counting Principle: 2652 1225 1128 3,664,533,000⋅ ⋅ =
How do you decide which counting technique is appropriate?
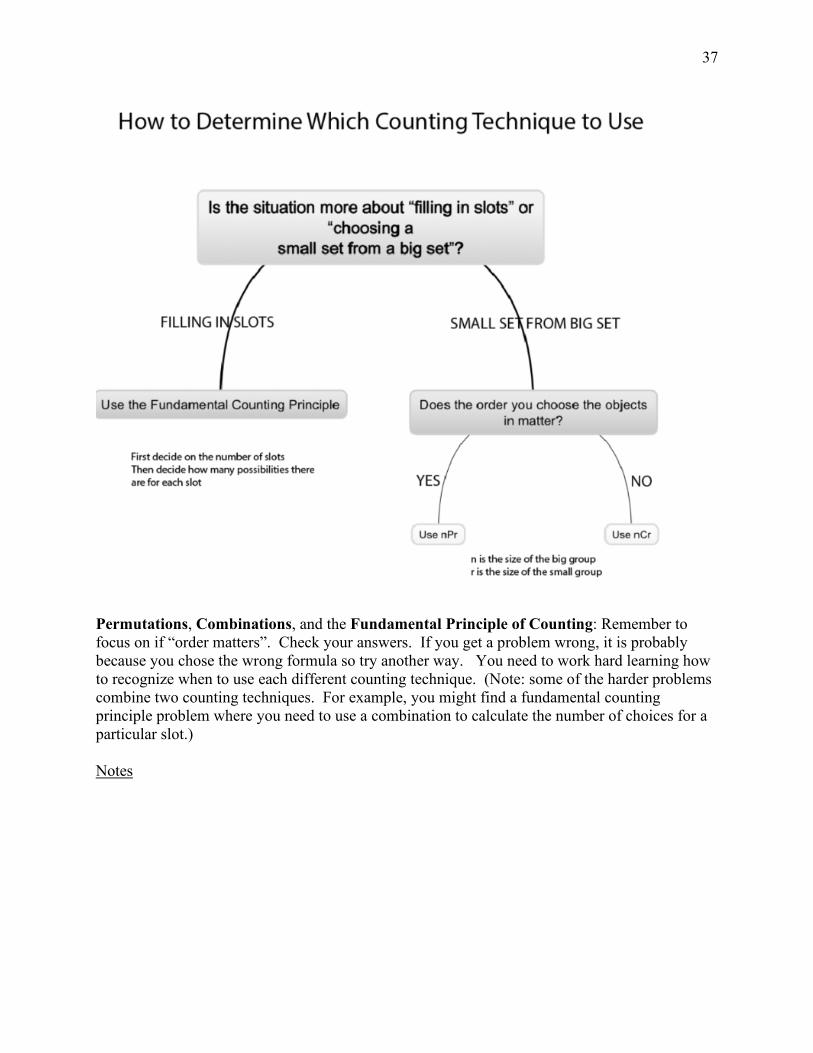
Key Terms Fundamental Counting Principle Combinations Permutations Summary Learning when to use which counting technique takes quite a bit of practice. The flowchart below should help guide you in determining which counting technique is appropriate for which situations.
37
Permutations, Combinations, and the Fundamental Principle of Counting: Remember to focus on if “order matters”. Check your answers. If you get a problem wrong, it is probably because you chose the wrong formula so try another way. You need to work hard learning how to recognize when to use each different counting technique. (Note: some of the harder problems combine two counting techniques. For example, you might find a fundamental counting principle problem where you need to use a combination to calculate the number of choices for a particular slot.) Notes
38
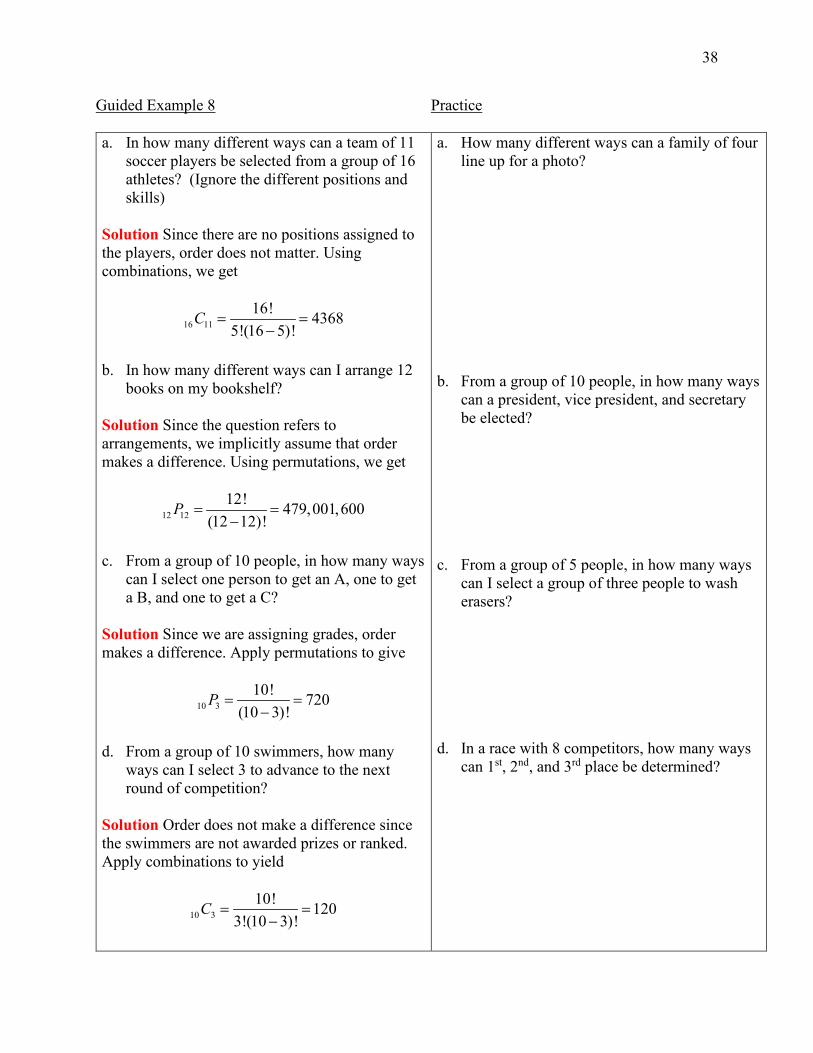
Guided Example 8 Practice a. In how many different ways can a team of 11
soccer players be selected from a group of 16 athletes? (Ignore the different positions and skills)
Solution Since there are no positions assigned to the players, order does not matter. Using combinations, we get
16 1116! 4368
5!(16 5)!C = =
−
b. In how many different ways can I arrange 12
books on my bookshelf? Solution Since the question refers to arrangements, we implicitly assume that order makes a difference. Using permutations, we get
12 1212! 479,001,600
(12 12)!P = =
−
c. From a group of 10 people, in how many ways
can I select one person to get an A, one to get a B, and one to get a C?
Solution Since we are assigning grades, order makes a difference. Apply permutations to give
10 310! 720
(10 3)!P = =
−
d. From a group of 10 swimmers, how many
ways can I select 3 to advance to the next round of competition?
Solution Order does not make a difference since the swimmers are not awarded prizes or ranked. Apply combinations to yield
10 310! 120
3!(10 3)!C = =
−
a. How many different ways can a family of four line up for a photo?
b. From a group of 10 people, in how many ways
can a president, vice president, and secretary be elected?
c. From a group of 5 people, in how many ways
can I select a group of three people to wash erasers?
d. In a race with 8 competitors, how many ways
can 1st, 2nd, and 3rd place be determined?

39
e. I’m buying a new car. I have 4 exterior colors to choose from, two different engines, three styles of interiors, and sunroof or no sunroof. How many different cars are possible?
Solution We are filling in slots to fill with a choice of exterior color, engine, interior style, and sunroof. Using the Fundamental Counting Principle, we get 4 2 3 2 48⋅ ⋅ ⋅ =
e. A menu has a choice of 5 appetizers, 6 entrees, and 4 desserts. How many meals are possible consisting of an appetizer, entrée, and dessert?

40
Section 2.4 Counting Techniques and Probability
How do you use the relationship between the probability of an event and its complement to simplify problems?
Key Terms Complement Summary
If there is a 75% chance of rain today, what are the chances it will not rain? We know that there are only two possibilities. It will either rain or it will not rain. Because the sum of the probabilities for all the outcomes in the sample space must be 100% or 1.00, we know that
P(will rain) + P(will not rain) = 100%.
Rearranging this we see that
P(will not rain) = 100% - P(will rain) = 100% - 75% = 25%.
The events E = {will rain} and F = {will not rain} are called complements.
The complement of event E, denoted by E′ , is the set of outcomes in the sample space that are not in the event E. The probability of E′ is given by
( ) 1 ( )P E P E′ = −
Notes
• How do you use the relationship between the probability of an event and its complement to simplify problems?
• How do you calculate the probability of the union and intersection of two events? • What is conditional probability? • How is conditional probability computed? • How do you use probability trees to compute conditional probabilities?

41
Guided Example 1 Practice Many stores sell extended warranties which will allow a product to be replaced or repaired at no cost within the warranty period. If the probability that your Blue Ray player stops working before the extended warranty expires is 0.051, what is the probability that the player will not stop working before the warranty expires? Solution Suppose E is the event “your Blue Ray player stops working before the extended warranty expires”. The compliment of this event E′ is the event “your Blue Ray player does not stop working before the extended warranty expires”. Using complements,
( ) 1 ( )
1 0.051
0.949
P E P E′ = −
= −
=
For a 52-year-old male with several risk factors, the probability of developing heart disease over the next 30 years is 0.53. What is the probability of not developing heart disease over the next 30 years?
Guided Example 2 Practice A pair of dice is rolled. What is the probability of getting a sum greater than 4? Solution It is possible to solve this problem without complements, but easier to use them. Because there are only six ways,
(1,1), (1,2) (2,1) (2,2) (1,3) (3,1) to get a sum of 4 or less, then you can find the probability of getting 4 or less by counting these outcomes,
6(4 or less)36
P =
Using compliments, we find that the probability of getting a sum more than 4 is
6 30(more than 4) 136 36
P = − =
This reduces to 5
6 or approximately 83%.
A pair of dice is rolled. What is the probability of getting a sum of 11 or less?
42
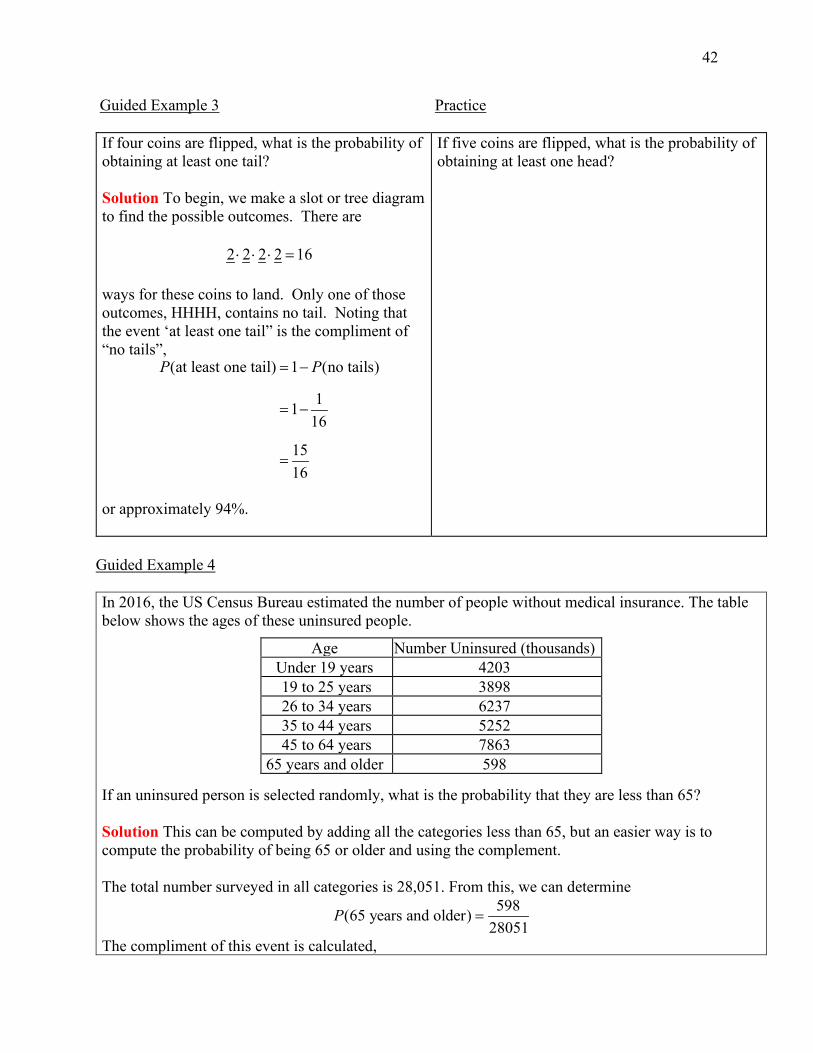
Guided Example 3 Practice If four coins are flipped, what is the probability of obtaining at least one tail? Solution To begin, we make a slot or tree diagram to find the possible outcomes. There are 2 2 2 2 16⋅ ⋅ ⋅ = ways for these coins to land. Only one of those outcomes, HHHH, contains no tail. Noting that the event ‘at least one tail” is the compliment of “no tails”,
(at least one tail) 1 (no tails)
1116
1516
P P= −
= −
=
or approximately 94%.
If five coins are flipped, what is the probability of obtaining at least one head?
Guided Example 4 In 2016, the US Census Bureau estimated the number of people without medical insurance. The table below shows the ages of these uninsured people. If an uninsured person is selected randomly, what is the probability that they are less than 65? Solution This can be computed by adding all the categories less than 65, but an easier way is to compute the probability of being 65 or older and using the complement. The total number surveyed in all categories is 28,051. From this, we can determine
598(65 years and older)
28051P =
The compliment of this event is calculated,
Age Number Uninsured (thousands) Under 19 years 4203 .19 to 25 years 3898 .26 to 34 years 6237 .35 to 44 years 5252 .45 to 64 years 7863
65 years and older 598

43
(less than 65) 1 (65 years and older)
598128051
2745328051
P P= −
= −
=
or about 98%
Practice In 2016, the US Census Bureau estimated the number of people without medical insurance. The table below shows the ages of these uninsured people.
Age Number Uninsured (thousands) Under 19 years 4203 .19 to 25 years 3898 .26 to 34 years 6237 .35 to 44 years 5252 .45 to 64 years 7863
65 years and older 598 If an uninsured person is selected randomly, what is the probability that they are 19 or older?

44
How do you calculate the probability of the union and intersection of two events?
Key Terms Union Intersection Mutually exclusive Summary Many probabilities in real life involve more than one outcome. If we draw a single card from a deck, we might want to know the probability that it is either red or a jack. If we look at a group of students, we might want to know the probability that a single student has “brown hair and blue eyes”. When we combine two outcomes to make a single event, we connect the outcomes with the word “and” or the word “or.” It is very important in probability to pay attention to the words “and” and “or” if they appear in a problem. The word “and” restricts the field of possible outcomes to only those outcomes that simultaneously satisfy more than one event. When we combine two events with the word “and”, we call this the intersection of the events. The word “or” broadens the field of possible outcomes to those that satisfy one or both events. When we combine two events with the word “or”, we call this the union of the events. For example, students in the event “brown hair and blue eyes” must have both brown hair and blue eyes. Student in “brown hair or blue eyes” may have brown hair without blue eyes, blues eyes without brown hair, or blue eyes and brown hair.
Two sets are mutually exclusive is they have nothing in common. Addition Rule for “Or” Probabilities
If A and B are any events, then
( or ) ( ) ( ) ( and )P A B P A P B P A B= + −
If A and B are mutually exclusive events (they have nothing in common) then ( and ) 0P A B = ,
( or ) ( ) ( )P A B P A P B= +
Brown Hair
Blue Eyes
Brown Hair
Blue Eyes
Brown Hair and Blue Eyes Brown Hair or Blue Eyes

45
Notes Guided Example 5 Practice Suppose the probability of lightning on July 4 is 0.3 and the probability of rain on July 4 is 0.2, If the probability of lightning and rain on July 4 is 0.15, how likely is it that there will be rain or lightning on July 4? Solution Let A be the event “lightning on July 4” and B be the event “rain on July 4”. Using the formula ( or ) ( ) ( ) ( and )P A B P A P B P A B= + − we calculate ( or ) 0.3 0.2 0.15 0.35P A B = + − = The probability of lightning or rain on July 4 is 35%.
Your car won’t start in the morning. Based on his experience, your mechanic tells you
• The probability you will need a new battery is 0.5. • The probability that you will need a new alternator is 0.1. • The probability that you will need a new battery and new alternator is 0.05.
What is the probability that you will need a new battery or a new alternator?

46
Guided Example 6 Practice Suppose that A and B are events and
( or ) 0.8P A B = , ( ) 0.3P A = , and ( ) 0.75P B = . Find ( and )P A B . Solution Start with the formula ( or ) ( ) ( ) ( and )P A B P A P B P A B= + − and put in the known quantities: 0.8 0.3 0.75 ( and )P A B= + − To solve for ( and )P A B ,
0.8 1.05 ( and )
0.25 ( and )
0.25 ( and )
P A B
P A B
P A B
= −
− = −
=
Suppose that A and B are events and ( or ) 0.7P A B = , ( ) 0.4P A = , and( and ) 0.25P A B = . Find ( )P B .
Guided Example 7 Practice Suppose a technology company conducts a survey of 200 consumers. Based on this survey they learn
• 23 consumers plan to purchase a laptop computer in the next six months. • 17 consumers plan to purchase a tablet in the next six months. • 35 consumers plan to purchase a laptop computer or tablet in the next six months
Based on this survey, what is the probability that a consumer plans to purchase a laptop computer and tablet? Solution Let L be the event “consumer purchases a laptop computer” and T be the event “consumer purchases a tablet”. In terms of these events, the information in the question leads to
23 17 35( ) , ( ) , ( or )200 200 200
P L P T P L T= = =
Suppose the probability of lightning on July 11 is 0.4 and the probability of rain on July 11 is 0.35, If the probability of lightning or rain on July 11 is 0.5, how likely is it that there will be rain and lightning on July 11?
Combine like terms Subtract 1.05 from both sides
Divide both sides by -1

47
Now let’s think of the addition rule in terms of the events L and T, ( or ) ( ) ( ) ( and )P L T P L P T P L T= + − Put in the probabilities and solve for ( and )P L T :
35 23 17 ( and )200 200 200
35 40 ( and )200 200
5 ( and )200
5 ( and )200
P L T
P L T
P L T
P L T
= + −
= −
− = −
=
The probability that a consumer purchases a laptop computer and a tablet in the next six months is 5
200 or 2.5%.
Guided Example 8
A wireless company surveyed 3743 customers about their gender and data usage. a. Find the likelihood that a customer will be female and use less than 200 MB of data. Solution To find the probability that a customer will be female and use less than 200 MB of data, we need to find how many female customers used less than 200 MB and divide it by the total number of customers in the survey,
641(female customer will use less than 200MB) 0.1713743
P = ≈
According to the survey, the likelihood that a customer will be female and use less than 200MB of data is about 17.1%.
Amount of Data Used Male Users Female Users Less than 200 MB 650 641 200 MB up to, but not including 500 MB 442 316 500 MB up to, but not including 1 GB 291 132 1 GB up to, but not including 2 GB 172 152 2 GB or more 507 440

48
b. Find the probability that a customer is female. Solution To find the probability that a customer is female, we need to find how many female customers are in the survey and divide it by the total number of customers in the survey. The total number of female customers in the survey is
641 + 316 + 132 + 152 + 440 = 1661
The likelihood of a female customer in the survey is
1681(female customer) 0.4493743
P = ≈
According to the survey, the likelihood that a customer is female is about 44.9%. c. Find the probability that a customer in the survey will use less than 200 MB of data. Solution To find the probability that a customer will use less than 200MB, we need to find how many customers use less than 200MB in the survey and divide it by the total number of customers in the survey. The total number of customers who use less than 200MB in the survey is
650 + 641 = 1291
The likelihood of a customer using less than 200MB in the survey is
1291(customer will use less than 200MB) 0.3453743
P = ≈
According to the survey, the likelihood that a customer uses less than 200MB of data is about 34.5%. d. Find the probability that a customer in the survey is female or will use less than 200 MB of data. Solution Since this question uses “or”, we use the Addition Rule for “or” where A is the event “customer is female” and B is the event “customer uses less than 200MB of data”
( or ) ( ) ( ) ( and )1681 1291 6413743 3743 3743233137430.623
P A B P A P B P A B= + −
= + −
=
≈
The probability that a customer in the survey is female or will use less than 200 MB of data is about 62.3%

49
Practice A wireless company surveyed 3743 customers about their gender and data usage.
Amount of Data Used Male Users
Female Users
Less than 200 MB 650 641
200 MB up to, but not including 500 MB 442 316
500 MB up to, but not including 1 GB 291 132
1 GB up to, but not including 2 GB 172 152
2 GB or more 507 440
a. Find the likelihood that a user is male and will use 2 GB or more of data.
b. Find the probability that a user is male.

50
c. Find the probability that a user in the survey will use 2 GB or more of data. d. Find the probability that a user in the survey is male or will use 2 GB or more of data.
What is conditional probability?
Key Terms Conditional Probability Tree Diagram Summary:
What do you think the probability is that a man is over six feet tall? If you knew that both his parents were tall would you change your estimate of the probability? A conditional probability is a probability that is based on some prior knowledge.
Conditional probability is the likelihood of an event occurring given that another event has occurred. A vertical line is used to indicate the event whose probability is being computed and

51
the event that has already occurred. For instance, the symbols ( | )P A B correspond to the probability of A occurring given that B has already occurred. The vertical bar separates the probability we are interested in calculating from the event that is assumed to have occurred.
A tree diagram is often used to represent conditional probabilities.
In this context, the events are depicted in the boxes and the corresponding probabilities are labeled on the branches connecting the boxes. If you follow the set of branches to A and then C, note that the first branch is labeled with ( )P A indicating the probability of A. Continuing to C, we see that the branch is labeled ( | )P C A indicating the probability of C given that A has occurred.
Notes
AC
D
BC
D
P(A))
P(B)
P(C|A)
P(D|A)
P(C|B)
P(D|B)
52
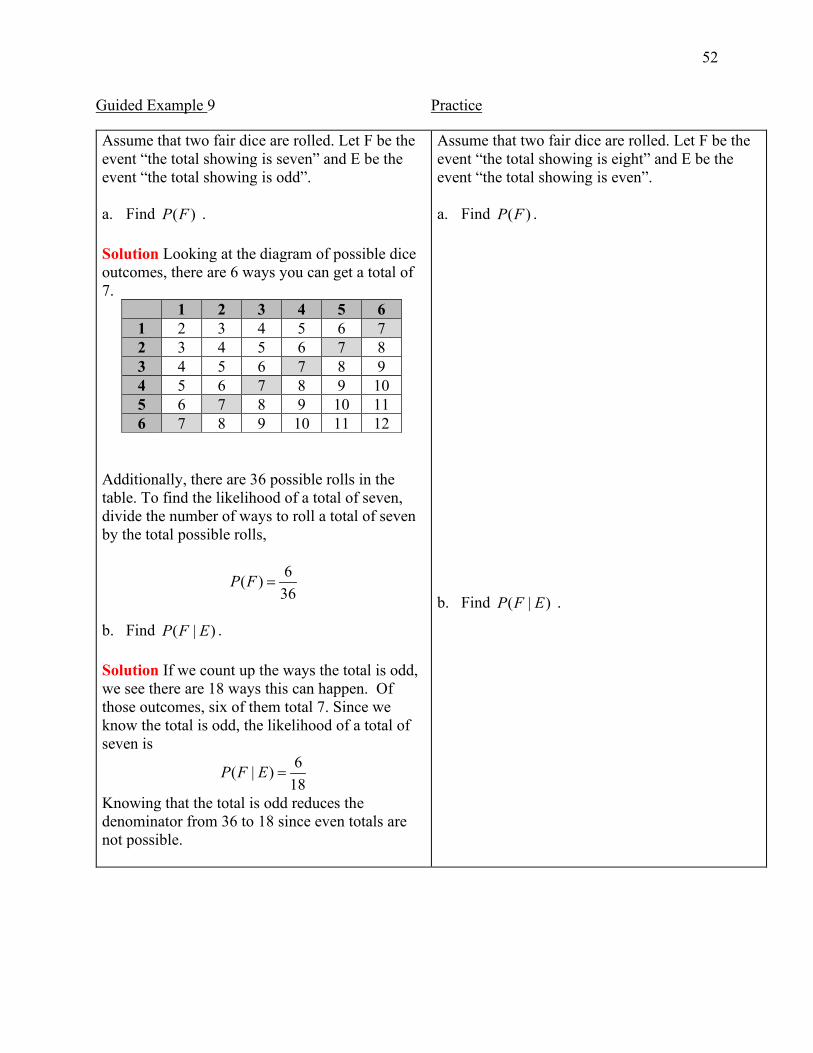
Guided Example 9 Practice Assume that two fair dice are rolled. Let F be the event “the total showing is seven” and E be the event “the total showing is odd”. a. Find ( )P F . Solution Looking at the diagram of possible dice outcomes, there are 6 ways you can get a total of 7.
1 2 3 4 5 6 1 2 3 4 5 6 7 2 3 4 5 6 7 8 3 4 5 6 7 8 9 4 5 6 7 8 9 10 5 6 7 8 9 10 11 6 7 8 9 10 11 12
Additionally, there are 36 possible rolls in the table. To find the likelihood of a total of seven, divide the number of ways to roll a total of seven by the total possible rolls,
6( )36
P F =
b. Find ( | )P F E . Solution If we count up the ways the total is odd, we see there are 18 ways this can happen. Of those outcomes, six of them total 7. Since we know the total is odd, the likelihood of a total of seven is
6( | )18
P F E =
Knowing that the total is odd reduces the denominator from 36 to 18 since even totals are not possible.
Assume that two fair dice are rolled. Let F be the event “the total showing is eight” and E be the event “the total showing is even”. a. Find ( )P F . b. Find ( | )P F E .
53
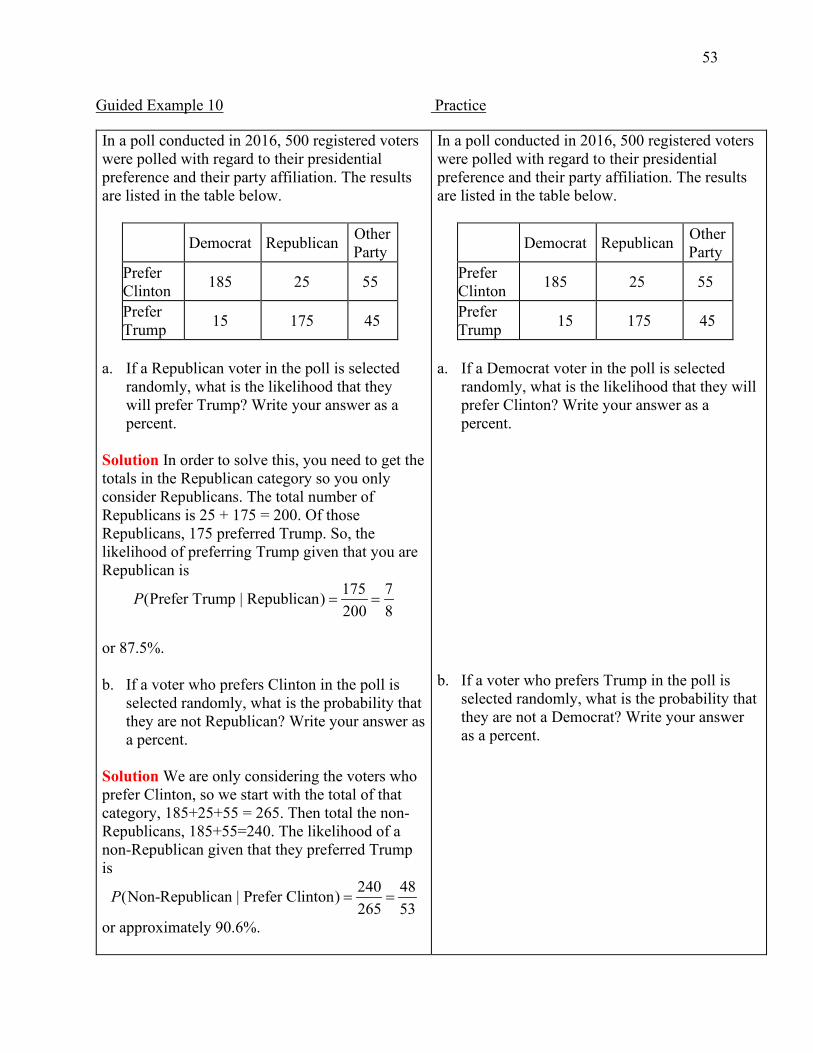
Guided Example 10 Practice In a poll conducted in 2016, 500 registered voters were polled with regard to their presidential preference and their party affiliation. The results are listed in the table below.
Democrat Republican Other Party
Prefer Clinton 185 25 55
Prefer Trump 15 175 45
a. If a Republican voter in the poll is selected
randomly, what is the likelihood that they will prefer Trump? Write your answer as a percent.
Solution In order to solve this, you need to get the totals in the Republican category so you only consider Republicans. The total number of Republicans is 25 + 175 = 200. Of those Republicans, 175 preferred Trump. So, the likelihood of preferring Trump given that you are Republican is
175 7(Prefer Trump | Republican)200 8
P = =
or 87.5%. b. If a voter who prefers Clinton in the poll is
selected randomly, what is the probability that they are not Republican? Write your answer as a percent.
Solution We are only considering the voters who prefer Clinton, so we start with the total of that category, 185+25+55 = 265. Then total the non-Republicans, 185+55=240. The likelihood of a non-Republican given that they preferred Trump is
240 48(Non-Republican | Prefer Clinton)265 53
P = =
or approximately 90.6%.
In a poll conducted in 2016, 500 registered voters were polled with regard to their presidential preference and their party affiliation. The results are listed in the table below.
Democrat Republican Other Party
Prefer Clinton 185 25 55
Prefer Trump 15 175 45
a. If a Democrat voter in the poll is selected
randomly, what is the likelihood that they will prefer Clinton? Write your answer as a percent.
b. If a voter who prefers Trump in the poll is
selected randomly, what is the probability that they are not a Democrat? Write your answer as a percent.

54
How is conditional probability computed?
Suppose we conduct a survey in which we ask the type of operating system their phone uses and gender. The results are shown below.
Male Female Total Android 247 251 498
iOS 1201 1601 2802 Total 1448 1852 3300
We defined the events follows:
M: Consumer is male
F: Consumer is female
A: Consumer owns an Android phone
I: Consumer owns an iOS phone
To find the conditional probability ( | )P I F , we recognized that we are not interested in all consumers in the survey, only the female consumers. A total of 1852 female consumers took the survey. Of those female consumers, 1601 owned a phone with the IOS operating system. The probability of a consumer owning an IOS phone given they are female is
1601( | )1852
P I F =
Let’s look at these numbers more closely. The denominator is the number of female consumers in the survey. The numerator corresponds to female consumers who own an iOS phone. In words, these are consumers who are female and own an iOS phone.
1601( | )1852
P I F =
If we divide the top and bottom of this fraction by the number of people who took the survey,
16013300( | ) 18523300
P I F =
we see that the top and the bottom are now relative frequencies and can be written as
Number of females and iOS phone owners
Number of females

55
( and )( | )
( )P I FP I F
P F=
In general, we can compute conditional probability with this relationship.
Conditional Probability
If A and B are events, the likelihood of A occurring given that B has occurred is
( ) ( )( ) and
|P A B
P A BP B
=
provided that ( ) 0P B ≠ .
Notes

56
Guided Example 11 Practice
Suppose a batch of batteries is produced at a factory. A sample of batteries coming off the production line are sampled. From this sample, 32% of the batteries are mislabeled and 42% provide inadequate current. Twenty percent of the batteries are mislabeled and provide inadequate current. a. What is the probability that a battery provides
inadequate current given that the battery is mislabeled?
Solution Start by defining the events in the problem:
M: Battery is mislabeled C: Battery provides inadequate current
We can match the probabilities given in problem with events:
( ) 0.32( ) 0.42( and ) 0.20
P MP CP C M
==
=
The question asks us to find the conditional probability ( | )P C M . This may be found using the formula
( and )( | )
( )P C MP C M
P M=
Substitute the probabilities given in the problem to get 0.20( | ) 0.625
0.32P C M = =
b. What is the probability the battery is
mislabeled given that the battery provides inadequate current?
Solution To find the probability ( | )P M C , apply the formula for conditional probability and substitute the values given in the problem:
A mathematically inclined auto mechanic determines that 35% of repairs involve dead batteries and 15% of repairs involve bad alternators. Five percent of repairs involve dead batteries and bad alternators. a. What is the probability that a repair involves a
dead battery given that the repair involves a bad alternator?
b. What is the probability the repair involves a
bad alternator given that the repair involves a dead battery?
57
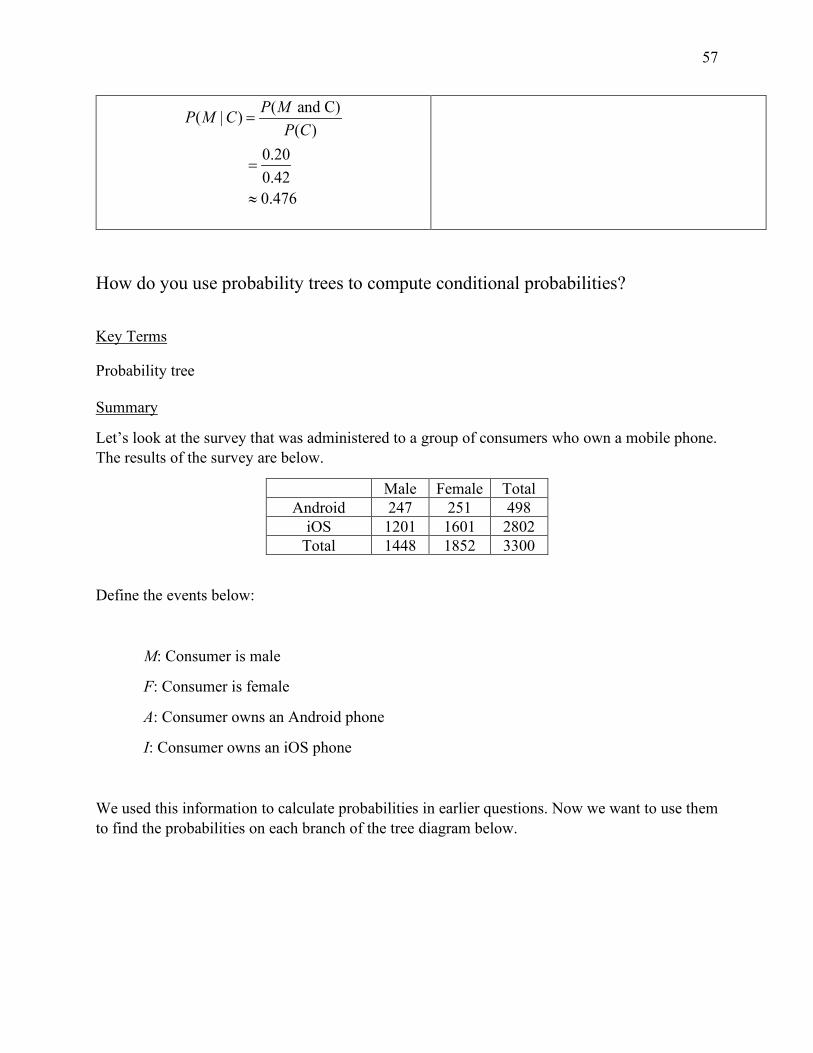
( and C)( | )( )
0.200.420.476
P MP M CP C
=
=
≈
How do you use probability trees to compute conditional probabilities?
Key Terms Probability tree Summary
Let’s look at the survey that was administered to a group of consumers who own a mobile phone. The results of the survey are below.
Male Female Total Android 247 251 498
iOS 1201 1601 2802 Total 1448 1852 3300
Define the events below:
M: Consumer is male
F: Consumer is female
A: Consumer owns an Android phone
I: Consumer owns an iOS phone
We used this information to calculate probabilities in earlier questions. Now we want to use them to find the probabilities on each branch of the tree diagram below.

58
In the tree diagram, we start on the left and work to the right. The branches are labeled with the probabilities below:
Examine the diagram carefully to note that the second level of the tree consists of conditional probabilities. In each case, the given part is where the branch originates and the probability we want is where the branch terminates.
To find the first set of probabilities, calculate the relative frequencies of males and females in the survey:
1448 1852( ) 0.439, ( ) 0.5613300 3300
P M P F= ≈ = ≈
Notice that the denominator is the total number of owners in the survey.
The conditional probabilities are found by taking into account the given condition that the consumer is male, or the consumer is female:
1201 247( | ) 0.829, ( | ) 0.1711448 14481601 251( | ) 0.864, ( | ) 0.1361852 1852
P I M P A M
P I F P A F
= ≈ = ≈
= ≈ = ≈
Male
iOS
Android
Female
iOS
Android
Male
iOS
Android
Female
iOS
Android
P(M)
P(F)
P (I | M)
P(A | M)
P( I | F)
P(A | F)

59
The denominators in each of these probabilities take into account the given condition. For instance, to find ( | )P I M we divide by the total number of males instead of the total number of phone users in the survey.
Label these probabilities on the tree diagram to give
The rule for computing conditional property can be interpreted different. In the last question, we
defined the conditional probability ( ) ( )( ) and
|P A B
P A BP B
= . If we multiply both side of this
equation by ( )P B , we get
( ) ( ) ( )| and P A B P B P A B=
We can also apply this strategy to the conditional probability ( ) ( )( ) and
|P B A
P B AP A
= to obtain
a similar expression,
( ) ( ) ( )| and P B A P A P B A=
These expressions give the joint probability of A and B as a product of a conditional probability and a marginal probability.
Product Rule for Probability
The probability of the event A and B is
( ) ( ) ( ) and |P A B P A B P B=
or
Male
iOS
Android
Female
iOS
Android
0.439
0.561
0.829
0.171
0.864
0.136

60
( ) ( ) ( ) and |P A B P B A P A=
We can utilize these relationships when we use a tree diagram. The probabilities on the right side of the second rule, ( ) ( ) ( ) and |P A B P B A P A= , lie along the branch connecting to A followed by B. This means we can find the probability of A and B by multiplying the probabilities that connect to A followed by B.
Product Rule for Tree Diagrams
The product of all probabilities along a branch on a tree diagram is the likelihood of all events occurring that are on the branch.
Notes
AB
C
P(A) P(B | A)

61
Guided Example 12
A survey is administered to a group of consumers who own a smartphone. The results of the survey are shown below.
Male Female Total Android 247 251 498
iOS 1201 1601 2802 Total 1448 1852 3300
Define the events below:
M: Consumer is male F: Consumer is female A: Consumer owns an Android phone I: Consumer owns an iOS phone
In an earlier example, we used these data and events to create the tree diagram below.
Compute the likelihood that a consumer is male and owns an iphone. Solution In terms of the events, we are being asked to find ( and )P M I . Apply the formula for finding intersections of events to give ( and ) ( | ) ( )P M I P I M P M= The probabilities on the right side are found along the branch through Male and iOS. Put these into the formula to yield ( and ) (0.829)(0.439) 0.364P M I = ≈
Male
iOS
Android
Female
iOS
Android
0.439
0.561
0.829
0.171
0.864
0.136
62
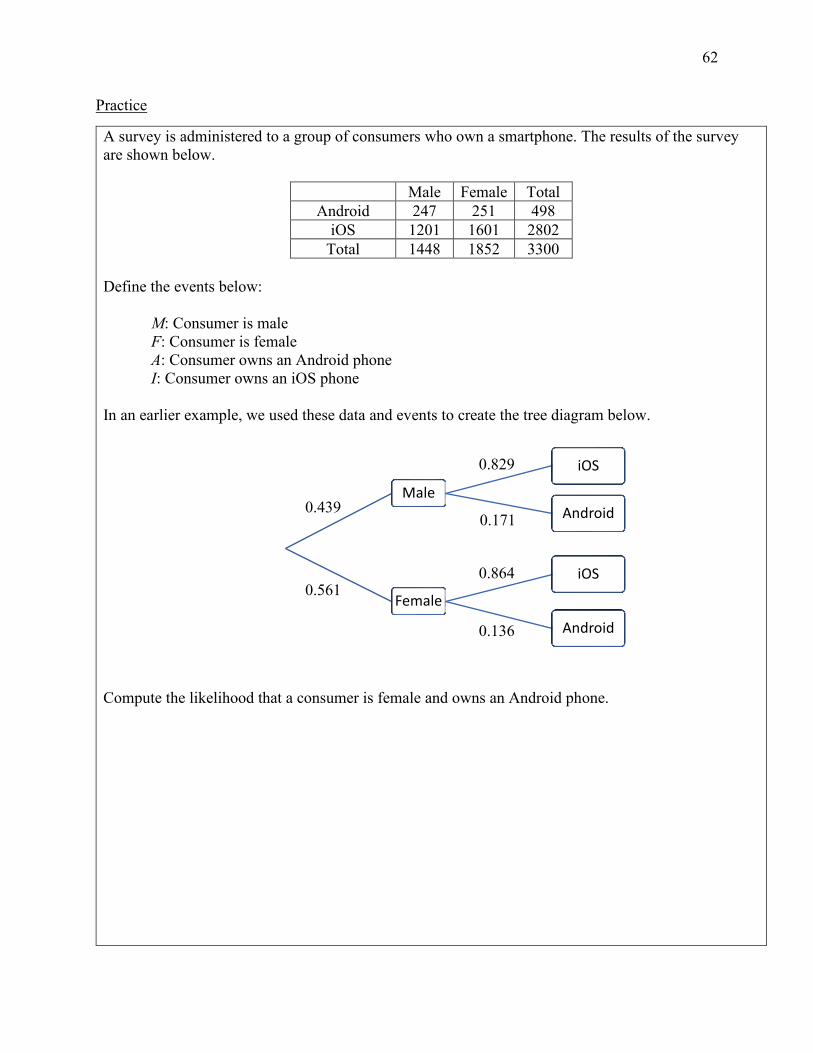
Practice
A survey is administered to a group of consumers who own a smartphone. The results of the survey are shown below.
Male Female Total Android 247 251 498
iOS 1201 1601 2802 Total 1448 1852 3300
Define the events below:
M: Consumer is male F: Consumer is female A: Consumer owns an Android phone I: Consumer owns an iOS phone
In an earlier example, we used these data and events to create the tree diagram below.
Compute the likelihood that a consumer is female and owns an Android phone.
Male
iOS
Android
Female
iOS
Android
0.439
0.561
0.829
0.171
0.864
0.136

63
Guided Example 13 Suppose you have a jar containing 10 red balls, 5 blue balls and 15 green balls. a. If two balls are selected from the jar without replacement, what is the probability that the first ball
is red, and the second ball is red? Solution We can find the probability that the first ball is red, and the second ball is red by labeling the appropriate branches of a tree diagram.
Since there are 30 balls in the jar and 10 of them are red,
10(first ball is red)30
P =
Once the first ball is selected, only 29 balls remain and nine of those balls are red. The probability that the second ball is red given that the first ball is red is
9(second ball is red | first ball is red)29
P =
We can now label the branch through first ball red and second ball red:
Red
Red
BlueGreen
BlueRedBlue
Green
GreenRedBlue
Green

64
Since the events we are interested in concern this branch only, there is no need to label any other branches. The probability that the first ball is red, and the second ball is red is the product of these probabilities,
10 9(first ball is red and second ball is red) 0.10330 29
P = ⋅ ≈
or about 10.3%. b. If two balls are selected from the jar without replacement, what is the probability of selecting a red ball and
a blue ball? Solution We could follow the strategy from the previous part and draw the tree diagram or we can simply visualize branches passing through red and blue balls. There are two such branches since the first ball could be red and the second ball blue or the first ball could be blue and the second ball red. In the first case, the first segment would be labeled
10(first ball is red)30
P =
Once the first ball is chosen, there are 29 balls remaining. Of those remaining 29 balls, 5 are blue telling us
5(second ball is blue | first ball is red)29
P =
The probability that the first ball is red, and the second ball is blue is the product of the probabilities along the branch,
Red
Red
BlueGreen
BlueRedBlue
Green
GreenRedBlue
Green
10(first ball is red)
30P =
9(second ball is red | first ball is red)
29P =

65
10 5(first ball is red and second ball is blue) 0.05730 29
P = ⋅ ≈
or about 5.7%. In the second case, the first segment would be labeled
5(first ball is blue)30
P =
Once the first ball is chosen, there are 29 balls remaining. Of those remaining 29 balls, 10 are red telling us
10(second ball is red | first ball is blue)29
P =
The probability that the first ball is blue, and the second ball is red is the product of the probabilities along the branch,
5 10(first ball is blue and second ball is red) 0.05730 29
P = ⋅ ≈
or about 5.7% Either one of these cases satisfies selecting a red and a blue ball so the total probability is the sum of these cases, 5.7% + 5.7% = 11.4%.
Practice Suppose you have a jar containing 10 red balls, 5 blue balls and 15 green balls. a. If two balls are selected from the jar without replacement, what is the probability that the first ball
is green, and the second ball is red?

66
b. If two balls are selected from the jar without replacement, what is the probability of selecting a green ball
and a red ball?

67
Guided Example 14
The probability of colorectal cancer can be given as 0.3%. If a person has colorectal cancer, the probability that the hemoccult test is positive is 50%. If a person does not have colorectal cancer, the probability that he still tests positive is 3%. What is the probability that a person has colorectal cancer and tests negative? Solution To solve this problem, we’ll draw and label an appropriate tree diagram. Look at the information given in the problem. If C is the event “person has colorectal cancer” , C’ is the event “person does not have colorectal cancer, + is the event “the hemoccult test is positive” and – is the event “the hemoccult test is negative”, we know that ( ) 0.003 ( | ) 0.5 ( | ' ) 0.03P C P C P C= + = + =
This suggests the following tree diagram: Knowing that the sum of an event and its compliment should add to 1, we can finish the tree diagram as follows:
C
C’
+
+
-
-
0.003
0.5
0.03
C
C’
+
+
-
-
0.003
0.5
0.03
0.997
0.5
0.97

68
The probability we are looking for is ( and -)P C . This probability is the product of the probabilities along the segments through C and -, ( and -) 0.003 0.5 0.0015P C = ⋅ = or 0.15%.
Practice
The probability of colorectal cancer can be given as .3%. If a person has colorectal cancer, the probability that the hemoccult test is positive is 50%. If a person does not have colorectal cancer, the probability that he still tests positive is 3%. What is the probability that a person does not have colorectal cancer and tests positive?
69
Section 2.5 Expected Value Key Terms Random variable Expected value Summary Let’s say Jay goes to Las Vegas and makes seven $1 bets at a roulette table. Here are the results of his gambling excursion:
–$1, –$1, –$1, $5, –1, –1, –1 If we let x equal the amount of money Jay wins, then we see that x can be –1 (when he loses the bet) or it can be 5 (it appears that when he wins, he ends up winning $5). x is called a random variable because it’s value depends on chance (sometimes it’s –1 and sometimes it’s 5). As we can see, he lost $1 six times and won $5 once. So, the average of seven bets is:
1 ( 1) ( 1) 5 ( 1) ( 1) ( 1) 1 $0.14
7 7x
n− + − + − + + − + − + − −
= = ≈ −∑
If Jay were to repeat this experiment repeatedly, he would expect to lose $0.14 each time he played roulette.
The expected value is the value you would “expect” to find if you could repeat the experiment an infinite number of time and take the average of the values obtained.
How do we calculate expected value of a random variable x?
1. Decide on exactly what x represents. Look for a value assigned to each outcome in the experiment.
2. Determine what the possible values of x are. These values are represented by 1 2, , , nx x x .
3. Determine the probability corresponding to each x. The values are represented by 1 2, , , np p p . Note: All the probabilities should add up to one.
4. The expected value of the random variable is calculated by multiplying the value of each outcome times the corresponding probability and then adding the results:
1 1 2 2 n nE x p x p x p= + + +
• How do you compute the expected value to predict the long-term results of repeating an experiment?
• How do you calculate the expected value of lotteries and games of chance?

70
Notes Guided Example 1 Practice
Below are the probabilities and values associated with four outcomes of an experiment.
Outcome Value Probability A 5 0.2 B 3 0.3 C 2 0.4 D -5 0.1
Find the expected value of the experiment. Solution We start by multiplying the probability by the value.
5 0.2 1.03 0.3 0.92 0.4 0.85 0.1 0.5
⋅ =⋅ =⋅ =
− ⋅ = −
The expected value is the sum of these products, 1.0 0.9 0.8 ( 0.5) 2.2E = + + + − =
Below are the probabilities and values associated with five outcomes of an experiment.
Outcome Value Probability A 1000 0.01 B 2 0.2 C 3 0.15 D 5 0.1 E -2 0.54
Find the expected value of the experiment.
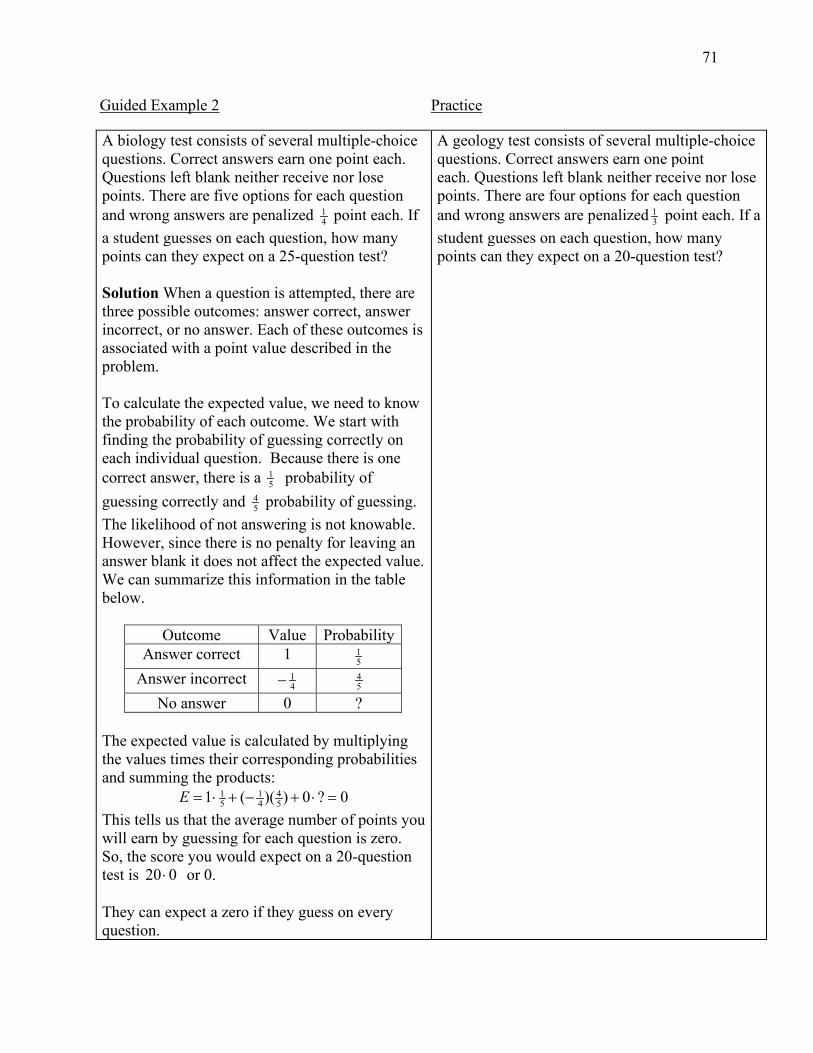
71
Guided Example 2 Practice A biology test consists of several multiple-choice questions. Correct answers earn one point each. Questions left blank neither receive nor lose points. There are five options for each question and wrong answers are penalized 1
4 point each. If a student guesses on each question, how many points can they expect on a 25-question test? Solution When a question is attempted, there are three possible outcomes: answer correct, answer incorrect, or no answer. Each of these outcomes is associated with a point value described in the problem. To calculate the expected value, we need to know the probability of each outcome. We start with finding the probability of guessing correctly on each individual question. Because there is one correct answer, there is a 1
5 probability of guessing correctly and 4
5 probability of guessing. The likelihood of not answering is not knowable. However, since there is no penalty for leaving an answer blank it does not affect the expected value. We can summarize this information in the table below.
Outcome Value Probability Answer correct 1 1
5 Answer incorrect 1
4− 45
No answer 0 ? The expected value is calculated by multiplying the values times their corresponding probabilities and summing the products: 1 1 4
5 4 51 ( )( ) 0 ? 0E = ⋅ + − + ⋅ = This tells us that the average number of points you will earn by guessing for each question is zero. So, the score you would expect on a 20-question test is 20 0⋅ or 0. They can expect a zero if they guess on every question.
A geology test consists of several multiple-choice questions. Correct answers earn one point each. Questions left blank neither receive nor lose points. There are four options for each question and wrong answers are penalized 1
3 point each. If a student guesses on each question, how many points can they expect on a 20-question test?

72
How do you calculate the expected value of lotteries and games of chance?
Key Terms Fair game Summary The expected value is the value you would “expect” to find if you could repeat the experiment an infinite number of times and take the average of the values obtained. When we play a game with a set of outcomes, the values assigned to those outcomes may be amounts of money that you might win or lose when the game is played. The amounts may be positive if you will have a net gain or negative if you have a net loss. If the expected value of the game is 0, the game is called a fair game.
Games that are not fair may be made fair by modifying the bet that is wagered to play the game. For instance, suppose you pay a dollar to play a game that has an expected value of -0.25. This means you will lose 0.25 on average each time you play the game. If you adjust the bet down by 0.25 to 0.75, the game will become fair (and have an expected value of 0).
Notes

73
Guided Example 3 Practice Suppose you pay $5 to play a game in which a pair of fair dice is rolled.
• If doubles (same number on each die)
comes up, then you win $10. • If an odd total comes up, then you win $6. • For all other rolls you lose the amount you
paid to play the game. a. Find the expected value of the game. Solution Let’s describe the outcomes and values of the game. Make sure the values include the bet by making the value the “net” amount.
Outcome Value Probability Doubles $5 Odd total $1
All other rolls $-5 For instance, even though you win $10 for getting doubles, you net $5 since you bet $5 to play the game. To determine the probability of each outcome, consult a table of possible dice rolls and their corresponding sums.
1 2 3 4 5 6 1 2 3 4 5 6 7 2 3 4 5 6 7 8 3 4 5 6 7 8 9 4 5 6 7 8 9 10 5 6 7 8 9 10 11 6 7 8 9 10 11 12
Of the 36 possible rolls, six of them are doubles, eighteen are odd totals, and the other twelve are something else. We can finish our table with the corresponding probabilities.
Suppose you pay $1 to play a game in which a pair of fair dice is rolled.
• If a total of 7 or 11 comes up, then you
win $5. • If a total of 12 comes up, then you win
$10. • For all other totals you lose the amount
you paid to play the game. a. Find the expected value of the game.

74
Outcome Value Probability Doubles $5 6
36 Odd total $1 18
36 All other rolls $-5 12
36 Multiply the values times the corresponding probabilities and add the results to get the expected value,
6 18 12 125 1 ( 5)36 36 36 36
E = ⋅ + ⋅ + − ⋅ = −
or approximately$-0.33. This means you will lose 0.33 dollars each time you play the game. b. If the game is not fair, what should you pay to
make the game fair? Solution Since the expected value is not 0, the game is not fair. To make it fair, you need to pay 0.33 dollars less to play it. So, a bet of $5 – 0.33 or about $4.67 would make the game fair.
b. If the game is not fair, what should you pay to
make the game fair?

75
Guided Example 4 Practice One hundred tickets are sold at $2 apiece for a raffle. There is a grand prize of $50, two second place prizes of $20, and four third place prizes of $10. a. Calculate the expected value of the lottery. Solution Construct a table of outcomes, values and probabilities for the lottery.
The probabilities are based on the total number of tickets available and the number of winning tickets in each outcome. The expected value is
1 2 4 98 8048 18 8 ( 2)100 100 100 100 100
E = ⋅ + ⋅ + ⋅ + − ⋅ = −
On average, you will lose 80 cents on each lottery ticket. b. If the game is not fair, determine a price for a
ticket that would make it fair. Solution To make the ticket fair, you must lower the price by 80 cents. This would make the cost of the ticket $2 - $0.80 or $1.20.
Outcome Value Probability Grand Prize $48 1
100 Second Prize $18 2
100 Third Prize $8 4
100 Lose $-2 93
100
One thousand tickets are sold at $5 apiece for a raffle. There is a grand prize of $2000, two prizes of $1000, and four prizes of $100. a. Calculate the expected value of the lottery. b. If the game is not fair, determine a price for a
ticket that would make it fair.

76
Chapter 2 Practice Solutions Section 2.1
1. a. 926 , b.
15 , c.
310
2. a. {prefer Coke, prefer Pepsi. Prefer other}, b. 13 , c.
310
3. approximately 0.54 or 54% 4. {ABC, ABD, ACD, BCD, BAC, ADB, ADC, BDC, ACB, BAD, DAC, CDB, BCA, BDA,
DCA, CBD, CBA, DAB, CAD, DBC, CAB, DBA, CDA, DCB} 5. {(1, 6), (6, 1), (2, 5), (5, 2), (4, 3), (3,4)} 6. a. 52, b, {K♥, Q♥, J♥, K♦, Q♦, J♦, K♣, Q♣, J♣, K♠, Q♠, J♠}, c. approximately 0.23 or 23% 7. a. {ACB, CAB, CBA}, b. 0.5, c. approximately 67% 8. a.
C C C CC CC N CN CN
b. 0.5, c. 0.5, d. 0
9. approximately 0.54 or 54%, b. 2524 or 25:24
10. approximately 0.024 or 2.4% Section 2.2 1.
3 ways to get 1 head
2. 120 3. 120 4. 144 5. 12 6. 116,280
H
HH
T
TH
T
T
HH
T
TH
T

77
7. 512 8. 136,080 9. 1,048,576 10. Approximately 7.836 × 10¹⁰ 11. a. 720, b. 72, 72 Section 2.3 1. a. 120, b. approximately 2.432 ×10¹⁸, c. 6642 2. a. 360, b. 10 3. a. 24, b. 12 4. 4 5. 336 6. 24,928,800 7. 9,579,766,560 8. a. 24, b. 720, c. 10, d. 336, e. 120 Section 2.4 1. 47 2. Approximately 0.97 or 97% 3. Approximately 0.97 or 97% 4. Approximately 0.87 or 87% 5. 0.55 6. 0.55 7. 0.25 8. a. Approximately 0.25 or 25%, b. Approximately 0.55 or 55%, c. Approximately 0.25 or
25%, d. Approximately 0.67 or 67% 9. a. Approximately 0.139 or 13.9%, b. Approximately 0.278 or 27.8% 10. a. 0.925 or 92.5%, b. Approximately 0.94 or 94% 11. a. Approximately 0.33 or 33%, b. Approximately 0.14 or 14% 12. Approximately 0.076 or 7.6% 13. Approximately 0.172 or 17.2% 14. Approximately 0.03 or 3% Section 2.5 1. 10.27 2. 0 points 3. a. Approximately $0.39, b. Approximately $1.39 4. a. $-0.6, b. $4.40