Embed Size (px)
Citation preview

Section 1 - Microeconomics

- 2 -
© Tutor2u Limited 2008 www.tutor2u.net
Table of Contents 1. Economic Resources ....................................................................................................................................... 3 2. Scarcity and Choice in Resource Allocation ........................................................................................... 10 3. The Production Possibility Frontier ........................................................................................................... 16 4. Specialisation and Trade .......................................................................................................................... 21 5. Positive and Normative Statements ........................................................................................................ 25 6. Markets: The Theory of Demand ............................................................................................................. 26 7. Markets: The Theory of Supply ............................................................................................................... 34 8. Market Equilibrium Price ........................................................................................................................... 39 9. Price Elasticity of Demand ........................................................................................................................ 45 10. Price Elasticity of Supply ...................................................................................................................... 51 11. Income Elasticity of Demand ................................................................................................................ 54 12. Cross Price Elasticity of Demand ......................................................................................................... 58 13. The Functions of the Price Mechanism................................................................................................. 61 14. Price volatility in markets ..................................................................................................................... 65 15. Inter-relationships between Markets .................................................................................................. 70 16. Consumer Surplus ................................................................................................................................... 74 17. Producer Surplus .................................................................................................................................... 77 18. The Market for Oil ................................................................................................................................. 79 19. The Market for Copper ........................................................................................................................ 86 20. The Market for Rhodium ....................................................................................................................... 89 21. The Market for Coffee ......................................................................................................................... 91 22. Production and Costs ............................................................................................................................. 95 23. Economies and Diseconomies of Scale ............................................................................................... 99 24. Productivity ........................................................................................................................................... 103 25. Economic Efficiency .............................................................................................................................. 106 26. Market Failure ...................................................................................................................................... 109 27. Competition and Monopoly in Markets ........................................................................................... 110 28. Negative Externalities ......................................................................................................................... 119 29. Positive Externalities ............................................................................................................................ 125 30. Government intervention and externalities ..................................................................................... 128 31. Public Goods and Private Goods ..................................................................................................... 133 32. Merit Goods .......................................................................................................................................... 139 33. Demerit goods ...................................................................................................................................... 143 34. Factor Immobility .................................................................................................................................. 147 35. Imperfect Information .......................................................................................................................... 148 36. Poverty and Inequality in Resource Allocation ............................................................................... 151 37. Government Intervention in the Market ........................................................................................... 155 38. Indirect Taxation .................................................................................................................................. 158 39. Producer Subsidies .............................................................................................................................. 162 40. Maximum Prices ................................................................................................................................... 165 41. Minimum Prices ..................................................................................................................................... 168 42. Buffer Stock Schemes .......................................................................................................................... 172 43. Government Failure ............................................................................................................................. 176 44. Economics of Health Care .................................................................................................................. 181 45. Exam Technique .................................................................................................................................... 187

- 3 -
© Tutor2u Limited 2008 www.tutor2u.net
1. Economic Resources Microeconomics is the study of the behaviour and decisions of individuals and businesses in markets across the economy. We start our study of microeconomics by looking at the resources which an economy may have available to supply and produce goods and services to meet the ever-changing needs and wants of individuals and society as a whole. In economics we classify goods as “tangible” products, examples might include food and drink, cars, digital televisions, flat-screen televisions, energy products and cricket bats! Services are sometimes known as ‘intangibles’, education and health-care are two important services and tourism, business consultancy, cleaning and home insurance are all examples of services. Finite resources There are only a finite (or limited) number of workers, machines, acres of land and reserves of oil and other natural resources on the earth. Because most of our resources are finite, we cannot produce an unlimited number of different goods and services and by producing more for an ever-increasing population we are in real danger of destroying the natural resources of the planet. Our ever-rising ecological footprint has important consequences for the long-term sustainability of economies throughout the world and potentially huge implications for our living standards and the quality of life.
Tuna reaches the quayside and will soon be supplied to the market – but over-fishing may have destroyed fish stocks and risks the whole future of the tuna fishing industry in the European Union
Tuna at risk of extinction Bluefin tuna are at risk of extinction in the Mediterranean and eastern Atlantic according to a report from the Worldwide Fund for Nature. They lay the blame on fishermen who have caught more than the quotas allowed under current European Union rules. Over-fishing has led to a reduction in stocks of tuna and average catch sizes are declining. The WWF has called for an immediate halt to bluefin tuna fishing arguing that failure to act now will lead to the complete destruction of what should be a renewable resource.
Source: Worldwide Fund for Nature and BBC news reports

- 4 -
© Tutor2u Limited 2008 www.tutor2u.net
Global ecosystems 'face collapse' Current global consumption levels could result in a large-scale ecosystem collapse by the middle of the century, environmental group WWF has warned. The group's biannual Living Planet Report said the natural world was being degraded "at a rate unprecedented in human history". Terrestrial species had declined by 31% between 1970-2003 the findings showed. It warned that if demand continued at the current rate, two planets would be needed to meet global demand by 2050.The biodiversity loss was a result of resources being consumed faster than the planet could replace them, the authors said.
Source: BBC news online, October 2006 Environmental pressure groups such as Friends of the Earth and Greenpeace seek to highlight the permanent damage to the stock of natural resources available throughout the world and the dangers from economic development and global warming. Water scarcity One such issue is the huge threat posed by the global shortage of water as the world’s demand for water for household and commercial use continues to grow each year. Global water consumption rose six-fold between 1900 and 1995 - more than double the rate of population growth - and goes on growing as farming, industry and domestic demand all increase. Is water becoming the new oil? At the heart of improving resource sustainability is the idea of de-coupling – a process of trying to increase the efficiency with which resources are used in producing goods and services and breaking the link between ever-increasing demand and resource depletion. For more on the pressures facing the global environment see this special BBC online report – Planet under Pressure Factors of production Factors of production refer to the resources we have available to produce different goods and services. We can make a distinction between physical and human resources. Land Land includes all of the natural physical resources – for example the ability to exploit fertile farm land, the benefits from a temperate climate or the ability to harness wind power and solar power and other forms of renewable energy. Some nations are richly endowed with natural resources and then specialise in the extraction and production of these resources – for example – the development of the North Sea oil and gas in Britain and Norway or the high productivity of the vast expanse of farm land in Canada and the United States and the oil sands in Alberta, Canada. Other countries have a smaller natural factor endowment and may be more reliant on importing these resources. Labour Labour is the human input into the production process. It is inevitable that some workers are more productive than others because of the education, training and work experience they have received. What matters is both the size and quality of the workforce. An increase in the size and the quality of the labour force is vital if a country wants to achieve sustained economic growth. In recent years the issue of the migration of labour has become important. Can migrant workers help to solve some of the labour shortages that many countries experience? And what are the long-term effects on the countries who suffer a drain or loss of workers through migration? Capital

- 5 -
© Tutor2u Limited 2008 www.tutor2u.net
In economics the term capital means investment in capital goods that can then be used to produce other consumer goods and services in the future.
• Fixed capital includes machinery, plant and equipment, new technology, factories and other buildings.
• Working capital refers to stocks of finished and semi-finished goods (or components) that will
be either consumed in the near future or will be made into finished consumer goods.
The global oil and gas industry is a good example of an industry which uses a huge amount of capital equipment
to get the product – crude oil – to the refineries and processing stages. Capital inputs and productivity New items of capital machinery, buildings or technology are generally used to enhance the productivity of labour. For example, improved technology in farming has vastly increased productivity and allowed millions of people to move from working on the land into more valuable jobs in other parts of the economy. Infrastructure Infrastructure is defined as the stock of capital used to support the entire economic system. Examples of infrastructure include road & rail networks; airports & docks; telecommunications eg cables and satellites to enable web access. The World Bank regards infrastructure as an essential pillar for economic growth in developing countries. The fast-growing Indian economy is often cited as a country whose growth prospects are being limited by weaknesses in national infrastructure.

- 6 -
© Tutor2u Limited 2008 www.tutor2u.net
The Gatwick Express – the railway infrastructure is an essential part of our transport network Entrepreneurship An entrepreneur is an individual who seeks to supply products to a market for a rate of return (i.e. to make a profit). Entrepreneurs will usually invest their own financial capital in a business (for example their savings) and take on the risks associated with a business investment. The reward to this risk-taking is the profit made from running the business. Many economists agree that entrepreneurs are in fact a specialised part of the factor input 'labour'. Renewable and Finite Resources Renewable resources are commodities such as solar energy, oxygen, biomass, fish stocks or forestry that is inexhaustible or replaceable over time by new growth providing that the rate of extraction of the resource is less than the natural rate at which the resource renews itself. This is becoming an important issue in environmental economics, for example the issue of the over-extraction of fish stocks, and the global risks of permanent water shortages resulting from rising use of ground water stocks. Finite resources cannot be renewed. For example with plastics, crude oil, coal, natural gas and other items produced from fossil fuels, no mechanisms exist to replenish them. Factor Rewards Factors of production are used to create output to be sold in markets. Each factor used in production can expect some reward.

- 7 -
© Tutor2u Limited 2008 www.tutor2u.net
Record profits announced by JCB The digger-maker JCB has announced pre-tax profits of £149m for 2006, its best ever figures. The Staffordshire-based business also set new records for turnover, machine sales and global market share. Turnover rose to £1.75bn - up from £1.42bn in 2005. JCB has benefited from growth in the global construction equipment market. The privately-owned company was founded in 1945 and now has manufacturing bases in the UK, US, Brazil, Germany, India and China. Water firms boost profit streams UK utilities Severn Trent and Northumbrian Water have both reported an increase in annual profits. Severn Trent said its pre-tax profit rose 9.5% to £252m in the 12 months to 31 March from a year earlier after it restructured its business. Northumbrian Water said that its profits climbed by 13.4% to £147.8m during the same 12-month period. Water companies have to invest heavily to improve their infrastructure and cut leakages from their pipes. Severn Trent said it would pay an annual dividend of 61.45 pence, up 7.8% from its previous figure. Northumbrian Water said its total dividend payment would rise by 6.7% to 11.27p. Income
Source: Adapted from BBC news online, June 2007 Income represents a flow of earnings from using factors of production to produce an output of goods and services which are then sold in markets. The main sources of income for individuals and households are:
1. Wages and salaries from work often supplemented by overtime and productivity bonuses.
2. Interest from savings held in banks, building societies and other accounts.
3. Dividends from share ownership.
4. Rent income from the ownership of property. For the majority of people, most of their weekly or monthly income comes from their job. The government can also affect people’s disposable (or “post-tax”) income by taxing incomes and by giving welfare benefits to households on low incomes or to people who are out of work. Wealth Wealth is defined as a stock of assets that, in turn, creates a flow of income and wealth can be held in a variety of forms by individuals, firms and also the nation as a whole:
o Financial wealth – examples include stocks and shares, bonds, savings in bank and building society accounts and contributions to pension schemes.
o Marketable wealth – this includes consumer durables that can be sold for a price e.g. rare antiques and fine wines.
o Social capital – an important part of our national wealth including social infrastructure such as transport systems, schools and hospitals.
It is important to distinguish between income and wealth. For example, if you receive a higher wage or salary from your job, this adds to your monthly income and if this is saved in a bank, or by making contributions to a pension fund then you are adding to your financial wealth. Being wealthy can also generate income for if you own shares in companies listed on the stock market then you expect to receive dividend income once or twice a year. And if you have money in a savings account, you will be paid interest on your savings balances. Likewise, if you own properties, then you can earn some income from renting it out to tenants. There has been a huge expansion in recent years in the buy-to-let sector of the housing market with hundreds of thousands of people buying properties and then letting them out.

- 8 -
© Tutor2u Limited 2008 www.tutor2u.net
The value of financial wealth can fluctuate over time. In the UK in recent years we have seen a boom in the UK housing market leading to sharp rises in average house prices, particularly in London and the South East. The result has been a jump in housing wealth for people with mortgages, but a growing problem of housing affordability for people looking to enter the housing market for the first time on relatively low incomes. Share prices have also been volatile with a collapse in prices from 2000-2003 and then a substantial recovery in the stock market over the last four years.
FTSE 100 index (bottom pane) Average UK house price (top pane)FTSE-100 Index and UK House Prices
Source: Reuters EcoWin
90 91 92 93 94 95 96 97 98 99 00 01 02 03 04 05 06 07
1000
2000
3000
4000
5000
6000
7000
Inde
x
1000
2000
3000
4000
5000
6000
7000
FTSE 100
50000
75000
100000
125000
150000
175000
200000
£s
50000
75000
100000
125000
150000
175000
200000
House Prices
Inequality in the distribution of income and wealth Factor incomes are rarely if ever distributed equitably in any country. It is a fact of life that the distribution of income and wealth in the UK and in many other countries is highly unequal and there is a huge gap between the richest and poorest households. For example, the latest data shows that 94% of the total wealth in this country is held by 50% of the population. Put another way, the other half of our population can lay claim to only 6% of total wealth. In 2006 the United Nations reported that the World's richest 1% own 40% of all wealth. Millions of people must rely on relatively low incomes with little opportunity to accumulate wealth. Is this fair? What are the consequences of a high level of inequality? Should the government intervene to change the distribution of income? And what might be some of the effects of such policies? Income of the richest UK families is sixteen times that of the poorest The extent of income inequality in Britain is shown by new data from the Office for National Statistics. In 2005, the average gross (pre-tax) income of the richest 20% of families in Britain was £66,300, more than 16 times that of the poorest 20% who earned £4,300 on average. After adjusting for taxes and welfare benefits such as income support and the state pension, however, this ratio fell to four-to-one. For direct taxes, the top fifth of households pay 25% of their gross income in direct taxes such as income tax while for the poorest households the figure is 10%. Levels of inequality are little changed from the years of the Thatcher government (1979-1990).
Source: Adapted from the ONS and the Guardian, June 2006

- 9 -
© Tutor2u Limited 2008 www.tutor2u.net
Chief Executives enjoy pay many times that of their employees There has been a staggering increase in the average pay of FTSE100 chief executives - which has risen by 40 per cent in the past year to nearly £3m. In a survey of the available annual accounts of 87 companies published by pay experts Income Data Services, the average total remuneration of a FTSE100 chief executive ("CEO") has risen to £2,864,282. The figure includes salary, bonuses, share options and other long-term incentive plans that have become payable during the year. However, that average excludes valuable pension contributions, which would raise the average total remuneration to more than £3m if included. With the average UK salary now approximately £22,500, FTSE100 chief executives take home the pay of 127 workers.
Source: Adapted from an article in the Daily Telegraph, September 2006
Labour and Wages Most people have the ability to do some form of work. If they are of working age and actively seeking a job then they are included in the working population. In industries and jobs where labour is not particularly scarce, wages tend to be lower. Millions of workers in the UK are paid hourly wages well below the national average. The minimum wage (which rises to £5.52 in October 2007) seeks to address some of the problems associated with low pay. On the other hand, some people have skills that are rare, and these people will command high salaries in the labour market. Capital and Interest Businesses often need to borrow money to fund capital investment. The reward for investing money is called interest. Interest rates can of course go up or down. If the interest rate is high, it becomes less worthwhile to borrow money because any project will have to make more money than before to be profitable since more interest is now being paid. Enterprise and Profit In return for having innovative business ideas and taking the risk in putting funds into a business the entrepreneur takes any money that the business has left after the other factors of production have received their rewards. This is called gross profit. Taxes then have to be paid to the government, and the entrepreneur takes what is left. This after-tax profit is called net profit. Economists often assume that one of the main objectives of a business is to achieve maximum profits. But this is not always the case! Some businesses are looking to achieve a rising market share and increasing market share might mean having to sacrifice some profits in the short run by cutting prices and under-cutting rival suppliers in the market. There is also a growing interest in the concept of ethical businesses, not for profit businesses and corporate social responsibility where the traditional assumption of firms driven solely by the profit motive is being challenged and where businesses are encouraged to take account of their economic, social and environmental impacts. The rise of consumer power in influencing the decisions of businesses is part of this trend.

- 10 -
© Tutor2u Limited 2008 www.tutor2u.net
Summary on factors of production and factor rewards Factor Description Reward
Land all natural resources (gifts of nature) including fields, mineral wealth, and fishing stocks
The reward for landlords for allowing firms to use their property is rent
Labour The physical and mental work of people whether by hand, by brain, skilled or unskilled
The reward for workers giving up time to help create products is wages or salaries
Capital Man made goods used to produce more goods including factories (plant), machines and roads.
The reward for creditors lending money to firms to invest in buildings and capital equipment is interest
Enterprise An entrepreneur risks financial capital and organises land labour & capital to produce output in the hope of profit
The reward for individuals risking funds and offering products for sale is profit. Unsuccessful firms make losses.
Source: adapted from Richard Young, “Markets Question and Answer”, Tutor2u
2. Scarcity and Choice in Resource Allocation In this chapter we consider the nature of economics and the choices that all economic agents, be they consumers, businesses and different levels of government must make every day. The Economist's Dictionary of Economics defines economics as
"The study of the production, distribution and consumption of wealth in human society" Another definition of the subject comes from the economist Lionel Robbins, who said in 1935 that
"Economics is a social science that studies human behaviour as a relationship between ends and scarce means which have alternative uses. That is, economics is the study of the trade-offs involved when choosing between alternate sets of decisions."
The purpose of economic activity It is often said that the central purpose of economic activity is the production of goods and services to satisfy consumer’s needs and wants i.e. to meet people’s need for consumption both as a means of survival but also to meet their ever-growing demand for an improved lifestyle or standard of living. The basic economic problem is about scarcity and choice since there are only a limited amount of resources available to produce the unlimited amount of goods and services we desire. All societies face the problem of having to decide:
(i) What goods and services to produce: Does the economy uses its resources to operate more hospitals or hotels? Do we make iPods or produce more coffee? Does the National Health Service provide free IVF treatment for
Road space throughout the world is becoming increasingly scarce as the demand for motor transport increases each year – what do you think are some of the best solutions to reducing the problem of congestion on our roads?

- 11 -
© Tutor2u Limited 2008 www.tutor2u.net
thousands of childless couples? Or, do we choose to allocate millions of pounds each year to providing beta-interferon to sufferers of multiple sclerosis?
(ii) How best to produce goods and services: What is the best use of our scarce resources of land labour and capital? Should school playing fields be sold off to provide more land for affordable housing? Or are we contributing to the problem of obesity by selling off these playing fields?
(iii) Who is to receive goods and services: What is the best method of distributing products to ensure the highest level of wants and needs are met? Who will get expensive hospital treatment - and who not? Should there be a minimum wage? If so, at what level should it be set?
Scarcity Water, water everywhere We use an average of 158 litres of water a day in Britain, for which we pay a price of 28p per litre — but much of it is just cash down the drain, according to water companies. Most are campaigning to cut the amount we use. And the front-line weapon in their campaign is the water meter. They want us all to have one and one company is seeking powers to make them compulsory. When a meter is installed, in most homes, consumption drops by 20 per cent and, in some, it goes down by a third. According to Ofwat, the water industry regulator, the average water and sewerage bill for homes with a meter is £248 compared with £289 for those with flat-rate bills. At present only 25 per cent of households have meters and most of those are in East Anglia. They are installed free by water companies but households then have about £43 added to each bill to cover the cost of installing and reading the meter. Unsurprisingly, we use more water in summer. Peak demand on hot days can be 50 to 70 per cent above average. Most of this is for lawns, flowers, paddling pools and extra showers and baths.
Source: Adapted from an article by Valerie Elliott, the Times, 9 July 2005
If something is scarce - it will have a market value. If the supply of a good or service is low, the market price will rise, providing there is sufficient demand from consumers. Goods and services that are in plentiful supply will have a lower market value because supply can easily meet the demand from consumers. Whenever there is excess supply in a market, we expect to see prices falling. For example, the prices of new cars in the UK have been falling for several years and there have been huge falls in the prices of clothing as supply from countries such as China and Vietnam has surged. Insatiable human wants and needs
The Swedish furniture giant IKEA sells to millions of consumers throughout the world

- 12 -
© Tutor2u Limited 2008 www.tutor2u.net
Human beings want better food; housing; transport, education and health services. They demand the latest digital technology, more meals out at restaurants, more frequent overseas travel, more leisure time, better cars, cheaper food and a wider range of cosmetic health care treatments. Opinion polls consistently show that the majority of the electorate expect government policies to deliver improvements in the standard of education, the National Health Service and our transport system. (Whether voters are really prepared to pay for these services through higher taxes is of course another question!) Economic resources are limited, but human needs and wants are infinite. Indeed the development of society can be described as the uncovering of new wants and needs - which producers attempt to supply by using the available factors of production. For a perspective on the achievements of countries in meeting people’s basic needs, the Human Development Index produced annually by the United Nations is worth reading. Data for each country can be accessed and cross-country comparisons can be made. Making choices
Because of scarcity, choices have to be made on a daily basis by all consumers, firms and governments. For a moment, just have a think about the hundreds of millions of decisions that are made by people in your own country every single day. Consider the choices that people make in the city of London about how to get to work. Over six million people travel into London each day, they have to make choices about when to travel, whether to use the bus, the tube, to walk or cycle – or indeed whether to work from home. Millions of decisions are being taken, many of them are habitual (we choose the same path each time) – but somehow on most days, people get to work on time and they get home too! This is a remarkable achievement, and for it to happen, our economy must provide the resources and the options for it to happen.
Trade-offs when making choices Making a choice made normally involves a trade-off - in simple terms, choosing more of one thing means giving up something else in exchange. Because our wants are unlimited but resources are finite, choice is an unavoidable issue in economics. For example:
1. Housing: Choices about whether to rent or buy a home – a huge decision to make and one full of uncertainty given the recent volatility in the British housing market! There are costs and benefits to renting a property or in choosing to buy a home with a mortgage. Both decisions involve a degree of risk. People have to weigh up the costs and benefits of the decision.
2. Working: Many decisions have to be made here, for example, choosing between full-time or part-time work, or to take a course in higher education lasting three years. How have these choices and commitments been affected by the introduction of university tuition fees?
3. Transport and travel: The choice between using Euro-Tunnel, a speedy low-cost ferry or an
airline when travelling to Western Europe. Your choices about which modes of transport to use to get to and from work or school each day.

- 13 -
© Tutor2u Limited 2008 www.tutor2u.net
Elementary cost-benefit analysis In many of these decisions, people consider the costs and benefits of their actions – economists make use of the ‘marginal’ idea, for example what are the costs of consuming a little extra of a product and what are the costs. People are often likely to go ahead with a purchase if they estimate that the marginal benefits are greater than the marginal costs. Consumer welfare and rationality What makes people happy? Why despite several decades of rising living standards do surveys of happiness suggest that people are not noticeably happier than previous generations? When we study the decisions of consumers in different markets, we can start to consider and explore what their aims are. Our working assumption for the moment is that consumers make choices about what to consume based on the aim of maximising their own welfare. They have a limited income (i.e. a budget) and they seek to allocate their money in a way that improves their standard of living. Of course in reality consumers rarely behave in a perfectly informed and rational way. We will see later that often decisions by people are based on imperfect or incomplete information which can lead to a loss of satisfaction and welfare not only for people themselves but which affect other and our society as a whole. As consumers we have all made poor choices about which products to buy. Do we always learn from our mistakes? To what extent are our individual choices influenced and distorted by the effects of persuasive advertising? Multinational companies have advertising and marketing budgets that often run into hundreds of millions of pounds. We are all influenced by them to a lesser or greater degree and there is always the risk that advertising can be misleading. Economic Systems An economic system is best described as a network of organisations used by a society to resolve the basic problem of what, how much, how and for whom to produce. There are four categories of economic system.
1. Traditional economy: Where decisions about what, how and for whom to produce are based on custom and tradition. Land is typically held in common i.e. private property is not well defined. This BBC news article looks at the traditional economy of Vanuatu.
2. Free market economy: Where households own resources and free markets allocate resources through the workings of the price mechanism. An increase in demand raises price and encourages firms to switch additional resources into the production of that good or service. The amount of products consumed by households depends on their income and household income depends on the market value of an individual’s work.
In a free market economy there is a limited role for the government. Indeed in a highly free market system, the government limits itself to protecting the property rights of people and businesses using the legal system, and it also seeks to protect the value of money or the value of a currency.
3. Planned or command economy: In a planned or command system typically associated with a socialist or communist economic system, scarce resources are owned by the state (i.e. the government). The state allocates resources, and sets production targets and growth rates according to its own view of people's wants. The final income and wealth distribution is decided by the state. In such a system, market prices play little or no part in informing resource allocation decisions and queuing rations scarce goods.
- 14 -
© Tutor2u Limited 2008 www.tutor2u.net
4. Mixed economy: In a mixed economy, some resources are owned by the public sector (government) and some resources are owned by the private sector. The public sector typically supplies public, quasi-public and merit goods and intervenes in markets to correct perceived market failure. We will come back to all of these concepts later on in our study of microeconomics.
Opportunity Cost There is a well known saying in economics that “there is no such thing as a free lunch!” Even if we are not asked to pay a price for consuming a good or a service, scarce resources are used up in the production of it and there must be an opportunity cost involved. Opportunity cost measures the cost of any choice in terms of the next best alternative foregone. Many examples exist for individuals, firms and the government.
• Work-leisure choices: The opportunity cost of deciding not to work an extra ten hours a week is the lost wages foregone. If you are being paid £6 per hour to work at the local supermarket, if you choose to take a day off from work you might lose £48 from having sacrificed eight hours of paid work.
• Government spending priorities: The opportunity cost of the government spending nearly £10 billion on investment in National Health Service might be that £10 billion less is available for spending on education or the transport network.
• Investing today for consumption tomorrow: The opportunity cost of an economy investing resources in new capital goods is the current production of consumer goods given up. We may have to accept lower living standards now, to accumulate increased capital equipment so that long run living standards can improve.
• Making use of scarce farming land: The opportunity cost of using arable farmland to produce wheat is that the land cannot be used in that production period to harvest potatoes.
An example of opportunity cost You have won a free ticket to see an Eric Clapton concert (which has no resale value). Bob Dylan is performing on the same night and is your next-best alternative activity. Tickets to see Dylan cost $40. On any given day, you would be willing to pay up to $50 to see Dylan. Assume there are no other costs of seeing either performer. Based on this information, what is the opportunity cost of seeing Eric Clapton?
(a) $0 (b) $10 (c) $40 (d) $50
What is the smallest amount that seeing Clapton would have to be worth to you to make his concert the better choice?
a) $0 b) $10 c) $40 d) $50
The answer to both questions is (b) - $10! Although the wording in the question has changed, both questions relate to the core idea of opportunity cost. I.e. what is the maximum cost of your decisions to go see the Eric Clapton concert? Adapted from The Economic Naturalist, Robert H Frank

- 15 -
© Tutor2u Limited 2008 www.tutor2u.net
Sectors of production in the economy Production of goods and services takes place in different sectors, when added together they give us a figure for a nation’s gross domestic product (GDP). These sectors are as follows:
1. Primary sector: This involves extraction of natural resources e.g. agriculture, forestry, fishing, quarrying, and mining
2. Secondary sector: This involves the production of goods in the economy, i.e. transforming materials produced by the primary sector e.g. manufacturing and the construction industry
3. Tertiary sector: the tertiary sector provided services such as banking, finance, insurance, retail, education and travel and tourism
4. Quaternary sector: The quaternary sector is involved with information processing e.g. education, research and development
Manufacturing industry in the United Kingdom only accounts for 18 per cent of national output. The bulk of our
income and employment comes from the service sector. Suggested reading on opportunity cost and trade offs Could scrapping Trident save the planet? (Guardian, November 2006)

- 16 -
© Tutor2u Limited 2008 www.tutor2u.net
3. The Production Possibility Frontier In this chapter we will consider the nature of the production possibility frontier and its relationships with the fundamental economic problem. A production possibility frontier (PPF) is a curve or a boundary which shows the combinations of two or more goods and services that can be produced whilst using all of the available factor resources efficiently. We normally draw a PPF on a diagram as concave to the origin. This is because the extra units of output resulting from allocating more resources to one particular good may fall. I.e. as we move down the PPF, as more resources are allocated towards Good Y, the extra output gets smaller – and more of Good X has to be given up in order to produce the extra output of Good Y. This is known as the principle of diminishing returns. Diminishing returns occurs because not all factor inputs are equally suited to producing different goods and services.
Combinations of output of goods X and Y lying inside the PPF occur when there are unemployed resources or when the economy uses resources inefficiently. In the diagram above, point X is an example of this. We could increase total output by moving towards the production possibility frontier and reaching any of points C, A or B. Point D is unattainable at the moment because it lies beyond the PPF. A country would require an increase in factor resources, or an increase in the efficiency (or productivity) of factor resources or an improvement in technology to reach this combination of Good X and Good Y. If we achieve this then output combination D may become attainable.
OUTPUT OF GOOD X
OUTPUT OF GOOD Y
A
B
C
X
D
A PPF shows the different combinations of goods and services that can be produced with a given amount of resources in their most efficient way Any point inside the curve – suggests resources are not being utilised efficiently Any point outside the curve – not attainable with the current level of resources

- 17 -
© Tutor2u Limited 2008 www.tutor2u.net
Producing more of both goods would represent an improvement in our economic welfare providing that the products are giving consumers a positive satisfaction and therefore an improvement in what is called allocative efficiency Opportunity cost and the PPF Reallocating scarce resources from one product to another involves an opportunity cost. If we go back to the previous PPF diagram, if we increase our output of Good X (i.e. a movement along the PPF from point A to point B) then fewer resources are available to produce good Y. Because of the shape of the PPF the opportunity cost of switching resources increases – i.e. we have to give up more of Good Y to achieve gains in the output of good X.
The PPF does not always have to be drawn as a curve. If the opportunity cost for producing two products is constant, then we draw the PPF as a straight line. The gradient of that line is a way of measuring the opportunity cost between two goods.
Output of Consumer Goods
Output of Capital Goods
C2
C1
X2 X1
A
B

- 18 -
© Tutor2u Limited 2008 www.tutor2u.net
Explaining Shifts in the Production Possibility Frontier The production possibility frontier will shift when:
o There are improvements in productivity and efficiency perhaps because of the introduction of new technology or advances in the techniques of production
o More factor resources are exploited perhaps due to an increase in the size of the workforce or a rise in the amount of capital equipment available for businesses
In the diagram below, there is an improvement in technology which shifts the PPF outwards. As a result of this, output possibilities have increased and we can conclude (providing the good provides positive satisfaction to consumers) that there is an improvement in economic welfare.
Output of Good B
Output of Good A
A straight line PPF shows a constant opportunity cost between two products Increasing output of good B from 60 to 90 units implies giving up 90 units of good A The marginal opportunity cost for each extra unit of good B is 30 units of Good A
A
B 200
160
60 90

- 19 -
© Tutor2u Limited 2008 www.tutor2u.net
Technology, prices and consumer welfare Improved technology should bring market prices down and make products more affordable to the consumer. This has been the case in the market for personal computers and digital products. The exploitation of economies of scale and improvements in production technology has brought prices down for consumers and businesses. External Costs Air pollution suffocates Calcutta Some 70% of people in Calcutta suffer from respiratory disorders caused by air pollution, a recent study by a prominent cancer institute in India has concluded. Ailments include lung cancer, breathing difficulties and asthma, the Chittaranjan National Cancer Institute (CNCI) study says.
Source: BBC news online, June 2007 In the case of air pollution there is an external cost to society arising from the contamination of our air supplies. External costs are those costs faced by a third party for which no compensation is forthcoming. Identifying and then estimating a monetary value for air pollution can be a very difficult exercise – but one that is important for economists concerned with the impact of economic activity on our environment. We will consider this issue in more detail when we study externalities and market failure. Free Goods Not all goods have an opportunity cost. Free goods are not scarce and no cost is involved when consuming them.
Output of Consumer Goods
Output of Capital Goods
C2
C1
X2 X1
A
B
PPF1
PPF2
C
C3
X3
An outward shift in the PPF shows that there has been either an improvement in productivity or an increase in the total stock of resources available to produce different goods and services. The outward shift represents an improvement in economic efficiency.

- 20 -
© Tutor2u Limited 2008 www.tutor2u.net
Air conditioning uses up scarce resources especially during hot weather Is fresh air an example of a free good? Usually the answer is yes – yet we know that air can become contaminated by pollutants. And, in thousands of offices, shops and schools, air-conditioning systems cool the air before it is “consumed”. With air conditioning, scarce resources are used up in providing the “product” – for example the capital machinery and technology that goes into manufacturing the air conditioning equipment; the labour involved in its design, production, distribution and maintenance and the energy used up in powering the system. Cool air might appear to be free – but in fact it is often an expensive product to supply! Suggested reading on the production possibility frontier The production possibility curve (flash animation)

- 21 -
© Tutor2u Limited 2008 www.tutor2u.net
4. Specialisation and Trade One feature of economic life is that individuals, businesses and countries engage in specialisation. Specialisation is when we concentrate on a particular product or task. Surplus products can then be exchanged and traded with the potential for gains in welfare for all parties. The potential benefits from specialisation By concentrating on what people and businesses do best rather than relying on self sufficiency:
• Higher output: Total output of goods and services is raised and quality can be improved. A higher output at lower costs means more wants and needs might be satisfied with a given amount of scarce resources.
• Variety; Consumers have improved access to a greater variety of higher quality products i.e. they have more and better choice both from their own economy and from the production of other countries
• A bigger market: Specialisation and international trade increase the size of the market offering opportunities for economies of scale (a fall in long run costs per unit of output)
• Competition and lower prices: Increased competition for domestic producers acts as an incentive to minimise costs and innovate to remain competitive. Competition helps to keep prices down and maintains low inflation
The division of labour
Specialisation occurs in nearly every business – from manufacturing to restaurants
The division of labour occurs where the production of a good is broken up into many separate tasks each performed by one person or by a small group of people. The division of labour raises output per person, thereby reducing costs per unit because lower skilled workers are easily trained and quickly become proficient through constant repetition of a task – ‘practice makes perfect’ – or “learning by doing”. Low unit costs allow firms to remain competitive in the markets in which they operate. Traditionally the division of labour and high level of specialisation in manufacturing industries is associated with the concept of scientific management or Taylorism.
- 22 -
© Tutor2u Limited 2008 www.tutor2u.net
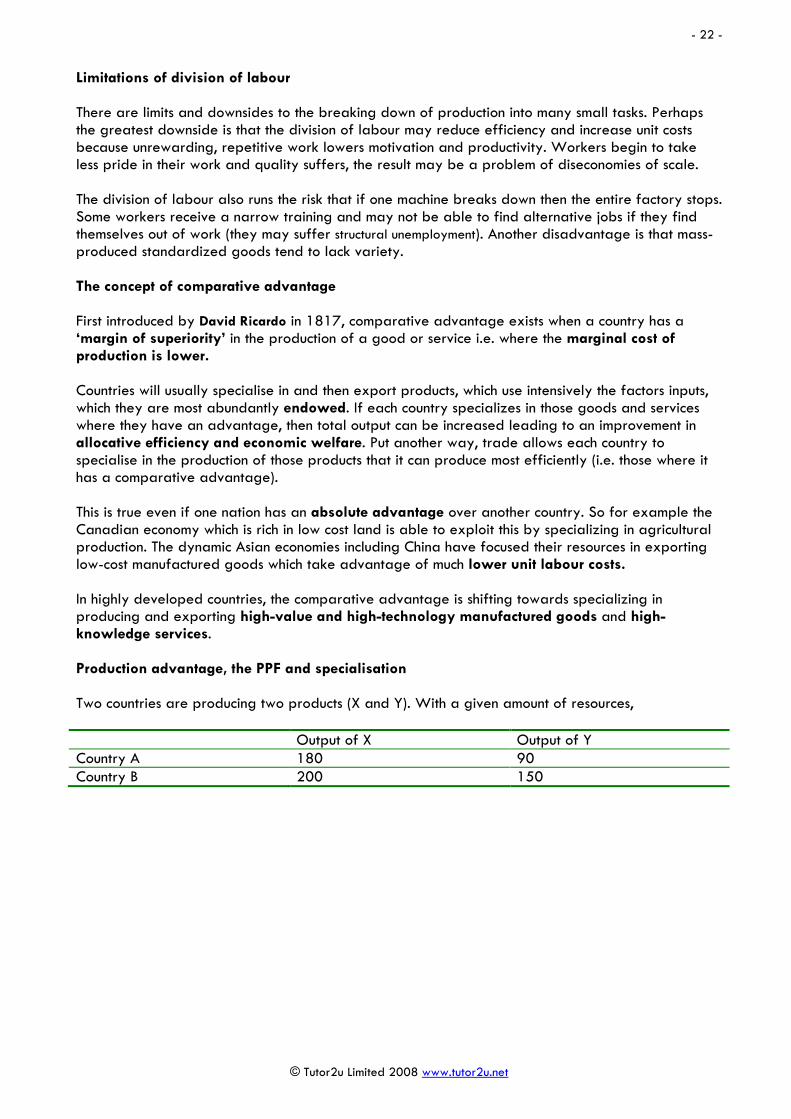
Limitations of division of labour There are limits and downsides to the breaking down of production into many small tasks. Perhaps the greatest downside is that the division of labour may reduce efficiency and increase unit costs because unrewarding, repetitive work lowers motivation and productivity. Workers begin to take less pride in their work and quality suffers, the result may be a problem of diseconomies of scale. The division of labour also runs the risk that if one machine breaks down then the entire factory stops. Some workers receive a narrow training and may not be able to find alternative jobs if they find themselves out of work (they may suffer structural unemployment). Another disadvantage is that mass-produced standardized goods tend to lack variety. The concept of comparative advantage First introduced by David Ricardo in 1817, comparative advantage exists when a country has a ‘margin of superiority’ in the production of a good or service i.e. where the marginal cost of production is lower. Countries will usually specialise in and then export products, which use intensively the factors inputs, which they are most abundantly endowed. If each country specializes in those goods and services where they have an advantage, then total output can be increased leading to an improvement in allocative efficiency and economic welfare. Put another way, trade allows each country to specialise in the production of those products that it can produce most efficiently (i.e. those where it has a comparative advantage). This is true even if one nation has an absolute advantage over another country. So for example the Canadian economy which is rich in low cost land is able to exploit this by specializing in agricultural production. The dynamic Asian economies including China have focused their resources in exporting low-cost manufactured goods which take advantage of much lower unit labour costs. In highly developed countries, the comparative advantage is shifting towards specializing in producing and exporting high-value and high-technology manufactured goods and high-knowledge services. Production advantage, the PPF and specialisation Two countries are producing two products (X and Y). With a given amount of resources, Output of X Output of Y Country A 180 90 Country B 200 150

- 23 -
© Tutor2u Limited 2008 www.tutor2u.net
In this example, country B has an absolute advantage in both products. Absolute advantage occurs when a country or region can create more of a product with the same factor inputs. But although country A has an absolute disadvantage, in fact it has a comparative advantage in the production of good X. It is 9/10ths as efficient at producing good X but it is only 3/5ths as efficient at producing good Y. Comparative advantage exists when a country has lower opportunity cost, ie, it gives up less of one product to obtain more of another product. Economists argue countries benefit if they specialise in a product in which they have a comparative advantage and trade. In our example above, for country A, every extra unit of good Y produced involves an opportunity cost of 2 unit of good X. Whereas for country B, an additional unit of good Y involves a sacrifice of only 4.3 units of good X. There are gains to be had from country A specializing in the supply of good X and country B allocating more of their resources into the production of good Y. Another worked example of comparative advantage In this second example, we will work through an example of comparative advantage and also show some of the possible benefits that might flow from specialisation and trade between two countries. Consider two countries producing two products – digital cameras and vacuum cleaners. With the same factor resources evenly allocated by each country to the production of both goods, the production possibilities are as shown in the table below. Pre-specialisation Digital Cameras Vacuum Cleaners UK 600 600 United States 2400 1000 Total 3000 1600 Working out the comparative advantage To identify which country should specialise in a particular product we need to analyse the internal opportunity costs for each country. For example, were the UK to shift more resources into higher output of vacuum cleaners, the opportunity cost of each vacuum cleaner is one digital television. For
Output of Good Y
Output of Good X
PPF for Country A
360
90 180
400
300
PPF for Country B
200
150
180
- 24 -
© Tutor2u Limited 2008 www.tutor2u.net
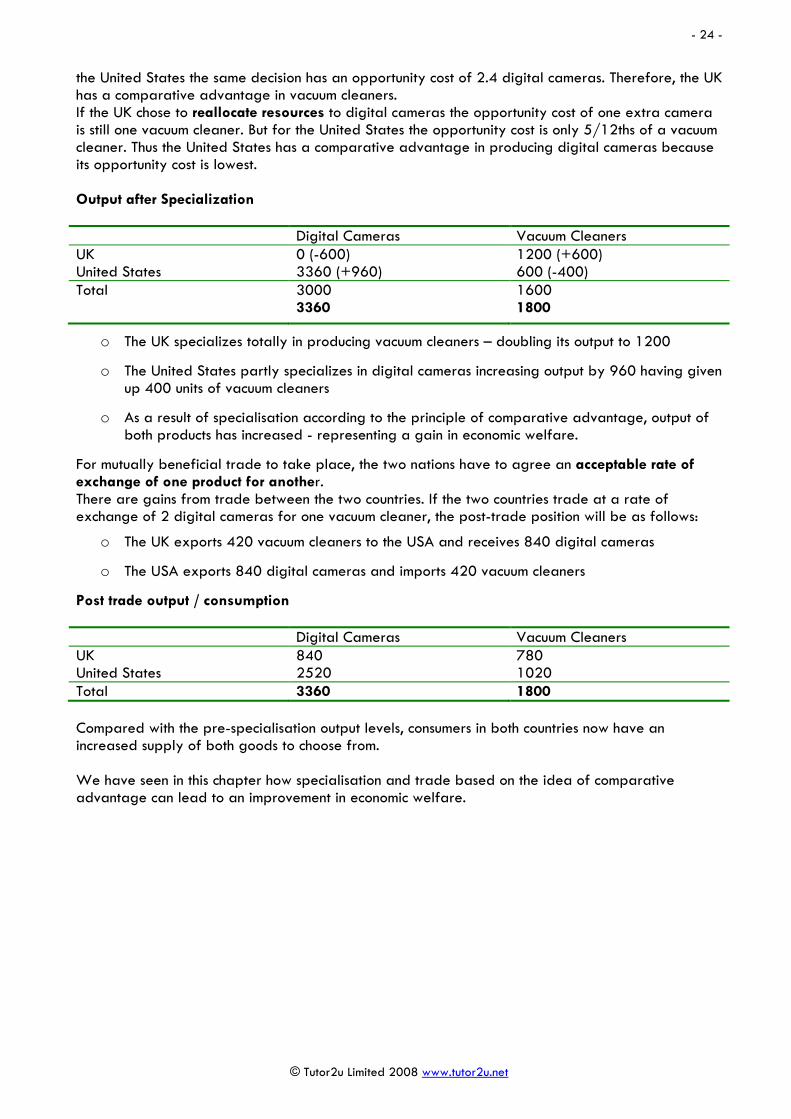
the United States the same decision has an opportunity cost of 2.4 digital cameras. Therefore, the UK has a comparative advantage in vacuum cleaners. If the UK chose to reallocate resources to digital cameras the opportunity cost of one extra camera is still one vacuum cleaner. But for the United States the opportunity cost is only 5/12ths of a vacuum cleaner. Thus the United States has a comparative advantage in producing digital cameras because its opportunity cost is lowest. Output after Specialization Digital Cameras Vacuum Cleaners UK 0 (-600) 1200 (+600) United States 3360 (+960) 600 (-400) Total 3000
3360 1600 1800
o The UK specializes totally in producing vacuum cleaners – doubling its output to 1200
o The United States partly specializes in digital cameras increasing output by 960 having given up 400 units of vacuum cleaners
o As a result of specialisation according to the principle of comparative advantage, output of both products has increased - representing a gain in economic welfare.
For mutually beneficial trade to take place, the two nations have to agree an acceptable rate of exchange of one product for another. There are gains from trade between the two countries. If the two countries trade at a rate of exchange of 2 digital cameras for one vacuum cleaner, the post-trade position will be as follows:
o The UK exports 420 vacuum cleaners to the USA and receives 840 digital cameras
o The USA exports 840 digital cameras and imports 420 vacuum cleaners
Post trade output / consumption Digital Cameras Vacuum Cleaners UK 840 780 United States 2520 1020 Total 3360 1800 Compared with the pre-specialisation output levels, consumers in both countries now have an increased supply of both goods to choose from. We have seen in this chapter how specialisation and trade based on the idea of comparative advantage can lead to an improvement in economic welfare.

- 25 -
© Tutor2u Limited 2008 www.tutor2u.net
5. Positive and Normative Statements In this brief chapter we introduce you to the idea of positive and normative statements and the idea of value judgements contained in statements and articles. Detecting bias in arguments Whenever you are reading articles on current affairs it is important to be able to distinguish where possible between objective and subjective statements. Often, the person writing an article has a particular argument to make and will include subjective statements about what ought to be or what should be happening. Their articles carry value judgements where they are trying to persuade you of the particular merits or demerits of a policy decision. These articles may be lacking in objectivity. Positive Statements Positive statements are objective statements that can be tested or rejected by referring to the available evidence. Positive economics deals with objective explanation and the testing and rejection of theories. For example:
• A rise in consumer incomes will lead to a rise in the demand for new cars.
• A fall in the exchange rate will lead to an increase in exports overseas.
• More competition in markets can lead to lower prices for consumers.
• If the government raises the tax on beer, this will lead to a fall in profits of the brewers.
• A reduction in income tax will improve the incentives of the unemployed to find work.
• A rise in average temperatures will increase the demand for chicken.
• Poverty in the UK has increased because of the fast growth of executive pay. Normative Statements Normative statements express an opinion about what ought to be. They are subjective statements rather than objective statements – i.e. they carry value judgments. For example:
• The level of excise duty on petrol is unfair and penalizes motorists.
• The London congestion charge for drivers of petrol-guzzling cars should increase to £25 - three times the current charge.
• The government should increase the national minimum wage to £6 per hour to reduce relative poverty.
• The government is right to introduce a ban on smoking in public places.
• The retirement age should be raised to 75 to combat the effects of our ageing population.
• The government ought to provide financial subsidies to companies manufacturing and developing wind farm technology.

- 26 -
© Tutor2u Limited 2008 www.tutor2u.net
6. Markets: The Theory of Demand In this chapter we consider the economics of the law of demand. This is important background to understanding the determination of prices in competitive markets. Demand Demand is the quantity of a good or service that consumers are willing and able to buy at a given price in a given time period. Each of us has an individual demand for particular goods and services and the level of demand at each price reflects the value that consumers place on a product and their expected satisfaction gained from purchase and consumption. Market demand Market demand is the sum of the individual demand for a product from each consumer in the market. If more people enter the market and they have the ability to pay for items on sale, then demand at each price level will rise. Effective demand and willingness to pay Demand in economics must be effective which means that only when a consumers' desire to buy a product is backed up by an ability to pay for it does demand have an effect on the market. For example, what price are you willing to pay to view a world championship boxing event and how much are you prepared to spend to watch Premiership soccer on a pay-per-view basis? Auctions of film posters Classic film posters are fetching thousands of pounds as more and more private collectors vie for a piece of cinema history. The prices that collectors are prepared to pay for film posters continues to rise, some of the buyers are hoping for a financial return whereas others are just willing and able to pay for the satisfaction that comes from owning a small slice of cinema memorabilia. Rockonomics – rising ticket prices for pop concerts Tickets for the most popular rock and pop concerts keep getting more expensive but consumers seem happy and able to pay for them judging from the number of sell-out gigs in London this spring. The price of a seat for to see Madonna's "Confessions on a Dancefloor" tour ranges from £80 to £160, with an additional £13 booking fee. A ticket to see Red Hot Chili Peppers will set you back £40 and the chance to see Bruce Springsteen at the Hammersmith Apollo is priced at just under £50 for a standard ticket. Ticket prices have been rising much faster than the overall rate of inflation which has led to a large rise in the real price of seeing your favourite pop star on stage.
Source: Adapted from BBC news online, April 2006 Latent Demand Latent demand is probably best described as the potential demand for a product. It exists when there is willingness to buy among people for a good or service, but where consumers lack the purchasing power to be able to afford the product. Latent demand is affected by advertising – where the producer is seeking to influence consumer tastes and preferences. Derived Demand The demand for a product X might be linked to the demand for a related product Y – giving rise to the idea of a derived demand.

- 27 -
© Tutor2u Limited 2008 www.tutor2u.net
For example, the demand for steel is strongly linked to the demand for new vehicles and other manufactured products, so that when an economy goes into a downturn or recession, so we would expect the demand for steel to decline likewise. The major producer of steel in the UK is Corus. They produce for a wide range of different industries; from agriculture, aerospace and construction industries to consumer goods producers, packing and the transport sector. Steel is a cyclical industry which means that the total market demand for steel is affected by changes in the economic cycle and also by fluctuations in the exchange rate.
The demand for new bricks is derived from the demand for the final output of the construction industry- when there is a boom in the building industry, so the market demand for bricks will increase
The Law of Demand Other factors remaining constant there is an inverse relationship between the price of a good and demand.
1. As prices fall, we see an expansion of demand.
2. If price rises, there will be a contraction of demand. The ceteris paribus assumption Many factors can be said to affect demand. Economists assume all factors are held constant (ie do not change) except one – the price of the product itself. A change in a factor being held constant invalidates the ceteris paribus assumption. The Demand Curve A demand curve shows the relationship between the price of an item and the quantity demanded over a period of time. There are two reasons why more is demanded as price falls:
1. The Income Effect: There is an income effect when the price of a good falls because the consumer can maintain current consumption for less expenditure. Provided that the good is normal, some of the resulting increase in real income is used to buy more of this product.
2. The Substitution Effect: There is a substitution effect when the price of a good falls because the product is now relatively cheaper than an alternative item and some consumers switch their spending from the good in competitive demand to this product.

- 28 -
© Tutor2u Limited 2008 www.tutor2u.net
The demand curve is normally drawn in textbooks as a straight line suggesting a linear relationship between price and demand but in reality, the demand curve will be non-linear! No business has a perfect idea of what the demand curve for a particular product looks like, they use real-time evidence from markets to estimate the demand conditions and their accumulated experience of market conditions gives them an advantage in constructing demand-price relationships. A change in the price of a good or service causes a movement along the demand curve. A fall in the price of a good causes an expansion of demand; a rise in price causes a contraction of demand. Many other factors can affect total demand - when these change, the demand curve can shift. This is explained below. Shifts in the Demand Curve Caused by Changes in the Conditions of Demand There are two possibilities: either the demand curve shifts to the right or it shifts to the left. In the diagram below we see two shifts in the demand curve:
1. D1 – D3 would be an example of an outward shift of the demand curve (or an increase in demand). When this happens, more is demanded at each price.
2. A movement from D1 – D2 would be termed an inward shift of the demand curve (or decrease in demand). When this happens, less is demanded at each price.
Price
Quantity Demanded
Demand
P1
P2
P3
Q1 Q2 Q3
Demand – the amount consumers desire to purchase at various alternative prices At higher prices, consumers generally willing to purchase less than at lower prices At lower prices there is a financial incentive to demand more of a good or service

- 29 -
© Tutor2u Limited 2008 www.tutor2u.net
The conditions of demand The conditions of demand for a product in a market can be summarised as follows: D = f (Pn, Pn…Pn-1, Y, T, P, E)
Where:
• Pn = the price of the good itself
• Pn…Pn-1 = Prices of all other related goods and services be they substitutes or complements
• Y = Consumer incomes
• T = Tastes and preferences of consumers
• P = The size of the population and the age-structure of the population
• E = Price expectations of consumers for future time periods Changing prices of a substitute good Substitutes are goods in competitive demand and act as replacements for another product. For example, a rise in the price of Esso petrol should cause a substitution effect away from Esso towards competing brands such as Shell. Consumers will tend over time to switch to the cheaper brand or service provider. When it is easy and cheap to switch, then consumer demand will be sensitive to price changes. Much depends on whether consumers have sufficient information about prices for different goods and services. One might expect that a fall in the charges from one car rental firm such as Budget might affect the demand for car rentals from Avis Hertz or Easycar. But searching for price information to get the best deal in the market can be time consuming and involves an opportunity
Price
Quantity Demanded
D1
P1
Q1 Q2 Q3
D3 D2
Changes in any of the factors other than price causes the demand curve to shift Changes in the price of the good itself cause a movement along the demand curve

- 30 -
© Tutor2u Limited 2008 www.tutor2u.net
cost. The development of the internet and many price-comparison web sites such as Kelkoo, MoneySupermarket and PriceRunner has helped to increase price transparency thereby making it easier for consumers to compare relative prices in markets. Changing price of a complement Two complements are said to be in joint demand. Examples include: fish and chips, DVD players and DVDs, iron ore and steel.
• A rise in the price of a complement to Good X should cause a fall in demand for X. For example an increase in the cost of flights from London Heathrow to New York would cause a decrease in the demand for hotel rooms in New York and also a fall in the demand for taxi services both in London and New York.
• A fall in the price of a complement to Good Y should cause an increase in demand for Good Y. For example a reduction in the market price of computers should lead to an increase in the demand for printers, scanners and software applications.
Change in the income of consumers Most of the things we buy are normal goods. When an individual’s income goes up, their ability to purchase goods and services increases, and this causes an outward shift in the demand curve. When incomes fall there will be a decrease in the demand for most goods. Change in tastes and preferences Changing tastes and preferences can have a huge effect on demand for different products. Persuasive advertising is designed to cause a change in tastes and preferences and thereby create an outward shift in demand. A good example of this is the recent surge in sales of smoothies and other fruit juice drinks.
The market demand for smoothies The UK’s growing thirst for healthy eating and fears about the longer term health effects of the consumption of fast food has meant that the demand for smoothies and other fresh fruit drinks has expanded rapidly in recent years. Innocent, the leading brand in supermarkets, estimates that the market could be worth £170m in 2007. More and more retail outlets such as Crussh are appearing on the high streets, and demand is rising in school canteens and workplaces. Innocent has seen its turnover expand to £37m in the past six years and has over 50 per cent of the UK market. It sells 1m
smoothies a week, compared with 20 on its first day of operation in 1999. Some stockmarket experts are forecasting that a fruit juice manufacturer could eventually enter the FTSE-100 list of top stockmarket businesses.
Source: Adapted from news reports, June 2006 and the Innocent web site Discretionary income Discretionary income is disposable income less essential payments like electricity & gas and, especially, mortgage repayments. An increase in interest rates often means an increase in monthly mortgage payments reducing demand. And in recent years we have seen a sharp rise in the cost of utility bills with a series of hikes in the prices of gas and electricity. This has eaten into the

- 31 -
© Tutor2u Limited 2008 www.tutor2u.net
discretionary incomes of millions of households across the UK. The discretionary incomes of people suffering from fuel poverty have become a major current issue. Interest rates and demand Many products are bought on credit using borrowed money, thus the demand for them may be sensitive to the rate of interest charged by the lender. Therefore if the Bank of England decides to raise interest rates – the demand for many goods and services may fall. Examples of “interest sensitive” products include household appliances, electronic goods, new furniture and motor vehicles. The demand for housing is affected by changes in mortgage interest rates. Exceptions to the law of demand Does the demand for a product always vary inversely with the price? There are two possible reasons why more might be demanded even when the price of a good or service is increasing. We consider these briefly – ostentatious consumption and the effects of speculative demand. (a) Ostentatious consumption Some goods are luxurious items where satisfaction comes from knowing both the price of the good and being able to flaunt consumption of it to other people! The demand for the product is a direct function of its price. A higher price may also be regarded as a reflection of product quality and some consumers are prepared to pay this for the “snob value effect”. Examples might include perfumes, designer clothes, and top of the range cars. Consider the case of VI which is considered to be the most exclusive perfume in the world. Only 475 bottles have been produced and bottles have been selling for £47,500 each – a classic case of paying through the nose for an exclusive good. Goods of ostentatious consumption or ‘high status goods’ are known as Veblen Goods (named after the economist Thornstein Veblen) and they have a high-income elasticity of demand. That is, demand rises more than proportionately to an increase in income or an increase in price. (b) Speculative Demand The demand for a product can also be affected by speculative demand. Here, potential buyers are interested not just in the satisfaction they may get from consuming the product, but also the potential rise in market price leading to a capital gain or profit. When prices are rising, speculative demand may grow, adding to the upward pressure on prices. The speculative demand for housing and for shares might come into this category and we have also seen, in the last few years, strong speculative demand for many of the world’s essential commodities. Speculation drives the prices of commodities to fresh highs World commodity prices have reached new highs this year helped by an increase in the rate of economic growth in the global economy. Among the metals that have achieved record price levels are copper, zinc, gold and platinum; prompting sceptics to question how much longer prices can continue rising. Many market experts believe that the demand for commodities has been spurred by heavy speculator activity. For example, pension funds and hedge funds have been investing in commodity mutual funds over recent years leading to increased demand for precious metals. Prices have risen quickly because commodity producers are unable to raise output sufficiently to meet unexpectedly strong demand.
Source: Adapted from news reports, July 2006

- 32 -
© Tutor2u Limited 2008 www.tutor2u.net
Fine wine investors push up prices Fine wines are becoming increasingly unaffordable for traditional wine collectors as new buyers flush with cash from Russia and China and wealthy Londoners with big City bonuses to invest push prices to record highs. Wine traders say they have seen an influx of new money into the finest kinds of wines as economic growth has created pockets of wealth around the world, creating new sources of demand. Stephen Browett, purchasing director at London merchant Farr Vintners, said it had sold 17 cases of Château Lafite 2003 over the past two weeks at £7,000 per case – double its price a year ago. “And people are still clamouring for it,” he said, adding that the wine was mostly sold to UK and Asian buyers. Mr Williams is planning regular wine tasting in the new Ritz-Carlton in Moscow, which opened two weeks ago. While the weakness in the US dollar relative to sterling and the euro has led to a drop in demand for fine wines from American buyers, new customers have been emerging in Eastern Europe, Asia and South America.
Adapted from the Financial Times, July 2007
The non-linear demand curve and the idea of price points
0
100
200
300
400
500
600
700
800
900
1000
0 100 200 300 400 500 600 700 800
Weekly sales of mountain bikes
Price of mountain bikes (£s)
So far in our introductory theory of demand, we have drawn the demand curve for a product to be linear (a straight line). In many real world markets this assumption of a linear relationship between price and quantity demanded is not realistic. Many price-demand relationships are non-linear and an example of this is provided in the chart above, used to illustrate the idea of price-points. Price points are points on the demand curve where demand is relatively high, but where a small change in price may cause a sizeable contraction in demand leading to a loss of total revenue for the producer. Consider price point A. Raising the selling price of the mountain bike above £650 causes demand to decline quite quickly. From selling 250 bikes per week, raising the price to £700 leads to sales dipping to 175 per week. In technical terms we say that the price elasticity of demand is higher at a price just above the price point. Another price point might exist at B. Looking at this in a slightly different way, cutting the price below £400 leads to a large expansion of demand.
A
B
- 33 -
© Tutor2u Limited 2008 www.tutor2u.net
Price points can be justified in a number of ways:
1. A price rise at the price point may make the product more expensive than a close substitute causing consumers to change their preferences
2. Customers may have become used to paying a certain price for a type of product and if they see a further price rise, this may cause them to revalue how much satisfaction they get from buying and consuming something, leading to a decline in demand
3. There may be psychological effects at work, supermarkets for example know the importance of avoiding price points - £2.99 somehow seems cheaper than £3.00 despite the tiny price difference
For AS level economics, you will be expected to draw and use linear demand curves in your basic analysis. But it is important to realise that in the real world of business, price-demand relationships can be complex and often a business does not have enough information about the behaviour of consumers for them to actually construct an accurate demand curve. As with many aspects of economic theory, we are constructing curves to illustrate economic relationships. They are simplifications of reality. Suggestions for further reading on the theory of demand All of these articles relate to some of the causes of changes in the market demand for different goods and services. When reading through them, consider some of the conditions of demand covered in this chapter and how they link in to the particular story. Britons 'burn £5bn to keep cool' (BBC news, September 2006) Demand for solar panels - Soaring energy costs make solar power a bright idea (The Guardian) Substitutes and demand: Cadburys to enter the UK gum market (BBC news, October 2006) – see also this audio-visual clip Demand for Polish beer in Britain (BBC news, October 2006) Cereals withdrawn after moth find (BBC news, October 2006) Demand for slimming treatments – Fat man, thin man (BBC Money Programme, March 2007) Blame the Crazy Frog: it may be all over for the ringtone revolution (Guardian, October 2006) Salmonella risk in imported eggs (BBC news, November 2006) Speculative demand - Priciest champagne set to sparkle (BBC news, November 2006) Tastes and preferences - Healthy trends eat into sales at Burger King (Guardian, November 2006) Sales of digital televisions top analogue sets (Guardian, November 2006) Nigella effect sees goose fat sales soar (Guardian, December 2006) Sales of smoothies up five-fold (BBC news, January 2007) Online retailing 'surging ahead' (BBC news, May 2007) Slump in lad magazines hits Emap (BBC news, May 2007) Commodities boom – speculative demand (Economist, July 2006) Fee prompts First Direct exodus (BBC news, July 2007) Fine wine investors push up prices (Financial Times, July 2007) Soaring sales for Dominos pizzas (BBC news online, July 2007)

- 34 -
© Tutor2u Limited 2008 www.tutor2u.net
7. Markets: The Theory of Supply In this chapter we turn our attention to the decisions that producers make about how much of a product to supply to a market at any given price. Definition of Supply Supply is defined as the quantity of a product that a producer is willing and able to supply onto the market at a given price in a given time period. Note: Throughout this study companion, the terms firm, business, producer and seller have the same meaning. The basic law of supply is that as the price of a product rises, so businesses expand their supply onto the market. A supply curve shows a relationship between the price and quantity a firm is willing and able to sell.
A supply curve is drawn assuming ceteris paribus - ie that all factors influencing supply are being held constant except the price. If the price of the good varies, we move along a supply curve. In the diagram above, as the price rises from P1 to P2 there is an expansion of supply. If the market price falls from P1 to P3 there would be a contraction of supply in the market. Businesses are responding to price signals when making their output decisions. Explaining the Law of Supply There are three main reasons why supply curves are drawn as sloping upwards from left to right giving a positive relationship between the market price and quantity supplied:
Price
Quantity supplied
Supply
P1
P2
P3
Q1 Q3 Q2
Supply – the amount producers are willing to offer for sale at various prices Supply – reflects the costs of the resources used in production and the profits required

- 35 -
© Tutor2u Limited 2008 www.tutor2u.net
1. The profit motive: When the market price rises (for example after an increase in consumer demand), it becomes more profitable for businesses to increase output. Higher prices send signals to firms that they can increase their profits by satisfying demand in the market.
2. Production and costs: When output expands, a firm’s production costs rise, therefore a higher price is needed to cover these extra costs of production.
3. New entrants coming into the market: Higher prices may create an incentive for other businesses to enter the market leading to an increase in supply.
Shifts in the Supply Curve The supply curve can shift position. If the supply curve shifts to the right (from S1 to S2) this is an increase in supply; more is provided for sale at each price. If the supply curve moves inwards from S1 to S3, there is a decrease in supply meaning that less will be supplied at each price
Changes in the costs of production Lower costs of production mean that a business can supply more at each price. For example a magazine publisher might see a reduction in the cost of its imported paper and inks. A car manufacturer might benefit from a stronger exchange rate because the cost of components and new technology bought from overseas becomes lower. These cost savings can then be passed through the supply chain to wholesalers and retailers and may result in lower market prices for consumers. Conversely, if the costs of production increase, for example following a rise in the price of raw materials or a firm having to pay higher wages to its workers, then businesses cannot supply as much at the same price and this will cause an inward shift of the supply curve.
Price
Quantity
S1
P1
Q1 Q3 Q2
S2
S3
Increase in Supply
Decrease in Supply
Changes in any of the factors other than price cause a shift in the supply curve A shift in supply to the left – the amount that producers offer for sale at every price will be less A shift in supply to the right – the amount producers wish to sell at every price increases

- 36 -
© Tutor2u Limited 2008 www.tutor2u.net
A fall in the exchange rate causes an increase in the prices of imported components and raw materials and will (other factors remaining constant) lead to a decrease in supply in a number of different markets and industries. For example if the pounds falls by 10% against the Euro, then it becomes more expensive for British car manufacturers to import their rubber and glass from Western European suppliers, and higher prices for paints imported from Eastern Europe. Changes in production technology Production technologies can change quickly and in industries where technological change is rapid we see increases in supply and lower prices for the consumer. Government taxes and subsidies
Metal prices and the supply of cans The world's biggest maker of drink cans, Rexam, says it will raise prices to offset an unprecedented increase in the cost of aluminium that has hit profits. The British firm spends about £1bn a year on aluminium to make 50bn cans a year for customers such as Coca-Cola and Carlsberg. Prices of the metal have risen to $2,500 (£1,325) a tonne in recent months from an average $1,400 over the past decade.
Adapted from an article in the Guardian, August 2006
Price
Quantity
Demand
Supply (post-tax)
P2
Q2
P1
Q1
Supply (pre-tax)
Size of the tax per unit
A tax increases the costs faced by producers. The amount of the tax is shown by the vertical distance between the two supply curves. Because of the tax, less can be supplied at each price level. The result is an increase in the equilibrium market price and a contraction in market demand to a new equilibrium output of Q2

- 37 -
© Tutor2u Limited 2008 www.tutor2u.net
Changes in climate For commodities such as coffee, oranges and wheat, the effect of climatic conditions can exert a great influence on market supply. Favourable weather will produce a bumper harvest and will increase supply. Unfavourable weather conditions including the effects of drought will lead to a poorer harvest, lower yields and therefore a decrease in supply. Changes in climate can therefore have an effect on prices for agricultural goods such as coffee, tea and cocoa. Because these commodities are often used as ingredients in the production of other products, a change in the supply of one can affect the supply and price of another product. Higher coffee prices for example can lead to an increase in the price of coffee-flavoured cakes. And higher banana prices as we see in the article below, will feed through to increased prices for banana smoothies in shops and cafes. Cyclone destroys the Australian banana crop and sends prices soaring Cyclone Larry has devastated Australia's banana industry, destroying fruit worth $300 million and leaving up to 4,000 people out of work. Australians now face a shortage of bananas and likely price rises after the cyclone tore through the heart of the nation's biggest growing region. Queensland produces about 95 per cent of Australia's bananas. The storm ruined 200,000 tonnes of fruit and market supply shortages will be severe because Australia does not allow banana imports because of the bio-security risks in doing so. Bananas are grown throughout the year in north Queensland, with the fruit having a growing cycle of around two months.
Source: Adapted from news reports, April 2006
Price
Quantity
Demand
S1
P1
Q1
P2
Q2
Supply + Subsidy
P3
Subsidy per unit
A government subsidy encourages an increase in supply at each price level because the subsidy provides a reduction in a firm’s costs of production. The extent of the subsidy per unit is shown by the vertical distance between the two supply curves.

- 38 -
© Tutor2u Limited 2008 www.tutor2u.net
Change in the prices of a substitute in production A substitute in production is a product that could have been produced using the same resources. Take the example of barley. An increase in the price of wheat makes wheat growing more financially attractive. The profit motive may cause farmers to grow more wheat rather than barley. The number of producers in the market and their objectives The number of sellers (businesses) in an industry affects market supply. When new businesses enter a market, supply increases causing downward pressure on price. Competitive Supply Goods and services in competitive supply are alternative products that a business could make with its factor resources of land, labour and capital. For example a farmer can plant potatoes or maize.
Farmers can change their crops if there are sizeable changes in market prices and if expectations of future price
movements also change More reading on conditions of supply Each of these links provide short case studies on how changes in supply affect prices and profits UK firms 'worry over energy cost' (BBC news, September 2006) Coffee prices leap on fear of beans shortage (The Guardian, August 2006) Dairy firms under pressure (BBC news audio-visual, May 2007) Food prices defy inflation (BBC news audio-visual, May 2007) Brown cuts VAT on contraceptives (BBC news online, March 2007) Africa struggles with cocoa virus (BBC news, October 2006) Drought boost for Oz wine prices (BBC news, November 2006) Hovis to demand more dough for bread (The Times, November 2006) No return to cheap gas, warns BG as North Sea production runs down (Guardian, November 2006) Hurricanes bring orange growers a windfall (Guardian, December 2006) The market for tin (Economist, February 2007) Food prices set to rise after rain ruins crops (Guardian, July 2007) UK potato supplies 'holding up' (BBC news, July 2007) Milk costs hit Stilton producers (BBC news, July 2007)

- 39 -
© Tutor2u Limited 2008 www.tutor2u.net
8. Market Equilibrium Price In this chapter we bring supply and demand together to consider the determination of equilibrium prices. The Concept of Market Equilibrium
Equilibrium means a state of equality or a state of balance between market demand and supply. Without a shift in demand and/or supply there will be no change in market price. In the diagram above, the quantity demanded and supplied at price P1 are equal. At price P3, supply exceeds demand and at P2, demand exceeds supply. In other words, prices where demand and supply are out of balance are termed points of disequilibrium. Changes in the conditions of demand or supply will shift the demand or supply curves. This will cause changes in the equilibrium price and quantity in the market. Demand and supply schedules can be represented in a table. The example below provides an illustration of the concept of equilibrium. The weekly demand and supply schedules for T-shirts (in thousands) in a city are shown in the next table:
Price
Quantity (Q)
Demand
Supply
P1
Q1
Equilibrium point – a “market clearing” point where supply = demand
P2
P3
Market price is set by the interaction of supply and demand. Equilibrium price is the price at which the quantity demanded by consumers and the quantity that firms are willing to supply of a good or service are the same.

- 40 -
© Tutor2u Limited 2008 www.tutor2u.net
Price per unit (£) 8 7 6 5 4 3 2 1
Demand (000s) 6 8 10 12 14 16 18 20
Supply (000s) 18 16 14 12 10 8 6 4
New Demand (000s) 10 12 14 16 18 20 22 24
New Supply (000s) 26 24 22 20 18 16 14 12
1. The equilibrium price is £5 where demand and supply are equal at 12,000 units
2. If the current market price was £3 – there would be excess demand for 8,000 units
3. If the current market price was £8 – there would be excess supply of 12,000 units
4. A rise in income causes demand to rise by 4,000 at each price. The next row of the table shows the higher level of demand. Assuming that the supply schedule remains unchanged, the new equilibrium price is £6 per tee shirt with an equilibrium quantity of 14,000 units
5. The entry of new producers into the market causes a rise in supply of 8,000 T-shirts at each price. The new equilibrium price becomes £4 with 18,000 units bought and sold
Changes in Market Demand and Equilibrium Price
The demand curve may shift to the right (increase) for several reasons:
1. A rise in the price of a substitute or a fall in the price of a complement
2. An increase in consumers’ income or their wealth
3. Changing consumer tastes and preferences in favour of the product
4. A fall in interest rates (i.e. borrowing rates on bank loans or mortgage interest rates)
5. A general rise in consumer confidence and optimism
Price
Quantity
D1
Supply
P1
Q2
Price
Quantity
D1
Supply
P1
Q1
D3
Q3
P3
D2
Q1
P2
An Outward Shift in Demand An Inward Shift in Demand

- 41 -
© Tutor2u Limited 2008 www.tutor2u.net
The outward shift in the demand curve causes a movement (expansion) along the supply curve and a rise in the equilibrium price and quantity. Firms in the market will sell more at a higher price and therefore receive more in total revenue. The reverse effects will occur when there is an inward shift of demand. A shift in the demand curve does not cause a shift in the supply curve! Demand and supply factors are assumed to be independent of each other although some economists claim this assumption is no longer valid! Changes in Market Supply and Equilibrium Price
The supply curve may shift outwards if there is
1. A fall in the costs of production (e.g. a fall in labour or raw material costs)
2. A government subsidy to producers that reduces their costs for each unit supplied
3. Favourable climate causing higher than expected yields for agricultural commodities
4. A fall in the price of a substitute in production
5. An improvement in production technology leading to higher productivity and efficiency in the production process and lower costs for businesses
6. The entry of new suppliers (firms) into the market which leads to an increase in total market supply available to consumers
The outward shift of the supply curve increases the supply available in the market at each price and with a given demand curve, there is a fall in the market equilibrium price from P1 to P3 and a rise in the quantity of output bought and sold from Q1 to Q3. The shift in supply causes an expansion along the demand curve.
Price
Quantity
S1
Q1
Price
Quantity
D1
S1
P1
Q1 Q3
P3
D2
Q2
P1
An Outward Shift in Supply An Inward Shift in Supply
S2
P2
S3
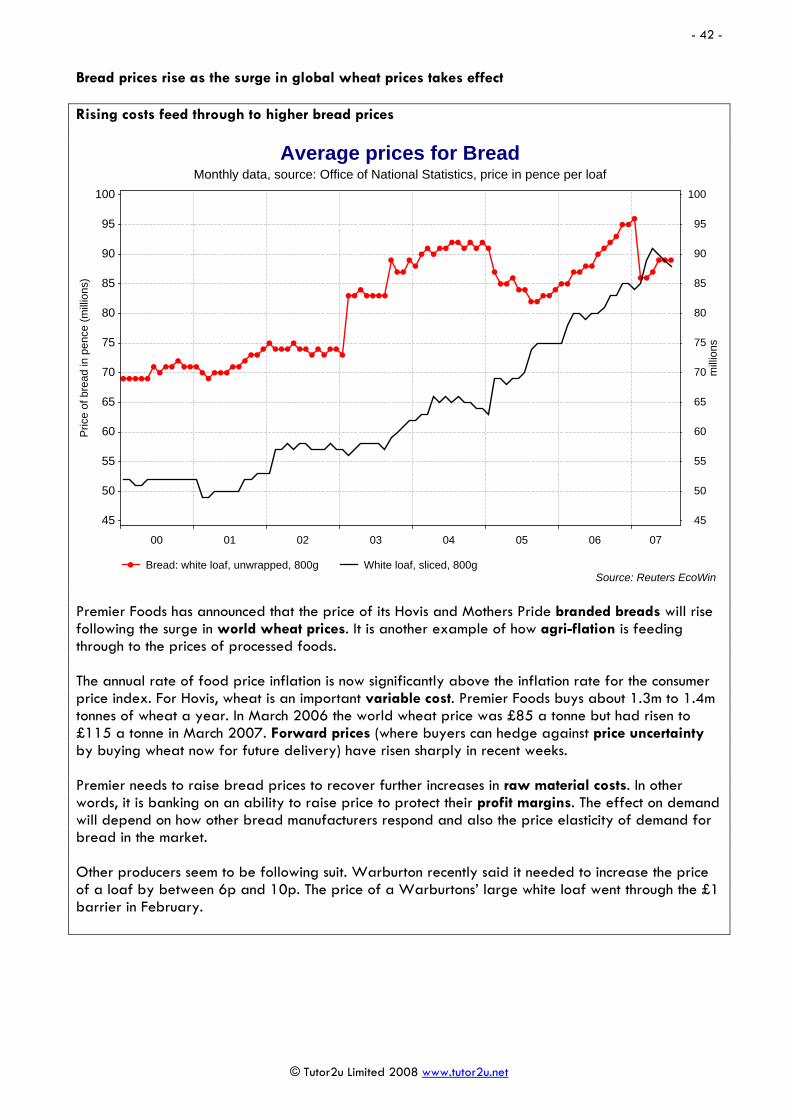
- 42 -
© Tutor2u Limited 2008 www.tutor2u.net
Bread prices rise as the surge in global wheat prices takes effect Rising costs feed through to higher bread prices
Monthly data, source: Office of National Statistics, price in pence per loafAverage prices for Bread
Bread: white loaf, unwrapped, 800g White loaf, sliced, 800gSource: Reuters EcoWin
00 01 02 03 04 05 06 07
milli
ons
45
50
55
60
65
70
75
80
85
90
95
100
Pric
e of
bre
ad in
pen
ce (m
illion
s)
45
50
55
60
65
70
75
80
85
90
95
100
Premier Foods has announced that the price of its Hovis and Mothers Pride branded breads will rise following the surge in world wheat prices. It is another example of how agri-flation is feeding through to the prices of processed foods. The annual rate of food price inflation is now significantly above the inflation rate for the consumer price index. For Hovis, wheat is an important variable cost. Premier Foods buys about 1.3m to 1.4m tonnes of wheat a year. In March 2006 the world wheat price was £85 a tonne but had risen to £115 a tonne in March 2007. Forward prices (where buyers can hedge against price uncertainty by buying wheat now for future delivery) have risen sharply in recent weeks. Premier needs to raise bread prices to recover further increases in raw material costs. In other words, it is banking on an ability to raise price to protect their profit margins. The effect on demand will depend on how other bread manufacturers respond and also the price elasticity of demand for bread in the market. Other producers seem to be following suit. Warburton recently said it needed to increase the price of a loaf by between 6p and 10p. The price of a Warburtons’ large white loaf went through the £1 barrier in February.

- 43 -
© Tutor2u Limited 2008 www.tutor2u.net
Important note for the exams: A shift in the supply curve does not cause a shift in the demand curve. Instead we move along (up or down) the demand curve to the new equilibrium position. A fall in supply might also be caused by the exit of firms from an industry perhaps because they are not making a sufficiently high rate of return by operating in a particular market. The equilibrium price and quantity in a market will change when there shifts in both market supply and demand. Two examples of this are shown in the next diagram:
In the left-hand diagram above, we see an inward shift of supply together with a fall in demand. Both factors lead to a fall in quantity traded, but the rise in costs forces up the market price. The second example on the right shows a rise in demand from D1 to D3 but a much bigger increase in supply from S1 to S2. The net result is a fall in equilibrium price (from P1 to P3) and an increase in the equilibrium quantity traded in the market. Moving from one equilibrium to another Changes in equilibrium prices and quantities do not happen instantaneously! The shifts in supply and demand outlined in the diagrams in previous pages are reflective of changes in conditions in the market. So an outward shift of demand (depending upon supply conditions) leads to a short term rise in price
Price
Quantity
D1
S1
P1
Q1
Price
Quantity
D1
S1
P1
Q1
D3
Q2
P3
D2
Q2
P2
An Outward Shift in Demand and a Rise in Supply An Inward Shift in Demand and a fall in Supply
S2
S2
Trading floors Daily trading at the International Metal Exchange in London – which sets the prices of commodities such as tin, copper and zinc

- 44 -
© Tutor2u Limited 2008 www.tutor2u.net
and a fall in available stocks. The higher price is an incentive for suppliers to raise their output (termed as an expansion of supply) causing a movement up the short term supply curve towards the new equilibrium point. We tend to use these diagrams to illustrate movements in market prices and quantities – this is known as comparative static analysis. The reality in most markets and industries is more complex. For a start, many businesses have imperfect knowledge about their demand curves – they do not know precisely how consumer demand reacts to changes in price or the true level of demand at each and every price. Likewise, constructing accurate supply curves requires detailed information on production costs and these may not be readily available. The importance of price elasticity of demand Elasticity of demand is covered in detail in the next chapter. The price elasticity of demand will influence the effects of shifts in supply on the equilibrium price and quantity in a market. This is illustrated in the next two diagrams. In the left hand diagram below we have drawn a highly elastic demand curve. We see an outward shift of supply – which leads to a large rise in equilibrium price and quantity and only a relatively small change in the market price. In the right hand diagram, a similar increase in supply is drawn together with an inelastic demand curve. Here the effect is more on the price. There is a sharp fall in the price and only a relatively small expansion in the equilibrium quantity.
Price
Quantity
S2
Q2
D1
Q1
P2
An outward shift of supply when demand is price elastic (Ped > 1)
S1
P1
Price
Quantity
S2
Q2
D1
Q1
P2
S1
P1
An outward shift of supply when demand is price inelastic (Ped < 1)
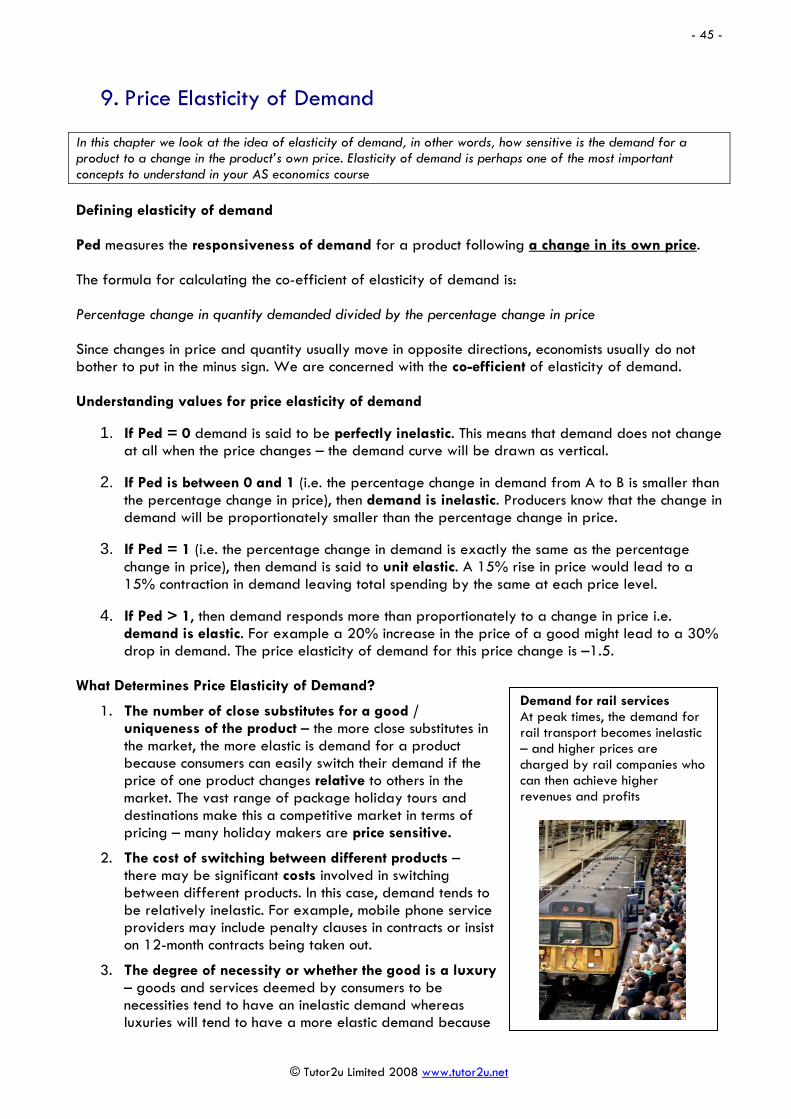
- 45 -
© Tutor2u Limited 2008 www.tutor2u.net
9. Price Elasticity of Demand In this chapter we look at the idea of elasticity of demand, in other words, how sensitive is the demand for a product to a change in the product’s own price. Elasticity of demand is perhaps one of the most important concepts to understand in your AS economics course Defining elasticity of demand Ped measures the responsiveness of demand for a product following a change in its own price. The formula for calculating the co-efficient of elasticity of demand is: Percentage change in quantity demanded divided by the percentage change in price Since changes in price and quantity usually move in opposite directions, economists usually do not bother to put in the minus sign. We are concerned with the co-efficient of elasticity of demand. Understanding values for price elasticity of demand
1. If Ped = 0 demand is said to be perfectly inelastic. This means that demand does not change at all when the price changes – the demand curve will be drawn as vertical.
2. If Ped is between 0 and 1 (i.e. the percentage change in demand from A to B is smaller than the percentage change in price), then demand is inelastic. Producers know that the change in demand will be proportionately smaller than the percentage change in price.
3. If Ped = 1 (i.e. the percentage change in demand is exactly the same as the percentage change in price), then demand is said to unit elastic. A 15% rise in price would lead to a 15% contraction in demand leaving total spending by the same at each price level.
4. If Ped > 1, then demand responds more than proportionately to a change in price i.e. demand is elastic. For example a 20% increase in the price of a good might lead to a 30% drop in demand. The price elasticity of demand for this price change is –1.5.
What Determines Price Elasticity of Demand?
1. The number of close substitutes for a good / uniqueness of the product – the more close substitutes in the market, the more elastic is demand for a product because consumers can easily switch their demand if the price of one product changes relative to others in the market. The vast range of package holiday tours and destinations make this a competitive market in terms of pricing – many holiday makers are price sensitive.
2. The cost of switching between different products – there may be significant costs involved in switching between different products. In this case, demand tends to be relatively inelastic. For example, mobile phone service providers may include penalty clauses in contracts or insist on 12-month contracts being taken out.
3. The degree of necessity or whether the good is a luxury – goods and services deemed by consumers to be necessities tend to have an inelastic demand whereas luxuries will tend to have a more elastic demand because
Demand for rail services At peak times, the demand for rail transport becomes inelastic – and higher prices are charged by rail companies who can then achieve higher revenues and profits

- 46 -
© Tutor2u Limited 2008 www.tutor2u.net
consumers can make do without luxuries when their budgets are stretched. I.e. in a recession we can cut back on discretionary items of spending.
4. The % of a consumer’s income allocated to spending on the good – goods and services that take up a high proportion of a household’s income will tend to have a more elastic demand than products where large price changes makes little or no difference to someone’s ability to purchase the product.
5. The time period allowed following a price change – demand tends to be more price elastic, the longer that we allow consumers to respond to a price change by varying their purchasing decisions. In the short run, the demand may be inelastic, because it takes time for consumers both to notice and then to respond to price fluctuations.
6. Whether the good is subject to habitual consumption – when this occurs, the consumer becomes much less sensitive to the price of the good in question. Examples such as cigarettes and alcohol and other drugs come into this category.
7. Peak and off-peak demand - demand tends to be price inelastic at peak times and more elastic at off-peak times, leading to lower prices for consumers. Consider for example the charges made by car rental firms during the course of a week, or the cheaper deals available at hotels at weekends and away from the high-season. Train fares are also higher on Fridays (a peak day for travelling between cities) and also at peak times during the day.
8. The breadth of definition of a good or service – if a good is broadly defined, i.e. the demand for petrol or meat, demand is often fairly inelastic. But specific brands of petrol or beef are likely to be more elastic following a price change.
Wi-Fi prices and price elasticity of demand From airports to hotels to conference centres. From inter-city rail services to sports stadiums and libraries, more people are demanding wireless internet connections for personal and business use. But demand is being constrained by the limited availability of services and, in places, high user charges. However the price of connecting to the internet through Wi-Fi services is set to fall as competition in the sector heats up. Nearly 90 per cent of laptops now come with wi-fi connections as standard and many public areas are being equipped with hotspots, but users often complain about the high price of accessing the internet. At present airports and hotels can charge high prices because in many cases a wi-fi service provider has exclusivity on the area. However the supply of wi-fi services is more competitive on the high street and prices are falling as restaurants and coffee shops are using low-priced wi-fi access as a means of attracting customers. The more wi-fi providers there are in the market-place, the higher is the price elasticity of demand for wi-fi connections. Note: WiFi stands for Wireless Fidelity
Source: The Cloud and GFK UK Technology Barometer, 2006

- 47 -
© Tutor2u Limited 2008 www.tutor2u.net
Demand curves with different price elasticity of demand
Elasticity of demand and total revenue for a producer The relationship between elasticity of demand and a firm’s total revenue is a very important one. The diagrams below show demand curves with different price elasticity and the effect of a change in the market price.
Price
Demand
P1
P2
Q1 Q2
Price
Demand
P1
P2
Q1 Q2
Relatively Inelastic Demand Relatively Elastic Demand
Price
Demand
P1
P2
P3
Q1 Q2 Q3
Price
Demand
P1 P2
P3
Q1 Q2 Q3
Relatively Inelastic Demand Relatively Elastic Demand
Elasticity of demand measures the responsiveness of demand to changes in price Where the % change in demand is greater than % change in price – demand is elastic Where the % change in demand is less than % change in price – demand is inelastic
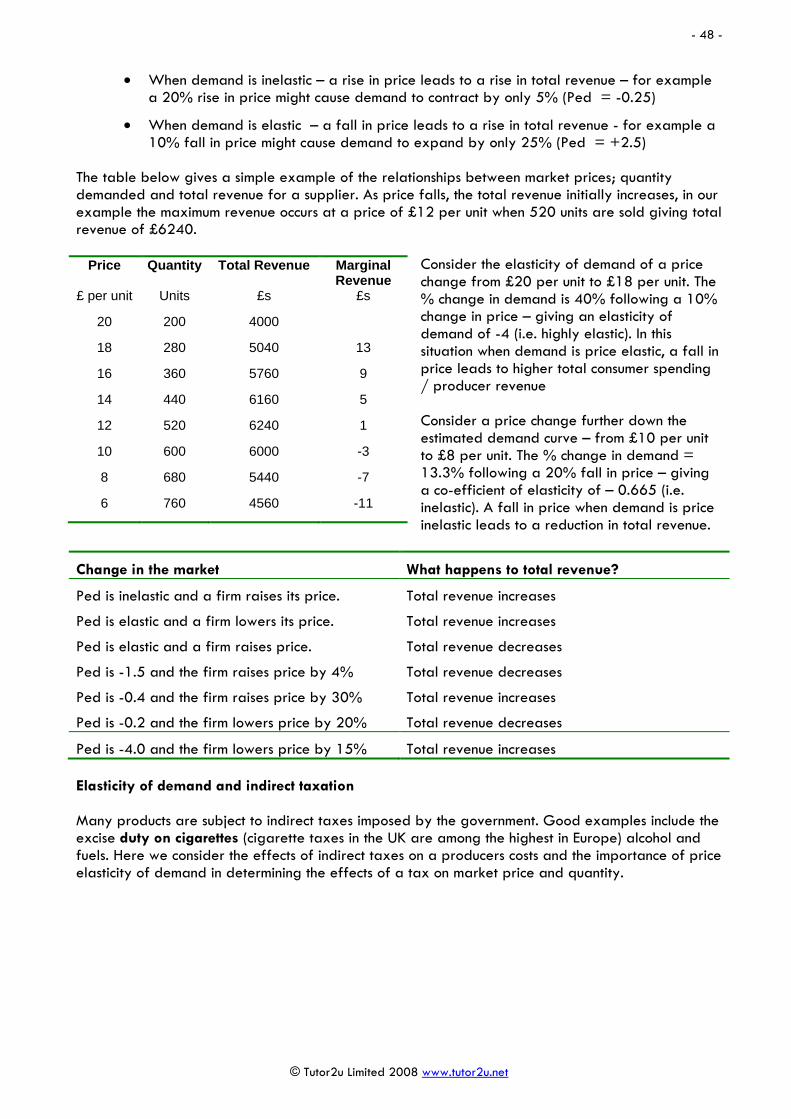
- 48 -
© Tutor2u Limited 2008 www.tutor2u.net
• When demand is inelastic – a rise in price leads to a rise in total revenue – for example a 20% rise in price might cause demand to contract by only 5% (Ped = -0.25)
• When demand is elastic – a fall in price leads to a rise in total revenue - for example a 10% fall in price might cause demand to expand by only 25% (Ped = +2.5)
The table below gives a simple example of the relationships between market prices; quantity demanded and total revenue for a supplier. As price falls, the total revenue initially increases, in our example the maximum revenue occurs at a price of £12 per unit when 520 units are sold giving total revenue of £6240.
Consider the elasticity of demand of a price change from £20 per unit to £18 per unit. The % change in demand is 40% following a 10% change in price – giving an elasticity of demand of -4 (i.e. highly elastic). In this situation when demand is price elastic, a fall in price leads to higher total consumer spending / producer revenue Consider a price change further down the estimated demand curve – from £10 per unit to £8 per unit. The % change in demand = 13.3% following a 20% fall in price – giving a co-efficient of elasticity of – 0.665 (i.e. inelastic). A fall in price when demand is price inelastic leads to a reduction in total revenue.
Change in the market What happens to total revenue?
Ped is inelastic and a firm raises its price. Total revenue increases
Ped is elastic and a firm lowers its price. Total revenue increases
Ped is elastic and a firm raises price. Total revenue decreases
Ped is -1.5 and the firm raises price by 4% Total revenue decreases
Ped is -0.4 and the firm raises price by 30% Total revenue increases
Ped is -0.2 and the firm lowers price by 20% Total revenue decreases
Ped is -4.0 and the firm lowers price by 15% Total revenue increases Elasticity of demand and indirect taxation Many products are subject to indirect taxes imposed by the government. Good examples include the excise duty on cigarettes (cigarette taxes in the UK are among the highest in Europe) alcohol and fuels. Here we consider the effects of indirect taxes on a producers costs and the importance of price elasticity of demand in determining the effects of a tax on market price and quantity.
Price Quantity Total Revenue Marginal Revenue
£ per unit Units £s £s
20 200 4000
18 280 5040 13
16 360 5760 9
14 440 6160 5
12 520 6240 1
10 600 6000 -3
8 680 5440 -7
6 760 4560 -11

- 49 -
© Tutor2u Limited 2008 www.tutor2u.net
A tax increases the costs of a business causing an inward shift in the supply curve. The vertical distance between the pre-tax and the post-tax supply curve shows the tax per unit. With an indirect tax, the supplier may be able to pass on some or all of this tax onto the consumer through a higher price. This is known as shifting the burden of the tax and this depends on the price elasticity of demand and supply. Consider the two charts above. In the left hand diagram, the demand curve is drawn as price elastic. The producer must absorb the majority of the tax itself (i.e. accept a lower profit margin on each unit sold). When demand is elastic, the effect of a tax is still to raise the price – but we see a bigger fall in equilibrium quantity. Output has fallen from Q to Q1 due to a contraction in demand. In the right hand diagram, demand is drawn as price inelastic (i.e. Ped <1 over most of the range of this demand curve) and therefore the producer is able to pass on most of the tax to the consumer through a higher price without losing too much in the way of sales. The price rises from P1 to P2 – but a large rise in price leads only to a small contraction in demand from Q1 to Q2. The usefulness of price elasticity for producers Firms can use price elasticity of demand (PED) estimates to predict:
• The effect of a change in price on the total revenue & expenditure on a product.
• The likely price volatility in a market following changes in supply – this is important for commodity producers who may suffer big price movements from time to time.
• The effect of a change in a government indirect tax on price and quantity demanded and also whether the business is able to pass on some or all of the tax onto the consumer.
• Information on the price elasticity of demand can be used by a business as part of a policy of price discrimination (also known as ‘yield management’). This is where a monopoly supplier decides to charge different prices for the same product to different segments of the market e.g. peak and off peak rail travel or yield management by many of our domestic and international airlines.
Price
Quantity
S1
Q1
Price
Quantity
D1
S + Tax
P2
Q2 Q1
P1 D1
Q2
P1
A Tax when Demand is Price Inelastic Most of the tax is paid by the consumer
A Tax When Demand is Price Elastic Most of the tax is paid by producer
S + Tax
P2
S1

- 50 -
© Tutor2u Limited 2008 www.tutor2u.net
Habitual spending on cigarettes remains high but sales are falling Sales of cigarettes are falling by the impact of higher taxes mean that smokers must spend more to finance their habits according to new research from the market analyst Mintel. Total sales of individual sticks for the UK in 2006 are forecast to be 68 billion, eleven billion lower than in 2001. Over a quarter of cigarettes are brought into the UK either duty free or through the black market. Total consumer spending on duty-paid cigarettes is likely to exceed £13 billion, 13% higher than in 2001. In the past, increases in the real value of duty (taxation) on cigarettes has had had little effect on demand from smokers because demand has been inelastic. But there are signs that a tipping point may have been reached. Sales of nicotine replacement therapies such as patches, lozenges and gums have boomed by nearly 50% over the past five years to around £97 million. But for every £1 spent on nicotine replacement, over £130 is spent on cigarette sticks. Nearly half of smokers tried to kick the habit last year. According to the Mintel research, smokers under the age of 34 are the most likely to stop smoking, with people aged 65 and over the least likely to try quitting. A ban on smoking in public places comes into force in England, Northern Ireland and Wales in the spring of 2007, the same ban became law in Scotland in March 2006.
Sources: Adapted from Mintel Research, the Guardian and the Press Association
Index of prices, 1997=100The rising real price of tobacco in the UK
Source: Reuters EcoWin
96 97 98 99 00 01 02 03 04 05 06 07
90
100
110
120
130
140
150
160
170
180
1997
= 1
00
90
100
110
120
130
140
150
160
170
180
Tobacco
Consumer Price Index
Suggested reading on price elasticity of demand Each of these articles relates to stories in the news where prices have changed and where we might expect a change in demand. In each case consider the likely price elasticity of demand. Station car park charges to rise (BBC news, July 2006) Food prices on the rise and rise (BBC news, July 2007) London house prices hit £313,000 (BBC news, July 2007)

- 51 -
© Tutor2u Limited 2008 www.tutor2u.net
10. Price Elasticity of Supply In this chapter we consider elasticity of supply. Students should understand how to calculate elasticity of supply and understand some of the factors that influence the elasticity of supply for different products. Definition of price elasticity of supply Price elasticity of supply measures the relationship between change in quantity supplied and a change in price.
• If supply is elastic, producers can increase output without a rise in cost or a time delay
• If supply is inelastic, firms find it hard to change production in a given time period. The formula for price elasticity of supply is: Percentage change in quantity supplied divided by the percentage change in price
1. When Pes > 1, then supply is price elastic
2. When Pes < 1, then supply is price inelastic
3. When Pes = 0, supply is perfectly inelastic
4. When Pes = infinity, supply is perfectly elastic following a change in demand Factors that Affect Price Elasticity of Supply (1) Spare production capacity If there is plenty of spare capacity then a business should be able to increase its output without a rise in costs and therefore supply will be elastic in response to a change in demand. The supply of goods and services is often most elastic in a recession, when there is plenty of spare labour and capital resources available to step up output as the economy recovers. (2) Stocks of finished products and components If stocks of raw materials and finished products are at a high level then a firm is able to respond to a change in demand quickly by supplying these stocks onto the market - supply will be elastic. Conversely when stocks are low, dwindling supplies force prices higher and unless stocks can be replenished, supply will be inelastic in response to a change in demand. (3) The ease and cost of factor substitution If both capital and labour resources are occupationally mobile then the elasticity of supply for a product is higher than if capital and labour cannot easily and quickly be switched (4) Time period involved in the production process Supply is more price elastic the longer the time period that a firm is allowed to adjust its production levels. In some agricultural markets for example, the momentary supply is fixed and is determined mainly by planting decisions made months before, and also climatic conditions, which affect the overall production yield.

- 52 -
© Tutor2u Limited 2008 www.tutor2u.net
An empty restaurant – plenty of spare capacity to meet any rise in demand!
When telecommunications networks get congested at peak times, the elasticity of supply
to meet rising demand may be low
Stocks in a warehouse – businesses with plentiful stocks can supply quickly and easily onto the
market when demand changes
For many agricultural products there are time lags in the production process which means that elasticity of supply is very low in the immediate
or momentary time period
Price
Quantity
Price
Quantity
Perfectly elastic supply An elastic supply curve
D2 D1
P1
D2 D1
S S
Q1 Q2 Q1 Q2
If Pes is inelastic: it will be difficult for suppliers to react swiftly to changes in price If Pes is elastic – supply can react quickly to changes in price

- 53 -
© Tutor2u Limited 2008 www.tutor2u.net
The non-linear supply curve A non linear supply curve has a changing price elasticity of supply throughout its length. This is illustrated in the diagram below.
Useful applications of price elasticity of demand and supply Elasticity of demand and supply is tested in virtually every area of the AS economics syllabus. The key is to understand the various factors that determine the responsiveness of consumers and producers to changes in price. The elasticity will affect the ways in which price and output will change in a market. And elasticity is also significant in determining some of the effects of changes in government policy when the state chooses to intervene in the price mechanism.
Price
Quantity
P2
P3
P1
Q2 Q1 Q3
P4
P5
Supply
Q4 Q5
D1
D2
D3
D4
D5
Pes > 1
Pes < 1
Price
Quantity
Price
Quantity
Inelastic Supply Curve Perfectly inelastic supply
P1
P2
Q1 Q1 Q2
D1
D2 D1 D2
Perfectly inelastic supply: Pes = zero (supply cannot respond to a change in demand / price) – often associated with the momentary period with agricultural products

- 54 -
© Tutor2u Limited 2008 www.tutor2u.net
Some relevant issues that directly use elasticity of demand and supply include:
1. Taxation: The effects of indirect taxes and subsidies on the level of demand and output in a market e.g. the effectiveness of the congestion charge in reducing road congestion; or the impact of higher duties on cigarettes on the demand for tobacco and associated externality effects
2. Changes in the exchange rate: The impact of changes in the exchange rate on the demand for exports and imports
3. Exploiting monopoly power in a market: The extent to which a firm or firms with monopoly power can raise prices in markets to extract consumer surplus and turn it into extra profit (producer surplus)
4. Government intervention in the market: The effects of the government introducing a minimum price (price floor) or maximum price (price ceiling) into a market
Elasticity of demand and supply also affects the operation of the price mechanism as a means of rationing scarce goods and services among competing uses and in determining how producers respond to the incentive of a higher market price.
11. Income Elasticity of Demand How sensitive is the demand for a product to a change in the real incomes of consumers? We use income elasticity of demand to measure this. Definition of income elasticity of demand Income elasticity of demand measures the relationship between a change in quantity demanded for good X and a change in real income. The formula for calculating income elasticity is: % change in demand divided by the % change in income Normal Goods Normal goods have a positive income elasticity of demand so as consumers’ income rises more is demanded at each price i.e. there is an outward shift of the demand curve
1. Normal necessities have an income elasticity of demand of between 0 and +1 for example, if income increases by 10% and the demand for fresh fruit increases by 4% then the income elasticity is +0.4. Demand is rising less than proportionately to income.
2. Luxury goods and services have an income elasticity of demand > +1 i.e. demand rises more than proportionate to a change in income – for example a 8% increase in income might lead to a 10% rise in the demand for restaurant meals. The income elasticity of demand in this example is +1.25. Demand is sensitive to increases or decreases in income.
Inferior Goods Inferior goods have a negative income elasticity of demand meaning that demand falls as income rises. Typically inferior goods or services tend to be products where superior goods are available if the consumer has the money to be able to buy it. Examples include the demand for cigarettes, low-priced own label foods in supermarkets and the demand for council-owned properties. The income elasticity of demand is usually strongly positive for
• Fine wines and spirits, high quality chocolates (e.g. Lindt) and luxury holidays overseas.
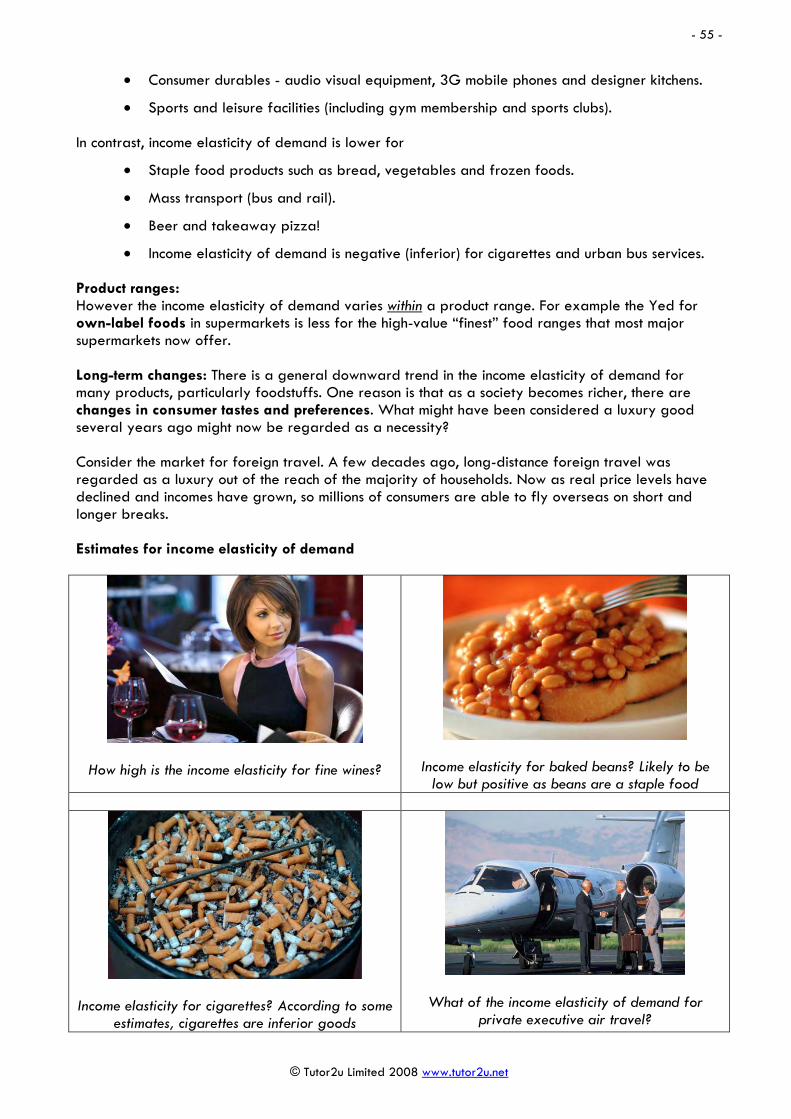
- 55 -
© Tutor2u Limited 2008 www.tutor2u.net
• Consumer durables - audio visual equipment, 3G mobile phones and designer kitchens.
• Sports and leisure facilities (including gym membership and sports clubs). In contrast, income elasticity of demand is lower for
• Staple food products such as bread, vegetables and frozen foods.
• Mass transport (bus and rail).
• Beer and takeaway pizza!
• Income elasticity of demand is negative (inferior) for cigarettes and urban bus services. Product ranges: However the income elasticity of demand varies within a product range. For example the Yed for own-label foods in supermarkets is less for the high-value “finest” food ranges that most major supermarkets now offer. Long-term changes: There is a general downward trend in the income elasticity of demand for many products, particularly foodstuffs. One reason is that as a society becomes richer, there are changes in consumer tastes and preferences. What might have been considered a luxury good several years ago might now be regarded as a necessity? Consider the market for foreign travel. A few decades ago, long-distance foreign travel was regarded as a luxury out of the reach of the majority of households. Now as real price levels have declined and incomes have grown, so millions of consumers are able to fly overseas on short and longer breaks. Estimates for income elasticity of demand
How high is the income elasticity for fine wines?
Income elasticity for baked beans? Likely to be low but positive as beans are a staple food
Income elasticity for cigarettes? According to some estimates, cigarettes are inferior goods
What of the income elasticity of demand for private executive air travel?
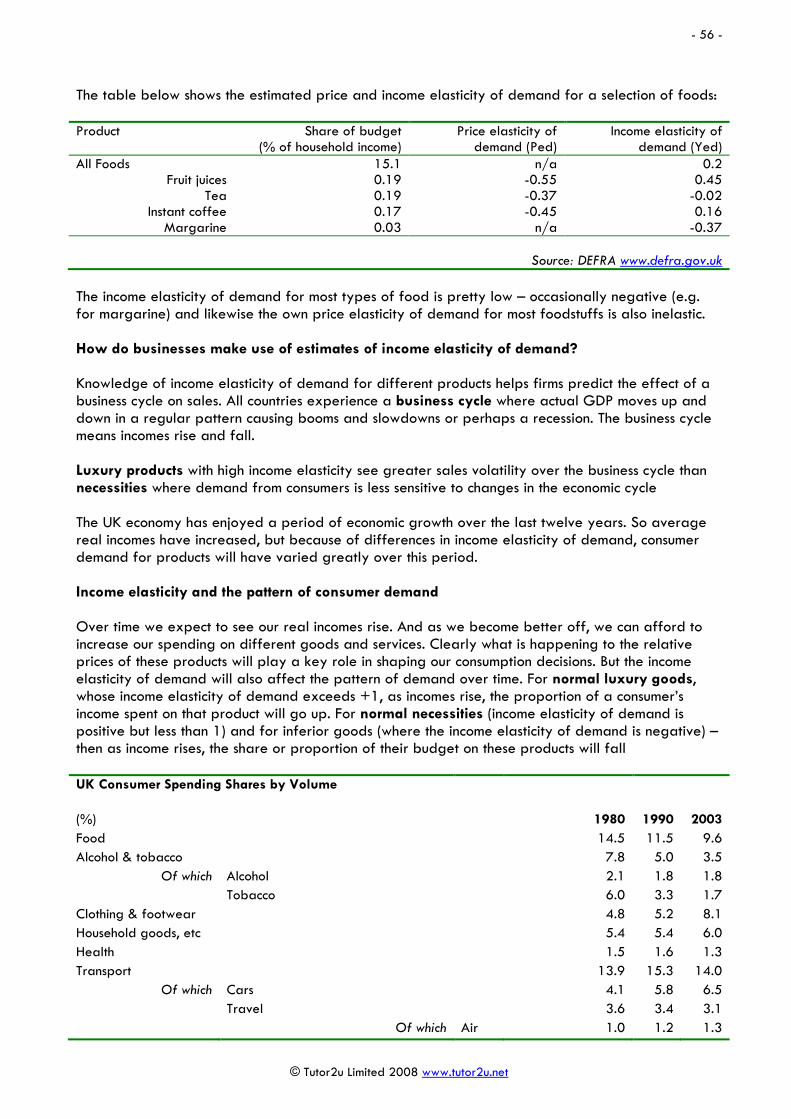
- 56 -
© Tutor2u Limited 2008 www.tutor2u.net
The table below shows the estimated price and income elasticity of demand for a selection of foods: Product Share of budget
(% of household income) Price elasticity of
demand (Ped) Income elasticity of
demand (Yed) All Foods 15.1 n/a 0.2
Fruit juices 0.19 -0.55 0.45 Tea 0.19 -0.37 -0.02
Instant coffee 0.17 -0.45 0.16 Margarine 0.03 n/a -0.37
Source: DEFRA www.defra.gov.uk
The income elasticity of demand for most types of food is pretty low – occasionally negative (e.g. for margarine) and likewise the own price elasticity of demand for most foodstuffs is also inelastic. How do businesses make use of estimates of income elasticity of demand? Knowledge of income elasticity of demand for different products helps firms predict the effect of a business cycle on sales. All countries experience a business cycle where actual GDP moves up and down in a regular pattern causing booms and slowdowns or perhaps a recession. The business cycle means incomes rise and fall. Luxury products with high income elasticity see greater sales volatility over the business cycle than necessities where demand from consumers is less sensitive to changes in the economic cycle The UK economy has enjoyed a period of economic growth over the last twelve years. So average real incomes have increased, but because of differences in income elasticity of demand, consumer demand for products will have varied greatly over this period. Income elasticity and the pattern of consumer demand Over time we expect to see our real incomes rise. And as we become better off, we can afford to increase our spending on different goods and services. Clearly what is happening to the relative prices of these products will play a key role in shaping our consumption decisions. But the income elasticity of demand will also affect the pattern of demand over time. For normal luxury goods, whose income elasticity of demand exceeds +1, as incomes rise, the proportion of a consumer’s income spent on that product will go up. For normal necessities (income elasticity of demand is positive but less than 1) and for inferior goods (where the income elasticity of demand is negative) – then as income rises, the share or proportion of their budget on these products will fall UK Consumer Spending Shares by Volume (%) 1980 1990 2003 Food 14.5 11.5 9.6 Alcohol & tobacco 7.8 5.0 3.5
Of which Alcohol 2.1 1.8 1.8 Tobacco 6.0 3.3 1.7 Clothing & footwear 4.8 5.2 8.1 Household goods, etc 5.4 5.4 6.0 Health 1.5 1.6 1.3 Transport 13.9 15.3 14.0
Of which Cars 4.1 5.8 6.5 Travel 3.6 3.4 3.1 Of which Air 1.0 1.2 1.3

- 57 -
© Tutor2u Limited 2008 www.tutor2u.net
Communications 1.4 1.6 3.1 Recreation & culture 7.8 10.0 15.5 Travel Other, including package holidays 2.0 2.7 4.5 Education 1.4 1.1 1.2 Restaurants & hotels 12.7 12.6 9.3
Source: Family Expenditure Survey
Lowest
decile group
5th decile group
Highest decile group
Highest / lowest decile ratio
Pence per person per
week
Pence per
person per
week
Pence per person per
week
Dried fruit and nuts 0.10 0.40 0.70 4.8 Fruit and vegetable juices, mineral waters 0.50 1.00 2.30 4.7 Fresh vegetables 1.40 2.60 5.70 4.1 Chocolate 0.60 1.20 1.70 3.1 Coffee 0.30 0.50 0.60 2.5 Milk 1.40 2.10 2.50 1.8 Tea 0.30 0.50 0.50 1.7 Average spending per week on food and drink 21.30 40.10 66.90 3.1
Source: UK Expenditure and Food Survey, 2004
Households in Britain spend on average £443 per week Within this total, consumer spending was highest in the transport category; with an average spend of almost £62 a week. The second highest category of spending was on recreation and culture, e.g. televisions, computers, newspapers, books, leisure activities and package holidays, at £58 a week. An average of £17.90 a week was spent on recreational and cultural services such as spectator and participant sports and cinema and live entertainment. Food and non-alcoholic drink purchases contributed £45 to weekly household expenditure, £10.10 of which went on meat, £3.40 on fresh vegetables and £2.80 on fresh fruit. Non-alcoholic drinks accounted for £3.80 a week and £1.80 was spent on chocolate and confectionery each week.
Source: Office of National Statistics

- 58 -
© Tutor2u Limited 2008 www.tutor2u.net
12. Cross Price Elasticity of Demand Often, a change in the price of one product leads to a change in the demand for another, economists call this the cross-price effect and this is the focus of this chapter. Cross price elasticity (CPed) measures the responsiveness of demand for good X following a change in the price of good Y (a related good). We are mainly concerned here with the effect that changes in relative prices within a market have on the pattern of demand. With cross price elasticity we make a distinction between substitute products and complementary goods and services Substitutes: With substitute goods such as brands of cereal or washing powder, an increase in the price of one good will lead to an increase in demand for the rival product. The cross price elasticity for two substitutes will be positive. For example, in recent years, the prices of new cars have been either falling or relatively flat. Data on price indices for new cars and second hand cars is shown in the chart below. As the price of new cars relative to people’s incomes has declined, this should increase the market demand for new cars and reduce the demand for second hand cars. We can see that there has been a very marked fall in the prices of second hand cars.
Price index, 1996 = 100Prices of Vehicles in the UK
Source: Reuters EcoWin
96 97 98 99 00 01 02 03 04 05 06 07
90
95
100
105
110
115
120
125
130
135
2005
=100
90
95
100
105
110
115
120
125
130
135
New Car Prices
Second hand cars
Another good example is the cross price elasticity of demand for music. Sales of digital music downloads have been soaring with the growth of broadband and falling prices for downloads. As a result, sales of traditional music CDs are declining at a steep rate. British CD sales drop 10% in 2007: http://news.bbc.co.uk/1/hi/entertainment/6284914.stm

- 59 -
© Tutor2u Limited 2008 www.tutor2u.net
Complements: With goods that are in complementary demand, such as the demand for DVD players and DVD videos, when there is a fall in the price of DVD players we expect to see more DVD players bought, leading to an expansion in demand for DVD videos. The cross price elasticity of demand for two complements is negative The stronger the relationship between two products, the higher is the co-efficient of cross-price elasticity of demand. For example with two close substitutes, the cross-price elasticity will be strongly positive. Likewise when there is a strong complementary relationship between two products, the cross-price elasticity will be highly negative. Unrelated products have a zero cross elasticity. Complementary goods - the UK IT market The value of the UK IT market was estimated to be worth £3.9 billion in the first six months of 2006. It provides a good example of complementary products since a rise in the demand for one product such as a new personal computer will frequently be associated with an increase in demand for related goods and services. The IT market is usually split into seven sectors and their estimated value measured by the level of total sales revenue in the first half of 2006 is shown below Personal Computers (desktops and laptops) (£1,443m) Printing devices (£303m) Monitors (£343m) Consumables such as ink cartridges (£813m) Hard disk drives (£130m) Communication devices (£122m) Computer software (£239m)
Source: GFK report on Consumer Spending Trends, July 2006 How can businesses make use of the concept of cross price elasticity of demand? Pricing strategies for substitutes: If a competitor cuts the price of a rival product, firms use estimates of cross-price elasticity to predict the effect on the quantity demanded and total revenue of their own product. For example, two or more airlines competing with each other on a given route will have to consider how one airline might react to its competitor’s price change. Will many consumers switch? Will they have the capacity to meet an expected rise in demand? Will the other firm match a price rise? Will it follow a price fall? Consider for example the cross-price effect that has occurred with the rapid expansion of low-cost airlines in the European airline industry. This has been a major challenge to the existing and well-established national air carriers, many of whom have made adjustments to their business model and pricing strategies to cope with the increased competition. Pricing strategies for complementary goods: For example, popcorn, soft drinks and cinema tickets have a high negative value for cross elasticity– they are strong complements. Popcorn has a high mark up i.e. pop corn costs pennies to make but sells for more than a pound. If firms have a reliable estimate for Cped they can estimate the effect, say, of a two-for-one cinema ticket offer on the demand for popcorn. The additional profit from extra popcorn sales may more than compensate for the lower cost of entry into the cinema. For some movie theatres, the revenue from concessions stalls selling popcorn; drinks et al can generate as much as 40 per cent of their annual turnover.
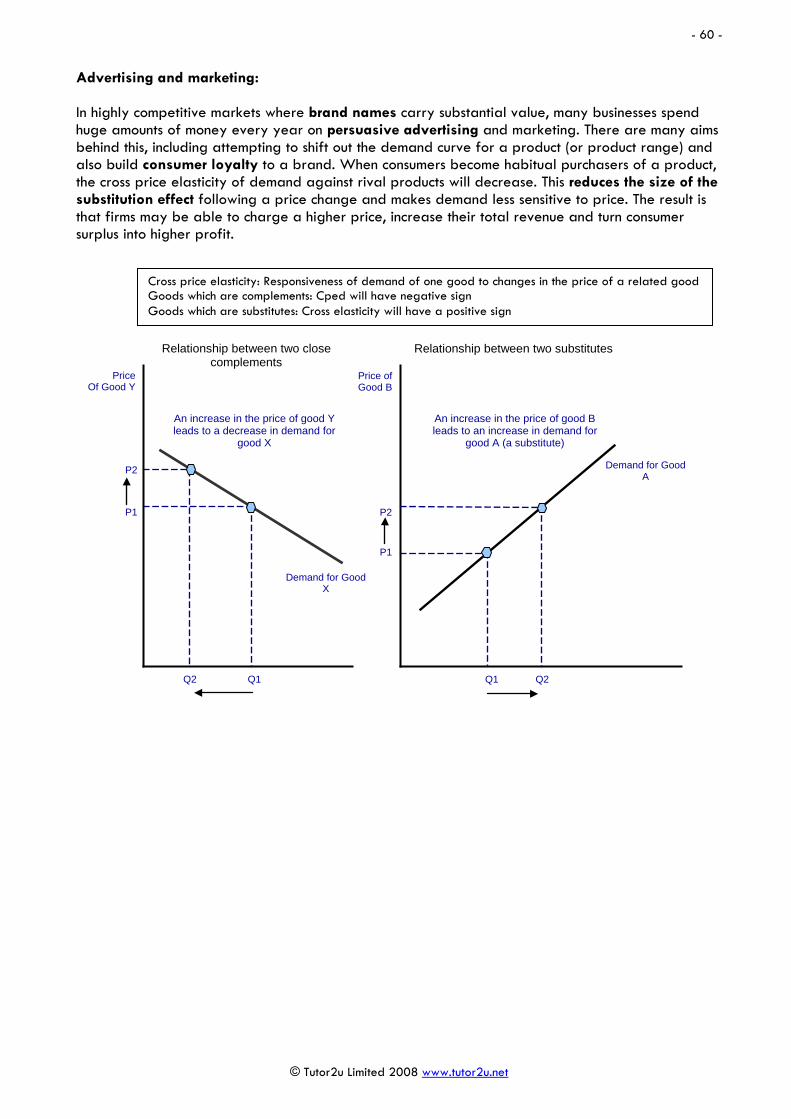
- 60 -
© Tutor2u Limited 2008 www.tutor2u.net
Advertising and marketing: In highly competitive markets where brand names carry substantial value, many businesses spend huge amounts of money every year on persuasive advertising and marketing. There are many aims behind this, including attempting to shift out the demand curve for a product (or product range) and also build consumer loyalty to a brand. When consumers become habitual purchasers of a product, the cross price elasticity of demand against rival products will decrease. This reduces the size of the substitution effect following a price change and makes demand less sensitive to price. The result is that firms may be able to charge a higher price, increase their total revenue and turn consumer surplus into higher profit.
Price Of Good Y
Demand for Good X
P1
P2
Q1 Q2
Price of Good B
Demand for Good A
P2
P1
Q2 Q1
Relationship between two close complements
Relationship between two substitutes
An increase in the price of good Y leads to a decrease in demand for
good X
An increase in the price of good B leads to an increase in demand for
good A (a substitute)
Cross price elasticity: Responsiveness of demand of one good to changes in the price of a related good Goods which are complements: Cped will have negative sign Goods which are substitutes: Cross elasticity will have a positive sign

- 61 -
© Tutor2u Limited 2008 www.tutor2u.net
13. The Functions of the Price Mechanism The invisible hand – the workings of the price mechanism
Adam Smith, one of the Founding Fathers of economics famously wrote of the “invisible hand of the price mechanism”. He described how the invisible or hidden hand of the market operated in a competitive market through the pursuit of self-interest to allocate resources in society’s best interest. This remains the central view of all free-market economists, i.e. those who believe in the virtues of a free-market economy with minimal government intervention. The price mechanism is a term used to describe the means by which the many millions of decisions taken each day by consumers and businesses interact to determine the allocation of scarce resources between competing uses. This is the essence of economics!
The price mechanism plays three important functions in any market-based economic system: The signalling function
Firstly, prices perform a signalling function. This means that market prices will adjust to demonstrate where resources are required, and where they are not. Prices rise and fall to reflect scarcities and surpluses. So, for example, if market prices are rising because of high and rising demand from consumers, this is a signal to suppliers to expand their production to meet the higher demand. Consider the left hand diagram on the next page. The demand for computer games increases and as a result, producers stand to earn higher revenues and profits from selling more games at a higher price per unit. So an outward shift of demand ought to lead to an expansion along the market supply curve.
The price of digital printing is coming down – this will have an effect on the demand for substitute forms of image printing. How will traditional photo imaging retailers respond?

- 62 -
© Tutor2u Limited 2008 www.tutor2u.net
In the second example on the right, an increase in market supply causes a fall in the relative prices of digital cameras and prompts an expansion along the market demand curve Conversely, a rise in the costs of production will induce suppliers to decrease supply, while consumers will react to the resulting higher price by reducing demand for the good or services. The transmission of preferences Through the signalling function, consumers are able through their expression of preferences to send important information to producers about the changing nature of our needs and wants. When demand is strong, higher market prices act as an incentive to raise output (production) because the supplier stands to make a higher profit. When demand is weak, then the market supply contracts. We are assuming here that producers do actually respond to these price signals! One of the features of a free market economy is that decision-making in the market is decentralised in other words, the market responds to the individual decisions of millions of consumers and producers, i.e. there is no single body responsible for deciding what is to be produced and in what quantities. This is a remarkable feature of an organic market system. The rationing function Prices serve to ration scarce resources when demand in a market outstrips supply. When there is a shortage of a product, the price is bid up – leaving only those with sufficient willingness and ability to pay with the effective demand necessary to purchase the product. Be it the demand for tickets among England supporters for the 2006 World Cup or the demand for a rare antique, the market price acts a rationing device to equate demand with supply. The prices for using the M6 Toll Road are a good example of the rationing function of the price mechanism. A toll road can exclude those drivers and vehicles that are not willing or able to pay the
Price of Computer
Games
Quantity
S1
Price of Digital Cameras
Quantity
D1
D2
S1
P2
P1 P1
P2
Q1 Q2
D2
S2
Q1 Q2
Higher demand signals to producers to step up production – if they are driven by the profit motive. Total revenue is higher at price P2 and output Q2
In this diagram, an increase in supply leads to lower market prices – a signal to consumers that their real income has increased – they can afford to buy more

- 63 -
© Tutor2u Limited 2008 www.tutor2u.net
current toll charge. In this sense, motorists and road haulage businesses and other road users are paying for the right to use the road, road space has a market price instead of being regarded as something of a free good. The current charges are below: Prices on the M6 Toll Road June 2006
Day (06:00 - 23:00)
Night (23:00 - 06:00)
Class 1 (e.g. motorbike) £2.50 £1.50
Class 2 (e.g. car) £3.50 £2.50
Class 3 (e.g. car & trailer) £7 £6
Class 4 (e.g. van/coach) £7 £6
Class 5 (e.g. HGV) £7 £6
What would happen if the day-time charges increased to £5 for cars? The popularity of auctions as a means of allocating resources is worth considering as a means of allocating resources and clearing a market. The success of eBay is testimony to the power of the auction process as a rationing and market clearing mechanism as internet usage has grown. The price mechanism is the only allocative mechanism solving the economic problem in a free market economy. However, most modern economies are mixed economies, comprising not only a market sector, but also a non-market sector, where the government (or state) uses the planning mechanism to provide public goods and services such as police, roads and merit goods such as education, libraries and health. In a state run command economy, the price mechanism plays little or no active role in the allocation of resources. Instead government planning directs resources to where the state thinks there is greatest need. The reality is that state planning has more or less failed as a means of deciding what to produce, how much to produce, how to produce and for whom. Following the collapse of communism in the late 1980s and early 1990s, the market-based economy is now the dominant economic system – even though we are increasingly aware of imperfections in the operation of the market – i.e. the causes and consequences of market failure. Prices and incentives
• Incentives matter enormously in our study of microeconomics, markets and instances of market failure. For competitive markets to work efficiently all ‘economic agents’ (i.e. consumers and producers) must respond to appropriate price signals in the market.
• Market failure occurs when the signalling and incentive functions of the price mechanism fail
to operate optimally leading to a loss of economic and social welfare. For example, the market may fail to take into account the external costs and benefits arising from production and consumption. Consumer preferences for goods and services may be based on imperfect information on the costs and benefits of a particular decision to buy and consume a product. Our individual preferences may also be distorted and shaped by the effects of persuasive advertising and marketing to create artificial wants and needs.

- 64 -
© Tutor2u Limited 2008 www.tutor2u.net
Government intervention in the market Often the incentives that consumers and producers have can be changed by government intervention in markets. For example a change in relative prices brought about by the introduction of government subsidies and taxation. Suppose for example that the government decides to introduce a tax on aviation fuel in a bid to reduce some of the negative externalities created by the air transport industry.
1. How will airlines respond?
a. Will they pass on the tax to consumers?
b. Can they absorb the tax and seek cost-savings elsewhere in their operations?
2. If the tax raises price for air travellers, will they change their behaviour in the market?
3. Is an aviation tax the most effective way of controlling pollution? Or could incentives for producers and behaviour by consumers wanting to travel by air be changed through other more effective and efficient means?
Agents may not always respond to incentives in the manner in which textbook economics suggests. The “law of unintended consequences” encapsulates the idea that government policy interventions can often be misguided of have unintended consequences! See the revision focus article on government failure.
Price
Quantity
S1
Q1
Price
Quantity
D1
Supply
P1
Q2 Q1
P2
D1
Q2
P1
S + Tax
P2
Indirect Taxes An indirect tax increases the relative price of a product and should cause a contraction of demand. The government is intervening in the market because it wants to changes the price signals and incentives of producers and consumers. In this case the justification may be a desire to correct for negative externalities
Government Subsidies A government subsidy to consumers to cover some of the costs of buying child care or employing nannies is designed to reduce the relative cost of this and therefore increase demand. The justification could be to encourage more young mothers to actively seek work, expand the labour supply and contribute to the country’s productive potential
D2
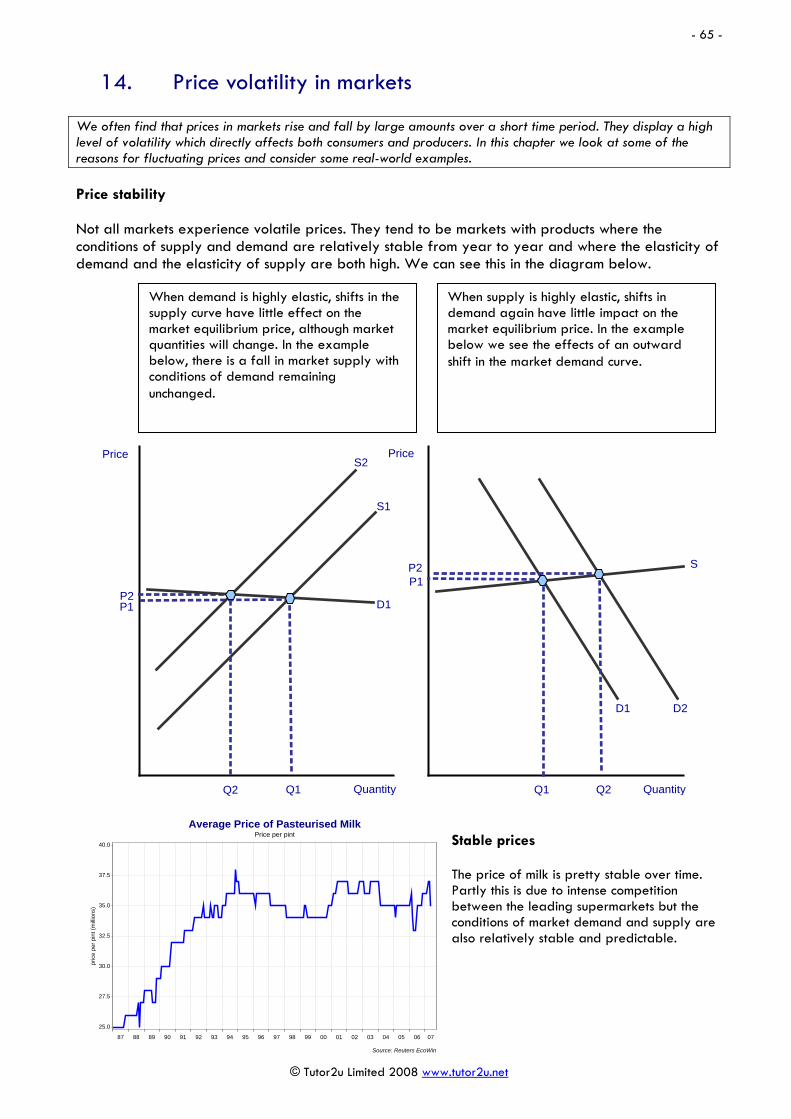
- 65 -
© Tutor2u Limited 2008 www.tutor2u.net
14. Price volatility in markets We often find that prices in markets rise and fall by large amounts over a short time period. They display a high level of volatility which directly affects both consumers and producers. In this chapter we look at some of the reasons for fluctuating prices and consider some real-world examples. Price stability Not all markets experience volatile prices. They tend to be markets with products where the conditions of supply and demand are relatively stable from year to year and where the elasticity of demand and the elasticity of supply are both high. We can see this in the diagram below.
Stable prices The price of milk is pretty stable over time. Partly this is due to intense competition between the leading supermarkets but the conditions of market demand and supply are also relatively stable and predictable.
Price
Quantity
S1
Q1
Price
Quantity
D1
S P1
Q2 Q1
P2
D1
Q2
P1
S2
P2
When demand is highly elastic, shifts in the supply curve have little effect on the market equilibrium price, although market quantities will change. In the example below, there is a fall in market supply with conditions of demand remaining unchanged.
When supply is highly elastic, shifts in demand again have little impact on the market equilibrium price. In the example below we see the effects of an outward shift in the market demand curve.
D2
Price per pintAverage Price of Pasteurised Milk
Source: Reuters EcoWin
87 88 89 90 91 92 93 94 95 96 97 98 99 00 01 02 03 04 05 06 07
pric
e pe
r pin
t (m
illion
s)
25.0
27.5
30.0
32.5
35.0
37.5
40.0

- 66 -
© Tutor2u Limited 2008 www.tutor2u.net
Price volatility Products with unstable conditions of supply and demand will experience price fluctuations from year to year. For example, for many products there are large seasonal variations in market demand which cause prices to rise sharply at peak times and then fall back during the off-peak periods. Seasonal demand is particularly strong in the tourism and leisure industries. The cost of hotel rooms and the prices of package holidays are always higher during the school holidays because hoteliers and travel businesses know that, at times of peak demand, the demand for holidays is price inelastic and that families will have to pay higher prices because they are limited to when they can take their holidays. Agricultural prices and prices of other traded commodities Agricultural prices tend to be volatile (unstable) because:
• Supply changes from one time period to the next because of variable weather conditions which affect the size of the harvest
o When supply falls short of planned output, for a given demand, price will rise
o When actual output is in excess of planned output, for a given level of demand, market price will fall
• The effects of changes in supply can be amplified by a price-inelastic demand, for example in markets for raw materials and components where the buyer sees them as essential to their production processes, they must buy at whatever the prevailing market price is.
• Price volatility can be magnified because of the activity of speculators in markets who are betting on future price changes. We have noticed this in many of the world’s commodity markets during the recent boom in international commodity prices. Hedge funds and pension funds together with other speculators have been buying into “hard commodities” such as copper, nickel, tin and also “softs” such as rubber and coffee because they expect market prices to remain high. Their demand has the effect of driving prices higher at times when stocks of these commodities are low.
Speculation is also rife in the property market. In 2007, the Spanish government passed a law designed to deter property speculators who the government blamed for spiralling house prices.

- 67 -
© Tutor2u Limited 2008 www.tutor2u.net
Example of price volatility – the market for nickel In July 2006 nickel prices had climbed to a record high capping a near 50 per cent rise in less than a month and a 90 per cent rise within the space of nine months!. The price increases were down to two fundamental market forces - demand is strong but stocks or inventories of the metal are low. If there isn’t enough nickel in the market, the price can only head in one direction! By the middle of July 2006, stockpiles of Nickel held at London Metal Exchange registered warehouses were the equivalent to just two days’ worth of demand. Only about 1.3 million tonnes of Nickel is produced each year. But industrial demand from countries such as China has been rising strongly, especially because many industrial users are demanding nickel for stainless steel production having switched from alternative metals such as manganese. China has been responsible for nearly half the increase in global demand for nickel. Prices continued to rise in the early months of 2007, but the price trend then started to reverse itself as demand slowed down, supply increased and stock levels started to rise. Once prices start to decline, speculators sell and turn their attentions to other commodities.
Price
Quantity
S1
Q1
D
Q2
P1
S2
P2
Inelastic demand and shifts in supply When the price elasticity of demand is low, volatile shifts in market supply causes large changes in the market equilibrium price, although the equilibrium quantity traded may not change that much.
Inelastic supply and demand We then consider shifts in demand when the price elasticity of demand is low. If Ped and Pes are both low then the scene is set for big changes in the market equilibrium price. E.g. a fall in supply from S1 to S2 and an increase in demand from D1 to d2 causes market price to jump from P1 to P4
S3
P3
Price
Quantity
S1
Q1
D1
Q2
P1
S2
P2
S3
P3
D2
P4
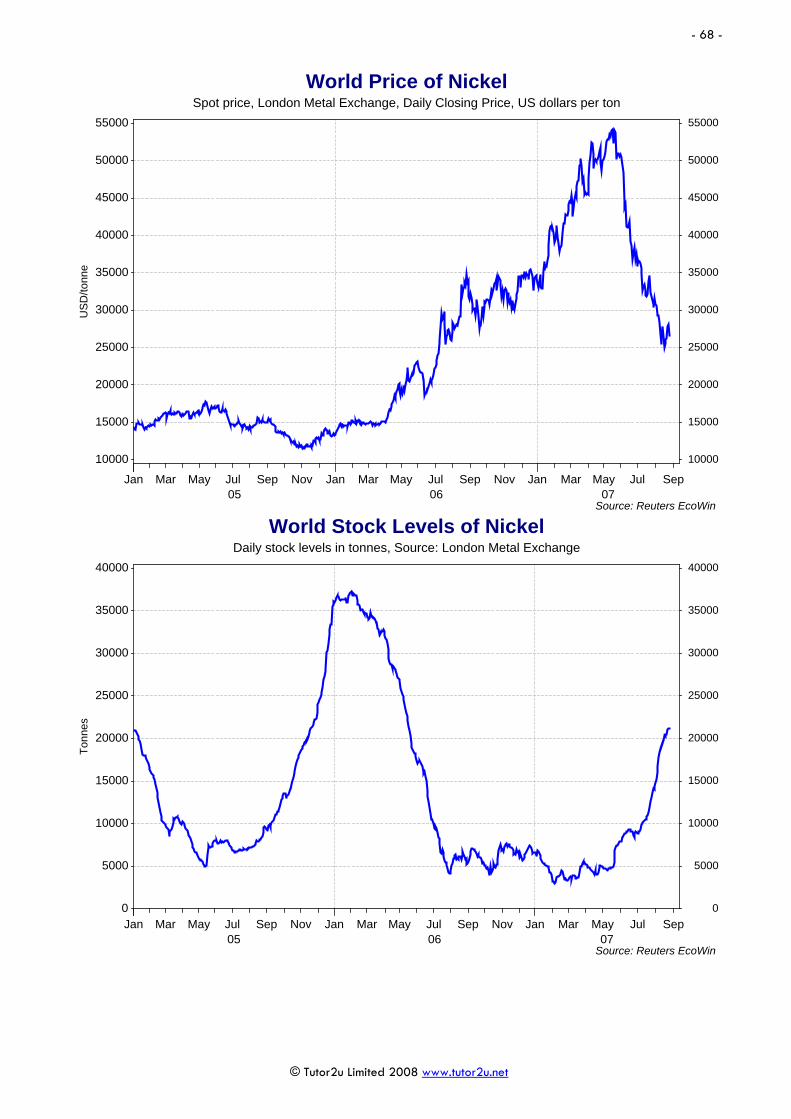
- 68 -
© Tutor2u Limited 2008 www.tutor2u.net
Spot price, London Metal Exchange, Daily Closing Price, US dollars per tonWorld Price of Nickel
Source: Reuters EcoWin
Jan05
Mar May Jul Sep Nov Jan06
Mar May Jul Sep Nov Jan07
Mar May Jul Sep
10000
15000
20000
25000
30000
35000
40000
45000
50000
55000
USD
/tonn
e
10000
15000
20000
25000
30000
35000
40000
45000
50000
55000
Daily stock levels in tonnes, Source: London Metal ExchangeWorld Stock Levels of Nickel
Source: Reuters EcoWin
Jan05
Mar May Jul Sep Nov Jan06
Mar May Jul Sep Nov Jan07
Mar May Jul Sep0
5000
10000
15000
20000
25000
30000
35000
40000
Tonn
es
0
5000
10000
15000
20000
25000
30000
35000
40000

- 69 -
© Tutor2u Limited 2008 www.tutor2u.net
Problems arising from price volatility in markets
1. Risk: Makes incomes and profits for producers more unpredictable – greater risks may
inhibit capital investment spending because suppliers are concerned about their expected profits (returns).
2. Poverty: Sharp falls in prices and incomes can cause real hardship and poverty and also unemployment, especially in regions and countries dependent on cash from exporting commodities.
3. Balance of Payments: Big swings in prices can cause large changes in export revenues for many of the world’s poorest countries – affecting their balance of payments and their ability to finance essential imports of food and technology.
4. Fiscal effects: Changing world prices also affect the tax revenues flowing into the government – if prices and profits are rising, a government gets a dividend from the taxation of business profit.
5. Speculation: Volatile prices can encourage speculators and force businesses to incur hedging costs to reduce price uncertainty. A good example is the volatility of world oil prices.
In most cases, the main cause of rising commodity prices around the world has been strong global demand especially the burgeoning demand for raw materials and minerals from the fast-growing emerging market countries. Rising living standards in these countries is also driving demand for and prices of foodstuffs higher.
• Some supply shocks including the effects of El Nino and the drought in Australia
• There is some evidence that commodities have become a new financial asset class such as bonds and equities! This is good news for commodity exporting countries including many in Africa, their export revenues are booming. Much depends on how well they use the windfall from higher world prices.
• Higher prices are creating higher profits for producers because most of the costs of extraction are fixed, so an increased price per tonne feeds into better returns
• In advanced nations, the rising price of commodities may lead to increased investment in developing substitutes e.g. finding alternative sources of energy.
• High prices for metals such as copper are increasing the demand for recycled copper and also prompting an increase in theft of copper plates and copper wiring!
• There is also a risk that the current global commodity price boom may cause some cost-push inflation and bring about an end to the macroeconomic stability that we seem to have enjoyed for the last decade and more.
Commodity prices set to remain high in 2008 Demand for most industrial commodities continues to run ahead of supply. As a result, prices will rise by an average of 12% in 2007 —their sixth consecutive annual rise according to a new report from the Economist Intelligence Agency. Yet high prices are not curbing demand; partly because prices of other commodities have been rising equally rapidly, limiting the scope for substitution, but more importantly because of China’s hugely growing raw material needs, with all its demand indicators running at double-digit growth-rates. Commodity supply has not yet responded sufficiently to this surge in raw material usage, with increased investment in production capacity yet to have an impact. Strikes, technical disruptions and rising production costs are hampering supply growth across many industrial raw material markets. Bio fuels 'to push farm prices up' (BBC news online, July 2007) Tracking the true cost of cotton (BBC news online, May 2007) Inflation Everywhere – Globalisation and inflation (Slate magazine, April 2006)
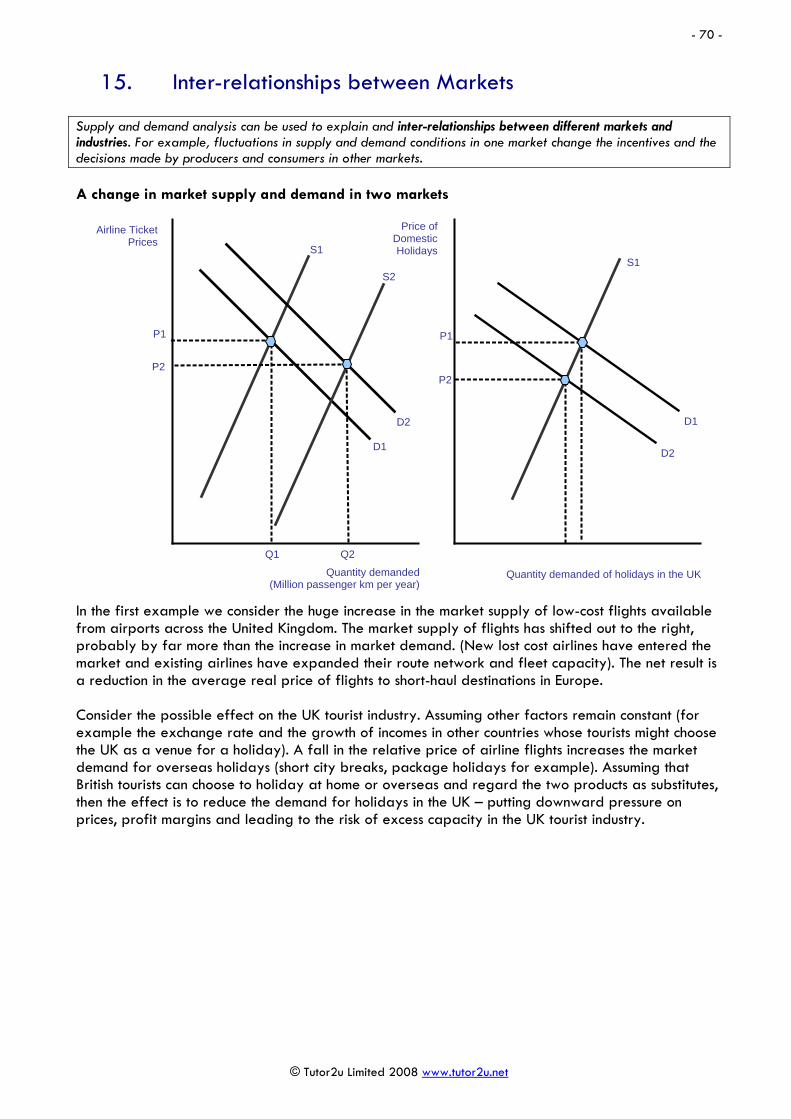
- 70 -
© Tutor2u Limited 2008 www.tutor2u.net
15. Inter-relationships between Markets Supply and demand analysis can be used to explain and inter-relationships between different markets and industries. For example, fluctuations in supply and demand conditions in one market change the incentives and the decisions made by producers and consumers in other markets. A change in market supply and demand in two markets
In the first example we consider the huge increase in the market supply of low-cost flights available from airports across the United Kingdom. The market supply of flights has shifted out to the right, probably by far more than the increase in market demand. (New lost cost airlines have entered the market and existing airlines have expanded their route network and fleet capacity). The net result is a reduction in the average real price of flights to short-haul destinations in Europe. Consider the possible effect on the UK tourist industry. Assuming other factors remain constant (for example the exchange rate and the growth of incomes in other countries whose tourists might choose the UK as a venue for a holiday). A fall in the relative price of airline flights increases the market demand for overseas holidays (short city breaks, package holidays for example). Assuming that British tourists can choose to holiday at home or overseas and regard the two products as substitutes, then the effect is to reduce the demand for holidays in the UK – putting downward pressure on prices, profit margins and leading to the risk of excess capacity in the UK tourist industry.
Airline Ticket Prices
Quantity demanded (Million passenger km per year)
S1
Price of Domestic Holidays
Quantity demanded of holidays in the UK
D1
D1
D2
S1
P1
P2
P1
P2
Q1 Q2
S2
D2

- 71 -
© Tutor2u Limited 2008 www.tutor2u.net
The growth of market demand for digital cameras Global demand for digital cameras continues to be strong. Industry analysts IDC forecast that 110 million digital cameras will be shipped in 2008, but a slowdown in market demand is on the horizon. The industry is already worth $33 billion in annual sales. The Asian/Pacific region is emerging as the powerhouse for rising demand as incomes continue to rise in emerging market economies. By 2010, these two regions will account for over 40% of total global shipments of digital cameras. The major suppliers are Canon, Fuji, HP, Kodak, Konica Minolta, Nikon, Olympus, Pentax Technologies, Samsung and Sony. What are the inter-relationships between markets in this example?
1. Substitute products: The growing demand for digital cameras is causing a fall in demand for analogue cameras that rely on taking film to developers – some producers including Eastman Kodak have stopped producing traditional film cameras due to falling demand. If others follow suit, then market supply will also shift inwards
2. Complementary products: As demand for digital cameras increases, so too does demand for printing paper, inks and other accessories used by people who want to print out their favourite images from their desktop or notebook PC
3. Demand-side threat to other markets: The change in consumer demand represents a competitive threat to mobile phone manufacturers – they are having to respond by becoming more innovative in terms of what their mobile phone handsets can do
High gas prices cause shut-downs in UK brick production Steep rises in the price of oil and gas is causing problems for the British brick-producing industry and is likely to lead to a fall in output and loss of jobs. It is a stark example of how the changing prices of essential inputs into the production process can filter through to affect many related industries. Baggeridge Brick, the fourth-biggest brick maker in the UK has announced that it plans to shut down two of its seven factories over Christmas and extend the closedown throughout January. The business has been hit by a double-whammy. Firstly the slowdown in the housing market and a trend towards building smaller properties has prompted a decline of 200 million in the market demand for bricks. Demand has also declined because of a reduction in spending on housing repairs, maintenance and improvement. Output in the industry has fallen by around ten per cent in 2005. Secondly the rise in the market price of gas has meant that the brick-producer is now paying double for its gas compared with this time last year. Gas is a major input into production because brick manufacturing is a very energy-intensive business. Higher brick prices will cause an increase in the cost of building new properties and in renovating existing buildings. Industry analysts forecast that planned price increases by the major brick suppliers will add around £150 - £200 to the cost of each new residential property depending on its size. Because all of the brick producers in the UK have experienced much the same rise in their energy costs, they are all expected to try to pass on these costs to final customers through higher prices. This is not collusion, merely an inevitable response to an industry-wide rise in production costs. Macroeconomics and market effects Another good example of inter-relationships is how macroeconomic developments in one country affect the prices of goods and services that we consume in our own economy. Consider the recent phenomenal growth of the Chinese economy and the impact that it has had on demand for and prices of many important internationally-traded raw materials and commodities.

- 72 -
© Tutor2u Limited 2008 www.tutor2u.net
Chinese growth drives up world commodity prices China’s explosive economic growth voracious appetite for raw materials and energy has driven up prices worldwide and created shortages. In 2005, China consumed over 50 percent of the world's cement, 40 percent of its steel and 25 percent of its aluminium. China's growing demand for oil has been one reason crude prices are so high. Talk of an economic slowdown engineered by the Chinese government is pricking up ears from Chilean copper mines to Minnesota soybean fields. China has 4,813 cement plants - more than the rest of the world combined - and they still aren't enough to supply the cement for projects such as the Three Gorges Dam or the stadiums and housing for the 2008 Beijing Olympic Games. Consider how rising oil prices can feed through to related markets
Derived demand The demand for a product X might be strongly linked to the demand for a related product Y. For example, the demand for steel is strongly linked to the market demand for new cars, the construction of new buildings and many manufactured products. The demand for labour is derived from the final demand for the goods and services that we employ labour to produce. So when the economy is enjoying a strong upturn in aggregate demand, so too the demand for labour increases. Conversely in a recession, as real national output declines, so we see a fall in the demand for labour at each prevailing wage rate. Composite demand Composite demand exists where goods or services have more than one use so that an increase in the demand for one product leads to a fall in supply of the other. The most commonly quoted example is that of milk which can be used for cheese, yoghurts, cream, butter and other products. If
Crude Oil Prices ($ per
barrel)
Quantity demanded Of crude oil (millions of barrels per day)
S1 Price of Heating
Oil
Quantity demanded of heating oil
D1
D2
S1
P1
P2
P1
Q1 Q2
D1
D3
Q3
P2
P3
S2
Q2 Q1
Increasing demand for crude oil forces up the world market price (P1 – P2 – P3) Crude oil is used as a raw material in producing heating oil for central heating systems – the higher price of crude causes an increase in costs and reduction in the market supply of heating oil at each price level (shown in the right hand diagram)

- 73 -
© Tutor2u Limited 2008 www.tutor2u.net
more milk is used for manufacturing cheese, other things remaining the same, there is less available for butter. Another good example is land – land can be developed in many different ways – for commercial property, residential properties, leisure facilities, farming, common land and so forth. Likewise oil has numerous alternative uses – for heating oil, petrol fuel, use in petrochemicals etc. Joint supply Joint supply describes a situation where an increase or decrease in the supply of one good leads to an increase or decrease in supply of another. For example an expansion in the volume of beef production will lead to a rising market supply of beef hides. A contraction in supply of lamb will reduce the supply of wool.
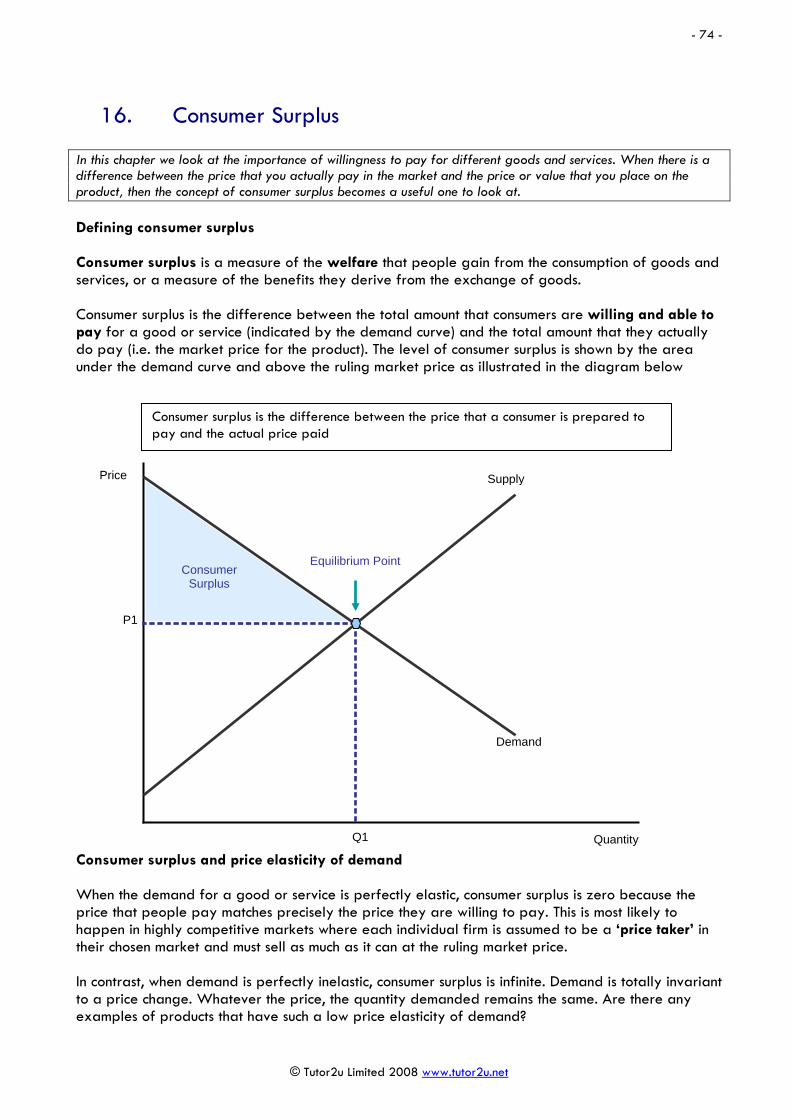
- 74 -
© Tutor2u Limited 2008 www.tutor2u.net
16. Consumer Surplus In this chapter we look at the importance of willingness to pay for different goods and services. When there is a difference between the price that you actually pay in the market and the price or value that you place on the product, then the concept of consumer surplus becomes a useful one to look at. Defining consumer surplus Consumer surplus is a measure of the welfare that people gain from the consumption of goods and services, or a measure of the benefits they derive from the exchange of goods. Consumer surplus is the difference between the total amount that consumers are willing and able to pay for a good or service (indicated by the demand curve) and the total amount that they actually do pay (i.e. the market price for the product). The level of consumer surplus is shown by the area under the demand curve and above the ruling market price as illustrated in the diagram below
Consumer surplus and price elasticity of demand When the demand for a good or service is perfectly elastic, consumer surplus is zero because the price that people pay matches precisely the price they are willing to pay. This is most likely to happen in highly competitive markets where each individual firm is assumed to be a ‘price taker’ in their chosen market and must sell as much as it can at the ruling market price. In contrast, when demand is perfectly inelastic, consumer surplus is infinite. Demand is totally invariant to a price change. Whatever the price, the quantity demanded remains the same. Are there any examples of products that have such a low price elasticity of demand?
Price
Quantity
Demand
Supply
P1
Q1
Equilibrium Point Consumer
Surplus
Consumer surplus is the difference between the price that a consumer is prepared to pay and the actual price paid

- 75 -
© Tutor2u Limited 2008 www.tutor2u.net
The majority of demand curves are downward sloping. When demand is inelastic, there is a greater potential consumer surplus because there are some buyers willing to pay a high price to continue consuming the product. This is shown in the diagram below.
Changes in demand and consumer surplus
When there is a shift in the demand curve leading to a change in the equilibrium market price and quantity, then the level of consumer surplus will alter. This is shown in the diagrams above. In the left hand diagram, following an increase in demand from D1 to D2, the equilibrium market price rises to from P1 to P2 and the quantity traded expands. There is a higher level of consumer surplus because more is being bought at a higher price than before.
Price
Quantity
D1
Supply
P1
Q1
Outward Shift in Demand (Higher consumer surplus)
Price
Quantity
Demand
S1
P1
Q1
Consumer Surplus
S2
P2
Q2
D2
P2
Q2
Outward Shift in Supply (Higher consumer surplus)
Demand
Price
Demand
Relatively Inelastic Demand
P1
Q1 Q2
Relatively Elastic Demand
Quantity Demanded Quantity Demanded
Supply
Supply
- 76 -
© Tutor2u Limited 2008 www.tutor2u.net
In the diagram on the right we see the effects of a cost reducing innovation which causes an outward shift of market supply, a lower price and an increase in the quantity traded in the market. As a result, there is an increase in consumer welfare shown by a rise in consumer surplus. Consumer surplus can be used frequently when analysing the impact of government intervention in any market – for example the effects of indirect taxation on cigarettes consumers or the introducing of road pricing schemes such as the London congestion charge.
Applications of consumer surplus Consider the entry of Internet retailers such as Last Minute and Amazon into the markets for travel and books respectively. What impact has their entry into the market had on consumer surplus? Have you benefited from you perceive to be lower prices and better deals as a result of using e-commerce sites offering large discounts compared to high street retailers? Price discrimination and consumer surplus Producers often take advantage of consumer surplus when setting prices. If a business can identify groups of consumers within their market who are willing and able to pay different prices for the same products, then sellers may engage in price discrimination – the aim of which is to extract from the purchaser, the price they are willing to pay, thereby turning consumer surplus into extra revenue. Airlines are expert at practising this form of yield management, extracting from consumers the price they are willing and able to pay for flying to different destinations are various times of the day, and exploiting variations in elasticity of demand for different types of passenger service. You will always get a better deal / price with airlines such as EasyJet and RyanAir if you are prepared to book weeks or months in advance. The airlines are prepared to sell tickets more cheaply then because they get the benefit of cash-flow together with the guarantee of a seat being filled. The nearer
the time to take-off, the higher the price. If a businessman is desperate to fly from Newcastle to Paris in 24 hours time, his or her demand is said to be price inelastic and the corresponding price for the ticket will be much higher. One of the main arguments against firms with monopoly power is that they exploit their monopoly position by raising prices in markets where demand is inelastic, extracting consumer surplus from buyers and increasing profit margins at the same time. We shall consider the issue of monopoly in more detail when we come on to our study of markets and industries.
Paying for the right to drive into the centre of London In July 2005, the congestion charge was raised to £8 per day. How has the London congestion charge affected the consumer surplus of drivers?
Transport for London has details on the impact of the congestion charge

- 77 -
© Tutor2u Limited 2008 www.tutor2u.net
17. Producer Surplus Producer surplus relates to the welfare that businesses can achieve by supplying products to the market. Defining producer surplus Producer surplus is a measure of producer welfare. It is measured as the difference between what producers are willing and able to supply a good for and the price they actually receive. The level of producer surplus is shown by the area above the supply curve and below the market price and is illustrated in the diagram above.
Producer surplus and changes in demand and supply We first consider the effects of a change in market supply – for example caused by an improvement in production technology or a fall in the cost of raw materials and components used in the production of a good or service
Price
Quantity
Demand
Supply
P1
Q1
Equilibrium Point
Producer Surplus
Producer surplus is the difference between the market price received by the seller and the price they would have been prepared to supply at

- 78 -
© Tutor2u Limited 2008 www.tutor2u.net
We now consider the effects on producer surplus of a rise in market demand
Price
Quantity
Demand (1)
Supply
P1
Q2
PS1
An outward shift in demand causes a rise in both equilibrium price and quantity The result is an increase in the total level of producer surplus
P2
Q1
A
C
B
Producer surplus at price P1 = area P1BA
Producer surplus at price P2 = area P2CA
Demand (2)
Price
Quantity
Demand
Supply (2)
P2
Q2
PS1
An outward shift of supply causes a fall in market price and a rise in equilibrium quantity The result is an increase in the total level of producer surplus
Supply (1)
P1
Q1
A
B
C
D
Producer surplus at price P1 = area P1CA
Producer surplus at price P2 = area P2DB

- 79 -
© Tutor2u Limited 2008 www.tutor2u.net
18. The Market for Oil The effects of changes in the price of oil traded on the international petroleum exchanges can be far-reaching, not just for Britain but for the global economy too. A basic study of the oil market is a useful application of the principles of supply and demand analysis and a way of understanding the interconnections between the microeconomics of the oil market and their macroeconomic consequences. Market theory in action - what determines crude oil prices?
Closing daily price, US dollars per barrel of oilBrent Crude Oil Prices
Source: Reuters EcoWin
90 91 92 93 94 95 96 97 98 99 00 01 02 03 04 05 06 070
10
20
30
40
50
60
70
80
US
dolla
rs p
er b
arre
l
0
10
20
30
40
50
60
70
80
Oil is one of the most heavily traded commodities in the world. Fluctuating prices have important effects for oil producers/exporters and the many countries that remain dependent on oil as a key input in their energy, manufacturing and service industries. The demand for oil
1. Cyclical demand: There is a strong link between the demand for oil and the rate of global economic growth because oil is an input into many industries. The best recent example of this is the growth of the Chinese economy. Fast growth of national output in energy-intensive sectors has led to a surge in demand for crude oil into the Chinese economy. The International Energy Agency (IEA) expects China's oil demand to rise from 7.6 million barrels per day in 2007 to 8.05 million in 2008 and further to 9.96 million per day in 2012. Chinese demand is being driven higher by transport fuels and naphtha; transport demand will increase as income per capita rises while national plans for petrochemical expansion will require naphtha as a feedstock.
2. Prices of substitutes: Demand for crude oil affected by the relative prices of oil substitutes (e.g. the market price of gas). If, in the longer term, reliable and relatively cheaper substitutes for oil can be developed, then we might expect to see a shift in demand away
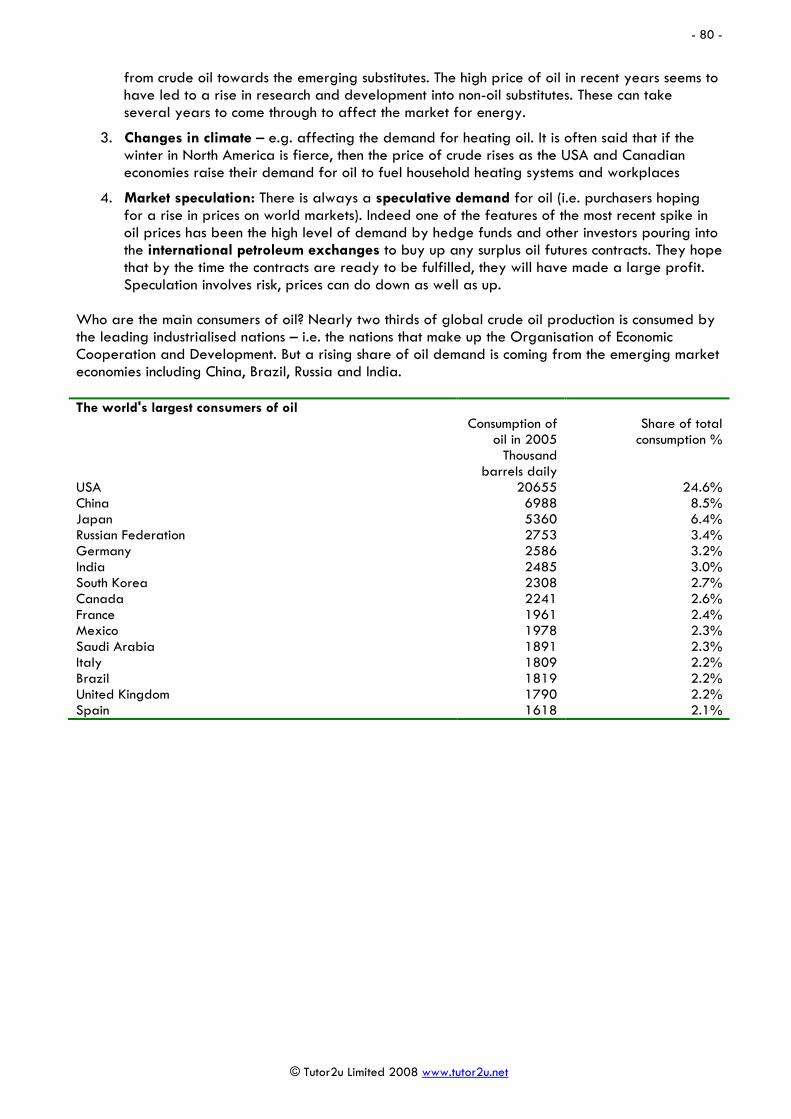
- 80 -
© Tutor2u Limited 2008 www.tutor2u.net
from crude oil towards the emerging substitutes. The high price of oil in recent years seems to have led to a rise in research and development into non-oil substitutes. These can take several years to come through to affect the market for energy.
3. Changes in climate – e.g. affecting the demand for heating oil. It is often said that if the winter in North America is fierce, then the price of crude rises as the USA and Canadian economies raise their demand for oil to fuel household heating systems and workplaces
4. Market speculation: There is always a speculative demand for oil (i.e. purchasers hoping for a rise in prices on world markets). Indeed one of the features of the most recent spike in oil prices has been the high level of demand by hedge funds and other investors pouring into the international petroleum exchanges to buy up any surplus oil futures contracts. They hope that by the time the contracts are ready to be fulfilled, they will have made a large profit. Speculation involves risk, prices can do down as well as up.
Who are the main consumers of oil? Nearly two thirds of global crude oil production is consumed by the leading industrialised nations – i.e. the nations that make up the Organisation of Economic Cooperation and Development. But a rising share of oil demand is coming from the emerging market economies including China, Brazil, Russia and India. The world's largest consumers of oil Consumption of
oil in 2005 Thousand
barrels daily
Share of total consumption %
USA 20655 24.6% China 6988 8.5% Japan 5360 6.4% Russian Federation 2753 3.4% Germany 2586 3.2% India 2485 3.0% South Korea 2308 2.7% Canada 2241 2.6% France 1961 2.4% Mexico 1978 2.3% Saudi Arabia 1891 2.3% Italy 1809 2.2% Brazil 1819 2.2% United Kingdom 1790 2.2% Spain 1618 2.1%

- 81 -
© Tutor2u Limited 2008 www.tutor2u.net
Million barrels of oil per day, source: International Energy AgencyChina's Consumption of Oil
Source: Reuters EcoWin
88 89 90 91 92 93 94 95 96 97 98 99 00 01 02 03 04 05 06 07 08
milli
ons
2
3
4
5
6
7
8
9
Barre
ls/D
ay (m
illion
s)
2
3
4
5
6
7
8
9
Million barrels per day, source: International Energy AgencyOPEC Crude Oil Production against Capacity
Source: Reuters EcoWin
02 03 04 05 06 07
milli
ons
24
25
26
27
28
29
30
31
32
33
34
35
Barre
ls/D
ay (m
illion
s)
24
25
26
27
28
29
30
31
32
33
34
35
OPEC Oil Production
OPEC Production Capacity
Total OPEC Crude 30.24MOPEC Sustainable Production Capacity 34.1M
- 82 -
© Tutor2u Limited 2008 www.tutor2u.net
The supply of oil When we consider the global supply of oil we need to make a distinction between short-term and long-term supply. The short run supply curve is normally drawn on the basis of a given state of production technology and fixed use of capital inputs (i.e. the oil industry is supplying from a known level of oil reserves and a given stock of capital machinery used to extract that oil). There is inevitably a short-run capacity on daily oil supply and, as production gets close to supply limits, so the short run supply of oil becomes more inelastic. One way of modelling this is to assume the market supply curve for oil is non-linear. An alternative is to suggest that more oil can be supplied elastically at a fairly constant price until the capacity limit is reached, when the short run supply curve becomes vertical. In short, the short-run supply of crude oil is affected by a series of different factors
1. Profit motive: The production decisions of OPEC and Non-OPEC countries.
2. Spare capacity: The level of spare production capacity in the oil sector.
3. Stocks: The current level of crude oil stocks (inventories) available for immediate supply from the major oil refineries – i.e. a high level of stocks means that extra oil supplies can be released onto the market quickly when demand fluctuates.
4. External shocks: The effects of production shocks (e.g. loss of output from rig closures or disruption of oil supplies due to war and terrorist attacks).
Taking a longer-term perspective, the long run world oil supply is linked to
1. Reserves: Depletion of proven oil reserves – the faster that demand grows, the quicker the expected rate of depletion.
2. Exploration: Investment spending on exploring, identifying and then exploiting new oil reserves. When oil prices are rising and are expected to stay strong, it makes financial sense to invest more resources in exploring for new reserves, even though these may not come on stream for some years.
3. Technology: Technological change in oil extraction (which affects the costs of extraction and the profitability of extracting and then refining the oil).
The interaction between oil demand and supply in the short run Higher oil demand matched against an inelastic short run supply invariably drives prices higher – this is shown in the diagram below. An increase in demand causes a fall in oil stocks at the major refineries and pushes prices higher. This acts as a signal to suppliers to expand production. However there are time lags between a change in price and extra supplies coming on stream. The demand for oil is also price inelastic. This combination of an inelastic demand and supply helps to explain some of the volatility in world oil prices.

- 83 -
© Tutor2u Limited 2008 www.tutor2u.net
The Organization of Petroleum Exporting Countries (OPEC) accounts for around 40% of current world supply. This gives OPEC a pivotal influence in shaping the direction of oil prices – but only when the cartel acts together to control production and balance supply and demand in the international market. Less than a decade ago it was trying to keep oil prices at around $22 to $28 a barrel but OPEC is now aiming at ensuring they do not drop below $55. Non-OPEC countries account for the largest portion of total supply. Oil is produced in nearly every corner of the world, and nearly every region has been expanding oil production in the last decade. This includes Europe, where Norwegian oil companies are achieving a rapid increase in oil extraction and also Russia now one of the world’s largest oil suppliers. World Oil Production Production of oil Output as a share Thousand barrels daily of world total Saudi Arabia 11035 13.5% Russian Federation 9551 12.1% USA 6830 8.0% Iran 4049 5.1% Mexico 3759 4.8% China 3627 4.6% Venezuela 3007 4.0% Canada 3047 3.7% Norway 2969 3.5% Kuwait 2643 3.3% United Arab Emirates 2751 3.3% Nigeria 2580 3.2% Iraq 1820 2.3% Algeria 2015 2.2% Brazil 1718 2.2% United Kingdom 1808 2.2%
Oil Output Million barrels per day
D1
Supply
D2
Oil Output Million barrels per day
D3
D1
Supply
D2
D3 P1 P2
P3
P1
P2
Q1 Q2 Q3
Oil Price $ Per barrel

- 84 -
© Tutor2u Limited 2008 www.tutor2u.net
Total production
000 barrels daily Output as a percentage
of total world output Total World Oil Production in 2005 81088 100.0% Of which
OPEC countries
33836
41.7% Non-OPEC 35408 43.4%
Former Soviet Union 11844 14.8% OPEC sets quotas for how much crude oil they want to produce with the aim of stabilising the price at a target level. There are always major doubts about OPEC’s ability to keep to output limits. Basically, OPEC acts as the ‘swing producer’ in the world oil market. It controls that part of the world supply curve which is easiest to change and if it wants to keep oil prices high, then it can keep tight control on short run production so that supply does not run too far ahead of demand. OPEC has to tread a fine line, because if prices remain too high for a long period, then oil consumers have a clear incentive to look for alternative sources of energy or other non-oil substitutes in production. Microeconomic effects of higher oil prices Crude oil has many uses in many different markets and industries. So changes in the global price of oil inevitably have an effect on the microeconomics of particular sectors of the economy. The main uses for crude oil are as follows:
1. Gasoline: used in motor spirit/petrol
2. Middle Distillates:
a. Diesel – used in vehicles and other motors/engines
b. Jet fuel
3. Kerosene – cooking/heating
4. Heating Oil
5. Fuel Oil: boiler fuel for industry, power and shipping
6. Other: lubricants, bitumen etc

- 85 -
© Tutor2u Limited 2008 www.tutor2u.net
After a long period of relatively low oil prices, in the last few years, the world economy has had to come to terms with the prospect that the era of cheap oil is now over. This affects many industries in the UK economy and has direct and indirect effects on consumers. For those industries that use oil as an input into their production process, then a rising price acts as a supply-side shock – leading to a rise in their variable costs of production. The more an industry relies on oil, the bigger will be the impact of a rise in prices on its costs and profitability, and hence the bigger the fall in its production is likely to be in the long run. The increase in costs causes a profit maximising firm to increase price and reduce the equilibrium level of output. The extent to which a business is able to pass on an increase in costs depends on the price elasticity of demand for their products. If demand is price inelastic, then the supplier may choose to pass on some or all of any rise in variable costs to the consumer of the final product. For example, a controversial issue has been the decision by many (although not all) of the airlines to increase their fuel surcharges to customers. For consumers, higher oil prices has led directly to more expensive fuel at the pumps, higher gas and electricity bills and a reduction in their real incomes. Although oil and gas prices have been very high, so far we have not seen a dramatic rise in inflation – other factors have helped to keep inflation under control. Suggestions for reading on the world oil market Guardian Special Report on Oil and Petrol Glory days are over for North Sea as the big companies look abroad (Guardian, July 2007) Oil will grow on trees in BP's latest biofuel joint venture (Guardian, June 2007) Oil reserves – a brief guide (Guardian) The search for alternative energy (BBC Radio 4 In Business, Spring 2007) We must learn to live with expensive oil – Hamish McRae, Independent, July 2006 BP Statistical Review of World Energy 2007 Organisation of Petroleum Exporting Countries (OPEC) Oil markets explained (BBC news online, July 2003) Why oil will hit $100 a barrel (BBC news online, February 2006) Understanding oil prices (Tutor2u Blog – September 2006) Biofuels 'will push up oil price' (BBC news online, June 2007) Global oil demand to rise in 2008 (BBC news online, July 2007)

- 86 -
© Tutor2u Limited 2008 www.tutor2u.net
19. The Market for Copper The market for copper has hit the headlines in the last two years as a price boom has occurred. Copper has been described as a commodity that truly measures the pulse of the global economy. The world price of copper nearly trebled between the start of 2005 and the summer of 2006, one of the most remarkable booms in commodity markets in many years. After a dip in prices in the early months of 2007, the price of copper has heading higher again climbing above $8,000 per tonne in the summer of 2007. Much of the steep rise in price has been due to demand-side factors. World demand for copper has been rising much faster than the growth in market supply that result from new discoveries of copper and increased extraction rates of known reserves. In 2004, world copper consumption exceeded production by 843,000 tons and a similar demand-supply imbalance occurred in 2005 and 2006.
Source: London Metal ExchangeThe World Market for Copper - Stocks and Prices
Source: Reuters EcoWinMonth and Year
Jan01
May Sep Jan02
May Sep Jan03
May Sep Jan04
May Sep Jan05
May Sep Jan06
May Sep Jan07
May Sep0
10002000
300040005000
6000700080009000
Pric
e/U
SD
010002000
300040005000
6000700080009000 World Price of Copper - US dollars per tonne
milli
ons
0.0
0.2
0.4
0.6
0.8
1.0
Tonn
es (m
illion
s)
0.0
0.2
0.4
0.6
0.8
1.0Stocks of Copper - million tonnes
According to a recent study from geologists at Yale University, new discoveries of copper have raised global reserves by just 0.63 per cent a year since 1925 but usage (final demand) has risen at 3.3 per cent per annum. And demand is growing strongly on the back of phenomenal growth in China, India and other emerging market economies. Stocks of copper have been in decline in the last few years and it is this scarcity that has driven prices higher as commodities traders out-bid each other as they scramble for available supplies. Supply has fallen behind the growth of demand and prices can move in only one direction when this happens!
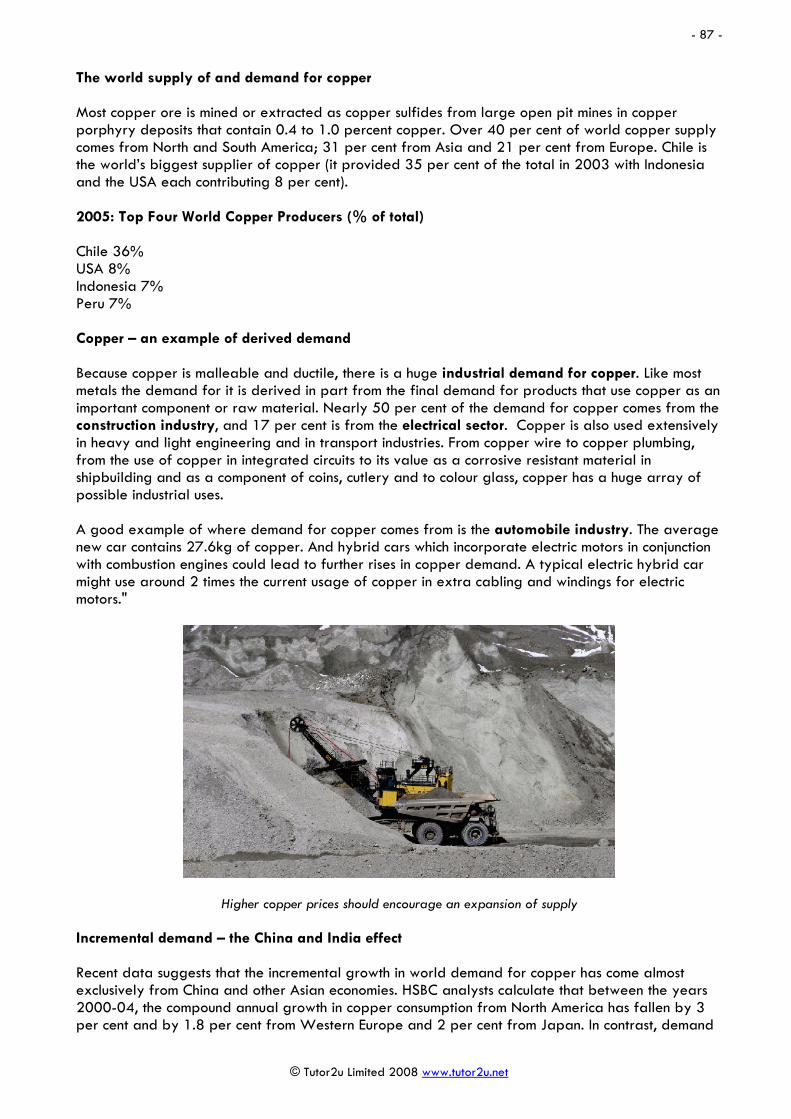
- 87 -
© Tutor2u Limited 2008 www.tutor2u.net
The world supply of and demand for copper Most copper ore is mined or extracted as copper sulfides from large open pit mines in copper porphyry deposits that contain 0.4 to 1.0 percent copper. Over 40 per cent of world copper supply comes from North and South America; 31 per cent from Asia and 21 per cent from Europe. Chile is the world’s biggest supplier of copper (it provided 35 per cent of the total in 2003 with Indonesia and the USA each contributing 8 per cent). 2005: Top Four World Copper Producers (% of total) Chile 36% USA 8% Indonesia 7% Peru 7% Copper – an example of derived demand Because copper is malleable and ductile, there is a huge industrial demand for copper. Like most metals the demand for it is derived in part from the final demand for products that use copper as an important component or raw material. Nearly 50 per cent of the demand for copper comes from the construction industry, and 17 per cent is from the electrical sector. Copper is also used extensively in heavy and light engineering and in transport industries. From copper wire to copper plumbing, from the use of copper in integrated circuits to its value as a corrosive resistant material in shipbuilding and as a component of coins, cutlery and to colour glass, copper has a huge array of possible industrial uses. A good example of where demand for copper comes from is the automobile industry. The average new car contains 27.6kg of copper. And hybrid cars which incorporate electric motors in conjunction with combustion engines could lead to further rises in copper demand. A typical electric hybrid car might use around 2 times the current usage of copper in extra cabling and windings for electric motors."
Higher copper prices should encourage an expansion of supply Incremental demand – the China and India effect Recent data suggests that the incremental growth in world demand for copper has come almost exclusively from China and other Asian economies. HSBC analysts calculate that between the years 2000-04, the compound annual growth in copper consumption from North America has fallen by 3 per cent and by 1.8 per cent from Western Europe and 2 per cent from Japan. In contrast, demand

- 88 -
© Tutor2u Limited 2008 www.tutor2u.net
from Asian countries other than Japan has increased by 8.6 per cent each year whilst in China the growth has been a staggering 15 per cent per year. There has also been speculative demand for copper as investment funds around the world have started to track commodity prices. In the case of copper, thus far, the market has been a one way street for financial investors, although you may have heard about the rogue copper trader from China who a fortune betting that the market price of copper would fall back in November 2005! The volatility of commodity prices As we have seen, price volatility stems from a lack of responsiveness of both demand and supply in the short term, i.e. both demand and supply are assumed to be inelastic in response to price movements. The low price elasticity of demand for copper usually stems from a lack of close substitutes in the market. For some products and processes, aluminium or plastic may act as a substitute to copper, but there are costs and delays involved in switching between them. The elasticity of supply is also low. Supply is usually unresponsive to price movements in the short term because of the high fixed costs of developing new extraction plants which also involve lengthy lead-times. If existing copper mining businesses are working close to their current capacity then a rise in world demand will simple lead to a reduction in available stocks. And as stocks fall, so buyers in the market will bid up the price either to finance immediate delivery (the spot price) or to guarantee delivery of copper in the future (reflected in the futures price). It can take huge price swings in the market for supply and demand to respond sufficient to bring the market back to some sort of equilibrium. The effects of rising copper prices The demand for copper will continue to remain strong provided that the global industrial sectors continue to expand production. But if price remain high then we can expect to see some shifts occurring. For a start, copper can be recycled although the costs of doing so are often high and there are fears concerning the negative externalities arising from the pollution created by trying to recycle used copper. These external costs include atmospheric emissions from recycling plants and waste products dumped into rivers. Nonetheless price theory would predict an increase in demand for scrapped copper and perhaps a substitution effect away from copper towards aluminium. And in the medium term high prices and new technologies may cause an even bigger shift in demand away from copper based products. Plastics provide lower material and installation costs for businesses. And the take off in wireless technology and fibre optics will also have an impact. And higher prices might also be the stimulus required for an expansion of copper ore production as supply responds to the incentives of increased potential revenues and profits. In recent years, copper mining production has fallen short of expectations. But as with any market, if the price is high enough suppliers will eventually respond! Suggested reading on the world copper market London Metal Exchange The weighty price of metal thefts – BBC news online, April 2007 Chilean copper firm strikes widen – BBC news online July 2007
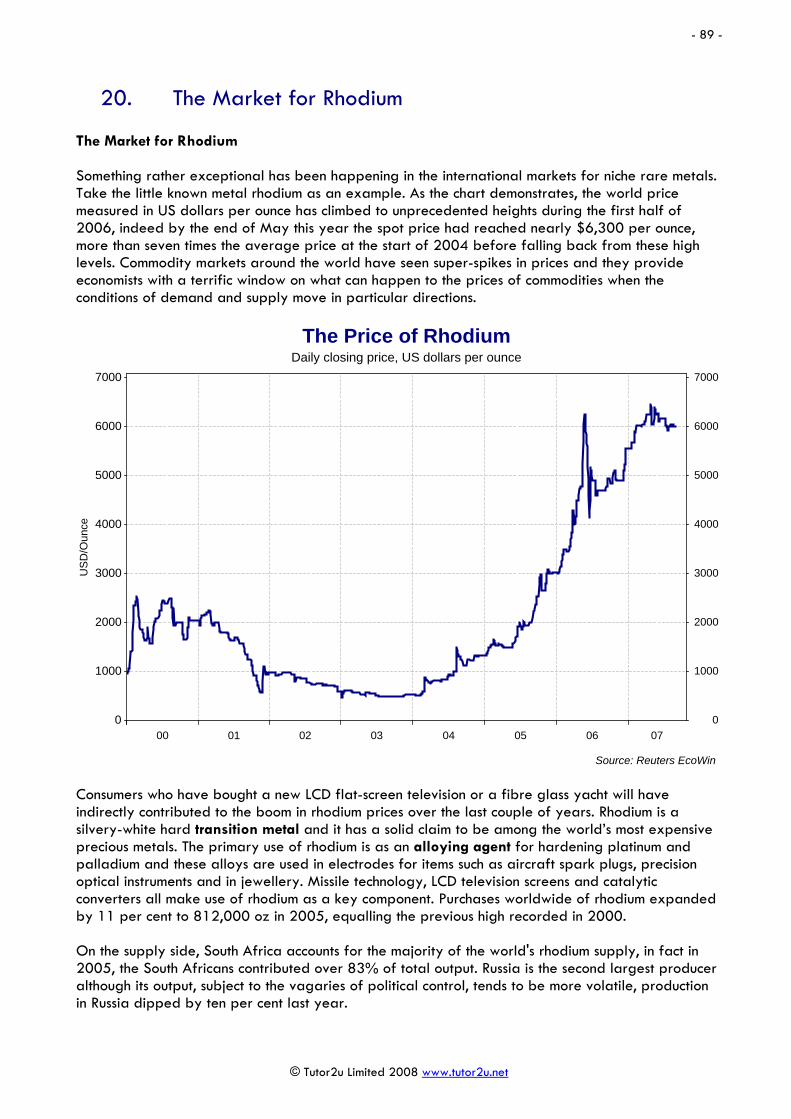
- 89 -
© Tutor2u Limited 2008 www.tutor2u.net
20. The Market for Rhodium The Market for Rhodium Something rather exceptional has been happening in the international markets for niche rare metals. Take the little known metal rhodium as an example. As the chart demonstrates, the world price measured in US dollars per ounce has climbed to unprecedented heights during the first half of 2006, indeed by the end of May this year the spot price had reached nearly $6,300 per ounce, more than seven times the average price at the start of 2004 before falling back from these high levels. Commodity markets around the world have seen super-spikes in prices and they provide economists with a terrific window on what can happen to the prices of commodities when the conditions of demand and supply move in particular directions.
Daily closing price, US dollars per ounceThe Price of Rhodium
Source: Reuters EcoWin
00 01 02 03 04 05 06 070
1000
2000
3000
4000
5000
6000
7000
USD
/Oun
ce
0
1000
2000
3000
4000
5000
6000
7000
Consumers who have bought a new LCD flat-screen television or a fibre glass yacht will have indirectly contributed to the boom in rhodium prices over the last couple of years. Rhodium is a silvery-white hard transition metal and it has a solid claim to be among the world’s most expensive precious metals. The primary use of rhodium is as an alloying agent for hardening platinum and palladium and these alloys are used in electrodes for items such as aircraft spark plugs, precision optical instruments and in jewellery. Missile technology, LCD television screens and catalytic converters all make use of rhodium as a key component. Purchases worldwide of rhodium expanded by 11 per cent to 812,000 oz in 2005, equalling the previous high recorded in 2000. On the supply side, South Africa accounts for the majority of the world's rhodium supply, in fact in 2005, the South Africans contributed over 83% of total output. Russia is the second largest producer although its output, subject to the vagaries of political control, tends to be more volatile, production in Russia dipped by ten per cent last year.

- 90 -
© Tutor2u Limited 2008 www.tutor2u.net
The market for rhodium really is small, to put it into perspective, the value of the commodity bought and sold is around a tenth of the size of platinum and palladium. But limited supply and strong market demand means that the world price of rhodium can move in only one direction. Although there has been some speculative element to the recent price surge, the fundamental reasons lie firmly in the changing balance between demand and supply. After several years of surplus with short run supply exceeding demand, the rhodium market moved into heavy deficit in 2005 and in the early months of 2006. Prices are starting to fall back from their stratospheric highs as speculators take profits, and some car producers start to look at ways of taking rhodium out of the production of catalytic converters. But such changes in production techniques can take years to show through and, for the moment, the world price of one of our scarcest precious metals looks set to remain as hard and durable as the commodity itself. A simple question of market supply and demand Rhodium Supply and Demand 000 ounces
2004 2005 % change on the year
Supply South Africa 587 627 6.8 Russia 100 90 -10 North America 17 20 15 Others 16 17 6.25 Total Supply 720 754 4.7 Demand Auto-industry 618 684 10.7 Chemical 43 47 9.3 Electrical 8 9 12.5 Glass 46 55 19.6 Other 14 17 21.4 Total Demand 729 812 11.4 Supply versus Demand Supply deficit of 9 Supply deficit of 58

- 91 -
© Tutor2u Limited 2008 www.tutor2u.net
21. The Market for Coffee Each day nearly 2.5 billion cups of coffee are consumed. It is the 5th most widely traded commodity in the world and millions of people depend directly or indirectly on the production and sale of coffee for their livelihoods. The global market for coffee is characterised by volatile prices and production levels which impacts directly on the incomes of producers and prices facing consumers. The World Coffee Market Experts on the world coffee market often make reference to the “coffee paradox”.
• A coffee crisis in producing countries with a trend towards lower prices, declining producer incomes and profits with important consequences for the export revenues of leading coffee exporting countries and the living standards of millions of people in developing nations
• A coffee ‘boom’ in consuming countries with rising retail sales and profits for coffee retailers
• A widening gap between producer and consumer prices Coffee production and developing countries The World Bank estimates that out of the total 141 developing countries, 95 depend on exports of commodities for at least 50 percent of their total export earnings. Coffee is a very good example of such “commodity-dependency” representing, for example, 75% of the total exports of Burundi and 54% in Uganda, and about 22% in the case of Honduras. About 20 to 25 million families produce and sell coffee for their livelihood and most of them are small-scale farmers with limited financial resources and scope to diversify out of coffee production. Globally, coffee sales each year exceed $70 billion, but coffee producing countries only capture $5 billion of this value, with the bulk of revenues from the coffee trade retained by developed countries. Coffee farmers in producing countries only obtain a fraction of the final retail price of coffee. A recent Oxfam research report showed that Ugandan coffee farmers only get about 2.5 percent of the final retail price of their coffee in the UK market. One strongly positive sign has been the surge in demand for FairTrade coffee in the UK and other countries. The FairTrade organisation claimed in July 2006 that one in five cups of filter coffee drunk in the UK are now being supplied from a "fair" source. Sales of Fairtrade coffee in the UK totalled £65.8m on 2005, up from £34.3m in 2003 (5 % of the UK market) although FairTrade coffee sales account for only 0.5% of the global market Coffee prices There have been no price controls in the global coffee trade since 1989, when the buffer-stock system run by the International Coffee Agreement broke down. The main reason for the decline in prices in the early years of the current decade was a gradual and continuous increase in coffee production throughout the world, particularly the new coffee exporting countries entering the international market, a good example being Vietnam. Global coffee production grew faster than demand leading to large surpluses of production. Our chart below shows the average monthly price for coffee in the world markets. The price chart shows a composite price for the different grades of coffee such as Robusta and Arabica beans. From the second half of 1997 through to the trough of prices in 2001, the average price of coffee collapsed from $180 per lb to less than $40 per lb. Prices remained very low until 2004 since when there has been some recovery in prices, but they remain well below the levels witnessed in the mid 1990s.

- 92 -
© Tutor2u Limited 2008 www.tutor2u.net
Monthly average composite price, US dollars per lb. Source: International Coffee OrganisationWorld Coffee Price
Source: Reuters EcoWin
95 96 97 98 99 00 01 02 03 04 05 06 07
25
50
75
100
125
150
175
200
USc
/lb
25
50
75
100
125
150
175
200
Consumption of coffee and price elasticity of demand World coffee consumption is estimated at 114.7 million bags in 2005. Domestic consumption in exporting countries in 2005 was just over 30 million bags and in importing countries consumption was estimated at just fewer than 85 million bags. The main buyers of raw coffee beans are the largest multinational buyers, dominated by four firms: Nestlé, Kraft, Procter & Gamble and Sara Lee.
A coffee roasting plant
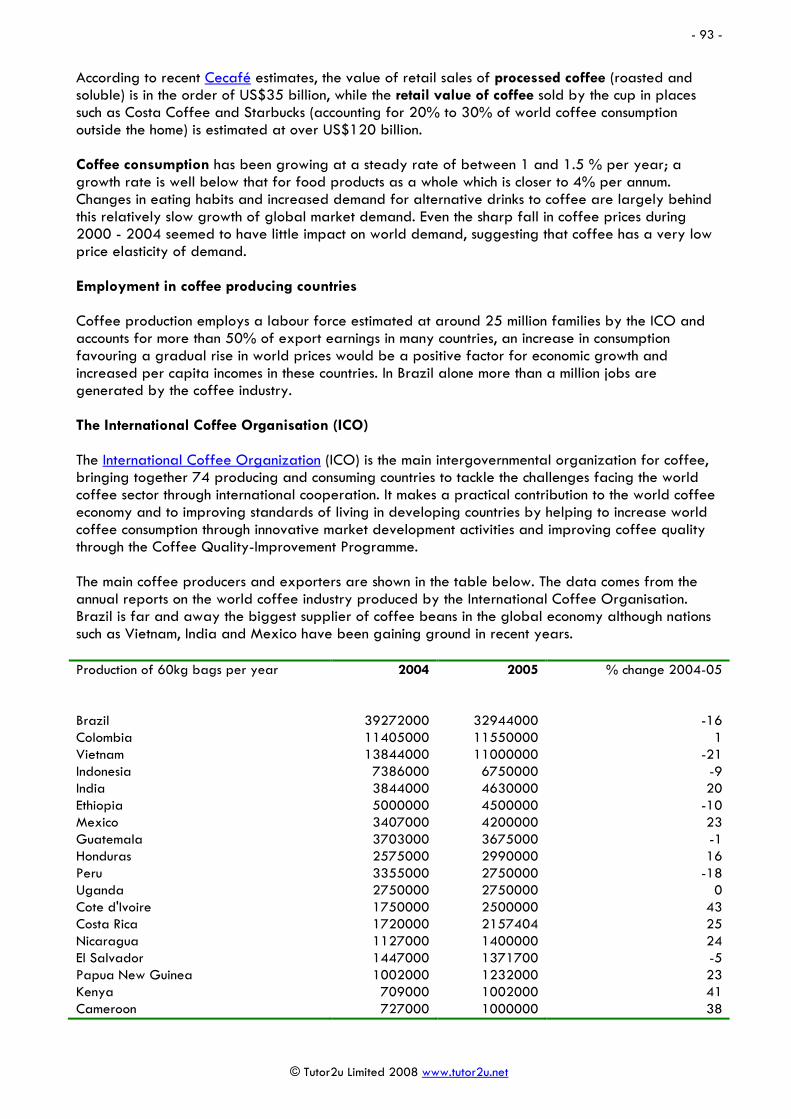
- 93 -
© Tutor2u Limited 2008 www.tutor2u.net
According to recent Cecafé estimates, the value of retail sales of processed coffee (roasted and soluble) is in the order of US$35 billion, while the retail value of coffee sold by the cup in places such as Costa Coffee and Starbucks (accounting for 20% to 30% of world coffee consumption outside the home) is estimated at over US$120 billion. Coffee consumption has been growing at a steady rate of between 1 and 1.5 % per year; a growth rate is well below that for food products as a whole which is closer to 4% per annum. Changes in eating habits and increased demand for alternative drinks to coffee are largely behind this relatively slow growth of global market demand. Even the sharp fall in coffee prices during 2000 - 2004 seemed to have little impact on world demand, suggesting that coffee has a very low price elasticity of demand. Employment in coffee producing countries Coffee production employs a labour force estimated at around 25 million families by the ICO and accounts for more than 50% of export earnings in many countries, an increase in consumption favouring a gradual rise in world prices would be a positive factor for economic growth and increased per capita incomes in these countries. In Brazil alone more than a million jobs are generated by the coffee industry. The International Coffee Organisation (ICO) The International Coffee Organization (ICO) is the main intergovernmental organization for coffee, bringing together 74 producing and consuming countries to tackle the challenges facing the world coffee sector through international cooperation. It makes a practical contribution to the world coffee economy and to improving standards of living in developing countries by helping to increase world coffee consumption through innovative market development activities and improving coffee quality through the Coffee Quality-Improvement Programme. The main coffee producers and exporters are shown in the table below. The data comes from the annual reports on the world coffee industry produced by the International Coffee Organisation. Brazil is far and away the biggest supplier of coffee beans in the global economy although nations such as Vietnam, India and Mexico have been gaining ground in recent years. Production of 60kg bags per year 2004 2005 % change 2004-05
Brazil 39272000 32944000 -16 Colombia 11405000 11550000 1 Vietnam 13844000 11000000 -21 Indonesia 7386000 6750000 -9 India 3844000 4630000 20 Ethiopia 5000000 4500000 -10 Mexico 3407000 4200000 23 Guatemala 3703000 3675000 -1 Honduras 2575000 2990000 16 Peru 3355000 2750000 -18 Uganda 2750000 2750000 0 Cote d'Ivoire 1750000 2500000 43 Costa Rica 1720000 2157404 25 Nicaragua 1127000 1400000 24 El Salvador 1447000 1371700 -5 Papua New Guinea 1002000 1232000 23 Kenya 709000 1002000 41 Cameroon 727000 1000000 38

- 94 -
© Tutor2u Limited 2008 www.tutor2u.net
Brazil is effectively the “swing producer” for the global coffee markets, in other words, since Brazil is the largest coffee producer, changes in Brazil's supplies of coffee account for a large portion of the change in the world total supplies of coffee which then directly affects the prevailing international price. Brazilian coffee production peaked at 3.75 million tons in the year 2000 but fell into a steep recession from 2001 onwards as producers cut back supply in the wake of the collapse in coffee prices. Supply has stabilised in 2004 and 2005 with prices recovering ground.
Monthly value of exports, $ million (bottom pane) and world price (top pane)Coffee Prices and value of Exports of Brazilian Coffee
Source: Reuters EcoWin
00 01 02 03 04 05 06 07
milli
ons
50
100
150
200
250
300
350
USD
(milli
ons)
50
100
150
200
250
300
350
Brazilian coffee export revenues
405060708090
100110
USc
/lb
405060708090
100110
ICO Coffee Price
As we can see there is a relationship between the current world price and the value of exports of coffee from nations such as Brazil. Factors such as changes in the exchange rate can influence the income that coffee exporting countries will generate from their overseas sales. But for Brazil, the recovery in prices since 2004 has been important in boosting for their export incomes. The decline in the value of coffee exports in 2007 is largely due to the fall in the value of the US dollar- the currency used to value trade in coffee. Background reading on the coffee market International Coffee Organization (ICO) Fair Trade campaign on coffee prices The hidden cost of your £2 latte – The Guardian, May 2007 Starbucks in Ethiopia coffee row – BBC news online, June 2007 Film highlights coffee industry – BBC news online, June 2007 Tracking the true cost of coffee – BBC news online, April 2007

- 95 -
© Tutor2u Limited 2008 www.tutor2u.net
22. Production and Costs In this chapter we consider the background to the theory of supply by considering the concepts of production and productivity and how they relate to the costs that all businesses must face. Production Production refers to the output of goods and services produced by businesses within a market. Production creates the supply that allows our changing needs and wants to be satisfied. To simplify the idea of the production function, economists create a number of time periods for analysis.
1. Short run production The short run is a period of time when there is at least one fixed factor input. This is usually capital such as plant and machinery and the stock of buildings and technology. In the short run, the output of a business expands when more variable factors of production (e.g. labour, raw materials and components) are brought into use.
2. Long run production In the long run, all of the factors of production can change giving a business the opportunity to increase the scale of its operations by adding extra labour and capital and introducing new technology into their operations.
The long run for a retail business such as Pret a Manger will be different from the long run for the power generation industry. The long run is when all factors of production are variable – there are no fixed factors!
The length of time between the short and the long run will vary from industry to industry. For example, how long would it take a newly created business delivering sandwiches around a local town to move from the short to the long run? Let us assume that the business starts off with leased premises to make the sandwiches; two leased vehicles for deliveries and five full-time and part-time staff. In the short run, they can increase production by using more raw materials and by bringing in extra staff as required. But if demand grows, it wont take the business long to perhaps lease another larger building, buy in some more capital equipment and also lease some extra delivery vans – by the time it has done this, it has already moved into the long run!

- 96 -
© Tutor2u Limited 2008 www.tutor2u.net
The point is that for some businesses the long run can be a matter of weeks! Whereas for industries that requires expensive capital equipment which may take months or perhaps years to become available, then the long run can be a sizeable period of time. The meaning of productivity When economists and government ministers talk about productivity they are referring to how productive labour is. But productivity is also about other inputs. So, for example, a company could increase productivity by investing in new machinery which embodies the latest technological progress, and which reduces the number of workers required to produce the same amount of output. The government’s objective is to improve labour and capital productivity in the British economy in order to improve the supply-side potential of the country. Productivity and the law of diminishing returns In the example of productivity given below, the labour input is assumed to be the only variable factor by a firm. Other factor inputs such as capital are assumed to be fixed in supply. The “returns” to adding more labour to the production process are measured in two ways: Marginal product (MP) = Change in total output from adding one extra unit of labour Average product (AP) = Total output divided by the total units of labour employed In the example below, a business hires extra units of labour to produce a higher quantity of wheat. The table below tracks the output that results from each level of employment. Units of Labour
Employed Total Physical Product (tonnes of
wheat) Marginal Product (tonnes of
wheat) Average Product (tonnes of wheat)
0 0 1 3 3 3 2 10 7 5 3 24 14 8 4 36 12 9 5 40 4 8 6 42 2 7 7 42 0 6
Diminishing returns occurs when the marginal product of labour starts to fall. In the example above, extra labour is added to a fixed supply of land when a farming business is harvesting wheat. The marginal product is maximized when the 4th worker is employed. Thereafter the output from new workers is falling although output continues to rise until the seventh worker is employed. Notice that once marginal product falls below average product we have reached the point where average product is maximized – i.e. we have reached the point of productive efficiency. Explaining the law of diminishing returns The law of diminishing returns occurs because factors of production such as labour and capital inputs are not perfect substitutes for each other. This means that resources used in producing one type of product are not necessarily as efficient when switched to the production of another good or service. For example, workers employed in producing glass for use in the construction industry may not be as efficient if they have to be re-employed in producing cement or kitchen units. Likewise many items of equipment are specific to one type of production. We say that factors of production such as labour and capital can be “occupationally immobile” i.e. they can be switched from one use to another, but with a loss of productivity.

- 97 -
© Tutor2u Limited 2008 www.tutor2u.net
There is normally an inverse relationship between the productivity of the factors of production and the unit costs of production for a business. When productivity is low, the unit costs of supplying a good or service will be higher. It follows that if a business can achieve higher levels of efficiency among its workforce, there may well be a benefit from lower costs and higher profits. Costs of production Costs are defined as those expenses faced by a business when producing a good or service for a market. Every business faces costs and these must be recouped from selling goods and services at different prices if a business is to make a profit from its activities. In the short run a firm will have fixed and variable costs of production. Total cost is made up of fixed costs and variable costs (1) Fixed Costs These costs relate do not vary directly with the level of output. Examples of fixed costs include:
1. Rent paid on buildings and business rates charged by local authorities. 2. The depreciation in the value of capital equipment due to age. 3. Insurance charges. 4. The costs of staff salaries e.g. for people employed on permanent contracts. 5. Interest charges on borrowed money. 6. The costs of purchasing new capital equipment. 7. Marketing and advertising costs.
(2) Variable Costs Variable costs vary directly with output. I.e. as production rises, a firm will face higher total variable costs because it needs to purchase extra resources to achieve an expansion of supply. Examples of variable costs for a business include the costs of raw materials, labour costs and other consumables and components used directly in the production process. Rising costs for cheese makers Cheese makers in the UK are struggling to keep prices down as a shortage of milk affects the dairy industry. Farmers are warning the cost of milk could go up as food prices generally are affected by the bad weather. Many diary farmers are converting their milk to powder and selling it overseas - which is also driving up prices. According to the Milk Development Council, mild cheddar increased by £350 per tonne compared to June last year, unsalted butter prices were up £600 per tonne and bulk cream prices rose £390 per tonne.
Source: Adapted from BBC news online, July 2007 We can illustrate the concept of fixed cost curves using the table below. The greater the total volume of units produced, the lower will be the fixed cost per unit as the fixed costs are spread over a higher number of units. This is one reason why mass-production can bring down significantly the unit costs for consumers – because the fixed costs are being reduced continuously as output expands. In our example below, a business is assumed to have fixed costs of £30,000 per month regardless of the level of output produced. The table shows total fixed costs and average fixed costs (calculated by dividing total fixed costs by output).

- 98 -
© Tutor2u Limited 2008 www.tutor2u.net
Output (000s) Total Fixed Costs (£000s) Average Fixed Cost (AFC) 0 30 1 30 30 2 30 15 3 30 10 4 30 7.5 5 30 6 6 30 5 7 30 4.3
When we add variable costs into the equation we can see the total costs of a business. The table below gives an example of the short run costs of a firm Output Units
Total Fixed Cost TFC (£s)
Total Variable Cost TVC (£s)
Total Cost TC (£s)
Average Total Cost ATC (£ per unit)
Marginal Cost MC (£)
0 100 0 100 20 100 40 140 7.0 2.0 40 100 60 160 4.0 1.0 60 100 74 174 2.9 0.7 80 100 84 184 2.3 0.5
100 100 90 190 1.9 0.3 120 100 104 204 1.7 0.7 140 100 138 238 1.7 1.7 160 100 188 288 1.8 2.5 180 100 260 360 2.0 3.6 200 100 360 460 2.3 5.0
Average Total Cost (ATC) is the cost per unit of output produced. ATC = TC divided by output Marginal cost (MC) is the change in total costs resulting from the production of one extra unit of output. In other words, it is the cost of expanding production by a very small amount. Long run costs of production The long run is a period of time in which all factor inputs can be changed. The firm can therefore alter the scale of production. If as a result of such an expansion, the firm experiences a fall in long run average total cost, it is experiencing economies of scale. Conversely, if average total cost rises as the firm expands, diseconomies of scale are happening. The table below shows a simple example of the long run average cost of a business in the long run when average costs are falling, then economies of scale are being exploited by the business.
Long Run Output (units per month) Total Costs (£s) Long Run Average Cost (£s per unit) 1,000 8,500 8.5 2,000 15,000 7.5 5,000 36,000 7.2
10,000 65,000 6.5 20,000 120,000 6.0 50,000 280,000 5.6 100,000 490,000 4.9 500,000 2,300,000 4.6

- 99 -
© Tutor2u Limited 2008 www.tutor2u.net
23. Economies and Diseconomies of Scale This chapter focuses on long run costs, the effect of economies of scale on unit costs and the effects of economies of scale on prices and competition in markets. What are economies of scale? Economies of scale are the cost advantages that a business can exploit by expanding their scale of production in the long run. The effect is to reduce the long run average (unit) costs of production over a range of output. These lower costs are an improvement in productive efficiency and can feed through to consumers in the form of lower market prices. But they can also give a business a competitive advantage in the market. They lead to lower prices but also higher profits, consumers and producers will both benefit. There are many different types of economy of scale and depending on the particular characteristics of an industry, some are more important than others.
• Why can you now buy high-performance personal computers for just a few hundred pounds when a similar computer might have cost you over £2000 just a few years ago?
• Why is it that the average market price of digital cameras is falling all the time? The answer is that scale economies have been exploited bringing down the unit costs of production and feeding through to lower prices for consumers. Internal economies of scale (IEoS) Internal economies of scale arise from the growth of the firm itself. Examples include:
1. Technical economies of scale:
a. Large-scale businesses can afford to invest in expensive and specialist capital machinery. For example, a national supermarket chain such as Tesco or Sainsbury can invest in technology that improves stock control. It would not, however, be viable or cost-efficient for a small corner shop to buy this technology.
b. Specialisation of the workforce: Within larger firms they split complex production processes into separate tasks to boost productivity. The division of labour in mass production of motor vehicles and in manufacturing electronic products is an example.
c. The law of increased dimensions. This is linked to the cubic law where doubling the height and width of a tanker or building leads to a more than proportionate increase in the cubic capacity – an important scale economy in distribution and transport industries and also in travel and leisure sectors.
2. Marketing economies of scale and monopsony power: A large firm can spread its advertising and marketing budget over a large output and it can purchase its factor inputs in bulk at negotiated discounted prices if it has monopsony (buying) power in the market. A good example would be the ability of the electricity generators to negotiate lower prices when negotiating coal and gas supply contracts. The major food retailers also have monopsony power when purchasing supplies from farmers and wine growers.
3. Managerial economies of scale: This is a form of division of labour. Large-scale manufacturers employ specialists to supervise production systems. Better management; investment in human resources and the use of specialist equipment, such as networked computers that improve communication raise productivity and reduce unit costs.

- 100 -
© Tutor2u Limited 2008 www.tutor2u.net
4. Financial economies of scale: Larger firms are usually rated by the financial markets to be more ‘credit worthy’ and have access to credit facilities, with favourable rates of borrowing. In contrast, smaller firms often face higher rates of interest on their overdrafts and loans. Businesses quoted on the stock market can normally raise fresh money (i.e. extra financial capital) more cheaply through the issue of equities. They are also likely to pay a lower rate of interest on new company bonds issued through the capital markets.
5. Network economies of scale: There is growing interest in the concept of a network economy of scale. Some networks and services have huge potential for economies of scale. That is, as they are more widely used (or adopted), they become more valuable to the business that provides them. The classic examples are the expansion of a common language and a common currency. We can identify networks economies in areas such as online auctions, air transport networks. Network economies are best explained by saying that the marginal cost of adding one more user to the network is close to zero, but the resulting benefits may be huge because each new user to the network can then interact, trade with all of the existing members or parts of the network. The rapid expansion of e-commerce is a great example of the exploitation of network economies of scale – how many of you are devotees of the EBay web site?
Two good examples of economies of scale – huge freight tankers and large-scale storage facilities Illustrating economies of scale – the long run average cost curve The diagram below shows what might happen to the average costs of production as a business expands from one scale of production to another. Each short run average cost curve assumes a given quantity of capital inputs. As we move from SRAC1 to SRAC2 to SRAC3, so the scale of production is increasing. The long run average cost curve (drawn as the dotted line below) is derived from the path of these short run average cost curves.

- 101 -
© Tutor2u Limited 2008 www.tutor2u.net
Exploiting economies of scale – TNT In January 2006, the market for postal services was opened up to competition thus ending the monopoly of the Royal Mail in the delivery of letters to households and businesses. Attention is now focusing on some of the likely rivals to the Royal Mail in the newly competitive market. One such business is TNT logistics. TNT Express Services was established in the UK in 1978, the company has developed its dominant position in the time-sensitive express delivery market through organic growth and, with an annual turnover in excess of £750 million. TNT employs 10,600 people in the UK & Ireland and operates more than 3,500 vehicles from over 70 locations. TNT Express Services delivers hundreds of thousands of consignments every week - in excess of 50 million items per year.
Source: TNT investor relations web site
Why are economies of scale important for a business such as TNT? What types of economies of scale might the business be able to exploit in the long run?
Costs
Output (Q)
SRAC1
SRAC2 SRAC3
Q1 Q2 Q3
AC1
AC2
AC3
LRAC
Economies of scale are the advantages of large scale production that result in lower unit (average) costs (cost per unit)

- 102 -
© Tutor2u Limited 2008 www.tutor2u.net
External economies of scale (EEoS) External economies of scale occur outside of a firm, within an industry. Thus, when an industry's scope of operations expand due to for example the creation of a better transportation network, resulting in a subsequent decrease in cost for a company working within that industry, external economies of scale are said to have been achieved. Another good example of external economies of scale is the development of research and development facilities in local universities that several businesses in an area can benefit from. Likewise, the relocation of component suppliers and other support businesses close to the main centre of manufacturing are also an external cost saving. Diseconomies of scale A firm may eventually experience a rise in long run average costs caused by diseconomies of scale. Diseconomies of scale a firm may experience relate to:
1. Control – monitoring the productivity and the quality of output from thousands of employees in big corporations is imperfect and costly – this links to the concept of the principal-agent problem – how best can managers assess the performance of their workforce when each of the stakeholders may have a different objective or motivation?
2. Co-operation - workers in large firms may feel a sense of alienation and subsequent loss of morale. If they do not consider themselves to be an integral part of the business, their productivity may fall leading to wastage of factor inputs and higher costs
Do economies of scale always improve the welfare of consumers? There are some disadvantages and limitations of the drive to exploit economies of scale.
Standardization of products: Mass production might lead to a standardization of products – limiting the amount of effective consumer choice in the market
Lack of market demand: Market demand may be insufficient for economies of scale to be fully exploited. Some businesses may be left with a substantial amount of excess capacity if they over-invest in new capital
Developing monopoly power: Businesses may use economies of scale to build up monopoly power in their own industry and this might lead to a reduction in consumer welfare and higher prices in the long run – leading to a loss of allocative inefficiency
Protecting monopoly power: Economies of scale might be used as a form of barrier to entry – whereby existing firms have sufficient spare capacity to force prices down in the short run if there is a threat of the entry of new suppliers
Suggestions for reading on economies of large scale production How world's biggest ship is delivering our Christmas - all the way from China (Guardian)
- 103 -
© Tutor2u Limited 2008 www.tutor2u.net
24. Productivity The American economist Paul Krugman once said that “productivity isn’t everything, but in the long run it is almost everything.” We take a look at productivity in this chapter. Productivity is a measure of the efficiency of the labour force measured by output per worker employed or production per worker hour. There are good economic justifications for wanting to raise the level of productivity although the key is the way in which this can be achieved. The advantages of higher productivity for a business and for the economy ‘Productivity is the main determinant of national living standards – it quantifies how an economy uses the resources it has available, by relating the quantity of inputs to output. As the adage goes: productivity isn't everything, but in the long run it’s almost everything.’ (source: LSE report) Higher productivity can provide the economy with a number of advantages over time
(1) Lower average costs: Improvements in productivity allow businesses to produce output at a lower average cost. These cost savings might be passed onto consumers in lower prices, encouraging higher demand, more output and possibly an increase in employment.
(2) Improved competitiveness in international markets: Productivity growth and lower unit costs are key determinants of the competitiveness of British firms in overseas markets.
(3) Higher profits: Efficiency gains resulting in rising productivity are a source of larger profits for companies which might be re-invested to support the long term growth of the business
(4) Higher wages: Put simply, businesses are better able to afford higher wages when their labour force is more efficient
(5) Economic growth: A country’s capacity to produce goods and services depends on the stock of factor resources available plus the productivity of those factors. If the British economy can raise the rate of growth of productivity then the trend growth of national output can pick up. This has implications for living standards, unemployment and tax revenues and government spending in future years
The productivity gap The level of GDP per worker and GDP per hour worked in the UK is well below that of the United States, France and Germany. This is known as the productivity gap. Some progress has been made in closing the gap but there is still much work to do. Despite these recent improvements, research from the London School of Economics has found that output per hour worked in the UK is still about 13% lower than Germany’s, 18% below the US level and 20% below France. Factors explaining the productivity gap No one factor on its own is sufficient to explain the differences in efficiency. Some of the more widely quoted reasons are summarized below:
(1) Relatively low rates of capital investment – the government believes that the productivity gap is partly the result of a long-term investment gap, i.e. the failure of the economy to invest and thereby to raise the stock of physical capital available to the workforce
(2) Low rates of spending on research and development – The percentage of GDP allocated to R&D spending has been on a downward trend for some years. The UK now devotes much less of GDP to research spending than other nations and this impacts on the pace of innovation and the speed with which new technology is incorporated into production

- 104 -
© Tutor2u Limited 2008 www.tutor2u.net
(3) Skills of the labour force – there are long-standing concerns about the educational skills of the UK labour force including basic literacy and the quality of job specific training. Although governments have made numerous attempts to reform the education system over the last two decades, and have pumped increasing resources into improved vocational and academic education, Britain still has one of the highest rates of functional illiteracy among adults, together with fewer workers with higher skills (at degree level or above) compared to the United States and fewer workers with intermediate and vocational skills compared to Germany and Japan.
(4) Over-regulation of industry and commerce and a lack of competition – the 1999 McKinsey Report highlighted a lack of competitive pressures in some industries (notably retailing) as a source of inefficiency and low productivity growth. Opening up markets to the discipline of competition was seen by the McKinsey study as a necessary supply-side economic strategy to bring new businesses into markets and weed out inefficiencies.
Skills gap and low profits contribute to poor productivity A recent study from the Engineering Employers Federation finds that fewer firms in Britain take on apprentices, investment projects are often ditched by managers and skilled workers are in short supply. The EEF argues that UK firms need to invest in capital equipment and skills and innovation, as well as making the best of modern working practices such as lean manufacturing and high performance working. Part of the problem for manufacturers has been a lack of profits to invest.
Adapted from research published by the Engineering Employers Federation www.eef.org.uk
‘Productivity in Britain continues to lag behind that of our main European competitors. One important reason is the large number of workers in Britain who have low skills and, consequently, low productivity and low pay. Many young people still fail to acquire any adequate level of skill. Young people with low skills on the UK labour market are faced with restricted employment opportunities, and the prospect of a poor quality job.’
Adapted from research published by House of Lords Economic Affairs Committee, July 2007
Report into low UK productivity by economists at the London School of Economics The persistent productivity gap between the UK and the two big continental European economies can mainly be 'explained' by the fact that they have more capital invested per worker and their workers are more skilled. Productivity growth is highest in industries with greater product market competition - where less productive firms contract and close while new more productive ones open and grow; and where competitive pressures force existing firms to improve. If the UK could reach French productivity levels, we could award ourselves 20% higher wages or take a day off and still earn the same. Or we could spend the extra resources on schools and hospitals, greater benefits for the needy or lower taxes. Capital investment plays an important role in productivity growth. But the UK has less physical capital per worker than the United States and considerably less than France and Germany. Many explanations have been offered for these shortfalls, including macroeconomic instability and business uncertainty.
Productivity in the UK Car Industry A good example of the differences in productivity between the UK and our European competitors is shown by the annual assessment of productivity in the automotive industry.

- 105 -
© Tutor2u Limited 2008 www.tutor2u.net
Nissan leads productivity in the European Car Manufacturing Sector A British car plant was today named as the most productive in Europe for the seventh year running. Bosses praised the efforts of workers at the Nissan factory in Sunderland. Productivity at the Nissan plant was 99 units per employee, followed by Renault’s plant in Spain at 89 and Toyota Motor Corp's plant in France at 88. The UK's biggest car plant, Nissan in Sunderland, is also more than five per cent more productive than the most efficient car plant in North America according to a major international study. The Harbour Report measures the productivity of car plants on a labour hours/vehicle basis. It showed that in 2004 the average combined time it took Sunderland to build its three models (Micra, Almera and Primera) was a fraction over 15 hours per car. This is 5.1 per cent better than the top-ranked plant in North America, which averaged 15.85 hours per car.
Source: Adapted from news reports in 2005
Britain has some of the most efficient car plants in the EU – but also some of the worst. This two speed car industry suggests that there are structural reasons behind productivity differences. Nissan has remained at the top of the European productivity league for each of the last seven years. Those industries with the most up-to-date capital machinery, together with advanced managerial skills and highly qualified and well-trained workforces tend to achieve much higher levels of productivity. The availability of large-scale green-field, full-integrated production plants and good industrial relations are also at the heart of achieving year on year improvements in output per person employed.
The strength of demand also affects productivity. When demand is high and production plants are running close to full capacity, then output per worker employed is likely to be rising because factor resources including labour and capital are being used to their full extent. In contrast, during a recession or a slowdown in demand, the utilisation of labour and capital falls. Productivity growth often slows down during a period of weak demand and falling output. Suggestions for more reading on productivity Britain clocks up a dismal record on productivity (David Smith, Economics UK, 2004) Closing the UK's productivity gap (Management Issues, July 2006) Our ill-trained youth will kick Britain out of the economic elite (Liam Halligan, Telegraph, July 2007) Britain narrows productivity gap (Guardian, June 2007) UK productivity during the Blair era (LSE, June 2007) The Office for National Statistics Guide to Productivity
How can the government help to raise productivity in the UK economy? Our efficiency levels are lower than most of our major competitor countries.

- 106 -
© Tutor2u Limited 2008 www.tutor2u.net
25. Economic Efficiency This chapter introduces you to the idea of efficiency. Efficiency is really about a society making the best or optimal use of our scarce resources to satisfy most wants & needs. Defining efficiency Confusingly, there are several meanings of the term economic efficiency but they generally relate to how well a market or the economy allocates our scarce resources to satisfy consumers. Normally the market mechanism is good at allocating these resources, but there are occasions when the market can fail. We will return to this when we study market failure in more detail. Here are the main types of efficiency: Allocative efficiency Allocative efficiency is concerned with whether the resources we have available are actually used to produce the goods and services that we want and which we place the greatest value on. Allocative efficiency is reached when no one can be made better off without making someone else worse off. Have a look at the next diagram.
Allocative efficiency occurs when the value that consumers place on a good or service (reflected in the price they are willing and able to pay) equals the cost of the resources used up in production. The technical condition required for allocative efficiency is that price = marginal cost. In the diagram above, the market is in equilibrium at price P1 and output Q1. At this point, the total area of consumer and producer surplus is maximised. If for example, suppliers were able to restrict output to Q2 and hike the market price up to P2, sellers would gain extra producer surplus by widening their profit margins, but there also would be an even greater loss of consumer surplus. Thus P2 is not an allocative efficient allocation of resources for this market whereas P1, the market equilibrium price is deemed to be allocative efficient.
Costs Revenues
Output (Q)
Demand
Supply
P1
Q1
Consumer Surplus (CS)
Producer Surplus (PS)
Consumer Surplus (CS)
Producer Surplus (PS)
Q2
P2

- 107 -
© Tutor2u Limited 2008 www.tutor2u.net
We will see when we study the economics of monopoly that when businesses have lots of ‘pricing power’ in their own markets, they may opt to increase their profit margins to squeeze some extra profit from consumers (in economics-speak, they are turning consumer surplus into producer surplus). This has an effect on allocative efficiency for if a monopoly supplier can select a price well above the costs of supply, consumers will suffer a reduction in their welfare. Have you ever felt ripped off buying sandwiches from a motorway service station? The producer has become better off but someone else (aka the consumer) has become worse off. Using the production possibility frontier to show allocative efficiency Vilfredo Pareto defined allocative efficiency as a position where no one could be made better off without making someone else at least as worth off. This can be illustrated using a production possibility frontier – all points that lie on the PPF can be said to be allocatively efficient because we cannot produce more of one product without affecting the amount of all other products available. In the diagram below, the combination of output shown by Point A is allocatively efficient as is the combination shown at point B – but at the output combination denoted by the point X we can increase production of both goods by making fuller use of existing resources or increasing the efficiency of production.
An allocation is Pareto-efficient for a given set of consumer tastes, resources and technology, if it is impossible to move to another allocation which would make some people better off and nobody worse off. If every market in the economy is a competitive free market, the resulting equilibrium throughout the economy will be Pareto-efficient. Productive Efficiency
Productive efficiency refers to a firm's costs of production. It is achieved when the output is produced at minimum average total cost (ATC) i.e. when a firm is exploiting the available economies of scale. Productive efficiency also exists when producers minimise the wastage of resources in their production processes.
Output of Consumer Goods
Output of Capital Goods
C2
C1
X2 X1
A
B
X

- 108 -
© Tutor2u Limited 2008 www.tutor2u.net
Dynamic Efficiency
Dynamic efficiency occurs over time and it focuses on changes in the amount of consumer choice available in markets together with the quality of goods and services available.
Social Efficiency
The socially efficient level of output and or consumption occurs when social benefit = social cost. At this point we maximise social welfare. The existence of negative and positive externalities means that the private optimum level of consumption or production often differs from the social optimum leading to some form of market failure and a loss of social welfare. In the diagram below the socially optimum level of output occurs where the social cost of production (i.e. the private cost of the producer plus the external costs arising from externality effects) equals demand (a reflection of private benefit from consumption. A private producer who opts to ignore the negative production externalities might choose to maximise their own profits at point A. This divergence between private and social costs of production can lead to market failure.
Output (Q)
Demand = Private Benefit = Social Benefit
Private Cost (Supply)
Q1
Costs Revenues
Social Cost
Q2
External Cost P1
P2
Innovation as a source of dynamic efficiency
Dynamic efficiency is improved when businesses bring to the market goods and services that are innovative and high quality and which offer consumers greater choice.

- 109 -
© Tutor2u Limited 2008 www.tutor2u.net
26. Market Failure When markets do not provide us with the best outcome in terms of efficiency and fairness, then we say that there exists market failure. What is market failure?
Market failure occurs whenever markets operating without government intervention, fail to deliver an efficient allocation of resources and the result is a loss of welfare. Market failure exists when the competitive outcome of markets is not satisfactory from the point of view of society. Complete and partial market failure One useful distinction is between complete market failure when the market simply does not supply products at all (i.e. we see “missing markets”), and partial market failure, when the market does actually function but it produces either the wrong quantity of a product or at the wrong price. Markets can fail for lots of reasons and the main causes of market failure are summarized below:
(1) Negative externalities (e.g. the effects of environmental pollution) causing the social cost of production to exceed the private cost
(2) Positive externalities (e.g. the provision of education and health care) causing the social benefit of consumption to exceed the private benefit
(3) Imperfect information means merit goods are under-produced while demerit goods are over-produced or over-consumed
(4) The private sector in a free-markets cannot profitably supply to consumers pure public goods and quasi-public goods that are needed to meet people’s needs and wants
(5) Market dominance by monopolies can lead to under-production and higher prices than would exist under conditions of competition
(6) Factor immobility causes unemployment hence productive inefficiency
(7) Equity (fairness) issues. Markets can generate an ‘unacceptable’ distribution of income and consequent social exclusion which the government may choose to change
Root causes of market failure
Lack of competition
Externalities in production & consumption
Information Failure
Immobility of Factors of Production
Public and Merit Goods (Missing
Markets)
Poverty and Inequality in an
economy

- 110 -
© Tutor2u Limited 2008 www.tutor2u.net
27. Competition and Monopoly in Markets In this chapter we are going to consider the nature of competition within different industries. A market structure is the characteristics of a market which can affect the behaviour of businesses within the market and also influence the outcome of a market in terms of economic efficiency and the welfare of consumers. Some of the main aspects of market structure are listed below:
• The number of firms in the market and extent of overseas competition
• The market share of the largest firms
• The nature of production costs in the short and long run e.g. the ability of businesses to exploit economies of scale
• The extent of product differentiation i.e. to what extent do the businesses in the market try to make their products different from those of competing firms?
• The price and cross price elasticity of demand for different products within the market
• The number and the power of buyers of the industry’s main products
• The turnover of customers (also known as ‘market churn’) – this is a measure of the number of consumers who switch suppliers each year and it is affected by the strength of brand loyalty and the effects of marketing. For example, have you changed your bank account or your mobile phone service provider in the last year? What might stop you doing this?
The market for detergents – a duopoly Market share in 2005 (per cent) Proctor & Gamble 54
Of which Ariel 20 Bold 16 Daz 9
Unilever 30 Of which
Persil 24 Surf 6
Others / supermarket own-label 16 Source: Mintel Research
The market for detergents and fabric conditioners is dominated by two producers, Proctor & Gamble and Unilever. The total value of the market for clothes-washing detergents and laundry aids was worth around £1.42 billion in 2005 with 75 per cent of this market being taken up by sales of detergents. Proctor & Gamble and Unilever account for 84 per cent of the market with the remaining market share being taken mainly by the own-label sales of the major supermarkets. This market is an example of a duopoly. Some of the features of this market are as follows:
• Demand for liquid detergents has a low income elasticity of demand but the demand for ancillary products such as fabric conditioners is more income elastic
• Heavy spending on advertising and marketing by each of the two major players • Investment in research and development to change the formulations in the detergents and to
expand the brands available. Investment has also focused on creating new products such as stain removers, fresheners and creation of more environmentally-friendly products
• Many consumers are brand-loyal, especially older people with ingrained habits

- 111 -
© Tutor2u Limited 2008 www.tutor2u.net
The market for gas and electricity supplies – an oligopoly The market for gas supply in the UK was privatised in 1986 with the market for electricity generation and distribution also transferred to the private sector of the economy a few years later. Since then there have been changes in the market share of the leading electricity distribution companies and domestic gas suppliers with the former state monopolies losing much of their dominance over this time. There are 26 million domestic electricity and 21.5 million domestic gas customers in Great Britain, supplied mainly by six suppliers. Supplier Market Shares in Electricity Market Shares in Gas December 2002 March 2007 December 2002 March 2007 British Gas 22 21 63 46 PowerGen 22 19 12 13 SSE 13 18 6 13 Npower 16 16 9 12 Scottish Power 10 12 5 9 EDF Energy 15 14 5 7
Source: OFGEM The UK energy market is split into three elements. Suppliers sell electricity and gas to final commercial, industrial and household consumers. Distributors are companies responsible for getting energy to users e.g. by building and maintaining the infrastructure of pipes and cables in the road and in installing meters. Thirdly, generators are responsible for generating the energy used in homes, offices, shops and factories. The retail market for energy is competitive because all customers are now able to change their gas or electricity supplier. That said many people do not switch their suppliers even when they might be able to make savings on their gas or electricity bill. One reason is that people do not find it easy to get accurate information about what the differences are between these competing suppliers. The industry regulator OFGEM believes that the opening up of the market to competition has worked well over the last fifteen years. They claim for example that four million customers changed gas and electricity suppliers in the first ten months of 2006 responding to a series of gas and electricity price rises by switching their energy supplier. Their energy-watch web site is designed to improve flows of information for consumers so that more of them can switch supplier. The gas and electricity supply industry is best described as an oligopoly since virtually the whole market is taken by the six leading businesses. But the market is competitive because consumers have a real choice about who will sell them their energy. The market share of new entrants into the industry since privatisation is now above 40 per cent for both gas and electricity. British Gas has seen a steady and persistent decline in its share of the gas market and by March 2006 this was down to 52 per cent compared to 63 per cent in the winter of 2002. What is a monopoly? There are several meanings of the term monopoly:
1. A pure monopolist in an industry is a single seller. It is quite rare for a firm to have a pure monopoly – except when the industry is state owned and has a legally protected monopoly position. The Royal Mail used to have a statutory monopoly on delivering household mail. But this is now changing as the industry has been opened up to fresh competition.
2. A working monopoly: A working monopoly is any firm with greater than 25% of the industries' total sales. In practice, there are many markets where businesses enjoy some degree of monopoly power even if they do not have a twenty-five per cent market share. In the UK market for breakfast cereals for example, Kellogg’s had a 39 per cent share of a

- 112 -
© Tutor2u Limited 2008 www.tutor2u.net
market where total sales were 31.2 billion in 2005. Cereal Partners (Nestle) took 17 per cent of the market and Weetabix secured 15 per cent.
3. An oligopolistic industry is characterised by the existence of a few dominant firms, each has market power and which seeks to protect and improves its market position over time.
4. In a duopoly, the majority of market sales are taken by two dominant firms. A good example of this is the market for razors in the UK – one dominated by Gillette and also is Schick (the manufacturers of the Wilkinson Sword brand). Gillette has approximately 70% of the global shaving market.
How monopolies can develop Monopoly power can come from the successful organic (internal) growth of a business or through mergers and acquisitions (also known as the integration of firms).
Horizontal Integration This is where two firms join at the same stage of production in one industry. For example two car manufacturers may decide to merge, or a leading bank successfully takes-over another bank. A good recent example in the UK is the merger between Safeway and Morrisons to create the UK’s fourth largest national food retailer. Another example came in July 2004 with the merger between Travel Inn and Premier Lodges to form Premier Travel Inn. And in August 2005, German sports goods firm Adidas announced an agreement to buy US rival Reebok for £2.1bn. Vertical Integration This is where a firm develops market dominance by integrating with different stages of production in the industry e.g. by buying its suppliers or controlling the main retail outlets. A good example is the oil industry where many of the leading companies are explorers, producers and refiners of crude oil and have their own retail networks for the sale of petrol and diesel and other products.
• Forward vertical integration occurs when a business merges with another business further forward in the supply chain
• Backward vertical integration occurs when a firm merges with another business at a previous stage of the supply chain
The Internal Expansion of a Business Firms can generate higher sales and increased market share by expanding their operations and exploiting possible economies of scale. This is internal rather than external growth and therefore tends to be a slower means of expansion contrasted to mergers and acquisitions. To go back to our previous example, US computer giant Dell succeeded in raising total sales revenue by 58 per cent over the last five years.
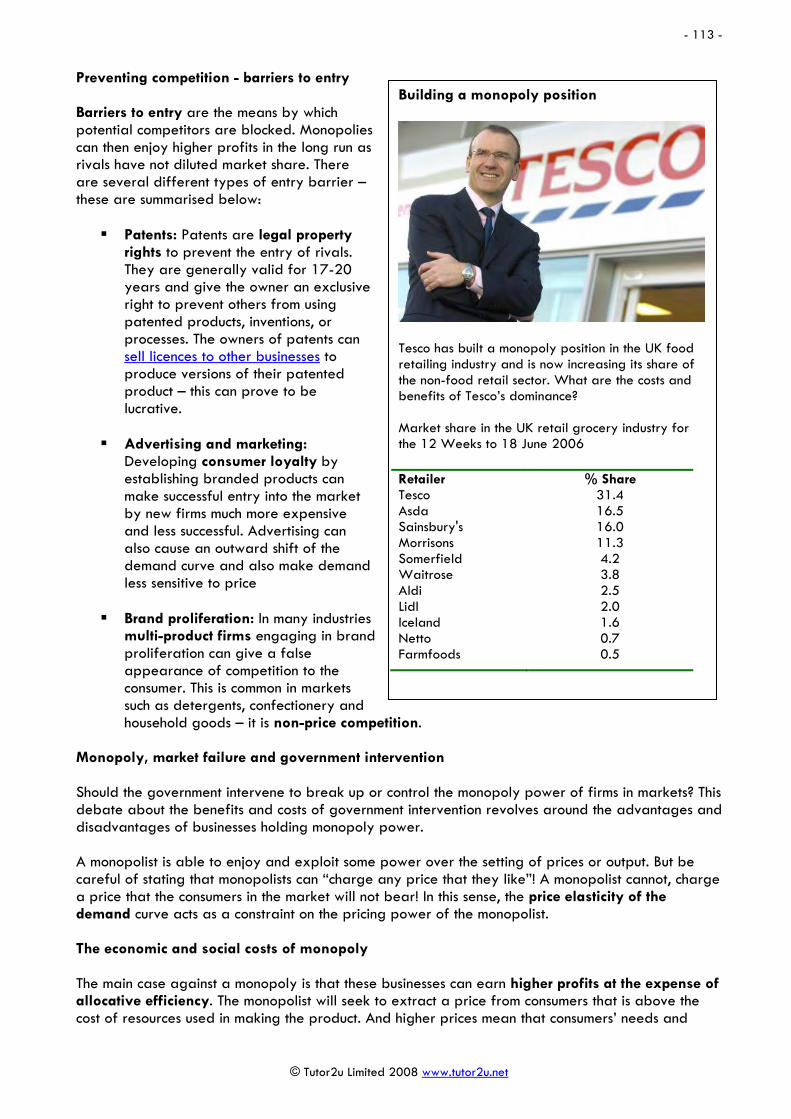
- 113 -
© Tutor2u Limited 2008 www.tutor2u.net
Preventing competition - barriers to entry Barriers to entry are the means by which potential competitors are blocked. Monopolies can then enjoy higher profits in the long run as rivals have not diluted market share. There are several different types of entry barrier – these are summarised below: Patents: Patents are legal property
rights to prevent the entry of rivals. They are generally valid for 17-20 years and give the owner an exclusive right to prevent others from using patented products, inventions, or processes. The owners of patents can sell licences to other businesses to produce versions of their patented product – this can prove to be lucrative.
Advertising and marketing:
Developing consumer loyalty by establishing branded products can make successful entry into the market by new firms much more expensive and less successful. Advertising can also cause an outward shift of the demand curve and also make demand less sensitive to price
Brand proliferation: In many industries multi-product firms engaging in brand proliferation can give a false appearance of competition to the consumer. This is common in markets such as detergents, confectionery and household goods – it is non-price competition.
Monopoly, market failure and government intervention Should the government intervene to break up or control the monopoly power of firms in markets? This debate about the benefits and costs of government intervention revolves around the advantages and disadvantages of businesses holding monopoly power. A monopolist is able to enjoy and exploit some power over the setting of prices or output. But be careful of stating that monopolists can “charge any price that they like”! A monopolist cannot, charge a price that the consumers in the market will not bear! In this sense, the price elasticity of the demand curve acts as a constraint on the pricing power of the monopolist. The economic and social costs of monopoly The main case against a monopoly is that these businesses can earn higher profits at the expense of allocative efficiency. The monopolist will seek to extract a price from consumers that is above the cost of resources used in making the product. And higher prices mean that consumers’ needs and
Building a monopoly position
Tesco has built a monopoly position in the UK food retailing industry and is now increasing its share of the non-food retail sector. What are the costs and benefits of Tesco’s dominance? Market share in the UK retail grocery industry for the 12 Weeks to 18 June 2006 Retailer % Share Tesco 31.4 Asda 16.5 Sainsbury's 16.0 Morrisons 11.3 Somerfield 4.2 Waitrose 3.8 Aldi 2.5 Lidl 2.0 Iceland 1.6 Netto 0.7 Farmfoods 0.5

- 114 -
© Tutor2u Limited 2008 www.tutor2u.net
wants are not being satisfied, as the product is being under-consumed. Under conditions of monopoly, consumer sovereignty has been partially replaced by producer sovereignty.
In the diagrams above we contrast a market where demand is price inelastic (i.e. Ped <1) with one where demand is more sensitive to price changes (i.e. Ped>1). The former is associated with a monopoly where consumers have few close substitutes to choose from. When demand is inelastic, the level of consumer surplus is high, raising the possibility that the monopolist can reduce output and raise price above cost thereby operating with a higher profit margin (measured as the difference between price and average cost per unit).
One way of showing the loss of economic welfare that comes from monopolistic firms exploiting their power is to use supply and demand analysis and the concepts of consumer and producer surplus. If a monopoly reduces output from the equilibrium at Q1 to Q2 then it can sell this at a price P2. This
Price
Output (Q)
Demand
Supply
P1
Q1
Consumer Surplus (CS)
Producer Surplus (PS)
P2
Q2
Loss of economic welfare from price P2 raised above the market equilibrium price
Price
Demand
P2
P1
Q2 Q1
Price
Demand
P2
P1
Q2 Q1
Relatively Inelastic Demand Relatively Elastic Demand
AC
AC
Higher profit margin
Lower profit margin

- 115 -
© Tutor2u Limited 2008 www.tutor2u.net
results in a transfer of consumer surplus into extra producer surplus. But because price is now about the cost of supplying extra units, there is a loss of allocative efficiency. This is shown in the diagram by the shaded area which is not transferred to the producer, merely lost completely because output is lower than it would otherwise be in a competitive market. Higher costs – loss of productive efficiency: Another possible cost of monopoly power is that businesses may allow the lack of real competition to cause a rise in production costs and a loss of productive efficiency. When competition is tough, businesses must keep firm control of their costs because otherwise, they risk losing market share. Some economists go further and say that monopolists may be even less efficient because, if they believe that they have a protected market, they may be less inclined to spend money on research and improved management. These inefficiencies can lead to a waste of scarce resources. The potential benefits of monopoly The possible economic benefits of monopoly power suggest that the government and the competition authorities should be careful about intervening directly in markets and try to break up a monopoly. Market power can bring advantages both to the firms themselves and also to consumers and these should be included in any evaluation of a particular market or industry.
1. Research and Development Spending
Huge corporations enjoying a high level of profits are well placed to allocate some of their profits to fund capital investment spending and research and development projects. The positive spill-over effects of research can be seen in a faster pace of innovation and the development of improved products for consumers. This is particularly the case in industries such as telecommunications and pharmaceuticals. This can lead to gains in dynamic efficiency and social benefits (i.e. positive externalities). The table below provides data from the 2005 UK research and development survey. The top firms are all household names, large scale businesses, and operating in industries and sectors where research spending is hugely important in being competitive against global competition.
Top 15 UK companies by size of R&D investment Company Position in 2000 R&D Growth of R&D
(1 year) Sector
1. GlaxoSmithKline 2 £2839m +2% Pharmaceuticals 2. AstraZeneca 1 £1981m +10% Pharmaceuticals 3. BAe Systems 4 £1110m +1% Aerospace 4. Ford 8 £763m -12% Automotive 5. Unilever 5 £736m -2% Food Producers 6. Pfizer 10 £598m +8% Pharmaceuticals 7. Airbus -* £345m -1% Aerospace 8. Shell 11 £288m -5% Oil & Gas 9. Rolls-Royce 12 £282m 0 Aerospace
10. BT 9 £257m -23% Telecoms 11. BP 14 £229m +26% Oil & Gas 12. Land Rover -* £227m -7% Automotive 13. Vodafone 37 £219m +28% Telecoms
2. Exploitation of Economies of Scale
Because monopoly producers often supply goods and services on a large scale, they may achieve economies of scale – leading to a fall in average costs. Lower costs will lead to an

- 116 -
© Tutor2u Limited 2008 www.tutor2u.net
increase in profits but the gains in productive efficiency might be passed onto consumers through lower prices.
3. Monopolies and International Competitiveness
One argument in support of businesses with monopoly power is that the British economy needs multinational companies operating on a scale large enough to compete in global markets. A firm may enjoy domestic monopoly power, but still face competition in overseas markets. Two good examples of these are UK Coal and Corus, the UK-Dutch owned steel manufacturer.
Government intervention in markets – an introduction to UK competition policy Competition policy involves the regulation of markets so that consumer welfare is protected and improved. It operates in different ways – three of the main competition bodies are the Competition Commission, the Office of Fair Trading and the European Union Competition Authority. The Competition Commission carries out inquiries into matters referred to it by the other UK
competition authorities. Their main concern is to investigate mergers and takeovers to examine if these mergers will have a negative effect on competition.
The Office of Fair Trading reports on allegations of anti-competitive practices including claims of collusive behaviour where businesses are thought to be engaging in price-fixing.
The European Competition Authority monitors competition in the European single market. They examine anti-competitive behaviour, mergers and takeovers between European businesses and investigate state aid to struggling businesses to make sure that subsidies do not reduce or distort competition.
Utility regulators monitor the industries that were privatised during the 1980s and 1990s.
The regulators have used the power to introduce and review price capping and they have also have sought to bring fresh competition into markets. Competition was introduced into the telecommunications in 1984; in Gas from 1996-98 and in Electricity from 1998. Another key role for the regulatory agencies is to monitor the quality of service provision and improve standards for consumers. Examples of utility regulator web sites can be found by using the following links: OFGEM: www.ofgem.gov.uk/ofgem/index.jsp OFWAT: www.ofwat.gov.uk/ OFCOM: www.ofcom.org.uk/
Many markets have firms with monopoly power but they seem to work perfectly well from the point of view of the consumer. Although there is a consensus among many economists that competition is a force for good in the long-run, we should be careful not simply to assume that monopoly power is bad and competition is good. There are persuasive arguments on both sides. In recent years many markets have become more competitive with the entry of new suppliers and much greater choice for consumers. Many factors have contributed to this including:
1. Technological change – e.g. the rise of e-commerce and the internet
2. Globalisation – e.g. fresh low-cost competition from emerging market economies such as China and India
- 117 -
© Tutor2u Limited 2008 www.tutor2u.net
3. Deliberate government policies (in the UK and the European Union) to open up markets and give new businesses the right to compete (e.g. in the markets for postal services, car retailing and telecommunications)
Deregulation of monopoly
An important government policy is to open up markets and encourage the entry of new suppliers into a market where there was monopoly power in the past – a process called deregulation.
Examples of this in the UK include the opening up of markets for household energy and the introduction of competition into Postal Services.
The expansion of the European Union Single Market has accelerated the process of market liberalisation. The Single Market seeks to promote four freedoms – namely the free movement of goods, services, financial capital and labour. In the long term we can expect to see the microeconomic effects of the EU Single Market working their way through many British markets and industries and the general expectation is that competitive pressures for all businesses working inside the European Union will continue to intensify.
Exploiting monopoly power in the rail industry The 72 miles between Bournemouth and Central London can be attacked by a variety of transport modes – coach, rail, car, cycle and even the intrepid walker. But for those dependent on the train, many of whom have forsaken the private car, the cost of making a return journey is about to get more expensive. Rail fares have become so complex that it is a good bet that the majority of people choosing to travel by train simply do not understand the way to get the best deals for their journeys. Virtually every train operating company now provides a labyrinth of deals – for peak and off-peak travel, for advanced and same day journeys, fully-flexible and semi-flexible tickets, group and individual travel. The rail companies have become almost as expert as the low cost airlines in engaging in price discrimination as a means of maximising the revenues from their services. Today South West Trains stands accused of exploiting their monopoly power by raising the fares of many off-peak tickets by as much as twenty per cent. Here are sample dares for a day return from Bournemouth to London Waterloo Standard Day Return (travel anytime) £67.70 Cheap Day Return (first valid train is 0759 on weekdays) £43.70 Group Save for Cheap Day Return is £21.85 Super Off-Peak Day Return (first valid train is 10:16 on weekdays, & all day Sat and Sun) £37.50 Group Save for Super Off-Peak Day Return is £18.75 Group Save - Price per person when 4 people travel together off-peak The £43.70 cheap day return from Bournemouth to London was over twenty per cent cheaper before the latest rail fate hike was put in place. And the customer watchdog Passenger Focus is up in arms about it! Anthony Smith, their chief executive is quoted as saying: “These (fare) increases are unacceptable and come only a matter of months after their last price rises. The affordable, turn-up and go railway has been further eroded and South West Trains is exploiting a monopoly market. Families making day trips to London will be hit hard by these changes. We want South West Trains passengers to tell us what they think of the fare increases and how they will be affected.” South West Trains defend their price increases by saying that these price hikes bring them more into line with other train operating companies. And that a more expensive ticket is essential to reduce the problem of over-crowding at peak times. Although off-peak fares can provide an effective incentive for people to make more efficient use of rail capacity during the quieter hours, it seems faintly ludicrous to justify a twenty per cent fare hike purely on the grounds of their being too many people wanting to use the services. Why not boost rail capacity at peak times by investing in more rolling stock to allow more carriages? 61p a mile between Bournemouth and London is a hefty price to pay for the convenience of a rail journey in a crowded and uncomfortable carriage. This is great news for the inter-city coach companies. But expect even great congestion in and around the southern approaches to London. Travellers want to do their bit for the environment, but at what price?

- 118 -
© Tutor2u Limited 2008 www.tutor2u.net
Suggestions for further reading on competition and monopoly
Airport competition probe urged (BBC news, December 2006)
Barriers to entry – Playboy and the Bunnies (BBC news, October 2006)
Barriers to entry - Starbucks wins Chinese logo case (BBC news, October 2006)
Barriers to entry – Tesco’s land grab (BBC news audio-video)
Carphone Warehouse buying AOL UK (BBC news, October 2006)
Competition between airlines - EU agrees open skies deal (Guardian, March 2007)
Competition Policy – revision presentation (Tutor2u)
Economies of scale - EasyJet expands as profits soar (BBC news, November 2006)
EU proposes open postal markets (BBC online, October 2006) see also Postal services open to new competition (BBC news, January 2006)
Market competition - Vodafone offers broadband to mobile customers (Guardian, November 2006)
Murdoch versus the Evening Standard – competition in free newspapers (BBC, September 2006)
Plane weird – the aircraft duopoly (Guardian, July 2007)
Price collusion: Builders' bid rigging claims (BBC Radio 4 File on 4, July 2007)
Price Collusion: Dutch brewers fined over cartel (BBC news, April 2007)
Price Collusion: Europe burns rubber cartel with £350m fine (Guardian, November 2006)
Price Collusion: The Great Plane Robbery? (BBC Money Programme, October 2006)
Probe into BAA airport monopoly (BBC News, June 2006)
Product sabotage helps consumers (BBC online, Tim Harford, August 2007)
Q&A: Supermarket competition concerns (BBC news, March 2006)
South Africa ends phone monopoly (BBC news, August 2006)
Supermarkets may be abusing their monopoly position (BBC news online, March 2007) – see also “Tesco
The chewing gum war (BBC Money Programme, May 2007)
The economics of hotel mini bars (Tim Harford, Slate, February 2007)
Where to avoid Tesco: Harrogate, Shetlands, Orkney, Outer Hebrides (Guardian, October 2006)
BA fined for price fixing (BBC news, July 2007)
MEP demands city parking inquiry (BBC news, August 2007)

- 119 -
© Tutor2u Limited 2008 www.tutor2u.net
28. Negative Externalities In this chapter we consider some of the external costs that can result from people consuming goods and services and businesses supplying products. Externalities are common everywhere in everyday life and the key issue is whether the market, left to its own devices, will take these externalities into account. If not, then market failure can occur and there is a justification for some form of government intervention. What are externalities? Externalities are third party effects arising from production and consumption of goods and services for which no appropriate compensation is paid. Externalities cause market failure if the price mechanism does not take account of the social costs and benefits of production and consumption.
Many types of activity give rise to externalities. And these externalities can be positive and negative. Externalities can result in the market mechanism producing the wrong quantity of goods and services so that there is a loss of social welfare Externalities occur outside of the market i.e. they affect ‘economic agents’ not directly involved in the production and/or consumption of a good or service. They are also known as spill-over effects. Externalities and the importance of property rights External costs and benefits are around us every day – the key point is that the market may fail to take them into account because of the absence of clearly defined property rights – for example, who owns the air we breathe, or the natural resources available for extraction from seas and oceans around the world? Property rights confer legal control or ownership of a good. For markets to operate efficiently, property rights must be clearly defined and protected – perhaps through government legislation and regulation. If an asset is un-owned no one has an economic incentive to protect it from abuse. In China in March 2007, the communist government passed a law that protects the property rights of private sector businesses, a landmark day for the Chinese economy! Failure to protect property rights lead to what is known as the Tragedy of the Commons i.e. the over use of common land, fish stocks etc which leads to long term permanent damage to the stock of natural resources.

- 120 -
© Tutor2u Limited 2008 www.tutor2u.net
Negative Externalities Negative externalities occur when production and/or consumption impose external costs on third parties outside of the market for which no appropriate compensation is paid. Some examples are given below, many of them are environmental.
Smokers ignore the unintended but harmful impact of toxic ‘passive smoking’ on non-smokers
Air pollution from road use and traffic congestion and the impact of road fumes on lungs
External costs of scraping the seabed for supplies of gravel
External costs of travelling by taxi
The environment damage caused by the intensive use of fertilisers in agriculture
The external costs of cleaning up from litter and the dropping of chewing gum
The external costs of the miles that food travels from producer to the final consumer US pollution may damage UK health Pollution created by consumers and producers in one country can often cause external costs in other countries. The classic example of this is the effects of the nuclear fall-out from the Chernobyl disaster in 1986. Recent news reports have claimed that polluted air from America could be damaging the health of people in Britain. A study from the Intercontinental Transport of Ozone and Precursors programme has found that airborne chemicals from 8,000km away are being dumped in the UK and Western Europe and may be to blame for a rise in lung disease. They claim that "It is highly likely that air leaving the States contains a cocktail of nitrogen oxides and hydrocarbons, which are emitted from vehicle exhausts and power stations."
Adapted from news reports, June 2004 Private Costs and Social Costs The existence of production and consumption externalities creates a divergence between private and social costs of production and also the private and social benefits of consumption.
Social Cost = Private Cost + External Cost Social Benefit = Private Benefit + External Benefit
When negative production externalities exist, social costs exceed private cost. This leads to the private optimum level of output being greater than the social optimum level of production. The individual consumer or producer does not take the effects of externalities into their calculations. External costs from production Production externalities are generated and received in production - examples include noise pollution and atmospheric pollution from factories and the long-term environmental damage caused by depletion of our stock of natural resources External costs from consumption
Ignoring the external costs of consumption
It takes 3 pence to make a stick of chewing gum but 10 pence to clear it from our streets.

- 121 -
© Tutor2u Limited 2008 www.tutor2u.net
Consumption externalities are generated and received in consumption - examples include pollution from cars and motorbikes and externalities created by smoking and alcohol abuse and also the noise pollution created by loud music being played in built-up areas. Negative consumption externalities lead to a situation where the social benefit of consumption is less than the private benefit. Positive consumption externalities lead to a situation where the social benefit of consumption is greater than the private benefit. In both cases externalities can lead to market failure. Consider this example of the estimated social costs arising from drug addiction in the UK. The External Costs of Drug Dependency The latest estimate is that there were 327,000 problematic drug users in England 2005. Heroin and crack cocaine addicts are costing the country up to £19 billion a year, according to a study from experts at York University. A hard core of problem drug abusers is running up a bill of £600 a week each in crime, police and court time, health care and unemployment benefits. Last year, the NHS spent about £235 million on GP services, accident and emergency admissions and treatment linked to drug abuse. When social costs are added, the bill rises to between £10.9 billion and £18.8 billion. There are at least 1.5 million recreational and regular users of Class A drugs. The average cost to society of all Class A drug users is £2,030 each a year, says the study. The mortality rate for heroin users in a study in London was 17 times higher than that for non-heroin users. The externalities from alcohol use and misuse For most adults drinking alcohol is part of a pleasurable social experience, which causes no harm to themselves or others. For some people though, alcohol misuse is responsible for causing serious damage to themselves, their family and friends and to the community as a whole. In this context, alcohol has significant costs not only for the individual but also for the whole economy. Per capita alcohol consumption in the UK has risen by more than half in the part thirty years to 8.5 litres of pure alcohol in 2001. However obtaining reliable information about drinking behaviour is difficult and social surveys consistently under-record consumption of alcohol for two reasons. In 2001, over nine million people were estimated to be drinking above government weekly guidelines. Around eight percent of the English population or around 2.8 million people in England aged 16 and over are estimated by government figures to have some form of alcohol dependency. Britons are paying the penalty for the soaring rate of alcohol consumption, a report by doctors shows. According to the report, deaths from liver cirrhosis are rising faster in Britain than anywhere else in Europe. The rise has been especially sharp in men and women aged fewer than 45, where death rates now exceed the European average.
Sources: Adapted from government reports and newspaper reports, November 2005 Death rates from alcohol-related causes England & Wales Rates per 100,000 population Males Females 1980 5.9 4.1 2003 15.8 7.6
Source: Office for National Statistics

- 122 -
© Tutor2u Limited 2008 www.tutor2u.net
Private and external costs and benefits of alcohol Private costs:
• Expenditure on alcohol • Financial costs of consequences of alcohol misuse (e.g. medical treatment, higher health
premiums or lawyer’s fees) • Pain and suffering for the alcohol abuser • Loss of quality of life / quality life years lost
Private benefits:
• Pleasure / satisfaction from consumption • Some health benefits e.g. from moderate alcohol consumption • Consumer surplus (e.g. from drinking at a price lower than a consumer’s willingness to pay)
External costs:
• Injuries / damage done to 3rd parties • Alcohol related crime – according to the British crime survey of 2002, 47 percent of all
violent crime is alcohol related • Alcohol related motor accidents / victim’s lost production and quality of life / damaged
property • Costs of law enforcement / crime prevention • Pain and suffering of family and friends / unwanted pregnancies / partner assaults /
education outcomes • Lost output from premature death / illness – some illnesses are 100 % attributable to alcohol
use, others are only partly attributable - Alcohol is responsible for nearly conditions, including impotence, psoriasis and heart disease. The present value of lost output due to premature deaths among employees who misuse alcohol is between £ 2.3 billion and £ 2.5 billion
• Excess use of health services (in patient and out patient services) • Specialist alcohol treatment services (e.g. detoxification, rehabilitation, dependency-
prescribed drugs) – total healthcare costs for England and Wales in 2001 related to alcohol misuse range between £1.4 and £1.7 billion with a middle estimate of about £1.6 billion.
• Lower productivity in the workplace / absenteeism / loss of productive efficiency External benefits:
• Alcohol as a social lubricant • Building of business networks / social capital effects
Government policy on alcohol – is this an example of government failure? A leading alcohol campaigning charity has heavily criticised the Government after a major new report revealed Britons are drinking themselves to death at a faster rate than people anywhere else in Western Europe. A new study published in The Lancet medical journal shows liver cirrhosis deaths are soaring in the UK while falling in other European countries. National charity Alcohol Concern today said the trend is an indictment of Britain's drinking culture and accused the Government of failing to tackle alcohol abuse and binge drinking. According to the pressure group, excessive drinking kills around 22,000 people every year.
Source: Alcohol Concern Doctors want action on alcohol (BBC news, August 2007)

- 123 -
© Tutor2u Limited 2008 www.tutor2u.net
The Wanless Report on Health (2004) The value of some externalities can vary depending on the situation in which a good is consumed. For example, the externality of alcohol consumption depends critically on the amount consumed – small amounts of alcohol can be beneficial, while large amounts damage health. Ideally when introducing a tax, it should be set at the value of the last unit of the good consumed – called the marginal cost. Therefore, for example, the tax on a heavy drinker could be greater than someone only having a glass of wine during a meal.
Source Wanless Report
Illustrating the market failure from negative externalities
The previous diagram provides a way of illustrating the effects of negative externalities arising from production on the private and social costs and benefits to producers and consumers. The key is to understand the difference between private and social costs.
Output (Q)
Demand = Private Benefit = Social Benefit
Private Cost (Supply)
Q1
Costs Revenues
Social Cost
Q2
External Cost
P1
P2 Negative externalities cause the social cost curve to lie above the private cost curve
We assume in this example that there are no externalities arising
from consumption

- 124 -
© Tutor2u Limited 2008 www.tutor2u.net
In the absence of externalities, the private costs of the supplier are the same as the costs for society. But if there are negative externalities, we must add the external costs to the firm’s supply curve to find the social cost curve. This is shown in the diagram above. If the market fails to include these external costs, then the equilibrium output will be Q2 and the price P2. From a social welfare viewpoint, we want less output from production activities that create an “economic-bad” such as pollution and other forms of environmental damage. A socially-efficient output would be Q1 with a higher price P1. At this price level, the external costs have been taken into account. We have not eliminated the pollution (we cannot do this) – but at least the market has recognised them and priced them into the price of the product.

- 125 -
© Tutor2u Limited 2008 www.tutor2u.net
29. Positive Externalities There are many occasions when the production and/or consumption of a good or a service creates external benefits which boost social welfare. In this chapter we consider the idea of positive externalities and the market failure that can result if the market under-consumes or under-provides. Examples of positive externalities
• Social benefits from providing milk to young schoolchildren • External benefits from vaccination / immunisation programmes • Social benefits from restoration and use of historic buildings • External benefits from improved training and education • External benefits from development of renewable energy sources • External benefits from other new production technologies
Positive externalities and market failure Where positive externalities exist, the good or service may be under consumed or under provided since the free market may fail to value them correctly or take them into account when pricing the product. In the diagram above, the normal market equilibrium is at P1 and Q1 – but if there are external benefits, the Q1 is an output below the level that maximises social welfare.
There is a case for some form of government intervention in the market designed to increase consumption towards output level Q2 so as to increase economic welfare.
Costs Benefits
Quantity of the Good
Private Demand
Supply
Demand + External Benefits = Social
Benefit
Qp Qs
External Benefit
A
B
With positive externalities, the social benefit of consumption is greater than the private benefit. To maximise welfare we need to encourage increased provision and consumption
With positive externalities, there are external benefits from production and/or consumption – as a result, the socially efficient output is greater than current output

- 126 -
© Tutor2u Limited 2008 www.tutor2u.net
The economics of vaccination What good is a vaccination? Obviously there are benefits for the person receiving the vaccine, they are less susceptible to disease and children in particular are more likely to attend school and earn more income over their lifetime. A new study from the World Bank finds that comprehensive vaccination programmes have a positive effect on savings and wealth and encourage families to have fewer children which lead to less demographic pressures on scarce resources. More subtly, it can be good for an entire population since, if enough of its members are vaccinated, even those who are not will receive a measure of protection. That is because, with only a few susceptible individuals, the transmission of the infection cannot be maintained and the disease spread. In the case of many vaccines, there are non-medical benefits, too, in the form of costs avoided and the generation of income that would otherwise have been lost. These goods are economic. The dispassionate economic case for vaccination, therefore, looks at least as strong as the compassionate medical one. Spending on vaccination programmes appears to be a sound social investment for the future.
Source: Adapted from the Economist, October 2005 The Economic Benefits of Vaccination Programs in Poor Countries Vocational training – externalities and market failure There is growing evidence that skilled workforces have positive impacts on aims such as raising productivity and enhancing a country's GDP growth. At the same time, there is evidence of a major skills deficiency in the UK, which is reflected in the low numbers of people holding intermediate level vocational qualifications and apprenticeships, compared to Germany and other European Union countries. There is further evidence that there are three forms of market failure that continue to cause this skills gap: 1. Externalities leading to under-investment in training by employers. Firms are concerned that once trained, an employee will leave the firm before the firm has recouped its investment. Unless training pays off quickly, firms are therefore reluctant to provide training to their workers. This is an example of the free-rider problem - where one firm can take advantage of the money invested in training by another firm. 2. Imperfect information leading to workers being unable to judge the quality of their training or appreciate the benefits to themselves. This reduces their willingness for example to accept lower wages during the training period or to receive any training at all. 3. Credit market imperfections. Training is a costly business, but individuals expect to obtain higher wages from training in the long-term because their wages are likely to be higher in jobs that require a greater degree of training and specific skills. Some individuals may wish to borrow money to fund training in the expectation that they will be able to pay back the loan through higher future wages. However, low-paid employees in particular are likely to be "credit constrained" and unable to obtain loans to pay for training. These market failures mean that the level of training provided by the market is likely to be inefficiently low from society’s point of view. Well-designed government intervention may help to bridge the gap.
- 127 -
© Tutor2u Limited 2008 www.tutor2u.net
The aims of government intervention might be to
• Move towards a socially optimal level of training • Achieve higher productivity among those who take training programmes • Build the economy’s human capital • Increase the proportion of the employed workforce that has a recognised vocational
training qualification Options for government intervention
• Increased funding for education and training programmes within the public sector • State funded and operated vocational training e.g. more modern apprenticeships and
expansion of vocational exams • Tax credits for businesses that invest in vocational training programmes • Regulation on the quality of training programmes
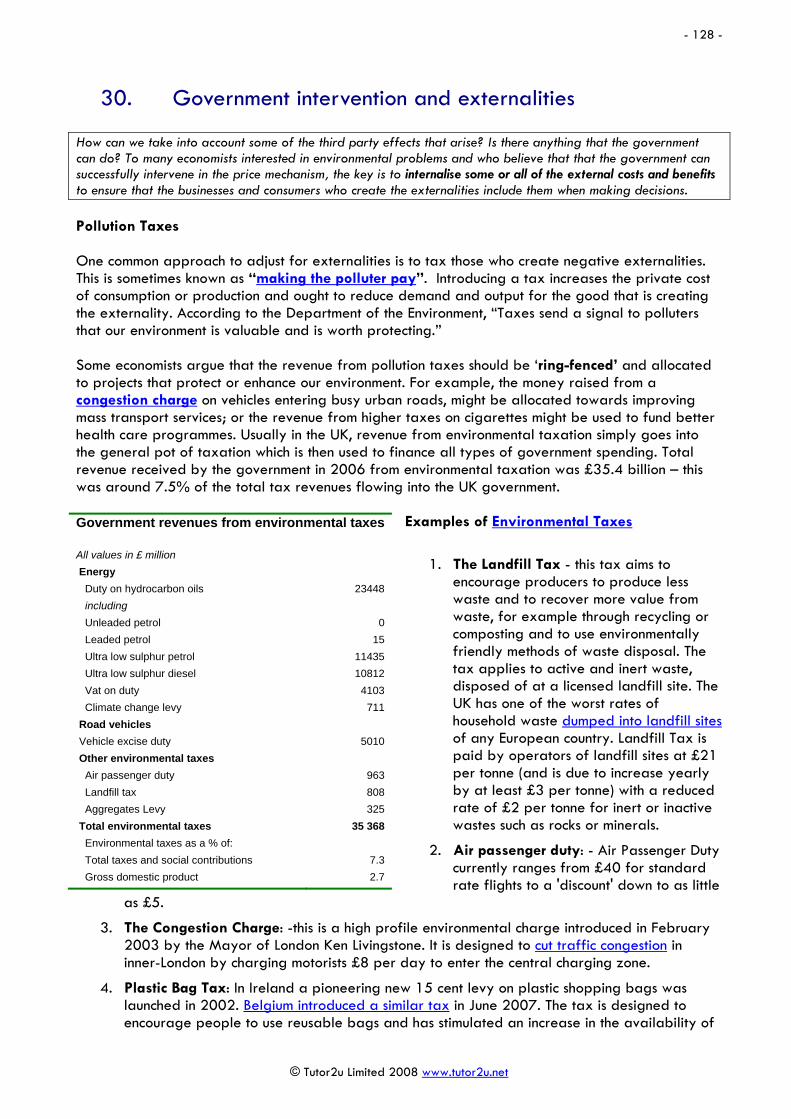
- 128 -
© Tutor2u Limited 2008 www.tutor2u.net
30. Government intervention and externalities How can we take into account some of the third party effects that arise? Is there anything that the government can do? To many economists interested in environmental problems and who believe that that the government can successfully intervene in the price mechanism, the key is to internalise some or all of the external costs and benefits to ensure that the businesses and consumers who create the externalities include them when making decisions. Pollution Taxes One common approach to adjust for externalities is to tax those who create negative externalities. This is sometimes known as “making the polluter pay”. Introducing a tax increases the private cost of consumption or production and ought to reduce demand and output for the good that is creating the externality. According to the Department of the Environment, “Taxes send a signal to polluters that our environment is valuable and is worth protecting.” Some economists argue that the revenue from pollution taxes should be ‘ring-fenced’ and allocated to projects that protect or enhance our environment. For example, the money raised from a congestion charge on vehicles entering busy urban roads, might be allocated towards improving mass transport services; or the revenue from higher taxes on cigarettes might be used to fund better health care programmes. Usually in the UK, revenue from environmental taxation simply goes into the general pot of taxation which is then used to finance all types of government spending. Total revenue received by the government in 2006 from environmental taxation was £35.4 billion – this was around 7.5% of the total tax revenues flowing into the UK government.
Examples of Environmental Taxes
1. The Landfill Tax - this tax aims to encourage producers to produce less waste and to recover more value from waste, for example through recycling or composting and to use environmentally friendly methods of waste disposal. The tax applies to active and inert waste, disposed of at a licensed landfill site. The UK has one of the worst rates of household waste dumped into landfill sites of any European country. Landfill Tax is paid by operators of landfill sites at £21 per tonne (and is due to increase yearly by at least £3 per tonne) with a reduced rate of £2 per tonne for inert or inactive wastes such as rocks or minerals.
2. Air passenger duty: - Air Passenger Duty currently ranges from £40 for standard rate flights to a 'discount' down to as little
as £5.
3. The Congestion Charge: -this is a high profile environmental charge introduced in February 2003 by the Mayor of London Ken Livingstone. It is designed to cut traffic congestion in inner-London by charging motorists £8 per day to enter the central charging zone.
4. Plastic Bag Tax: In Ireland a pioneering new 15 cent levy on plastic shopping bags was launched in 2002. Belgium introduced a similar tax in June 2007. The tax is designed to encourage people to use reusable bags and has stimulated an increase in the availability of
Government revenues from environmental taxes All values in £ million Energy Duty on hydrocarbon oils 23448 including Unleaded petrol 0 Leaded petrol 15 Ultra low sulphur petrol 11435 Ultra low sulphur diesel 10812 Vat on duty 4103 Climate change levy 711 Road vehicles Vehicle excise duty 5010 Other environmental taxes Air passenger duty 963 Landfill tax 808 Aggregates Levy 325 Total environmental taxes 35 368 Environmental taxes as a % of: Total taxes and social contributions 7.3 Gross domestic product 2.7

- 129 -
© Tutor2u Limited 2008 www.tutor2u.net
biodegradable bags. Payable in all sales outlets 15 cents are charged for each bag issued and itemized separately on receipts. Proceeds from the tax go to the Environment Fund and are used to fund various waste management and other environmental initiatives. The tax rose to 22 cents per bag in July 2007. The 2002 move led to a drop from 328 plastic bags used per head to just 21 and raised millions of euros in revenue for the Irish exchequer.
5. Vehicle excise duty (VED): Also known as ‘road tax’ – VED starts from a theoretical 'nil' rate and accelerating up depending on the carbon emissions of the vehicle
£200 pollution charge for lorries London's mayor has announced plans to charge lorries buses and coaches that do not meet new low emission targets £200 a day to drive into the city. Ken Livingstone said the London-wide Low Emission Zone, which will be the largest in the world, will come in to force in February 2008. The zone hopes to reduce emissions by 16% by 2012. But the Road Haulage Association said it would be very expensive to implement and would give minimal benefits. The zone will use cameras to record licence plates and check them against the DVLA database and other records to see if the vehicles meet European emissions standards.
Adapted from BBC news online, May 2007
Problems with Taxes to Curb Pollution Many economists argue that pollution taxes can create further problems which lead to government failure and little sustainable improvement in environmental conditions. The main problems are as thought to be as follows: (1) Assigning the right level of taxation: There are problems in setting tax so that private cost will exactly equate with the social cost. The government cannot accurately value the private benefits and cost of firms let alone put a monetary value on externalities such as the cost to natural habitat, the long-term effects if resource depletion
and the value of human life. (2) Imperfect information: Without accurate information setting the tax at the correct level is impossible. In reality, therefore, all that governments and regulatory agencies can hope to achieve is a movement towards the optimum level of output. (3) Consumer welfare effects
Taxes reduce output and raise prices, and this might have an adverse effect on consumer welfare. Producers may be able to pass on the tax to the consumers if the demand for the good is inelastic and, as result, the tax may only have a small effect in reducing demand
Taxes on some de-merit goods (for example cigarettes) may have a regressive effect on lower-income consumers and leader to a widening of inequalities in the distribution of income.
(4) Employment and investment consequences: If pollution taxes are raised in one country, producers may shift to countries with lower taxes. This will not reduce global pollution, and may create problems such as structural unemployment and a loss of international competitiveness. Similarly higher taxation might lead to a decline in business
Would a tax on aviation fuel be an effective and appropriate way to reduce carbon emissions from the airline industry?

- 130 -
© Tutor2u Limited 2008 www.tutor2u.net
profits and a fall in the volume of investment projects that in the long term might have beneficial spill-over effects in reducing the energy intensity of an industry or might lead to innovation which enhance the environment. Environmental Audit Committee recommends higher aviation taxes A House of Commons committee on carbon emissions from transport has recommended that the government consider introducing higher taxes on aviation as a tool to curb the take off of CO emissions from the UK transport industry. They argue that the “government and the Department of Transport should actively encourage modal shift towards lower carbon modes of transport, and discourage marginal car and plane journeys and take much more decisive action to shift the balance of affordability more in favour of trains, buses, and lower carbon cars and lorries.” On the issue of aviation, the Committee concludes that “It is scandalous that governments around the world have failed to grasp the nettle of taxing aviation fuel.” They want the government to raise air passenger duty but to levy it per flight rather than per passenger. They also want the airlines to be compelled to state the relevant carbon emissions per passenger and that carbon offsetting payments, currently voluntary, should become a compulsory charge on all airline tickets. Reaction and relevant articles to read “Air tax hike would hit the poorest hardest” BBC “Head to head on green taxes” BBC “MPs demand higher road and air taxes” (Guardian) EasyJet rubbishes green tax idea (Guardian) Global Policy Forum MPs call for £1500 car tax (The Times) Transport 2000 New product and carton tax needed to increase recycling and stop waste at source Britain is the dustbin of Europe. Every year over four billion cartons made of layers of cardboard, plastic and metal foil are produced for use in the UK but less than ten per cent are recycled. The vast majority of these cartons end up in landfill sites as part of a 300 million tonne rubbish mountain. A report from the Institute for Public Policy Research (IPPR) argues for a new environmental tax on these cartons and also on disposable and hard-to-recycle products as a way of improving incentives for manufacturers to create less waste and cut the tonnage of waste finding its way into landfill sites. In the UK, 22,000 tonnes of household batteries required disposal in the UK each year. Only two per cent of disposable batteries are recycled – the rest end up in landfill sites. The IPPR and the Green Alliance are pushing for a ‘Zero waste’ strategy which is when manufacturers and retailers commit themselves towards achieving a zero waste to landfill and maximum recycling. Asda has already announced that it plans to have zero waste to landfill by 2010. The report recommends that a new tax would be the right approach to the external costs created by the waste from throw-away cameras, disposable razors and non-rechargeable batteries. The IPPR claims that similar taxes introduced in Sweden, Denmark and Belgium have all reduced consumption of disposable products. In 1996 Belgium introduced a £5 on disposable cameras that were not recycled or reused - as a result, 80 per cent of all disposable cameras are now recycled or reused. Command and Control Techniques – Regulation Instead of trying to change market prices and therefore affect the behaviour of consumers and producers, the government may choose to intervene directly in a market through the use of regulations and laws.
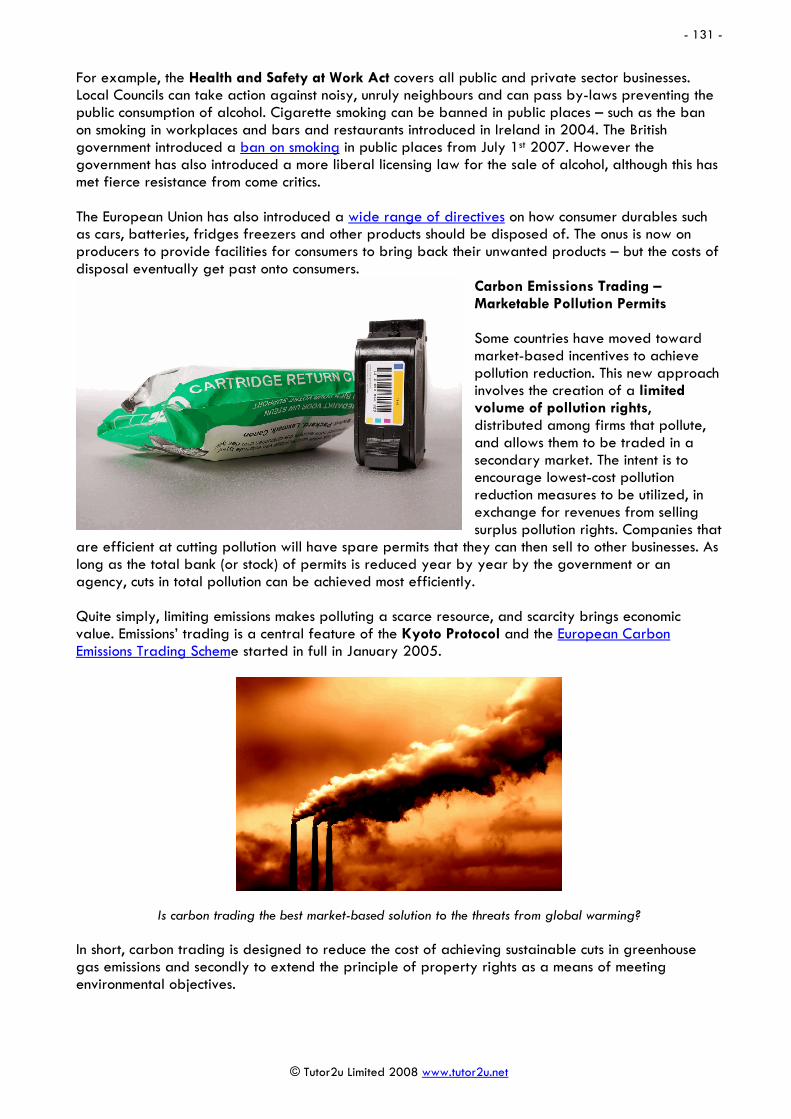
- 131 -
© Tutor2u Limited 2008 www.tutor2u.net
For example, the Health and Safety at Work Act covers all public and private sector businesses. Local Councils can take action against noisy, unruly neighbours and can pass by-laws preventing the public consumption of alcohol. Cigarette smoking can be banned in public places – such as the ban on smoking in workplaces and bars and restaurants introduced in Ireland in 2004. The British government introduced a ban on smoking in public places from July 1st 2007. However the government has also introduced a more liberal licensing law for the sale of alcohol, although this has met fierce resistance from come critics. The European Union has also introduced a wide range of directives on how consumer durables such as cars, batteries, fridges freezers and other products should be disposed of. The onus is now on producers to provide facilities for consumers to bring back their unwanted products – but the costs of disposal eventually get past onto consumers.
Carbon Emissions Trading – Marketable Pollution Permits Some countries have moved toward market-based incentives to achieve pollution reduction. This new approach involves the creation of a limited volume of pollution rights, distributed among firms that pollute, and allows them to be traded in a secondary market. The intent is to encourage lowest-cost pollution reduction measures to be utilized, in exchange for revenues from selling surplus pollution rights. Companies that
are efficient at cutting pollution will have spare permits that they can then sell to other businesses. As long as the total bank (or stock) of permits is reduced year by year by the government or an agency, cuts in total pollution can be achieved most efficiently. Quite simply, limiting emissions makes polluting a scarce resource, and scarcity brings economic value. Emissions’ trading is a central feature of the Kyoto Protocol and the European Carbon Emissions Trading Scheme started in full in January 2005.
Is carbon trading the best market-based solution to the threats from global warming? In short, carbon trading is designed to reduce the cost of achieving sustainable cuts in greenhouse gas emissions and secondly to extend the principle of property rights as a means of meeting environmental objectives.
- 132 -
© Tutor2u Limited 2008 www.tutor2u.net
Subsidising positive externalities An alternative to taxing activities that create negative externalities is to subsidise activities that lead to positive externalities. This reduces the costs of production for suppliers and encourages a higher output. For example the Government may subsidise state health care; public transport or investment in new technology for schools and colleges to help spread knowledge and understanding. There is also a case for subsidies to encourage higher levels of training as a means to raise labour productivity and improve our international competitiveness. Suggested reading on government intervention in markets Firms trade £400m of carbon credit with China (The Guardian, September 2006) California passes emissions law (BBC news, September 2006) At-a-glance: The Stern Review (BBC news, October 2006) Climate change fight ‘cannot wait’ (BBC news, October 2006) Branson asks Brown to cut duty on fuel to power green trains (Guardian, October 2006) Hit the young with alco-pop tax – minister (Guardian, October 2006) Gas-guzzler drivers face up to £450 parking fee (Guardian, October 2006) Minimum wage fails to close pay gap (Guardian, October 2006) Will the smoking ban kill bingo halls? (BBC Money Programme, May 2007) Perils of the motorway pit stops (BBC Money Programme, November 2006) A flying tax would damage the economy, says BAA (Guardian, October 2006) Junk food ad crackdown announced (BBC news, November 2006) Drastic action on climate change is needed now - and here's the plan (Guardian, November 2006) Push for energy-saving bulbs (Guardian, November 2006) Miliband urges higher cost of motoring (Guardian, November 2006) Brown to double taxes on flights (BBC news, December 2006) Eddington Report - Motorists 'must pay for road use' (BBC news, December 2006) Carbon trade scheme 'is failing' (BBC Radio 4 File on 4, June 2007) Bin charges 'to boost recycling' (BBC news, May 2007) Livingstone to charge older, dirtier lorries £200 a day (Guardian, May 2007) Petrol taxes - Pigou or NoPigou? (Economist, November 2006) Scrutinising climate economics (BBC, January 2007) Paying for environmental damage (BBC news, June 2007) Fat tax could save thousands of lives (BBC news, July 2007)
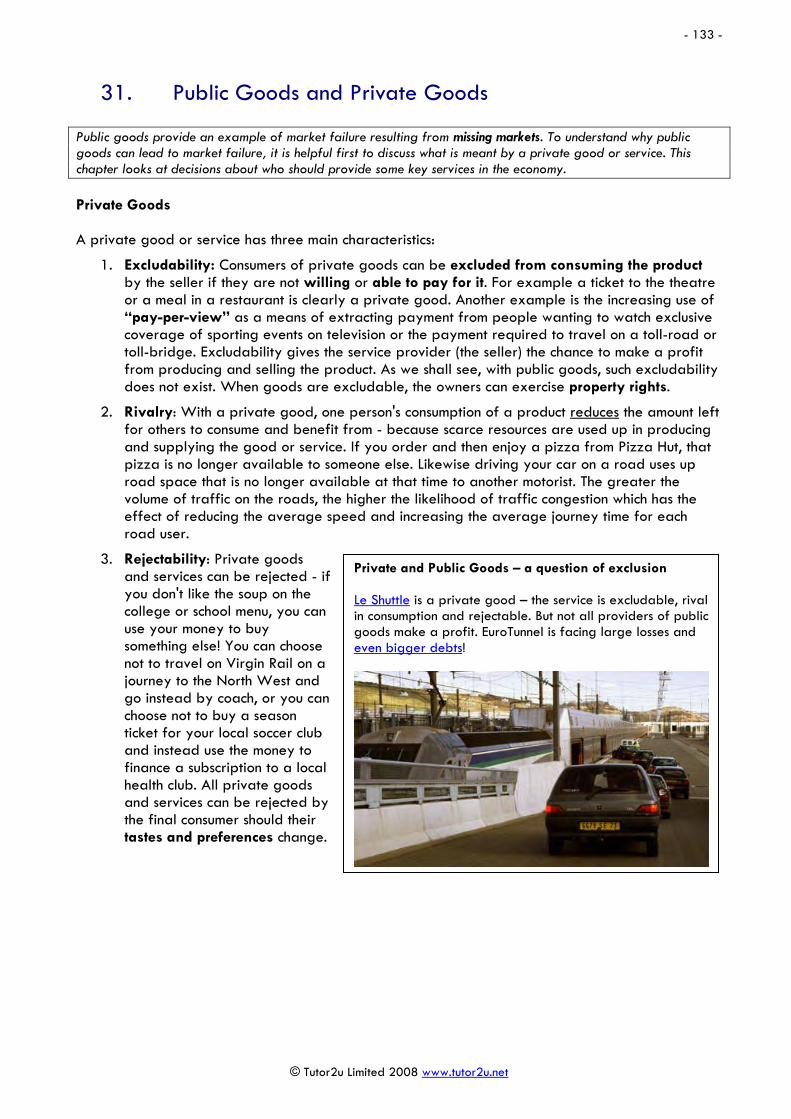
- 133 -
© Tutor2u Limited 2008 www.tutor2u.net
31. Public Goods and Private Goods Public goods provide an example of market failure resulting from missing markets. To understand why public goods can lead to market failure, it is helpful first to discuss what is meant by a private good or service. This chapter looks at decisions about who should provide some key services in the economy. Private Goods A private good or service has three main characteristics:
1. Excludability: Consumers of private goods can be excluded from consuming the product by the seller if they are not willing or able to pay for it. For example a ticket to the theatre or a meal in a restaurant is clearly a private good. Another example is the increasing use of “pay-per-view” as a means of extracting payment from people wanting to watch exclusive coverage of sporting events on television or the payment required to travel on a toll-road or toll-bridge. Excludability gives the service provider (the seller) the chance to make a profit from producing and selling the product. As we shall see, with public goods, such excludability does not exist. When goods are excludable, the owners can exercise property rights.
2. Rivalry: With a private good, one person's consumption of a product reduces the amount left for others to consume and benefit from - because scarce resources are used up in producing and supplying the good or service. If you order and then enjoy a pizza from Pizza Hut, that pizza is no longer available to someone else. Likewise driving your car on a road uses up road space that is no longer available at that time to another motorist. The greater the volume of traffic on the roads, the higher the likelihood of traffic congestion which has the effect of reducing the average speed and increasing the average journey time for each road user.
3. Rejectability: Private goods and services can be rejected - if you don't like the soup on the college or school menu, you can use your money to buy something else! You can choose not to travel on Virgin Rail on a journey to the North West and go instead by coach, or you can choose not to buy a season ticket for your local soccer club and instead use the money to finance a subscription to a local health club. All private goods and services can be rejected by the final consumer should their tastes and preferences change.
Private and Public Goods – a question of exclusion Le Shuttle is a private good – the service is excludable, rival in consumption and rejectable. But not all providers of public goods make a profit. EuroTunnel is facing large losses and even bigger debts!
- 134 -
© Tutor2u Limited 2008 www.tutor2u.net
Characteristics of Public Goods As one might expect, the characteristics of pure public goods are the opposite of private goods:
1. Non-excludability: The benefits derived from the provision of pure public goods cannot be confined to only those who have actually paid for it. In this sense, non-payers can enjoy the benefits of consumption at no financial cost to themselves – this is known as the ‘free-rider’ problem and it means that people have a temptation to consume without paying!
2. Non-rival consumption: Consumption of a public good by one person does not reduce the availability of a good to everyone else – therefore we all consume the same amount of public goods even though our tastes and preferences for these goods (and therefore our valuation of the benefit we derive from them) might differ.
Examples of Public Goods There are relatively few examples of pure public goods. Examples of public goods include flood control systems, some of the broadcasting services provided by the BBC, public water supplies, street lighting for roads and motorways, lighthouse protection for ships and also national defence services. Policing – a public good? To what extent is our current system of policing an example of a public good? Some (but not all) aspects of policing might qualify as public goods. The general protection that the police services provide in deterring crime and investigating criminal acts serves as a public good. But resources used up in providing specific police services mean that fewer resources are available elsewhere. For example the use of police at sporting events or demonstrations and protests means that police resources have to be diverted from other policing duties. The police services must make important decisions about how best to allocate their manpower in order to provide the most effective policing service for the whole community. Private protection services (including private security guards, privately bought security systems and detectives) are private goods because the service is excludable, rejectable and rival in consumption and people and businesses are often prepared to pay a high price for exclusive services. A good recent example of this has been the use of private security firms in post-war Iraq where up to 15,000 workers are said to have been working for private businesses protecting installations, coalition buildings and convoy protection. Public goods and market failure Pure public goods are not normally provided at all by the private sector because they would be unable to supply them for a profit. Thus the free market may fail totally to provide important pure public goods and under-provide quasi public goods (see below). It is therefore up to the Government to decide what output of public goods is appropriate for society. To do this, it must estimate the social benefit from the consumption of public goods. Putting a monetary value on the benefit derived from street lighting and defence systems is problematic. The electoral system provides an opportunity to see the public choices of voters but elections are rarely won and lost purely on the grounds of government spending plans and the turnout at elections continues to fall.

- 135 -
© Tutor2u Limited 2008 www.tutor2u.net
The air waves – a public good or a quasi public good?
The airwaves used by mobile phone companies, radio stations and television companies are essentially owned by the government of a particular country. Do they count as a pure public good? Normally the answer would be yes. One person’s use of the airwaves rarely reduces the extent to which other people can benefit from utilising them. But when demand for mobile phone services is high at peak times, the airwaves become crowded and as a result access to the networks can become slow. In this sense the airwaves can be treated a crowded non-pure public good. The government also controls the issue of licences needed to operate mobile phone services using the airwaves in the UK. In 2000, they auctioned off five licences for 3rd generation mobile phone services and raised £22 billion in doing so. The government was using the auction to ration the airwaves through a licence system. Although the government has monopoly control in the sense that it controls the issue of licences, it did not set the market price. This was determined by the auction process, and the fact that at the end of a bidding war, the major mobile phone companies were prepared to pay such a high price for a licence to allow them to operate in the market, is evidence of the private benefit (anticipated future profit) that the companies expected to make from selling 3rd generation contracts to customers. Quasi-Public Goods Most public goods are non-pure public goods – these are also known as quasi-public goods. The main reason is that we can find ways and means of excluding some groups from consuming them!
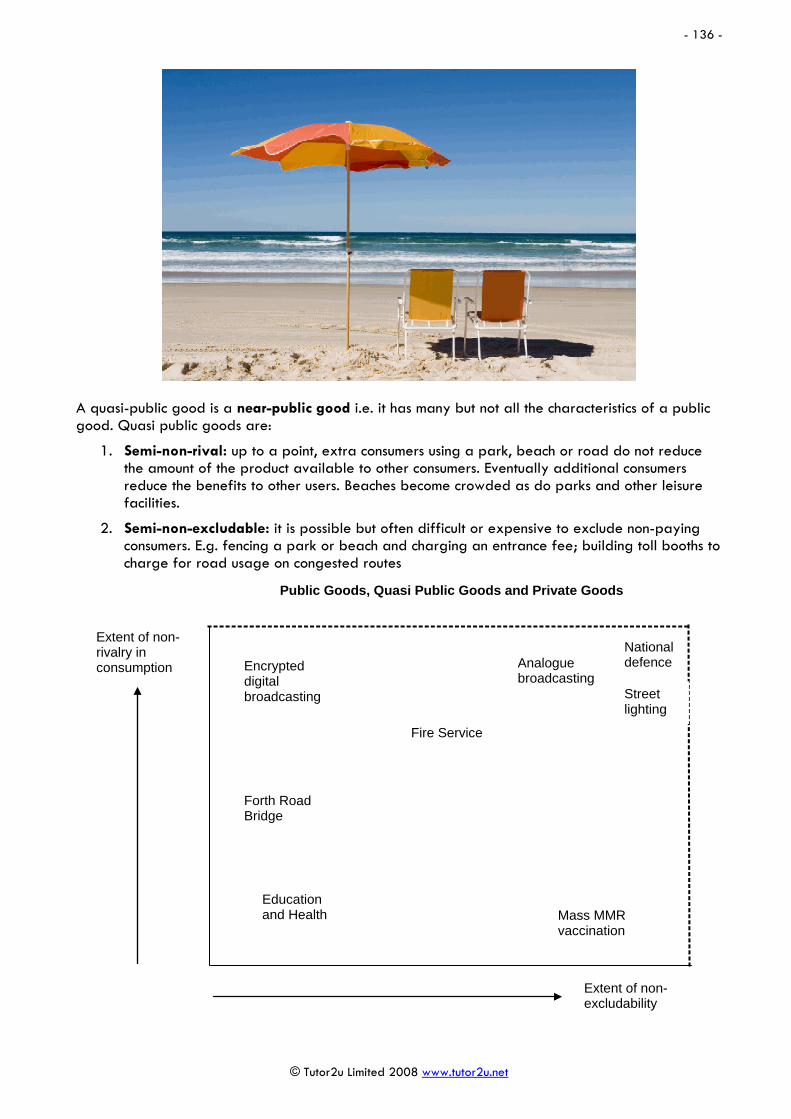
- 136 -
© Tutor2u Limited 2008 www.tutor2u.net
A quasi-public good is a near-public good i.e. it has many but not all the characteristics of a public good. Quasi public goods are:
1. Semi-non-rival: up to a point, extra consumers using a park, beach or road do not reduce the amount of the product available to other consumers. Eventually additional consumers reduce the benefits to other users. Beaches become crowded as do parks and other leisure facilities.
2. Semi-non-excludable: it is possible but often difficult or expensive to exclude non-paying consumers. E.g. fencing a park or beach and charging an entrance fee; building toll booths to charge for road usage on congested routes
Extent of non-rivalry in consumption
Extent of non-excludability
National defence
Street lighting
Analogue broadcasting
Mass MMR vaccination
Encrypted digital broadcasting
Forth Road Bridge
Education and Health
Fire Service
Public Goods, Quasi Public Goods and Private Goods

- 137 -
© Tutor2u Limited 2008 www.tutor2u.net
The BBC as a public good Broadcasting is a good example of a public good. Let us remind ourselves of the three main characteristics of a public good. Firstly it is non-rival, meaning that the consumption of a public good or service by one individual does not preclude consumption by another individual. Secondly, consumption is non-excludable. This means that consumption by one individual makes it impossible to exclude any other individual from having the opportunity to consume. Effectively the cost of providing a pure public good to an extra user is zero, and this implies that, in order to achieve allocative efficiency, the charge for the product should be zero. Of course, in this situation, private sector businesses are unlikely to consider providing pure public goods because they will not be able to make any profit at a zero price, and many consumers can take a free ride on such goods because of non-excludability. The provision of pure public goods is therefore a cause of market failure. Left to the free market, public goods are under-provided and under-consumed leading to a loss of social welfare. At the moment, around 23 million households in Britain pay an annual licence fee. All of these people are stakeholders in the debate about the future funding of the BBC and the vast majority use one or more BBC services at least once a week. The fee is a means of providing collective payment for a public good. We know that there are fee-dodgers who try to take a free-ride by avoiding payment, but there are well established although costly means to enforce the licence fee and take non-payers to court. Of course the BBC is now facing huge competition from broadcasters such as Sky who are able to exclude people from their services through the use of subscription-based services. Sky’s financial muscle continues to grow. Paying the for the BBC – the licence fee rises in 2006 The government has announced that the television licence fee will raise from £126.50 to £131.50 from April 1st 2006 an increase of 4.2% and a rise well above the annual rate of inflation. At the same time the government has announced that the licence fee will now be classified as a tax rather than a charge. The government has justified the hike in the annual licence fee by saying that the extra revenue for the BBC is required for the corporation to provide a strong and distinctive schedule for viewers and to be able to invest in new broadcast technologies. The case for government intervention in the case of public goods
• The non-rival nature of consumption provides a strong case for the government rather than the market to provide and pay for public goods.
• Many public goods are provided more or less free at the point of use and then paid for out of general taxation or another general form of charge such as a licence fee.
• State provision may help to prevent the under-provision and under-consumption of public goods so that social welfare is improved.
Public bads A public bad is the opposite of a public good – it provides disutility or dis-satisfaction to people when consumed and therefore reduces our economic welfare. A good example to look at would be the disposal of household and commercial waste.
- 138 -
© Tutor2u Limited 2008 www.tutor2u.net
People are normally prepared to pay a price for their household waste to be collected and disposed of in a safe and non-polluting way. But if waste was changed for according to how much had been generated, then some people would find an incentive to dump their waste on other people’s property and thereby avoid direct charges. The economics of waste – is it a public bad? Waste is now a major economic problem. As a nation, the UK generates over 430 million tonnes of waste each year, the majority coming from municipal, industrial and commercial sources. Each household is estimated to produce over 500 kg of waste per person each year and we throw away nearly a tonne of waste each over the course of twelve months! Waste is a nuisance good that has a negative effect on our welfare. From unsightly waste products to the costs of clearing up and disposing of waste, there are many private and external costs arising from the mountain of detritus that comes from our homes every day. But how much are we prepared to pay for waste collection and disposal? The current situation is that local authorities have a legal responsibility to collect household waste once per week, the private sector “market” does not provide the bulk of waste collection services for households although they have a role to play in providing waste services for businesses and other larger organisations. Household waste collection is nearly always done “free at the point of collection”. This raises questions of equity and efficiency and also the issue of whether there are better ways of providing incentives for us to create less waste as our living standards improve. Why should a large family that fills many wheelie bins every week pay the same as a single householder who creates just one or two bags worth of rubbish? Can economists come up with good ideas to reduce waste and to give people the right incentives to dispose of their waste in an environmentally friendly way? Belgium's rubbish solution (BBC news online, April 2007) Houses could be charged for waste (BBC news online, March 2007) Austria’s campaign against waste (BBC audio-video, July 2007) Bin charges 'to boost recycling' (BBC news online, May 2007) Guardian special report on waste and pollution Can't we bring back glass milk bottles? (Guardian, June 2007) 'Many' support pay-as-you-throw (BBC news online, August 2007) UK household waste – in statistics (BBC news online)

- 139 -
© Tutor2u Limited 2008 www.tutor2u.net
32. Merit Goods Merit goods create a divergence between the private and social costs and benefits of production and consumption leading to the risk of market failure. Risk of under-consumption:
Merit goods are those goods and services that the government feels that people will under-consume, and which ought to be subsidised or perhaps provided free at the point of use so that consumption does not depend primarily on the ability to pay for the good or service. Who provides merit goods? It is important to realise that it is not simply the government (or public sector) that supplies merit goods. Both the state and private sector provide merit goods & services. We have an independent education system and people can buy private health care insurance. Externality issues: Consumption of merit goods is believed to generate positive externalities- where the social benefit from consumption exceeds the private benefit.
Merit goods can be defined in terms of their externality effects and also in terms of informational problems facing the consumer A merit good is a product that society values and judges that everyone should have regardless of whether an individual wants them. In this sense, the government (or state) is acting paternally in providing merit goods and services. They believe that individuals may not act in their own best interest in part because of imperfect information about the benefits that can be derived. Good examples of merit goods include health services, education, work training programmes, public libraries, Citizen's Advice Bureaux and inoculations for children and students. Notice here that we are talking about the sorts of goods and services that society judges to be in our best welfare. Judgements involve subjective opinions – and we cannot escape from making some valued judgements when we are analysing and discussing merit goods.
• Do you believe that most National Health Services and dental services should be made available free at the point of need?
• Should the state continue to provide free and compulsory education up to the age of 16? • Should people be forced to make compulsory savings for their retirement?
Merit goods – museums and libraries
What are the external benefits that might flow from more people having access to our major museums and other heritage sites?

- 140 -
© Tutor2u Limited 2008 www.tutor2u.net
Who should pay for health care? This is a link to a useful BBC news online article on who should pay for health care? And a poll carried out by the British Medical Association showed that nearly two thirds of junior doctors thought patients would be charged for some health treatments in the future. Three in five (61%) thought it was unlikely that the NHS would be free at the point of use to all patients in 2017. And four in five people (83%) thought that the range of services provided by the NHS free at the point of use would decrease in future years. Four of the possible funding options for health care are Co-payments - Ask patients to contribute towards the cost of non-emergency surgery, such as hernias and varicose veins. Ration care - To some extent, this is already done by the National Institute for Clinical Excellence watchdog, NHS tax - A specific tax could be levied to help pay for treatment Social insurance - Public could be asked to pay into an insurance scheme
Costs Benefits
Output (Q)
Private Benefit
Supply
Social Benefit
Qp Qs
External Benefit
Welfare loss because merit goods tend to be under-consumed by the
free market A
B
C
Merit goods – could be provided by the market but consumers may not be able to afford or feel the need to purchase – thus the free-market economy would not provide them in the quantities society needs
- 141 -
© Tutor2u Limited 2008 www.tutor2u.net
Education as a merit good The argument concerning imperfect information is an important one here. Parents with relatively poor educational qualifications may be unaware of the full longer-term benefits that their children might derive from a proper education. Because the knowledge of these private benefits is an ongoing learning process, children themselves will tend to underestimate the long term gains from a proper education. Education is a long-term investment decision. The private costs must be paid now but the private benefits (including higher earnings potential over one’s working life) take time to emerge. Education should provide a number of external benefits that might not be taken into account by the free market. These include rising incomes and productivity for current and future generations; an increase in the occupational mobility of the labour force which should help to reduce unemployment and therefore reduce welfare spending. Increased spending on education should also provide a stimulus for higher-level research which can add to the long run trend rate of growth. Other external benefits might include the encouragement of a more enlightened and cultured society, less prone to political instabilities and one which manages to achieve a greater degree of social cohesion. Providing that the education system provides a sufficiently good education across all regions and sections of society, increased education and training spending should also open up a higher level of equality of opportunity. The reality is of course that there are very deep and wide variations in educational performance and opportunities across the country. School milk – should it be subsidised? Economists working as consultants for London Economics have written a paper arguing that the Government should consider ending the current milk subsidy scheme for 1.2 million primary school children in England as they cost too much to administer and do little to improve health. They found that administration costs took up 70 per cent of the total cost of running the milk scheme and that the money could be better spent on alternative projects. The subsidy payable on whole milk is about 19p per litre or 11p per pint and the subsidy payable on semi-skimmed milk is about 15p per litre or 9p per pint. Abandoning the payments to 15,000 schools and local education authorities in England would save £1.5 million a year. The subsidy is already set to be cut by 16 per cent up to July 2007 as part of Common Agricultural Policy reform. In their report the London Economics consultants argue that "The private sector already offers milk at a low price, so it is not clear why schools should offer it also. While many products are helpful for children - such as toothpaste and toothbrushes - schools do not typically offer them for sale to pupils." But Milk for Schools, a campaign funded by the dairy industry, says the subsidy should be extended, not dropped. A spokesman said that "School milk schemes are essential to ensure access to nutrition for all and that the scheme was important as a way of alleviating child poverty."
Source: Tutor2u Blog and Dairy UK, Milk for Schools

- 142 -
© Tutor2u Limited 2008 www.tutor2u.net
Brain food – is it a new merit good? Tucking into an oily fish as such sardine, salmon or mackerel may be the way that people can consumer sufficient fatty acids. But should the government provide a subsidy for schools to give their students multivitamin pills and omega-3 supplements in a bid to improve educational performance? The use of supplements as brain food is an interesting example of a paternalistic approach to improving education results. Some trials have found that omega-3 supplements can enhance learning abilities and relieve depression. Omega-3 is termed an "essential fat", found in oily fish. The claim is that such foods are under-consumed by children (and adults) in a world dominated by convenience foods with many of the important minerals and vitamins stripped away by the food processing industry. Naturally there are plenty of skeptics ready to line up and question not only the benefits of such supplements but also the cost. The retail price is estimated to be 40p to £1.20 a day per student for the recommended dose of half a gram. Might that money be better spent elsewhere for example in increased funding for school libraries or ICT equipment?
Source: Adapted from news reports, June 2006 The debate over free entry into museums Campaigners have hailed the success of free access to museums which have attracted an extra 30 million people to the nation's great artistic and cultural collections since admission charges were scrapped six years ago. Steve Sinnott, General Secretary of the National Union of Teachers, said that "Free access means that every child can benefit from the treasure chest contained within museums regardless of the depth of the parental pocket. Our national museums and galleries perform an enormously useful role for families across the United Kingdom and its right that admission to them should not be limited simply to those who can pay. In cultural policy terms it's one of the most significant achievements we have made and one of which I am most proud." Entrance fees to national museums across the country were scrapped on 1 December 2001. A report last year by the LSE found that before free admissions the total number of museum visits per year was approximately 27 million. By 2005 that had increased to 42 million, more than the number of people who visited Premiership matches that year and 50 per cent more than West End and Broadway theatre shows combined. Those museums that abandoned entry charges saw their annual attendance figures did particularly well, recording, on average, an 83 per cent increase in visits since 2001. But despite the government grants that have enabled museums to cut their entry fees many national museums are still finding it hard to make ends meet, particularly as their income has not been rising as fast as staff costs and inflation. The LSE's report found that national museums show a falling total of capital expenditure and an increased reliance on government support.
Adapted from the Independent and the Daily Telegraph, June 2007 Rise in popularity of free museums Victoria and Albert Museum, London: 2001 1.1 million; 2006 2.5 million Science Museum, London: 2001 1.3 million; 2006 2.4 million National Museums, Liverpool: 2001 0.7 million; 2006 1.7 million National Maritime Museum, London: 2001 0.9 million; 2006 1.6 million Natural History Museum, London: 2001 1.7 million; 2006 3.5 million Source: Department for Culture, Media and Sport BBC news audio on museums and visitor numbers (December 2006) So why does the government provide merit goods and services?
• To encourage consumption so that some of the positive externalities associated with merit goods can be achieved
• To overcome the information failures linked to merit goods, not least when the longer-term private benefit of consumption is greater than the shorter-term benefit of consumption
• On grounds of equity – because the government believes that consumption should not be based solely on the grounds of ability to pay for a good or service

- 143 -
© Tutor2u Limited 2008 www.tutor2u.net
33. Demerit goods Basically, de-merit goods are the opposite of merit goods. They can cause market failure too! Externalities and information failure with de-merit goods De-merit goods are thought to be ‘bad’ for you. Examples include the costs arising from consumption of alcohol, cigarettes and drugs together with the social effects of addiction to gambling. The consumption of de-merit goods can lead to negative externalities. The government seeks to reduce consumption of de-merit goods. Consumers may be unaware of the negative externalities that these goods create – they have imperfect information about long-term damage to their own health. The government may decide to intervene in the market for de-merit goods and impose taxes on producers and / or consumers. Higher taxes cause prices to rise and should lead to a fall in demand. But many economists argue that taxation is an ineffective and inequitable way of curbing the consumption of drugs and gambling particularly for those affected by addiction. Banning consumption through regulation may reduce demand, but risks creating secondary (illegal) or underground markets in the product. Obesity – a time bomb There is a huge debate at the moment about the root causes of obesity and the social costs that arise from increasing levels of obesity. A report published in June 2007 said that obesity could be a factor that bankrupted the National Health Service in the years to come. Obesity is also an international problem. Proportion of children in England who are obese: by sex
Percentages 1995 Boys Girls 2003 9.6 10.3 Children aged two to ten years. 14.9 12.5 Source: Health Survey for England
Links for extended reading Obesity could bankrupt the NHS (BBC news, June 2007) Tackling growing obesity (BBC news, December 2006) BBC news audio-visual pieces on the issue of obesity Infants being treated for obesity (BBC news, June 2007) Globesity – BBC World Service special report (July 2007)
Obesity – is it a case of market failure? Healthcare costs related to obesity-linked illnesses such as diabetes, heart disease and high cholesterol are soaring. Should the government intervene in the market in order to combat the growing costs of obesity?
The City of Detroit in the USA has considered a fast-food tax to combat some of the external costs of obesity

- 144 -
© Tutor2u Limited 2008 www.tutor2u.net
What of harder drugs? Should hard drugs be prohibited at all costs by the government in a bid to control demand by restricting supply? Regulation has been the route chosen by most governments in developed countries over recent years – but economists are once again divided on the issue. Some believe that legalisation and taxation of harder class drugs is a more appropriate policy to pursue, arguing that regulation is both ineffective and also costly. Another approach would be to divert resources away from regulation towards giving better information to drug users about the longer term health implications of their consumption decisions. Gambling – economic and social effects “Gambling has gained more widespread acceptance as a mainstream leisure activity and new forms of gambling have emerged, most notably via the internet.”
Source: UK Gambling Commission, Problem Gambling Issues Paper, March 2006 We have never had so many opportunities to place bets and engage in gambling on and offline. Our nation has over 130 small casinos and will soon have a raft of large super casinos. Add to that over 8,500 betting shops and an almost unlimited potential number of people willing and able to gamble online on poker websites and the betting platforms of the major bookmakers. From betting on the results of general elections, the Grand National, the number of corners that England win in one of their World Cup matches or the temperature in London on Christmas Day, we seem to have
Costs Benefits
Quantity
Demand (Limited Information)
Private Cost
Q1
Social Cost
Q2 Q3
Demand (Full Information)
External costs (negative externalities)
Market failure with demerit goods – the free market may fail to take into account the negative externalities of consumption (because the social cost > private cost). Consumers too may experience imperfect information about the long term costs to themselves of consuming products deemed to be de-merit goods
The social optimal level of consumption would be Q3 – an output that takes into account the information failure of consumers and also the negative externalities.
- 145 -
© Tutor2u Limited 2008 www.tutor2u.net
an almost insatiable desire for gambling on the outcomes of virtually every sporting, political, meteorological event. Segments of the gambling industry in the UK Online gaming (including internet poker) Casinos Dog races Football pools Other lotteries Private bets Fruit machines Bingo Horse racing Scratch-cards National Lottery Since the former Chancellor Gordon Brown cut betting tax in 2001 (replacing betting duty with a tax on the profits of gaming companies), the amount the nation spends on betting has increased sevenfold with £50bn spent last year alone. £50bn is a truly huge sum, representing just fewer than 5% of national income and more than the government spent on defence and transport combined in 2005. Expressed another way, our gambling spending last year came to more than £800 for every man, woman and child. Gambling is now a truly lucrative business, online poker companies have floated on the stock exchange and the industry is making huge profits. The 2004 Gambling Bill has now come into force and we are soon to find out the sites for the first tranche of super-casinos. Inevitably the rapid expansion of this industry raises important questions about the external costs and benefits of gambling. Some researchers point to the employment and tourism benefits that flow from the strong growth in demand for gambling services especially if businesses are established in some of the UK's poorest towns and cities. There is also a fiscal dividend from this booming industry with a predicted £3bn per year of extra tax revenues flowing into the Treasury's coffers. The hidden external costs But gambling also creates external costs. Over 350,000 people in the UK are thought to be addicted to betting and their problem gambling can contribute to crises including personal debt or bankruptcy, loss of employment and the breakdown of families. The dangers of addiction are greatest for the young and the vulnerable, especially those susceptible to advertising and marketing strategies. Two disturbing trends concern gambling addictions among young teenage children and also the growing demand for betting from females with women now making a fifth of calls to gambling addiction help lines. Polly Toynbee writing in the Guardian in April 2006 “Really destructive gambling, often hidden in lace-curtain secrecy, creates harm that the state should try to limit, not encourage. The children who fall furthest below the poverty line are those whose plight does not get recorded in the statistics because their parents' income is devastated by gambling mania, which crosses every class line and is often unseen outside the family."
Source: Guardian special report on gambling To what extent can gambling be regarded as a de-merit good? De-merit goods are thought to be ‘bad’ for you although remember that holding such a view implies that a normative value judgement is being made. The consumption of de-merit goods can lead to

- 146 -
© Tutor2u Limited 2008 www.tutor2u.net
negative externalities so that the social costs of consumption are greater than the private costs to the individual concerned. De-merit goods and information failure The government may seek to reduce consumption of de-merit goods. Consumers may be unaware of the negative externalities that these goods create – they have imperfect information about long-term damage to their own health, their finances and the stability and health of their own families. The usual approach to de-merit goods is to tax consumption, so that the private cost of consumption is increased and demand contracts. But the government has actually got rid of betting & gaming duty (it was abolished in 2001) to be replaced with a tax on the profits of gaming companies. The Gambling Act of 2005 deregulates the industry and allows the creation of more casinos in the UK. Background on gambling in the UK The estimated annual turnover of gambling activities in the UK is about £53 billion, according to 2005 figures from the National Audit Office. The most popular gambling activity in Britain is lotteries, especially the National Lottery, with some two thirds of the population having bought a lottery ticket in the past year. The second most popular gambling activity is the purchase of scratch-cards, with one in five (22%) people purchasing scratch-cards in the past year. This is followed by fruit machines (14%) and betting on horseracing (13%). UK Gambling Commission: http://www.gamblingcommission.gov.uk/Client/index.asp Gamblers Anonymous: http://www.gamblersanonymous.org.uk/ Suggestions for further reading on de-merit goods and market failure Alcohol and market failure (Tutor2u presentation) Doctors attack gambling policies (BBC news online, April 2007) Australia in thrall of gambling mania (BBC news online, January 2007) Call for better NHS gambling help (BBC news online, January 2007) 'Casino social costs outweigh benefits' (BBC news online, September 2006) Minimum age for buying cigarettes to be raised to 18 (BBC news online, July 2007)
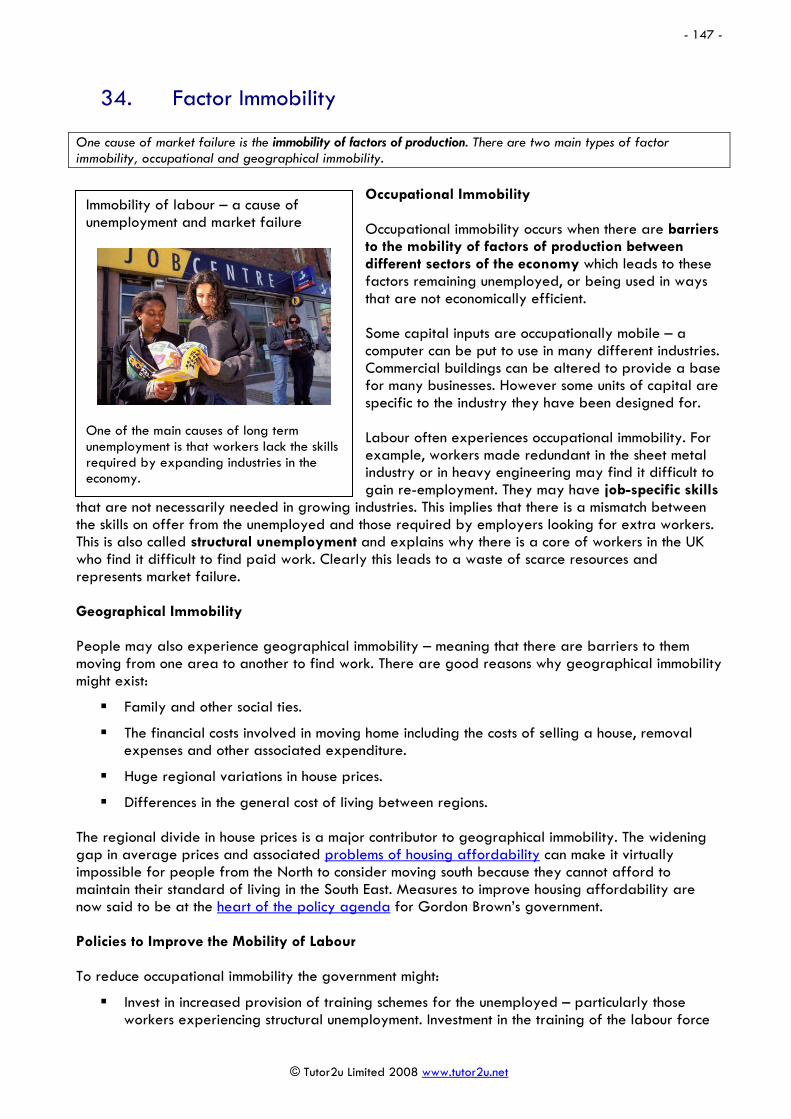
- 147 -
© Tutor2u Limited 2008 www.tutor2u.net
34. Factor Immobility One cause of market failure is the immobility of factors of production. There are two main types of factor immobility, occupational and geographical immobility.
Occupational Immobility Occupational immobility occurs when there are barriers to the mobility of factors of production between different sectors of the economy which leads to these factors remaining unemployed, or being used in ways that are not economically efficient. Some capital inputs are occupationally mobile – a computer can be put to use in many different industries. Commercial buildings can be altered to provide a base for many businesses. However some units of capital are specific to the industry they have been designed for. Labour often experiences occupational immobility. For example, workers made redundant in the sheet metal industry or in heavy engineering may find it difficult to gain re-employment. They may have job-specific skills
that are not necessarily needed in growing industries. This implies that there is a mismatch between the skills on offer from the unemployed and those required by employers looking for extra workers. This is also called structural unemployment and explains why there is a core of workers in the UK who find it difficult to find paid work. Clearly this leads to a waste of scarce resources and represents market failure. Geographical Immobility People may also experience geographical immobility – meaning that there are barriers to them moving from one area to another to find work. There are good reasons why geographical immobility might exist:
Family and other social ties.
The financial costs involved in moving home including the costs of selling a house, removal expenses and other associated expenditure.
Huge regional variations in house prices.
Differences in the general cost of living between regions. The regional divide in house prices is a major contributor to geographical immobility. The widening gap in average prices and associated problems of housing affordability can make it virtually impossible for people from the North to consider moving south because they cannot afford to maintain their standard of living in the South East. Measures to improve housing affordability are now said to be at the heart of the policy agenda for Gordon Brown’s government. Policies to Improve the Mobility of Labour To reduce occupational immobility the government might:
Invest in increased provision of training schemes for the unemployed – particularly those workers experiencing structural unemployment. Investment in the training of the labour force
Immobility of labour – a cause of unemployment and market failure
One of the main causes of long term unemployment is that workers lack the skills required by expanding industries in the economy.

- 148 -
© Tutor2u Limited 2008 www.tutor2u.net
is designed to boost the human capital of employees to give them new skills and skills that can be transferred from one occupation to another. If such training is successful, then the labour market can become more flexible in response to changes in labour demand and labour supply
Subsidise the provision of industrial training by private sector firms to raise the skills level
Raise total spending on education and move towards increased investment in vocational training for students
To reduce geographical immobility:
Reforms to the housing market designed to improve the supply and reduce the cost of rented properties and to increase the supply of affordable properties
Specific subsidies for people moving into areas where there are shortages of labour – for example teachers and workers in the National Health Services
35. Imperfect Information Both consumers and producers require complete information if they are to make efficient choices and decisions about what to buy and what to supply to the market. What happens when this information is missing or incomplete? Missing information in the market In the usual theory of competitive markets we assume that all “agents” in the market enjoy perfect information about the availability of goods and services and also complete information about prices charged by suppliers. Consumers can make purchasing decisions on the basis of full and free information on the products that they are buying. The reality of course is very different! All of us experience information deficits which can often lead to a misallocation of resources and hence the possibility of market failure. Information failure occurs when people have inaccurate, incomplete, uncertain or misunderstood data and so make potentially ‘wrong’ choices. From pensions to computer games consoles, from investing in the stock market to ignorance about the consequences of borrowing and debt, all of us suffer from one or more information failures. The issue is whether the information failure is only trivial or whether it has a huge effect on individuals, their families and the community as a whole. For example, you and I might under or over-estimate the private benefit from consuming a particular good or service. The classic case of this is the demand for health or education services– where consumers may well underestimate the long term private benefits from investing time and money into extra education or buying a specific form of health treatment. There may well be a case for the government to intervene in the market in some way if information failures become serious. Examples of information failure Imperfect information can be caused by
Misunderstanding the true costs or benefits of a product: E.g. the social costs and benefits of different classes of drugs and the private and social benefits from higher education when there are so many universities and courses to choose from.
Uncertainty about costs and benefits e.g. should younger workers be buying into pension schemes when we can only guess at economic conditions in 40 years time?

- 149 -
© Tutor2u Limited 2008 www.tutor2u.net
Complex information e.g. choosing between makes of computers requires specialist knowledge of hardware. Do I buy an Apple or PC computer? The problems of choosing a quality second hand car or when deciding whether or not to buy a property.
Inaccurate or misleading information e.g. persuasive advertising may ‘oversell’ the benefits of a product leading to a higher demand and consumption than is optimal. Spam mail can be a cause of mis-information for consumers. Read this Tim Harford article on spam!
Addiction e.g. drug addicts may be unable to stop consumption of harmful substances Imperfect information – are equity release schemes being mis-sold? The consumer watchdog group Which? has criticized the advertising of housing equity release schemes which they claim can be very expensive and inflexible leaving homeowners, and especially older property owners, with virtually no equity in their properties later on in their life. Which? claims that, for example, borrowing £80,000 through a lump sum equity release scheme on a £350,000 property could end up costing £256,570 after 20 years or £343,350 after 25 years. Although the equity release schemes give property-owners the cash (or liquidity) that might be needed to meet short term spending needs, Which claims that such schemes are incredible expensive and that downsizing your property or even borrowing money from family is a much better option. Which? believe some suppliers of equity release schemes have engaged in irresponsible advertising which can lead to a miss-selling of the product. Norwich Union, for example, suggests its scheme could pay for a trip to New York or 'something for the family'.
Source: Adapted from the Which? website
Health warnings for snacks in bid to improve consumer information The food industry has made its first move towards issuing health warnings for snack foods. The decision comes as food companies come under in-creasing pressure to provide more information about the nutritional value of their products amid concern about rising levels of obesity. It marks a shift in the food industry’s attitude towards consumers. Food companies have argued that consumer education is not their job. However, the threat of legislation to regulate the promotion of food to children has prompted the food and drink industry to become more proactive. The European Commission released a green paper in December questioning whether companies’ self-regulation for the marketing of sugary snacks and soft drinks was “adequate”. Last month, soft drink producers agreed to a voluntary ban on advertising to children in Europe. They also said they would provide better nutritional information on beverages and public education campaigns to promote healthy lifestyles. Food and drink manufacturers have already made efforts to cut down on fats, salts and sugars, and provide more nutritional information. This week, Walkers crisps said it had made a multimillion pound investment in sun seed oil to reduce levels of saturated fats. Last month, Nestlé said it would put calorie information on the front of confectionery packets.
Source: Adapted from news reports, February 2006 The effects of asymmetric information Asymmetric information occurs when somebody knows more than somebody else in the market. Such asymmetric information can make it difficult for the two people to do business together Examples include the following:
A government selling mobile phone or broadcasting licences does not know what buyers are prepared to pay for them (an auction is usually the preferred solution to this).
A lender does not know how likely a borrower is to repay their loan in future years.
A used-car seller knows more about the quality of the car being sold than do buyers.

- 150 -
© Tutor2u Limited 2008 www.tutor2u.net
Asymmetric information can distort people's incentives to buy and sell goods and services at the right prices and as a result can lead to inefficiencies and market failure. One of the classic examples of asymmetric information comes from research on the used car market by the Nobel Prize winning economist George Akerlof – in his theory of the market for lemons! The Market for Lemons Take problem of buying a used car. Assume that used cars come in two types: those that are in good repair, and duds (or “lemons” as Americans and most economists call them). Suppose further that used-car shoppers would be prepared to pay $20,000 for a good one and $10,000 for a lemon. As for the sellers, lemon-owners require $8,000 to part with their old banger, while the one-owner, careful-driver old lady with the well-maintained estate won't part with hers for less than $17,000. If buyers had the information to tell wheat from chaff, they could strike fair trades with the sellers, the old lady getting a high price and the lemon-owner rather less. If buyers cannot spot the quality difference, though, as is often the case in the real world, there will be only one market for all used cars, and buyers will be ready to pay only the average price of a good car and a lemon, or $15,000. This is below the $17,000 that good-car owners require; so they will exit the market, leaving only bad cars. This result, when bad quality pushes good quality from the market because of an information gap, is known as “adverse selection”. This was the simple but powerful insight of George Akerlof, now a professor at the University of Berkeley in California, in a seminal 1970 paper. A great many markets, including those for shares, labour, insurance and banking, often resemble a used-car sale more closely than a McDonald's restaurant.
Adapted from the Economist, October 2001
Try to avoid choosing a lemon (a bad car) when you use the second hand car market!
Suggestions for wider reading on information failure Broker fined for PPI mis-selling (BBC news, October 2006) Government information campaign on the dangers of passive smoking (BBC AV, March 2007) The big cost of avoiding little risk – Tim Harford (BBC online, August 2006) If life gives you lemons (Tim Harford, Slate, July 2006) Confusion Pricing - Why cell-phone plans are so hard to understand (Tim Harford, Slate, April 2007)

- 151 -
© Tutor2u Limited 2008 www.tutor2u.net
36. Poverty and Inequality in Resource Allocation In this chapter we consider some of the causes of the huge gap between rich and poor in the UK, something that is visible in nearly every country regardless of their stage of economic development. Poverty, Inequality and Market Failure In a market economy an individual’s ability to consume goods & services depends upon his/her income. An unequal distribution of income and wealth may result in an unsatisfactory allocation of resources. Households defined as relatively poor do not have access to the range of goods and service consumed by ‘average’ citizens and high inequality may also lead to alienation and encourage crime with negative consequences for all. The free-market system will not necessarily respond to the needs and wants of those with insufficient economic votes to have any impact on market demand because what matters in a market based system is your effective demand for goods and services. Top of the income ladder “The richest have continued to get richer. The richest one per cent of the population has increased their share of income from around six per cent in 1980 to 13 per cent in 1999. Inequality in disposable income (after taxes and benefits) appears to have slightly increased since 1997 after significant increases in the 1980s.”
“The State of the Nation” IPPR report, www.ippr.org.uk August 2004 When we are discussing inequality and poverty, we cannot escape having to make value judgements (i.e. making normative statements). Ultimately, what constitutes an ‘unacceptable’ distribution of income and what if anything the government should do about this is a value judgement and is a political issue beyond the remit of economics? That said there is plenty of evidence that high and rising levels of inequality of income and wealth can lead to negative social consequences – i.e. external costs that affect the whole of society. Absolute poverty Absolute poverty measures the number of people living below a certain income threshold or the number of households unable to afford certain basic goods and services. What we choose to include in a basic acceptable standard of living is naturally open to discussion. Relative poverty Relative poverty measures the extent to which a household’s financial resources falls below an average income threshold for the economy. Although living standards and real incomes have grown because of higher employment and sustained economic growth over recent years, the gains in income and wealth have been unevenly distributed across the population. There is little doubt that Britain has become a more unequal society over the last 20-25 years. Poorer families have a lower life expectancy People from poorer backgrounds are unhealthier and die earlier than the rich, according a study measuring the link between health and wealth. Poorer people in their fifties were 10 times more likely to die earlier than those who are richer, according to a report from the Institute of Fiscal Studies (IFS). That was despite an "even distribution in the quality of healthcare between different wealth groups", the IFS said. The poor often have to stop work early due to ill health, the group added and this increases the risk of these groups suffering income poverty during their retirement years.
Source: BBC news and Institute for Fiscal Studies
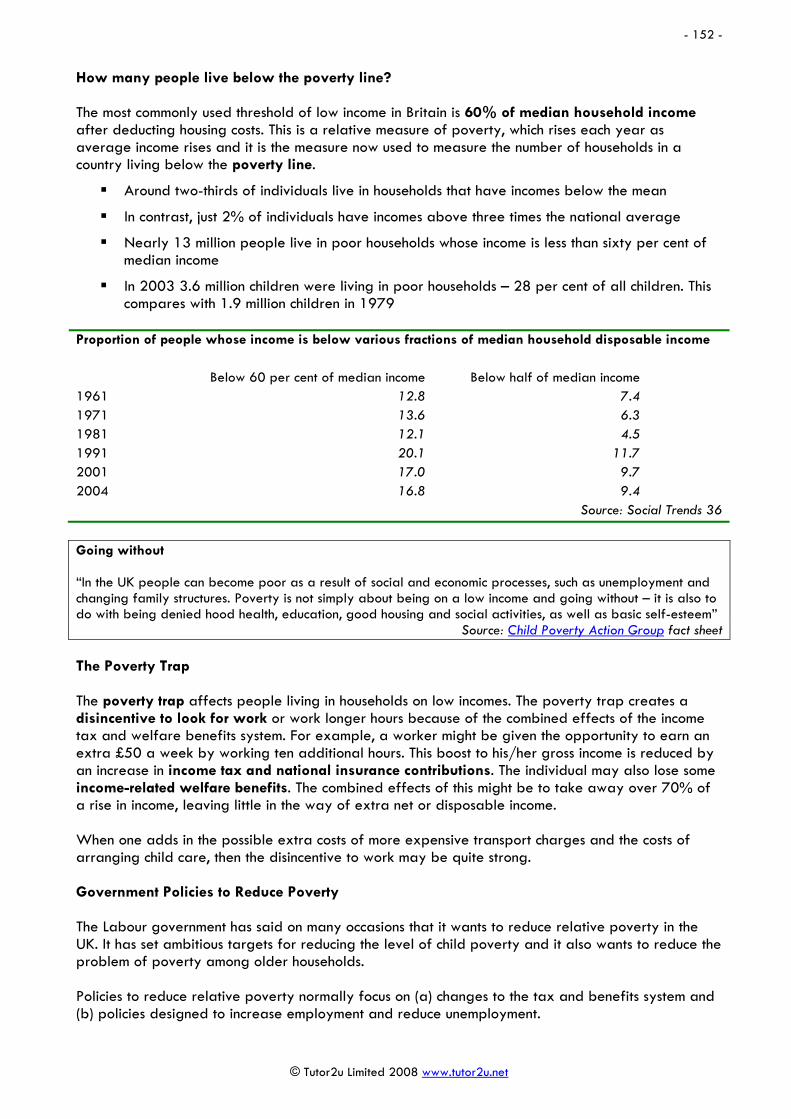
- 152 -
© Tutor2u Limited 2008 www.tutor2u.net
How many people live below the poverty line? The most commonly used threshold of low income in Britain is 60% of median household income after deducting housing costs. This is a relative measure of poverty, which rises each year as average income rises and it is the measure now used to measure the number of households in a country living below the poverty line.
Around two-thirds of individuals live in households that have incomes below the mean
In contrast, just 2% of individuals have incomes above three times the national average
Nearly 13 million people live in poor households whose income is less than sixty per cent of median income
In 2003 3.6 million children were living in poor households – 28 per cent of all children. This compares with 1.9 million children in 1979
Proportion of people whose income is below various fractions of median household disposable income Below 60 per cent of median income Below half of median income 1961 12.8 7.4 1971 13.6 6.3 1981 12.1 4.5 1991 20.1 11.7 2001 17.0 9.7 2004 16.8 9.4
Source: Social Trends 36
Going without “In the UK people can become poor as a result of social and economic processes, such as unemployment and changing family structures. Poverty is not simply about being on a low income and going without – it is also to do with being denied hood health, education, good housing and social activities, as well as basic self-esteem”
Source: Child Poverty Action Group fact sheet The Poverty Trap The poverty trap affects people living in households on low incomes. The poverty trap creates a disincentive to look for work or work longer hours because of the combined effects of the income tax and welfare benefits system. For example, a worker might be given the opportunity to earn an extra £50 a week by working ten additional hours. This boost to his/her gross income is reduced by an increase in income tax and national insurance contributions. The individual may also lose some income-related welfare benefits. The combined effects of this might be to take away over 70% of a rise in income, leaving little in the way of extra net or disposable income. When one adds in the possible extra costs of more expensive transport charges and the costs of arranging child care, then the disincentive to work may be quite strong. Government Policies to Reduce Poverty The Labour government has said on many occasions that it wants to reduce relative poverty in the UK. It has set ambitious targets for reducing the level of child poverty and it also wants to reduce the problem of poverty among older households. Policies to reduce relative poverty normally focus on (a) changes to the tax and benefits system and (b) policies designed to increase employment and reduce unemployment.

- 153 -
© Tutor2u Limited 2008 www.tutor2u.net
When evaluating different policies to reduce poverty consider some of these related issues:
1. Cost: The cost of schemes such as an increase in welfare benefits or the New Deal
2. Effectiveness: The effectiveness of policies – e.g. the possible low “take-up” of means tested benefits by the poorest households
3. Impact on others in the economy: Whether introducing a more progressive welfare system might damages towards wealth creation in other parts of the economy
Some of the main policy measures are summarised below:
1. Changes to the tax and benefits system To many economists, the tax system is the most obvious place to start if the government wants to make a serious effect on the scale of relative poverty. For example, increases in higher rates of income tax would make the British tax system more progressive and reduce the post-tax incomes of people at the top of the income scale. The risk is that higher rates of direct taxation may act as a disincentive for people to earn extra income and might damage enterprise and productivity. Lower "starting rates" of income tax would help to reduce the poverty trap and encourage people to look for a job. One of the problems with this is that all taxpayers would benefit from lower starting rates of tax and increased tax allowances whether or not they are poor. Therefore it is an expensive way of alleviating relative poverty.
2. A switch towards greater means-tested benefits Means testing allows welfare benefits to go to those people and families in greatest need. A means-test involves a check on the financial circumstances of the benefit claimant before paying any benefit out. This would help the welfare system to target help for those households on the lowest incomes. However means tested benefits are often unpopular with the recipients.
3. Linking the state retirement pension to average earnings rather than prices This policy would help to relieve relative poverty among low-income pensioner households. Their pension would rise in line with the growth of average earnings each year. However given the demographic pressures on the welfare state (not least the long run increase in the number of people of pension age) such a strategy would be extremely expensive and put great pressure on total government spending. Other areas of spending might suffer a reduction in funding. Or the burden of taxation might have to increase to fund a substantial increase in spending on state pensions.
4. Special employment measures (including New Deal) Government employment schemes seek to raise employment levels and improve the employment prospects of the long-term unemployed. Many schemes have been tried in the past - the latest of which is Labour's New Deal strategy that focuses on reducing long-term unemployment among youth and older workers. The New Deal includes employment subsidies and employment training for participants on the scheme.
5. Regional Policy Assistance Relative poverty is often worse in areas where unemployment is well above the national average. The government may allocate increase funds for regional policy initiatives to attract new businesses into depressed areas and to improve the infrastructure of these regions. There are doubts though about the cost-effectiveness of regional policy funding. The European Union provides regional “structural” funds for areas where GDP is less than seventy-five per cent of the European

- 154 -
© Tutor2u Limited 2008 www.tutor2u.net
Union average. Regions such as Cornwall, Wales, Scotland, Northern Ireland and the North East and North West of England have been in receipt of these funds over recent years.
6. Increased spending on education and training Unemployment is a cause of poverty and structural unemployment makes the problem worse. There are millions of households in the UK where no one in the family is in any kind of work and this increases the risk of poverty. There are substantial long term benefits from improving the educational attainment of families on low incomes and improving their prospects in the labour market.
7. The National Minimum Wage The National Minimum Wage (NMW) was introduced in April 1999. It is a statutory pay floor - employers cannot legally undercut the NMW. A minimum wage will help to reduce relative poverty for people who earn very low wages. But only a small percentage of the employed labour force is directly affected by the minimum wage. Since 1999, the beneficial impact of the minimum wage has been concentrated on the lowest paid workers in service sector jobs where there is little or no trade union protection. Female workers have been affected more than males – thus the NMW is making some contribution to closing the long-term gender pay gap in the British economy. There is an argument that workers in all jobs deserve a fair rate of pay for the job they do and that a minimum wage should reduce exploitation of lower-paid workers by some employers. However a minimum wage may cost jobs in some industries. To the extent that this worsens the living standards of those affected it has a negative impact on poverty. Further background reading on poverty and inequality in the UK Breadline Britain (BBC) Child Poverty Action Group (CPAG) Institute of Public Policy Research Help the Aged Campaign on Pensioner Poverty Joseph Rowntree Foundation End Child Poverty Campaign The changing face of poverty (BBC) News articles on poverty and wealth inequality Minimum wage is costing jobs (BBC news, September 2006) Boss and worker pay gap 'widens' (BBC news, November 2006) Carlos Slim becomes the world’s richest man (BBC news, July 2007) Russian billionaire numbers grow (BBC news, March 2007) Poverty target will be missed (BBC news, May 2007) Poverty cycle of a single father (BBC news, May 2007) Poverty 'limiting life chances' (BBC news, May 2007) Minimum wage puts Britain on top to combat worker poverty (Guardian, May 2007)

- 155 -
© Tutor2u Limited 2008 www.tutor2u.net
37. Government Intervention in the Market In a free market economic system, scarce resources are allocated through the price mechanism where the preferences and spending decisions of consumers and the supply decisions of businesses come together to determine equilibrium prices. The free market works through price signals. When demand is high, the potential profit from supplying to a market rises, leading to an expansion in supply (output) to meet rising demand from consumers. Day to day, the free market mechanism remains a tremendously powerful device for determining how resources are allocated among competing ends. Intervention in the market The government may choose to intervene in the price mechanism largely on the grounds of wanting to change the allocation of resources and achieve what they perceive to be an improvement in economic and social welfare. All governments of every political persuasion intervene in the economy to influence the allocation of scarce resources among competing uses What are the main reasons for government intervention? The main reasons for policy intervention are:
(1) To correct for market failure
(2) To achieve a more equitable distribution of income and wealth
(3) To improve the performance of the economy Options for government intervention in markets There are many ways in which intervention can take place – some examples are given below Government Legislation and Regulation Parliament can pass laws that for example prohibit the sale of cigarettes to children, or ban smoking in the workplace. The laws of competition policy act against examples of price-fixing cartels or other forms of anti-competitive behaviour by firms within markets. Employment laws may offer some legal protection for workers by setting maximum working hours or by providing a price-floor in the labour market through the setting of a minimum wage. The economy operates with a huge and growing amount of regulation. The government appointed regulators who can impose price controls in most of the main utilities such as telecommunications, electricity, gas and rail transport. Free market economists criticise the scale of regulation in the economy arguing that it creates an unnecessary burden of costs for businesses – with a huge amount of “red tape” damaging the competitiveness of businesses. Regulation may be used to introduce fresh competition into a market – for example breaking up the existing monopoly power of a service provider. A good example of this is the attempt to introduce more competition for British Telecom. This is known as market liberalisation. Direct State Provision of Goods and Services Because of privatization, the state-owned sector of the economy is much smaller than it was twenty years ago. The main state-owned businesses in the UK are the Royal Mail and Network Rail.

- 156 -
© Tutor2u Limited 2008 www.tutor2u.net
State funding can also be used to provide merit goods and services and public goods directly to the population e.g. the government pays private sector firms to carry out operations for NHS patients to reduce waiting lists or it pays private businesses to operate prisons and maintain our road network. Fiscal Policy Intervention Fiscal policy can be used to alter the level of demand for different products and also the pattern of demand within the economy.
(a) Indirect taxes can be used to raise the price of de-merit goods and products with negative externalities designed to increase the opportunity cost of consumption and thereby reduce consumer demand towards a socially optimal level
(b) Subsidies to consumers will lower the price of merit goods. They are designed to boost consumption and output of products with positive externalities – remember that a subsidy causes an increase in market supply and leads to a lower equilibrium price
(c) Tax relief: The government may offer financial assistance such as tax credits for business investment in research and development. Or a reduction in corporation tax (a tax on company profits) designed to promote new capital investment and extra employment
(d) Changes to taxation and welfare payments can be used to influence the overall distribution of income and wealth – for example higher direct tax rates on rich households or an increase in the value of welfare benefits for the poor to make the tax and benefit system more progressive
Intervention designed to close the information gap Often market failure results from consumers suffering from a lack of information about the costs and benefits of the products available in the market place. Government action can have a role in improving information to help consumers and producers value the ‘true’ cost and/or benefit of a good or service. Examples might include:
(1) Compulsory labelling on cigarette packages with health warnings to reduce smoking
(2) Improved nutritional information on foods to counter the risks of growing obesity
(3) Anti speeding television advertising to reduce road accidents and advertising campaigns to raise awareness of the risks of drink-driving
(4) Advertising the availability of health screening programmes / information campaigns on the dangers of addiction
These programmes are really designed to change the “perceived” costs and benefits of consumption for the consumer. They don’t have any direct effect on market prices, but they seek to influence “demand” and therefore output and consumption in the long run. Of course it is difficult to identify accurately the effects of any single government information campaign, be it the campaign to raise awareness on the Aids issue or to encourage people to give up smoking. Increasingly adverts are becoming more hard-hitting in a bid to have an effect on consumers. The effects of government intervention One important point to bear in mind is that the effects of different forms of government intervention in markets are never neutral – financial support given by the government to one set of producers rather than another will always create “winners and losers”. Taxing one product more than another will similarly have different effects on different groups of consumers.
- 157 -
© Tutor2u Limited 2008 www.tutor2u.net
The ‘law of unintended consequences’ Government intervention does not always work in the way in which it was intended or the way in which economic theory predicts it should. Part of the fascination of studying Economics is that the “law of unintended consequences” often comes into play – events can affect a particular policy, and consumers and businesses rarely behave precisely in the way in which the government might want! We will consider this in more detail when we consider government failure. Judging the effects of intervention – a useful check list To help your evaluation of government intervention – it may be helpful to consider these questions:
Efficiency of a policy: i.e. does a particular intervention lead to a better use of scarce resources among competing ends? E.g. does it improve allocative, productive and dynamic efficiency? For example - would introducing indirect taxes on high fat foods be an efficient way of reducing some of the external costs linked to the growing problem of obesity? Effectiveness of a policy: i.e. which government policy is most likely to meet a specific economic or social objective? For example which policies are likely to be most effective in reducing road congestion? Which policies are more effective in preventing firms from exploiting their monopoly power and damaging consumer welfare? Evaluation can also consider which policies are likely to have an impact in the short term when a quick response from consumers and producers is desired. And which policies will be most cost-effective in the longer term? Equity effects of intervention: i.e. is a policy thought of as fair or does one group in society gain more than another? For example it is equitable for the government to offer educational maintenance allowances (payments) for 16-18 year olds in low income households to stay on in education after GCSEs? Would it be equitable for the government to increase the top rate of income tax to 50 per cent in a bid to make the distribution of income more equal? Sustainability of a policy: i.e. does a policy reduce the ability of future generations to engage in economic activity? Inter-generational equity is an important issue in many current policy topics for example decisions on which sources of energy we rely on in future years.

- 158 -
© Tutor2u Limited 2008 www.tutor2u.net
38. Indirect Taxation What are indirect taxes? An indirect tax is imposed on producers (suppliers) by the government. Examples include excise duties on cigarettes, alcohol and fuel and also VAT. Taxes are levied by the government for a number of reasons e.g. as a strategy to curb pollution and improve the environment. A tax increases the costs of a business causing an inward shift in the supply curve. The vertical distance between the pre-tax and the post-tax supply curve shows the tax per unit. With an indirect tax, the supplier may be able to pass on some or all of this tax onto the consumer through a higher price. This is known as shifting the burden of the tax and the ability of businesses to do this depends on the price elasticity of demand and supply.
In the left hand diagram, demand is elastic meaning that demand is responsive to a change in price. The producer must absorb most of the tax itself (i.e. accept a lower profit margin on each unit sold). When demand is elastic, the effect of a tax is to raise the price – but we see a bigger fall in equilibrium quantity. Output has fallen from Q to Q1 due to a contraction in demand. In the right hand diagram above demand for the product is inelastic and therefore the producer is able to pass on most of the tax to the consumer through a higher price without losing too much in the way of sales.
Price
Quantity
S1
Q1
Price
Quantity
D1
S + Tax
P2
Q2 Q1
P1 D1
Q2
P1
A Tax when Demand is Price Inelastic A Tax When Demand is Price Elastic
S + Tax
P2
S1
Taxation is the opposite of a government subsidy – the effect is to change the behaviour of suppliers and consumers by changing the costs of production and thereby influencing the market equilibrium price and quantity. The effect of an indirect tax depends on the price elasticity of demand and also the price elasticity of supply

- 159 -
© Tutor2u Limited 2008 www.tutor2u.net
Who pays the tax? The burden of taxation
Taxation, elasticity of demand and government revenue The Government would rather place indirect taxes on commodities where demand is inelastic because the tax causes only a small fall in the quantity consumed and as a result the total revenue from taxes will be greater. An example of this is the high level of duty on cigarettes and petrol. The table below shows the demand and supply schedules for a good Price (£)
Quantity Demanded Quantity Supplied (Pre-tax)
Quantity supplied (Post-tax)
10 20 1280 600 9 60 1000 400 8 150 850 150 7 260 600 50 6 400 400 5 600 150 4 900 50
Price
Quantity
S1
Q1
Price
Quantity
D1
S + Tax
P2
Q2 Q1
P1 D1
Q2
P1
A Tax when Demand is Price Inelastic A Tax When Demand is Price Elastic
S + Tax
P2
S1
When demand is inelastic, the producer is able to pass on most or perhaps all of an indirect tax to the consumer by raising the market price. Conversely when demand is price elastic, the producer cannot pass on much of the tax to the consumer, they must absorb the majority of the tax themselves
P3
P3
The burden of an indirect tax paid by the consumer
The burden of an indirect tax paid by the producer

- 160 -
© Tutor2u Limited 2008 www.tutor2u.net
1 What is the initial equilibrium price and quantity?
Price = £6
Quantity = 400
2 The government imposes a tax of £3 per unit. The new supply schedule is shown in the right hand column of the table – less is now supplied at each and every market price
3 Find the new equilibrium price after the tax has been imposed New price =£8
4 Calculate the total tax revenue going to the government Tax revenue = £450
5 How have consumers been affected by this tax?
There has been a fall in quantity traded and a rise in the price paid by consumers – this leads to a fall in economic welfare as measured by consumer surplus
Specific taxes A specific tax is where the tax per unit is a fixed amount – for example the duty on a pint of beer or the tax per packet of twenty cigarettes. Another example is the air passenger duty which imposes a standard tax of £10 for flights within the European Economic Area (EEA) and £40 for flights outside of the EEA Ad valorem taxes Where the tax is a percentage of the cost of supply – the best example of this is value added tax currently levied at the standard rate of 17.5% or Insurance Premium Tax which is taxed at 5%. In the diagram below, an ad valorem tax has been imposed on producers. The market equilibrium price rises from P1 to P2 whilst quantity traded falls from Q1 to Q2.
Note that the effect of an ad valorem tax is to cause a pivotal shift in the supply curve. This is because the tax is a percentage of the unit cost of supplying the product. So a good that could be supplied for a cost of £50 will now cost £58.75 when VAT of 17.5% is applied whereas a different good that costs £400 to supply will now cost £470 when the same rate of VAT is applied. The absolute amount of the tax will go up as the market price increases.
Price
Quantity
Demand
Supply + Ad valorem tax
P1
Q1
S1
P2
Q2
An ad valorem tax causes a pivotal shift in the
producer’s supply curve

- 161 -
© Tutor2u Limited 2008 www.tutor2u.net
Tobacco taxation is a good example of a product on which both specific and ad valorem taxes are applied. The data below is taken from information produced by the UK Customs and Excise and breaks down the taxation of cigarettes for a typical brand in the mid-price category. Over the last ten years, the specific duty on cigarettes has nearly doubled from 105 pence in 1994 to 200 pence after the March 2004 Budget. When we add value added tax to the equation, the total tax on a standard packet of twenty cigarettes has grown from 186 pence in 1994 to 365 pence in 2004. Cigarette taxation in the UK is the highest among European Union nations. Total taxation as a percentage of the price has remained fairly stable over the last decade at 80 – 81 per cent. Taxation on Cigarettes Typical Brand In Mid Price Category
(for a pack of 20 cigarettes) Typical Pre-tax Specific Ad VAT Total Tax as % Specific Price Price Duty Valorem Tax of Price Duty as % of Duty Total Tax 1994 232 46.4 104.7 46.4 34.6 185.6 80.0 56.4 2000 367 66.4 165.2 80.7 54.7 300.6 81.9 55.0 2004 449 83.7 199.6 98.8 66.9 365.3 81.3 54.6 2006 210.2 104.1
In recent years the government has encouraged a switch away from direct taxation on income towards indirect taxes on the goods and services that we buy and then consume. A wider range of indirect taxes has been introduced including the Insurance Premium Tax, the Air Passenger Duty and the Landfill Tax.
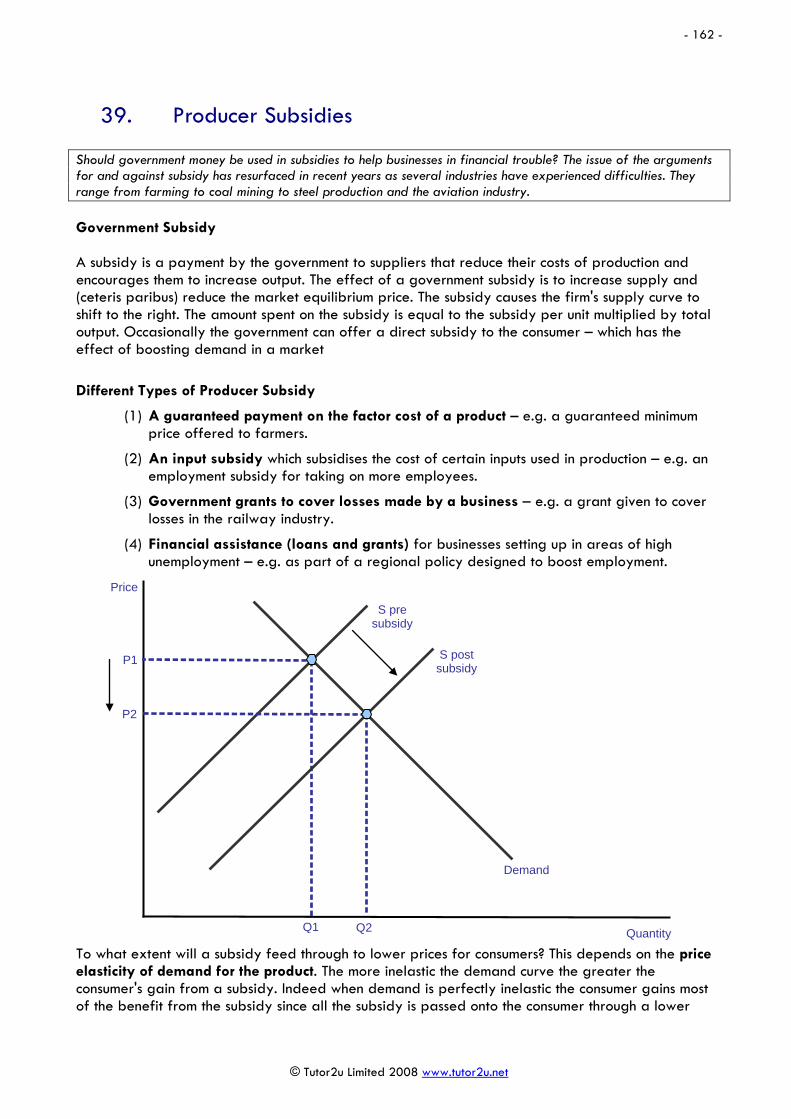
- 162 -
© Tutor2u Limited 2008 www.tutor2u.net
39. Producer Subsidies Should government money be used in subsidies to help businesses in financial trouble? The issue of the arguments for and against subsidy has resurfaced in recent years as several industries have experienced difficulties. They range from farming to coal mining to steel production and the aviation industry. Government Subsidy A subsidy is a payment by the government to suppliers that reduce their costs of production and encourages them to increase output. The effect of a government subsidy is to increase supply and (ceteris paribus) reduce the market equilibrium price. The subsidy causes the firm's supply curve to shift to the right. The amount spent on the subsidy is equal to the subsidy per unit multiplied by total output. Occasionally the government can offer a direct subsidy to the consumer – which has the effect of boosting demand in a market
Different Types of Producer Subsidy
(1) A guaranteed payment on the factor cost of a product – e.g. a guaranteed minimum price offered to farmers.
(2) An input subsidy which subsidises the cost of certain inputs used in production – e.g. an employment subsidy for taking on more employees.
(3) Government grants to cover losses made by a business – e.g. a grant given to cover losses in the railway industry.
(4) Financial assistance (loans and grants) for businesses setting up in areas of high unemployment – e.g. as part of a regional policy designed to boost employment.
To what extent will a subsidy feed through to lower prices for consumers? This depends on the price elasticity of demand for the product. The more inelastic the demand curve the greater the consumer's gain from a subsidy. Indeed when demand is perfectly inelastic the consumer gains most of the benefit from the subsidy since all the subsidy is passed onto the consumer through a lower
Price
Quantity
Demand
P1
Q1
S pre subsidy
P2
Q2
S post subsidy

- 163 -
© Tutor2u Limited 2008 www.tutor2u.net
price. When demand is relatively elastic, the main effect of the subsidy is to increase the equilibrium quantity traded rather than lead to a much lower market price.
The Economic and Social Justifications for Subsidies Why might the government be justified in providing financial assistance to producers in certain markets and industries? How valid are the arguments for government subsidies?
(1) To control the rate of inflation and boost the real living standards of some groups of consumers – for example lower income households.
(2) To encourage the provision and consumption of merit goods and services which are said to generate positive externalities (increased social benefits). Under-consumption or provision of merit goods can lead to market failure causing a loss of social welfare.
(3) Maintain or increase the revenues (incomes) of producers during times of special difficulties in markets (consider some of the examples mentioned below).
(4) Reduce the cost of capital investment projects – which might help to stimulate economic growth by increasing long-run aggregate supply.
(5) Subsidies to smooth or slow-down the process of long term structural change/decline in an industry (for example in farming, coal, fishing and steel).
(6) Boost employment for certain groups of workers e.g. the long term unemployed. Economic Arguments against Subsidies The economic and social case for a subsidy should be judged carefully on the grounds of efficiency and also fairness (or equity). We need to be careful to measure and evaluate who gains from any particular subsidy and who pays. Might the money used up in subsidy payments be better spent elsewhere? Government subsidies inevitably carry an opportunity cost and in the long run there might be better ways of providing financial support to producers and employees in specific industries.
Price
Quantity
Demand
P1
Q1
S pre subsidy
Price
Quantity
D2
P1
Q1
S pre subsidy
S post subsidy
S post subsidy
P2
P2
The effect of a subsidy on the market price is greatest when demand is inelastic When demand is price elastic, a subsidy will have more of an effect on quantity traded

- 164 -
© Tutor2u Limited 2008 www.tutor2u.net
Free market economists argue that government subsidies distort the workings of the free market mechanism and can eventually lead to government failure where government intervention actually leads to a worse distribution of resources.
(i) Distortion of the Market: Subsidies distort market prices - this can lead to a misallocation of resources – many economists believe that the free-market mechanism works best. Export subsidies distort the free trade in goods and services and can severely curtail the ability of ELDCs to compete in the markets of industrialised countries
(ii) Arbitrary Assistance: Decisions about which groups or industries receive a subsidy can be arbitrary – if tourism is supported, why not the British steel industry?
(iii) Financial Cost: Subsidies can become expensive – note the opportunity cost!
(iv) Who pays and who benefits? The final cost of a subsidy usually falls on consumers (tax-payers) who themselves may have derived no benefit from the subsidy.
(v) Encouraging inefficiency: Subsidy can artificially protect inefficient firms who need to restructure – i.e. it delays much needed economic reforms.
(vi) Risk of Fraud: Ever-present risk of fraud when allocating subsidy payments.
(vii) There are alternatives: It may be possible to achieve the objectives of subsidies by alternative means which have less distorting effects, for example by direct income support through the tax and benefit system.
Suggestions for further reading on subsidies EU extends state help for movies (BBC news online, June 2007) What price a post office? (BBC news online, April 2007) From subsidy drunk to subsidy comatose (The Times, July 2007) Corn Dog: The ethanol subsidy is worse than you can imagine (Slate Magazine, July 2007) The rise, fall and rise of Brazil's biofuel (BBC news online, January 2006) Reforming wine subsidies in the EU (BBC news online, June 2006) Dearing calls for tuition fee cap to be lifted (Guardian, June 2007)
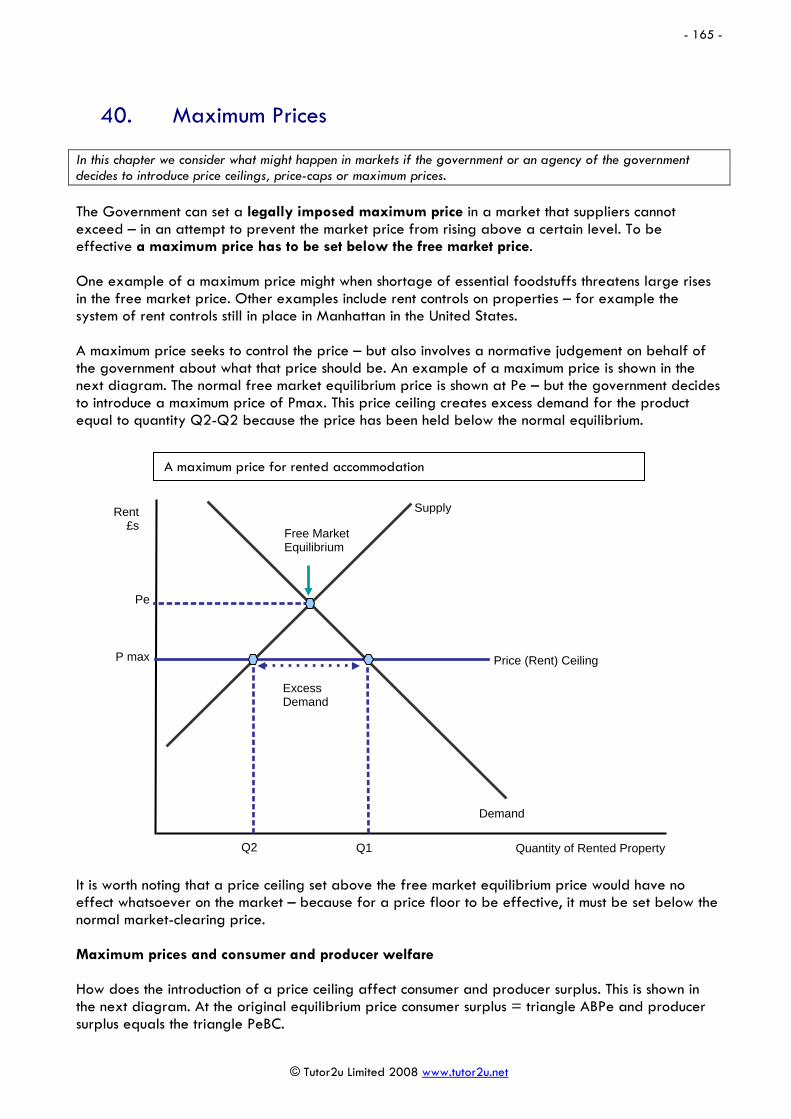
- 165 -
© Tutor2u Limited 2008 www.tutor2u.net
40. Maximum Prices In this chapter we consider what might happen in markets if the government or an agency of the government decides to introduce price ceilings, price-caps or maximum prices. The Government can set a legally imposed maximum price in a market that suppliers cannot exceed – in an attempt to prevent the market price from rising above a certain level. To be effective a maximum price has to be set below the free market price. One example of a maximum price might when shortage of essential foodstuffs threatens large rises in the free market price. Other examples include rent controls on properties – for example the system of rent controls still in place in Manhattan in the United States. A maximum price seeks to control the price – but also involves a normative judgement on behalf of the government about what that price should be. An example of a maximum price is shown in the next diagram. The normal free market equilibrium price is shown at Pe – but the government decides to introduce a maximum price of Pmax. This price ceiling creates excess demand for the product equal to quantity Q2-Q2 because the price has been held below the normal equilibrium.
It is worth noting that a price ceiling set above the free market equilibrium price would have no effect whatsoever on the market – because for a price floor to be effective, it must be set below the normal market-clearing price. Maximum prices and consumer and producer welfare How does the introduction of a price ceiling affect consumer and producer surplus. This is shown in the next diagram. At the original equilibrium price consumer surplus = triangle ABPe and producer surplus equals the triangle PeBC.
Rent £s
Quantity of Rented Property
Demand
Supply
P max
Q1
Pe
Price (Rent) Ceiling
Q2
Free Market Equilibrium
Excess Demand
A maximum price for rented accommodation

- 166 -
© Tutor2u Limited 2008 www.tutor2u.net
Because of the maximum price ceiling, the quantity supplied contracts to output Q2. Consumers gain from the price being set artificially lower than the equilibrium, but there is a loss of consumer welfare because of the reduction in the quantity traded. At P max the new level of consumer surplus = the trapezium ADEPmax. Producer surplus is reduced to a lower level Pmax EC. There has been a net reduction in economic welfare shown by the triangle DBE.
Black Markets A black market (or shadow market) is an illegal market in which the normal market price is higher than a legally imposed price ceiling (or maximum price). Black markets develop where there is excess demand (or a shortage) for a commodity. Some consumers are prepared to pay higher prices in black markets in order to get the goods or services they want. When there is a shortage, higher prices act as a rationing device.
• Good examples of black markets include tickets for major sporting events, rock concerts and black markets for children’s toys and designer products that are in scarce supply.
• Another example is the black market for the anti-impotence drug Viagra and its new rival products now coming onto the market
• There is also evidence of black markets in the illegal distribution and sale of computer software products where pirated copies can often dwarf sales of legally produced software.
Rationing when there is a market shortage Rationing when there is a maximum price might also be achieved by allocating the good on a ‘first come, first served’ basis – e.g. queues of consumers. Suppliers might also allocate the scarce goods by distributing only to preferred customers. Both of these ways of rationing goods might be
Price
Quantity
Demand
Supply
P max
Q1
Pe
Price Ceiling
Q2
Consumer surplus at the equilibrium market price
Producer surplus at the equilibrium market price
A
B
C
D
E

- 167 -
© Tutor2u Limited 2008 www.tutor2u.net
considered as inequitable (unfair) – because it is likely that eventually those who might have the greatest need for a commodity are unlikely to have their needs met. Another problem arising from the maintenance of a maximum price is that in the long run, suppliers might respond to a maximum price by reducing their supply – the supply curve becomes more elastic in the long term. This is illustrated in the next diagram
If landlords decide that they cannot make a satisfactory rate of return by selling rented properties in the market because of the maximum price, they might decide to withdraw some properties from the market. At the prevailing maximum rent, the long run supply curve shows a smaller quantity of rented properties available for tenants – which with a given level of market demand cause the excess demand (shortage) in the market to increase. The quality of rented properties might also deteriorate over time because landlords decide to cut spending on routine maintenance and property improvements. The end result would be a loss of allocative efficiency because there are fewer properties on the market and the quality of accommodation is getting worse – fewer people’s needs and wants are being met at the prevailing market price. Although maximum prices such as rent controls are still in place in many countries, in the UK, rent controls were essentially abolished in the late 1980s. And, over the last fifteen years the government has actively sought to encourage an expansion in the total supply of rented properties provided by both private sector landlords and also registered social landlords such as housing associations. The rapid growth in the buy-to-let property market has also contributed to a huge increase in the supply of properties available for letting in the majority of towns and cities in the UK. Reading on black markets Should ticket touting be illegal? (BBC news online, April 2007) Cup Final tickets sell for £2,000 (BBC news online, May 2007) Ticket touts face the music (BBC news online, April 2007)
Rent £s
Quantity of Rented Property
Demand
Supply (short run)
P max
Q1
Pe
Price (Rent) Ceiling
Q2
Free Market Equilibrium
Excess Demand (short run)
Supply (long run)
Q3
Excess Demand (long run)

- 168 -
© Tutor2u Limited 2008 www.tutor2u.net
41. Minimum Prices In the last chapter we focused on maximum prices, we now look at the economics of price floors where the government intervenes in the market so that prices cannot fall below a certain level. Definition of a minimum price A minimum price is a legally imposed price floor below which the normal market price cannot fall. To be effective the minimum price has to be set above the normal equilibrium price. Perhaps the best example of a minimum price is the minimum wage. The national minimum wage was introduced into the UK in 1999. It is an intervention in the labour market designed to increase the pay of lower-paid workers and thereby influence the distribution of income in society. The main aims of the minimum wage
1. The equity justification: That every job should offer a fair rate of pay commensurate with the skills and experience of an employee
2. Labour market incentives: The NMW is designed to improve the incentives for people to start looking for work – thereby boosting the economy’s available labour supply
3. Labour market discrimination: The NMW is a tool designed to offset some of the effects of persistent discrimination of many low-paid female workers and younger employees
Adult Rate
(for workers aged 22+) Development Rate
(for workers aged 18-21) 16-17 Year Olds Rate
1 Apr 1999 £3.60 1 Apr 1999 £3.00 - - 1 Oct 2000 £3.70 1 Oct 2000 £3.20 - - 1 Oct 2001 £4.10 1 Oct 2001 £3.50 - - 1 Oct 2002 £4.20 1 Oct 2002 £3.60 - - 1 Oct 2003 £4.50 1 Oct 2003 £3.80 - - 1 Oct 2004 £4.85 1 Oct 2004 £4.10 1 Oct 2004 £3.00 1 Oct 2005 £5.05 1 Oct 2005 £4.25 1 Oct 2005 £3.00 1 Oct 2006 £5.35 1 Oct 2006 £4.45 1 Oct 2006 To be
announced How does a minimum wage work? The minimum wage is a price floor – employers cannot legally undercut the current minimum wage rate per hour. This applies both to full-time and part-time workers. Labour supply and demand curve analysis can be used to show the effects.

- 169 -
© Tutor2u Limited 2008 www.tutor2u.net
A diagram showing the possible effects of a minimum wage is shown above. The market equilibrium wage for this particular labour market is at W1 (where demand = supply). If the minimum wage is set at Wmin, there will be an excess supply of labour equal to E3 – E2 because the supply of labour will expand (more workers will be willing and able to offer themselves for work at the higher wage than before) but there is a risk that the demand for workers from employers (businesses) will contract if the minimum wage is introduced. Possible disadvantages of a minimum wage Although all political parties are now committed to keeping the minimum wage, there are still plenty of economists who believe that setting a pay floor represents a distortion to the way the labour market works because it reduces the flexibility of the labour market
1. Competitiveness and Jobs: Firstly a minimum wage may cost jobs because a rise in labour costs makes it more expensive to employ people and higher labour costs might damage the international competitiveness of British producers. To the extent that rising unemployment worsens the living standards of those affected it has a negative impact on poverty.
2. Effect on relative poverty: Is the minimum wage the most effective policy to reduce relative
poverty? There is evidence that it tends to boost the incomes of middle-income households where more than one household member is already in work whereas the greatest risk of relative poverty is among the unemployed, elderly and single parent families where the parent is not employed.
Can a minimum wage actually increase employment? The answer is yes – depending on the circumstances in the labour market when a pay floor is introduced and also on what happens to the productivity of labour when a high (statutory) rate of pay is introduced. There are two main explanations for the possibility of higher employment
Wage Rate (W)
Employment of Labour (E) Number of people employed
Demand for Labour
Labour Supply
W min
E1
W1
Minimum Wage (Wage Floor)
E2 E3
Free-market equilibrium wage

- 170 -
© Tutor2u Limited 2008 www.tutor2u.net
1. The Keynesian argument that higher wage rates will increase the real disposable incomes of lower-paid workers many of whom have a high marginal propensity to consume. Thus they will increase their own spending and this will feed through the circular flow of income and spending
2. The efficiency wage argument that raising pay levels for low-paid employees may have a positive effect on their productivity and efficiency. In addition to the psychological benefits of being paid more, businesses may take steps to improve production processes, workplace training etc if they know that they must pay at least the statutory pay floor.
The importance of elasticity of demand and supply of labour The impact of a minimum wage on employment levels depends in part on the elasticity of demand and elasticity of supply of labour in different industries. If labour demand is relatively inelastic then the contraction in employment is likely to be less severe than if employers’ demand for labour is elastic with respect to changes in the wage level. In the next diagram we see the possible effects of a minimum wage when both labour demand and labour supply are elastic in response to a change in the market wage rate. The excess supply created is much higher than in the previous diagram.
Evidence on the minimum wage – has it worked?
1. Employment: Since the minimum wage was introduced, unemployment in Britain has continued to fall and the level of employment in the British economy is now at a record high. It should be remembered that the National Minimum Wage was introduced in a tight labour market, with employment rising and unemployment falling. The true test of a pay floor is probably when the economy experiences recession.
a. The sectors most directly affected by the minimum wage are in hospitality, leisure, textiles and social care. Even here, the employment effects are small – and they might easily be explained by changes in competition (e.g. from overseas) and from the effects of technological change on labour demand
Wage Rate (W)
Employment of Labour (E)
Demand for Labour
Labour Supply
W min
Q1
W1
Minimum Wage (Wage Floor)
Q2 Q3

- 171 -
© Tutor2u Limited 2008 www.tutor2u.net
2. Inflation: There have been negligible adverse effects on wage and price inflation. Other factors affecting inflationary pressure have been broadly favourable for the UK in recent years. In many sectors firms find it hard to pass on higher wage costs to final consumers – again limiting the inflationary effect of the minimum wage
3. Wage costs: The minimum wage affects only a small proportion of workers and the effects on the wage bills of most businesses is not a significant factor in their employment decisions. In the short term, the demand for labour tends to be inelastic with respect to changes in wages
4. Discrimination: The minimum wage has had a significant impact on the earnings of part-time female workers.
5. Productivity: It is hard to identify any strong positive effect on labour productivity - but productivity gains have been made in most low-paying industries, a trend which started before the minimum wage was introduced.
Suggestions for further research and reading on the Minimum Wage Although all of Britain’s major political parties now support the idea of a national minimum wage, the issue remains a controversial one for economists. You can find out more about the minimum wage in Britain by visiting the Department for Trade and Industry, The Trades Union Congress, the Confederation of British Industry, the Federation of Small Businesses and the Low Pay Commission. UK gets a minimum wage (BBC news audio-visual, April 1999) Living on the minimum wage (BBC news audio-visual, 2006) Migrant workers 'help UK economy' (BBC news online, June 2007) USA minimum wage rises for the first time in a decade (BBC news online, February 2007) Japan sets up minimum wage raise (BBC news online, April 2007) Deluge of complaints on minimum wage abuse (Times, April 2007)

- 172 -
© Tutor2u Limited 2008 www.tutor2u.net
42. Buffer Stock Schemes The prices of agricultural products such as wheat, tea and coffee tend to fluctuate more than the prices of manufactured products and services. This is largely due to the volatility in the market supply of agricultural products coupled with the fact that demand and supply are price inelastic. One way to smooth out the fluctuations in prices is for the government to operate price support schemes through the use of buffer stocks. But many of them have had a chequered history. Buffer stock schemes seek to stabilize the market price of agricultural products by buying up supplies of the product when harvests are plentiful and selling stocks of the product onto the market when supplies are low. The diagram below illustrates the operation of a buffer stock scheme. The government offers a guaranteed minimum price (P min) to farmers of wheat. The price floor is set above the normal free market equilibrium price. Notice that the price elasticity of supply for wheat in the short term is very low because of the length of time it takes for producers to supply new quantities of wheat to the market. (Indeed in the momentary period, we would draw the supply curve as vertical indicating a fixed supply).
If the government is to maintain the guaranteed price at P min, then it must buy up the excess supply (Q3-Q1) and put these purchases into intervention storage. Should there be a large rise in supply due to better than expected yields of wheat at harvest time, the market supply of wheat will shift out (see the diagram on the next page) – putting downward pressure on the free market equilibrium price. In this situation, the government will have to intervene once more in the market and buy up the surplus stock of wheat to prevent the price from falling. It is easy to see how if the market supply rises faster than demand then the amount of wheat bought into storage will grow. The problems with buffer stock schemes In theory buffer stock schemes should be profit making, since they buy up stocks of the product when the price is low and sell them onto the market when the price is high. However, they do not often
Price
Quantity
Demand
Supply
P min
Q1
Pe
Price Floor (Guaranteed)
Q4 Q3
S2

- 173 -
© Tutor2u Limited 2008 www.tutor2u.net
work well in practice. Clearly, perishable items cannot be stored for long periods of time and can therefore be immediately ruled out of buffer stock schemes. Setting up a buffer stock scheme also requires a significant amount of start up capital, since money is needed to buy up the product when prices are low. There are also high administrative and storage costs to be considered. The success of a buffer stock scheme however ultimately depends on the ability of those managing a scheme to correctly estimate the average price of the product over a period of time. This estimate is the scheme’s target price and obviously determines the maximum and minimum price boundaries. But if the target price is significantly above the correct average price then the organization will find itself buying more produce than it is selling and it will eventually run out of money. The price of the product will then crash as the excess stocks built up by the organization are dumped onto the market. Conversely if the target price is too low then the organization will often find the price rising above the boundary, it will end up selling more than it is buying and will eventually run out of stocks The European Union Common Agricultural Policy has come under sustained attack for many years and there have been several attempts to reform the system. Economics of Farm Support – the CAP All governments intervene in their farming markets to one degree or another. But farm subsidies are controversial – indeed many economists regard them as a prime source of government failure, acting to deepen existing market failures and cause a further loss of economic and social welfare. Distorting the global market The CAP is hugely unpopular around the world. It subsidizes European farmers to such an extent that they can undercut farmers from poor countries, who also face trade barriers that largely exclude them from the potentially lucrative European market
(Adapted from the Economist, June 2003) The Common Agricultural Policy has come under sustained criticism from many quarters including the British Government which has been a supporter of the reform process. UK Government Policy on the CAP The current CAP is not delivering what farmers, the rural economy or the environment need. It is an expensive policy and is insufficient to meet the challenges posed by the enlargement of the EU. Reform is also vital to improve the position of developing countries, who find it harder to access our markets when the EU subsidises its own production. The UK Government’s goal is to reduce the overall burden of the CAP, delivering better value for money to taxpayers
Source: Adapted from the DEFRA web site www.defra.gov.uk
The main criticisms of the CAP are as follows
1. Productive inefficiency: Generous CAP intervention prices have encouraged excess production of many farm products and permitted production inefficiencies and dependency on farm subsidies - all of which leads to a mis-allocation of scarce resources. Much of the price support goes to farmers who need it least. Because most support is production-based, the bulk of it goes to the larger, often richer, farms able to exploit economies of scale
2. Loss of allocative efficiency and consumer welfare: The CAP is seen by much of the public as failing to deliver what society wants and needs from agriculture in terms of food safety, animal health and rural environment. It is neither consistent with policies on sustainable development, nor with consumer demands for high quality, local and regional foods. And

- 174 -
© Tutor2u Limited 2008 www.tutor2u.net
consumers have ended up paying twice for their food!– once in higher taxes to fund farm support and secondly in higher prices of imported foods because of the tariff levied by the EU on many foodstuffs entering the European Union
3. Fiscal costs: The financial cost of EU farm support policies has been huge and involves a large opportunity cost – that money might well have been spent on more socially useful programmes over the years
4. Loss of equity: Farm support imposes higher food prices for EU consumers and the cost hits poorer families most because they spend a higher proportion of their income on food implying a regressive effect on the distribution of income
5. Environmental concerns: The CAP has encouraged intensive farming which is prompting concern about the environmental impact of CAP. One recent study of olive growers showed they used more than 400 times the recommended level of pesticides – and more generally the trend towards intensive farming is seen as imposing significant external costs on the European economy
6. Global market distortions – a barrier to international trade: The CAP is seen by many critics as anti-competitive and distorts international markets threatening the development of many lower-income countries. The EU spent £2.14 billion on export subsidies in 2001. The CAP is a cause of tension between the EU and the rest of the world in global trade negotiations
Reforming the Common Agricultural Policy For several years now farm ministers have been negotiating reforms of the Common Agricultural Policy. The main elements of the reforms are as follows:
1. Replacing price support with a single annual income payment for farmers: farm payments will no longer be linked to the amount produced (this is known as “de-coupling”). Initially the new system will apply mainly to arable farm production and will be extended to beef and sheep sectors from 2008. If the reforms are implemented in full – 90% of CAP payments will no longer be linked to production
2. Linking farm incomes to protection and improvement of the environment: Farmers must meet clear rules on the environmental impact of their farming, food safety and animal welfare and plant health to qualify for the annual income payments. In this sense the CAP will reward farmers who treat their environment as a public good with positive externalities for those people who enjoy our rural heritage
3. Cutting payments to the largest farms: CAP aid payments to larger farms of more than euro 5,000 per year will be cut and the proceeds used to encourage rural development
4. Reductions in guaranteed minimum prices: The intervention price for butter is being cut by 25% over 4 years. There is a 15% cut in intervention prices for skimmed milk powder and a freeze on prices for cereals. You can easily show the effects of a reduction in guaranteed prices using supply and demand diagrams
5. Extra funds for rural development to promote new employment in farming areas: The EU rural development fund currently worth around euros 5 billion per year will be given an extra euro 1.2 billion a year – partly this is to improve employment opportunities for young people living in farming areas and to reduce the risk of increased structural unemployment
Will these reforms work? Some of the main issues to consider are as follows:
1. The future of smaller-scale farming: Will reductions in direct payments for production stimulate increases in farm productivity due to a switch to larger-scale production?
- 175 -
© Tutor2u Limited 2008 www.tutor2u.net
2. Dynamic efficiency gains? Will reforms to the CAP stimulate improvements in the dynamic efficiency of the UK and European farming industry? Supporters of reform believe that cutting dependency on financial support will encourage farmers to diversify the use of their land including breaking into rural tourism and focusing resources on supplying niche products to local markets / farmers’ markets
3. Risks of unemployment: Will there be sufficient geographical and occupational mobility in the farming industry to cope with falling price support? The main risk is a sharp rise in structural unemployment and associated problems of rural poverty arising from occupational immobility of labour
4. Will food prices fall? Textbook analysis would suggest that reducing import tariffs for food coming into the UK and reducing farm support prices should lead to an increase in non-EU food supplies into the EU and lower food prices in real terms. Will food manufacturers pass cost savings onto retailers who then pass them on to consumers?
- 176 -
© Tutor2u Limited 2008 www.tutor2u.net
43. Government Failure A failure of the free market and the price mechanism to deliver an allocatively efficient allocation of scarce resources is normally regarded as justification for some form of government intervention in the economy. This intervention is designed to correct for instances of market failure and achieve an improvement in economic and social welfare. But what if intervention leads to further inefficiencies? What if government policies prove to be costly to implement but ineffective in achieving their desired outcomes? What happens if intervention distorts markets still further leading to a further loss of allocative efficiency? What is Government Failure? Even with good intentions governments seldom get their policy application correct. They can tax, control and regulate but the eventual outcome may be a deepening of the market failure or even worse a new failure may arise. Government failure may range from the trivial, when intervention is merely ineffective, but where harm is restricted to the cost of resources used up and wasted by the intervention, to cases where intervention produces new and more serious problems that did not exist before. The consequences of this can take many years to reverse. Government failure in a non-market economy The collapse of the Soviet Union in the late 1980s marked the failure of command or state-run economies as a means of allocating resources among competing uses. The essence of a command economy was that the state planning mechanism would decide what to produce and how to produce it and for whom to produce. Government failure occurred when the central planners produced products that were not wanted by consumers – a loss of allocative efficiency, since there was no price mechanism to signal changes in consumer preferences and demand. Another fundamental failing of the pure command economy was that there was little incentive for workers to raise productivity; poor quality control; and little innovation by firms as no profit motive existed. Command economies also suffered massive environmental de-gradation because they did not posses structures for valuing the environment and giving consumers and producers the right incentives to protect their environmental heritage. All of these economies are now moving towards the western mixed economy, though at varying speeds and with varying success. Ten countries became new members of the European Union in May 2004, some of them former state-run economies in the Eastern Block. Countries such as Hungary, the Czech Republic and Poland are all moving towards a market based system for the allocation of resources through privatisation and market liberalisation. Causes of Government Failure Government intervention can prove to be ineffective, inequitable and misplaced. (a) Political self-interest The pursuit of self-interest amongst politicians and civil servants can often lead to a misallocation of resources. For example decisions about where to build new roads, by-passes, schools and hospitals may be decided with at least one eye to the political consequences. The pressures of a looming election or the influence exerted by special interest groups can foster an environment in which inappropriate spending and tax decisions are made. - e.g. boosting welfare spending in the run up to an election, or bringing forward major items of capital spending on infrastructural projects without the projects being subjected to a full and proper cost-benefit
- 177 -
© Tutor2u Limited 2008 www.tutor2u.net
analysis to determine the likely social costs and benefits. Critics of current government policy towards tobacco taxation and advertising, and the controversial issue of genetically modified foods argue that government departments are too sensitive to political lobbying from the major corporations. (b) Policy myopia Critics of government intervention in the economy argue that politicians have a tendency to look for short term solutions or “quick fixes” to difficult economic problems rather than making considered analysis of long term considerations. Two recent examples come to mind. Firstly, the view that building more roads and widening existing roads and motorways is the most effective strategy to combat the worsening problem of traffic congestion. A decision to build more roads and by-passes might simply add to the problems of traffic congestion in the long run encouraging an increase in the total number of cars on the roads. The Commission for Integrated Transport has criticised the Government for a failure to develop a properly integrated transport policy. They clearly believe that government failure is endemic in our transport industry – although we should remember that their view is normative, based on value judgements! Secondly criticisms of the huge increases in state spending on the National Health Service. Government critics argue that much of the extra spending is being “lost” in higher pay and administration rather than finding its way into improving front-line health services. The risk is that myopic decision-making will only provide short term relief to particular problems but does little to address structural economic problems. Critics of government subsidies to particular industries also claim that they distort the proper functioning of markets and lead to inefficiencies in the economy. For example short term financial support to coal producers to keep open loss-making coal pits might prove to be a waste of scarce resources if the industry concerned has little realistic prospect of achieving a viable economic rate of return in the long run given the strength of global competition. (c) Regulatory capture. This is when the industries under the control of a regulatory body (i.e. a government agency) appear to operate in favour of the vested interest of producers rather can consumers. Some economists argue that regulators can prevent the ability of the market to operate freely. We might find examples of this in agriculture, telecommunications, the main household utilities and in transport regulation. For example, to what extent has the system of agricultural support known as the Common Agricultural Policy operated too much in the interests of farmers and the farming industry in general? And as a result, has the CAP worked against the long-term interest of consumers, the environment and developing countries who claim that they are being unfairly treated in world markets by the effects of import tariffs on food and export subsidies to loss-making European farmers? (d) Government intervention and disincentive effects Free market economists who fear government failure at every turn argue that attempts to reduce income and wealth inequalities can worsen incentives and productivity. They would argue against the National Minimum Wage because they believe that it artificially raises wages above their true free-market level and can lead to real-wage unemployment. They would argue against raising the

- 178 -
© Tutor2u Limited 2008 www.tutor2u.net
higher rates of income tax because it is deemed to have a negative effect on the incentives of wealth-creators in the economy and generally acts as a disincentive to work longer hours or take a better paid job. (e) Government intervention and evasion A decision by the government to raise taxes on de-merit goods such as cigarettes might lead to an increase in attempted tax avoidance, tax evasion, smuggling and the development of grey markets where trade takes place between consumers and suppliers without paying tax. Equally a decision to legalize and then tax some drugs might lead to a rapid expansion of the supply of drugs and a substantial loss of social welfare arising from over consumption. (f) Policy decisions based on imperfect information How does the government establish what citizens want it to do in their name? Can the government ever really know the true revealed preferences of so many people? Our current electoral system is not an ideal way to discover this! Turnout in every type of election, (local, national, European etc) is falling, there is general disinterest in the political process. Furthermore, people rarely vote purely out of their own self-interest or on the basis of a well informed and rational assessment of the costs and benefits of different government policies. Proponents of government failure argue that the free market mechanism is, in the long-run, the best way of finding out
(a) What consumer preferences are and
(b) Aggregating these preferences based on the number of people that are willing and able to pay for particular goods and services.
Often a government will choose to go ahead with a project or policy without having the full amount of information required for a proper cost-benefit analysis. The result can be misguided policies and damaging long-term consequences. How does the government know how many extra houses need to be built in the UK over the next twenty years? Is building thousands of extra homes in an already congested South-east the right option? Are there better solutions? But ones that politically may not be feasible. There have been plenty of instances of government housing policy having failed in previous decades! (g) The Law of Unintended Consequences! The law of unintended consequences is that actions of consumer and producers — and especially of government—always have effects that are unanticipated or "unintended." Particularly when people do not always act in the way that the economics textbooks would predict – this is of course the essence of a social, behaviour science – we do not live our lives in sanitised laboratories where all of the conditions can be controlled. The law of unintended consequences is often used to criticise the effects of government legislation, taxation and regulation. People find ways to circumvent laws; shadow markets develop to undermine an official policy; people act in unexpected ways because or ignorance and / or error. Unintended consequences can add hugely to the financial costs of some government programmes so that they make them extremely expensive when set against their original goals and objectives. Steel tariffs – a self-inflicted wound for the USA? A report from the US International Trade Commission found that the 30% steel tariffs imposed by the US in an attempt to save jobs merely increased unemployment among car workers. The ITC's report found that although there have been some gains for steel producing areas, overall the effect on the US economy had been a loss

- 179 -
© Tutor2u Limited 2008 www.tutor2u.net
to GDP of $30m (£18m). And steel tariffs failed to prevent further reductions in employment in the steel industry. The number of U.S. workers employed by manufacturers of basic steel products and in blast furnaces and steel mills declined by 17 percent and 19 percent, respectively, from 1999 through 2002 and again in 2003. Car manufacturers in the USA were opposed to the increased costs of their steel inputs which led them to have to source their steel from more expensive domestic (US) suppliers. 20,000 and 40,000 car job losses were attributed to the steel tariff. The World Trade Organisation (WTC) ruled in July 2003 that the US steel tariffs broke international trade rules – eventually the Bush administration backed down and repealed them. (h) Costs of administration and enforcement Government intervention can prove costly to administer and enforce. The estimated social benefits of a particular policy might be largely swamped by the administrative costs of introducing it. Carbon trading and government failure Coal production is on the increase in the UK and around Europe. But this is the sort of thing that isn't supposed to be happening! Even with the potential for clean coal technology, it is widely regarded as a dirty source of energy and a major contributor to C02 emissions. Why are the power stations turning back to coal? Because the price of carbon emissions is low and coal has become price competitive against oil and gas. The carbon trading scheme started in January 2005 with carbon allowances being bought and sold. The largest C02 emitters were brought into the cap and trade system. The cap places a limit on the total pot of emissions that can be released by industry - the aim is to progressively reduce this cap over time and therefore mitigate climate change. The original caps set by the EU are now seen as being set way too high and some people believe that this was not an accident, companies and businesses may have been deliberately given more allowances than they needed, creating surplus permits that could be profitably sold onto to other businesses. Carbon Trade Watch believe that the EU has been captured by strong corporate lobbying who themselves knowingly over-estimated their "business as usual" C02 emissions when they submitted them to national governments ahead of the launch of the carbon trading scheme. The surplus of C02 emission allowances has meant that scarcity in the market has disappeared leading to a collapse in the price of carbon - prices now are between 20-30 Euro cents, effectively the price of polluting is close to zero. The market thus provides little incentive for businesses to invest money in reducing their emissions. For firms with plenty of surplus C02 emissions (given away free of charge in the first place!) there has been a huge windfall gain. "Polluter pays" seems to have been replaced with "polluter earns"! The major power generators have been given a free block of pollution rights which they can then sell onto the market and make a profit. DEFRA, the UK environment agency has estimated that the windfall profits for the electricity generators in the UK might have been as high as £1.5bn. One criticism of the EU carbon trading scheme is that the EU allocated initial allowances free rather than using a market-based auction system. As coal production expands, so C02 emissions are rising, and the power stations have to buy extra emissions credits, but the price of credits is low so the consequences for the power generators are not significant. Emissions from coal fired power stations in the UK in 2006 alone increased by 8%! Consumers are paying the price of higher energy bills but they are not getting the environmental pay off in terms of reducing carbon production as a contribution to controlling climate change. Reading: Carbon Trade Watch: http://www.carbontradewatch.org/ Radio 4 File on Four: http://news.bbc.co.uk/1/hi/programmes/file_on_4/6720119.stm Energy heads back carbon market
- 180 -
© Tutor2u Limited 2008 www.tutor2u.net
Key points about government failure
1. Free market economists are naturally distrustful of government intervention in the economy. They believe that the signalling, incentive and rationing functions of the price mechanism should be given more freedom to operate
2. When government failure exists, the result can be a deepening of an existing market failure. The result is a further loss of allocative and productive efficiency because of the waste of scarce resources – leading to a reduction in consumer and producer welfare
3. Often we can accuse the government of policy failure only with the benefit of hindsight
4. Limited information - no government has the resources and information available to it to make fully-informed, objective judgements. That is the nature of politics.
5. Government failure is most likely to occur when decisions are made in the vested interest of special interest groups, at the expense of other groups (the result is a loss of equity)
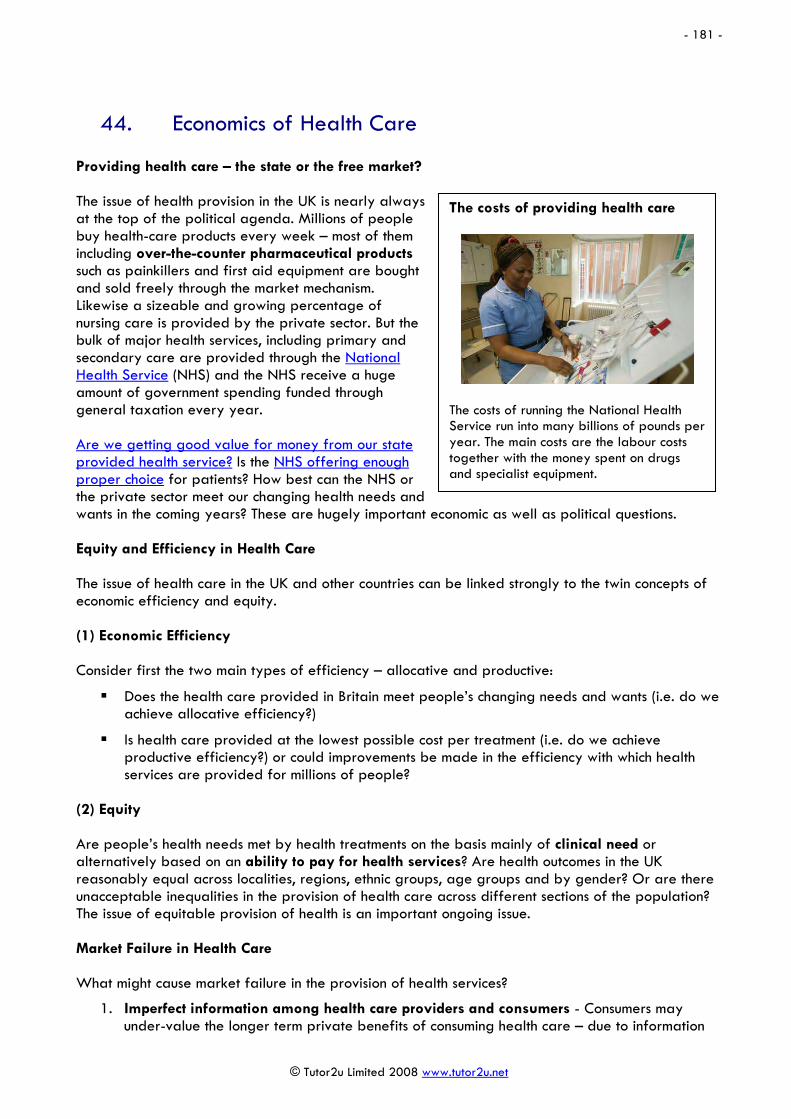
- 181 -
© Tutor2u Limited 2008 www.tutor2u.net
44. Economics of Health Care Providing health care – the state or the free market? The issue of health provision in the UK is nearly always at the top of the political agenda. Millions of people buy health-care products every week – most of them including over-the-counter pharmaceutical products such as painkillers and first aid equipment are bought and sold freely through the market mechanism. Likewise a sizeable and growing percentage of nursing care is provided by the private sector. But the bulk of major health services, including primary and secondary care are provided through the National Health Service (NHS) and the NHS receive a huge amount of government spending funded through general taxation every year. Are we getting good value for money from our state provided health service? Is the NHS offering enough proper choice for patients? How best can the NHS or the private sector meet our changing health needs and wants in the coming years? These are hugely important economic as well as political questions. Equity and Efficiency in Health Care The issue of health care in the UK and other countries can be linked strongly to the twin concepts of economic efficiency and equity. (1) Economic Efficiency Consider first the two main types of efficiency – allocative and productive:
Does the health care provided in Britain meet people’s changing needs and wants (i.e. do we achieve allocative efficiency?)
Is health care provided at the lowest possible cost per treatment (i.e. do we achieve productive efficiency?) or could improvements be made in the efficiency with which health services are provided for millions of people?
(2) Equity Are people’s health needs met by health treatments on the basis mainly of clinical need or alternatively based on an ability to pay for health services? Are health outcomes in the UK reasonably equal across localities, regions, ethnic groups, age groups and by gender? Or are there unacceptable inequalities in the provision of health care across different sections of the population? The issue of equitable provision of health is an important ongoing issue. Market Failure in Health Care What might cause market failure in the provision of health services?
1. Imperfect information among health care providers and consumers - Consumers may under-value the longer term private benefits of consuming health care – due to information
The costs of providing health care
The costs of running the National Health Service run into many billions of pounds per year. The main costs are the labour costs together with the money spent on drugs and specialist equipment.

- 182 -
© Tutor2u Limited 2008 www.tutor2u.net
failure (or ‘patient ignorance’). Health providers such as doctors and consultants have more specialised information than consumers – an example here of asymmetric information.
2. Lack of adequate health insurance: A second cause of information failure is that it is virtually impossible for people to predict their future health needs. Sudden illness or injury may require extensive and expensive medical care for which most people are unlikely to have adequate health care insurance. Indeed the private health insurance market will not provide cover for all groups of people. High-risk individuals may find it impossible or extremely expensive to get appropriate medical insurance if the market was the only provider of health care. The ‘failure’ of health insurance companies to provide cover for high risk groups is an example of ‘missing markets’ – another cause of market failure
3. Externalities arising from health care provision: Health services are normally assumed to be merit goods providing a private benefit for people who consume them and additional external benefits for society as a whole.
4. Inequalities in access to basic health care: There are regional and local differences in the quality and quantity of health care available (media stories are fond of discussing so-called “postcode prescribing”). Millions of people are wholly dependent on the NHS for health care– they have no hope of being able to fund private health insurance. If people were required to pay for more treatments they would often be unable to afford them
5. Monopoly power among health care suppliers: if there was a wholly free market in providing health care, it is likely that in the long run, several dominant health care providers would emerge raising concerns about increasing market concentration and the opportunities for these firms to exploit their monopoly power.
The fundamental policy question regarding health care in the UK is this: Should it remain essentially funded by the tax system and provided mainly free at the point of need? In the United States, which remains the world’s largest spender on health care, state provided and state-financed health care goes mainly to the old and families on low incomes. Most American workers are insured privately through the health insurance schemes run by their employers. But this does not stop many millions of Americans being unable to afford their own health care insurance – this has become a huge political issue in the United States. There are also huge worries among US companies about the soaring cost of employer-funded health benefit schemes. In rich developed countries, health care spending on average takes up nearly ten per cent of national income (GDP) and the projections for the years ahead see that figure continuing to rise. The NHS will always face the problem of resource scarcity because our ever-growing demand for different types of health care exceeds the available supply. The Labour government is committed to significant increases in real spending on health + share of health in total GDP. NHS Spending Until recently, the UK has been one of the lowest spenders on health care among the major industrialised countries. But the Labour government’s spending programme has catapulted health care spending to new levels. Spending on the NHS is forecast to rise by seven per cent per year in real terms until 2008. At which point, health care spending will have risen to 9.4% of GDP compared with 6.9% in 1998. Fundamental Principles of the National Health Service The main aim of the NHS is to provide a comprehensive, high quality service available on the basis of clinical need and not ability to pay. The Fundamental building blocks of the NHS are as follows:

- 183 -
© Tutor2u Limited 2008 www.tutor2u.net
• Providing a national universal (comprehensive) service
• Health care free at the point of use
• Medical care is not based on ability to pay but rather on the basis of clinical need
Who should pay for the drugs dispensed by the National Health Service?
The Economic and Social Importance of Health Care
• Quality of Life and Poverty: Health and well-being in childhood affect educational attainment with consequences for people throughout their lives. Ill health in adulthood is associated with poverty and long periods out of work. There is now solid evidence that improvements in medical care pay off in the long term in terms of healthier and longer lives. There are welfare gains from improvements both in life expectancy and also the quality of life that comes from a better overall standard of public health.
• Employment: The NHS is the largest employer in UK with over 1.3 million people employed in the NHS in England alone. After social security payments, health is the biggest single component of government expenditure. 15 per cent of tax and National Insurance Contributions (NICs) go to pay for the health service.
• Productivity: The health service also affects the productivity of business with almost half of all NHS spending allocated to people of working age. Ill health imposes a restriction on the productive potential of the economy. Around 2 per cent of working days each year are lost due to short-term sickness, while more than 7 per cent of the working age population is unable to work due to long-term sickness or disability costing over £12 billion a year in welfare benefits. Workplace absence is estimated to have cost British business over £10 billion in 1999 and this figure has surely risen in the years since
• Higher GDP/Economic Growth and Standard of Living: If average life expectancy could be increased by five years (i.e. to Japanese levels) then UK real GDP could be between £3 billion and £5 billion a year higher.
Fundamental Problems Facing the NHS Rarely a day goes by without a health story featuring in the newspapers. The NHS faces many challenges – these are four of the main ones:
(1) Persistent resource crises: Resource problems are the inevitable consequence of under-funding and under-investment in the health service over many years – affecting the quality and quantity of the capital stock available to health providers

- 184 -
© Tutor2u Limited 2008 www.tutor2u.net
(2) Hospital waiting lists: There are persistent delays in people receiving appointments to see consultants and delays in receiving emergency treatment
(3) Problems in recruiting sufficient well qualified staff which leads to long hours for NHS staff and contributes to wide disparities in the quality of care and range of care from region to region and between local health authorities.
(4) Meeting the growing demand for health care: There are growing doubts as to whether the NHS is meeting changing consumer preferences and growing health needs
Health Care Rationing – An Inevitable Process Health rationing occurs because demand for health care always outweighs supply. In a free market, markets match supply and demand by altering price. This form of rationing relies on the simply fact that post-tax incomes are unequal and that those households on relatively low incomes will be the first to be priced out of the market. Rationing in the NHS is inevitable - no amount of resources from the Government funded by taxation could possibly meet all of our demands for health care when the NHS system remains based on the fundamental principle of most health services being free at the point of need. In the diagram below, even if the government invests higher levels of money into the NHS system permitting an outward shift in the PPF for health care services, there is still an issue of scarcity to resolve even though the total “output” of the NHS can rise as a result.
The NHS currently rations health resources in a variety of ways
(1) Government rationing: Ministers and Parliament decide on the overall size of the NHS budget thus dictating the type and volume of care the NHS can provide
(2) The National Institute for Clinical Excellence (NICE) contributes to rationing decisions by advising the NHS on clinical and economic benefits and costs of certain health care interventions
(3) Health authorities and primary care groups allocate money to particular disease/treatment areas. Treatment decisions for individuals are made at the clinical level by health care professionals
Heart Operations
All Other Operations
An increase in resources available for the NHS or an increase in health service productivity increases the potential to provide health services. But opportunity cost is still relevant and scarcity still exists
A
B
C

- 185 -
© Tutor2u Limited 2008 www.tutor2u.net
Key Factors Putting Increased Financial Pressures on the NHS
(1) Developments in medical technology and new treatments: The fruits of research and development in health sciences has brought us many new medical procedures (such as transplants); new treatments and new products (e.g. magnetic-resonance imaging scanners)
(2) New drugs including drugs that reduce the “risk” of disease rather than the symptoms of illness – e.g. statins to lower cholesterol or anti-hypertensives to reduce the likelihood of strokes. Pharmaceutical spending is now 13% of total spending on health care in the UK. The costs of bringing a new drug to market are truly enormous. One study has found that, taking into account failed products, it now costs up to $900 million to develop a new prescription drug. The costs of drugs tends to fall in the long term as expensive new drugs protected by patent property rights are replaced by the emergence of generic drugs once this protection is lifted. But this process can take many years.
(3) The increased costs of staffing in the NHS -the NHS is a highly labour intensive industry. The costs of pay and other employment costs can take up to sixty per cent of the operating expenses of a hospital.
(4) Growing health problems including increased incidence of diseases associated with affluence and the health issues following an increase in relative poverty – for example the costs of treating smoking related diseases and the costs of treating illness associated with rising levels of obesity
(5) Long term change in age structure of the population - The cost of health care rises dramatically for older patients and the UK population along with that of many other countries is becoming older as average life expectancy continues to grow
(6) Increasing expectations of patients and their families – in part the result of politicians promising to achieve improved health outcomes from extra funding
Demographic Change and the NHS The UK population is ageing. The medical conditions that account for the majority of the burden of disease in the UK are primarily related to old age – e.g. cancer and coronary heart disease. Spending on health varies significantly with age. The beginning and end of life are the most expensive. On average, around a quarter of all the health care someone consumes in their lifetime is consumed in the last year of their life. Just over a third of all spending on hospital and community health services is for people who are over the age of 65. Over the next 20 years, the UK population is projected to increase by around 5 million. Main Funding Options for Health Care On average across the leading rich developed countries, the government accounts for nearly three-quarters of health care expenditure. The lowest share is in the United States where state funding represents less than fifty per cent of total health spending. In Canada, Britain and Sweden, the health service is funded mainly through general taxation. In Germany and France the system is funded largely from compulsory contributions made by employers and workers and from voluntary private insurance. In most countries, health care is provided by the mixed economy. Doctors are usually self employed or in private practice. The government sector is most heavily involved in operating hospitals. Although in Britain, the government is now committed to giving hospitals much greater autonomy in running their own affairs and in contracting out some health care to the private sector through its foundation hospital system

- 186 -
© Tutor2u Limited 2008 www.tutor2u.net
The Case for Maintaining a Tax Funded Health Care System The Government is committed to maintaining a National Health Service funded mainly through general taxation. In the March 2002 Budget, Chancellor Brown announced huge increases in real spending on health financed in part by a rise in National Insurance Contributions from 10% to 11% (effectively an increase in direct taxation). Justifications for having a state funded National health Service
1. The NHS can exploit huge economies of scale and therefore provide health services for millions of people at an efficient cost – these scale economies include the benefits of specialization and significant buying power in the purchasing of drugs from pharmaceutical companies
2. Revenue to fund the NHS is drawn from a millions of taxpayers who pay mainly through a progressive system of direct taxation- satisfying the principle of vertical equity. Higher income taxpayers are therefore paying more towards the general provision of health care – the NHS is a means towards greater equality of opportunity within society
3. Basing health care treatments on being able to pay might discourage people from seeking important treatments
Case for using the market mechanism / charging for some forms of health care What are the arguments for extending the market mechanism to providing health care in the UK?
1. With user charges, households would freely choose their own pattern of consumption and the supply of health care would then adjust to the pattern of preferences and level of demand for different treatments
2. Some economists believe that the price mechanism is a better way of rationing health care than the current arbitrary system of queuing / waiting lists
3. The demand for health treatments would be linked to the private benefit to the patient – so a wider system of charging / private sector provision would lead to a lower demand for non-essential treatments and free up resources for more urgent treatments
4. Some user charges already exist within the NHS such as those for dental treatment, eye examinations and prescriptions – the principle of user charges could be extended without challenging the fundamental principles upon which the NHS is based

- 187 -
© Tutor2u Limited 2008 www.tutor2u.net
45. Exam Technique The economics exam tests four types of assessment objectives, knowledge, and application of knowledge, analysis and evaluation:
• Knowledge: Level 1 tests your knowledge of the syllabus and your ability to express that knowledge e.g. there are two main methods of measuring unemployment and different ways of measuring the rate of inflation using the Retail Price Index
• Application: Level 2 test your ability to apply your economics knowledge and understanding to particular problems and issues. The skill of application requires you to select relevant information from the data source that is used in a question and then to use the selected information as a stimulus or as evidence in the answer
• Analysis: Level 3 tests your ability to use economic theories and concepts to analyse microeconomic and macroeconomic problems e.g. use aggregate demand & aggregate supply to show rising unemployment caused by a negative output gap. Analysis is an important skill both at AS level and even more so at A2 level. The command word explain usually requires that some analysis is provided in the answer – usually in the form of a specific problem or policy. Explanation may require explaining the causes or the consequences of a problem or policy
• Evaluation: Level 4 tests your ability to evaluate problems and government policies and make informed judgements based on theory and evidence e.g. short term and long term implications. Evaluation must be based on appropriate analysis for L4 marks to be awarded. We will say much more about evaluation further on in this revision guide!
Knowledge & Application of Knowledge Analyse Economic Problems and Issues
Calculate Work out using the information provided (calculators can and should be used in the exam e.g. when manipulating the data provided in charts and tables)
Analyse Set out the main points
Explain a theoretical relationship
Diagrams are nearly always required for analysis
Define Give the exact and precise meaning
Apply Use the data provided in a specific way
Describe Give a description of Compare Give similarities and differences
Give (an account of)
As `describe' Consider Give your thoughts about
Give (an example of)
Give a particular example (drawn from real world markets. Industries and economies)
Explain (why)
Explain (using the concept of)
Give clear reasons or make clear
In this question you must use the concept in the question
How (explain how)
In what way or in what ways Justify/account for Give reasons for
Identify Point out
Illustrate Give examples/diagram
Evaluate Economic Arguments and Evidence
Outline Describe without detail Assess Show how important something is
State Make clear Criticise Give an opinion or set of opinions - but support it (them) with relevant evidence
Summarise Give main points, without detail Discuss Give the arguments, for and against
Which Give a clear example/state what
Evaluate Discuss the importance of, making some attempt to weight your opinions
To what extent Make a judgement, come to a reasoned conclusion at the end