Embed Size (px)
Citation preview
CONTENTS
ABOUT THIS BOOK - Please read!
SECTION 1: MICROECONOMICS
Scarcity
Markets
Demand
Supply
Equilibrium: the Interaction of Demand and Supply
Market Efficiency
Elasticities of Demand and Supply
Price Elasticity of Demand
Cross Price Elasticity of Demand
Income Elasticity of Demand
Price Elasticity of Supply
Government Intervention
Maximum and Minimum Prices
Indirect Taxation
Subsidies
Market Structures
Aims and Objectives of Firms
Production and Costs
Revenue
Profit
Perfect Competition
Monopoly
Monopolistic Competition
Oligopoly
Price Discrimination
Market Failure and Government Response
Externalities
Negative Externalities
Positive Externalities
Public Goods
Merit and Demerit Goods
Monopoly Power
Common Access Resources and Sustainability
Asymmetric Information
Microeconomics Sample Questions
SECTION 2: MACROECONOMICS
Measuring National Income
Circular Flow of Income
Business Cycle Model
Macroeconomic Models
Aggregate Demand and Supply Analysis
The Keynesian/Monetarist Debate
The Multiplier
Demand-side Policies
Supply-side Policies
Unemployment and Inflation
Unemployment
Inflation
ECONOMIC GROWTH
DISTRIBUTION OF INCOME
Macroeconomics Sample Questions
SECTION 3: INTERNATIONAL ECONOMICS
Reasons for Trade
Terms of Trade
Free Trade/Protectionism
Economic Integration
Exchange Rates
Balance of Payments
Correcting a Current Account Deficit
International Trade and Exchange Rate Sample Questions
SECTION 4: DEVELOPMENT ECONOMICS
Introduction to Development
Measuring Development
Domestic Factors
International Trade
Foreign Direct Investment
Aid and Multilateral Assistance
International Debt
Markets vs. Intervention
Development Economics Sample Questions
REVISION ADVICE
Assessment Objectives (AOs)
Higher Level Assessment
Essay Technique
Model Markschemes
Data Response Technique
Model Markschemes

ABOUT THIS BOOK - PLEASE READ!
This is not a textbook. By the time you read this, you should already have covered the whole syllabus
and have attempted some examination-style questions. This guide will give you a solid outline of all
the material in the Higher Economics Syllabus, but it should be used in conjunction with your
experiences in class, your own notes, your textbooks, and past papers.
In this guide the emphasis is on subject knowledge, the structure of that knowledge, and how to
answer examination questions. The final exam is not only a test of knowledge, but also a test of how
you use economic theories and concepts to solve economic questions and problems. A good
candidate will therefore see the contents of this book more as a toolkit with which they can
successfully tackle the questions with which they are faced and maximise their exam mark. At the end
of each section there are sample IB-style questions for you to put this approach into practice. The
model markschemes for these questions are in the final section of the guide so that you can attempt the
questions as you progress through each section and then check your efforts by turning to the back of
the guide. All successful candidates will have attempted as many past papers and examination-style
questions as possible. It is the most efficient and effective way to test the knowledge you are
consolidating in your revision programme.
Key terms are printed in bold type and definitions are signalled by italicised type.
This guide contains a considerable number of diagrams, and I make no apologies for this! Whilst I
might have had to be economical with the explanation of some ideas, diagrams could not be
sacrificed. They are central to all aspects of the examination. You will be asked questions about
diagrams, and any good candidate will be expected to use diagrams to illustrate their work.
Each page is printed with a wide margin. As I go through each area of the syllabus I have highlighted
key exam skills and hints relevant to that particular area in this margin. Although the numerical
questions in the Higher Level Paper 3 are covered in a separate Guide, I will
indicate the numerical skills needed for each section of the syllabus.
.
SECTION 1: MICROECONOMICS
SCARCITY
The basic economic problem is scarcity. But, to be more accurate, the problem is finite resources
(land, labour, capital and enterprise) in relation to infinite wants. Because these resources are finite,
individual consumers, firms and governments constantly have to make choices between having one
thing, and not having another. These choices can be focused down into three questions.
What to produce?
How to produce?
For whom to produce?
All economies, whether tending to command or to free market, exist as an attempted solution to these
three questions. All economies, including developed and less economically developed, face the same
problem, and therefore the same questions. For example, developed economies might face the choice between
more nuclear weapons or more healthcare, whereas a less economically developed country
(ELDC) might face a choice between clean water and basic vaccination programmes.
Factors of Production are the scarce resources that an economy has at its disposal to produce
goods and services.
It is important that you understand that the act of investment involves the buying of capital goods and has nothing to do with money.
Land represents natural resources
Labour is the human resource
Capital is goods that are used to produce other goods, and requires an economy to forgo
current consumption
Enterprise, also a human resource, organises the three other factors to produce goods and
services. The reward for this risky activity is profit
Allocation of these resources can be organised through several different Economic Systems. In the
end, all economies are mixed, although some will tend towards free market (eg. UK, USA), and
others will tend towards centrally-planned or command (North Korea, Cuba).Traditional systems
still exist in many of the poorest LDCs, and involve actions such as barter, gift and communal
activities.
Opportunity Cost is the cost of the next best thing forgone. As long as economic resources are used
in the production of a good or service, a cost is involved, even if a price is not.
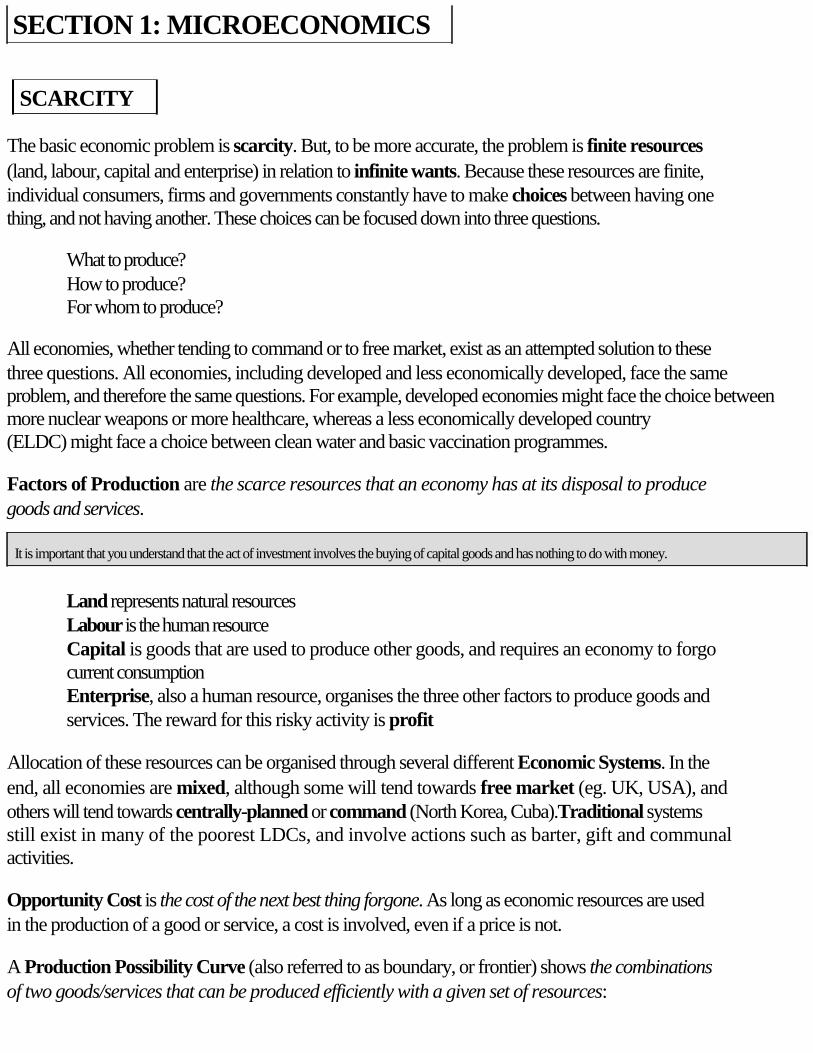
A Production Possibility Curve (also referred to as boundary, or frontier) shows the combinations
of two goods/services that can be produced efficiently with a given set of resources:
You will normally see a curved PPC, because as more consumer goods are produced, more capital
goods have to be given up in order to produce each marginal unit of consumer goods. As we shall see
later on, this is due to the law of diminishing returns.
Any combination of goods produced within the PPC (A) means that there are unemployed resources.
Points on the PPC (B) represent different bundles of goods, but with fully employed resources. Points
beyond the PPC (C) are currently unattainable. In order to attain these points, an economy would have
to increase the number of resources, increase the productivity (efficiency) of its current resources, or
improve technology. For example, Brazil discovers offshore oil, a developed economy invests in its
human capital, and car factories become robotised.
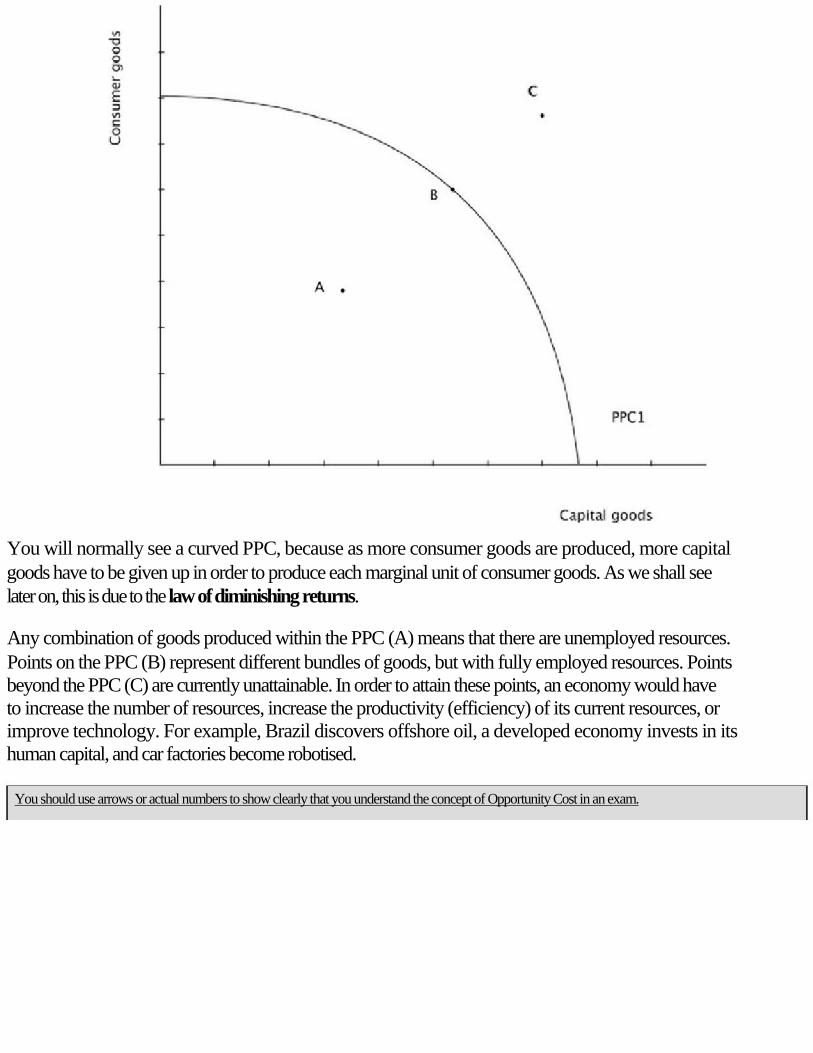
You should use arrows or actual numbers to show clearly that you understand the concept of Opportunity Cost in an exam.
As this economy moves from a combination of goods X and Y represented by A to a combination
represented by B, the increase in the production of Y results in a reduction in the production of X.
The opportunity cost of increasing Y is the forgone production of X.
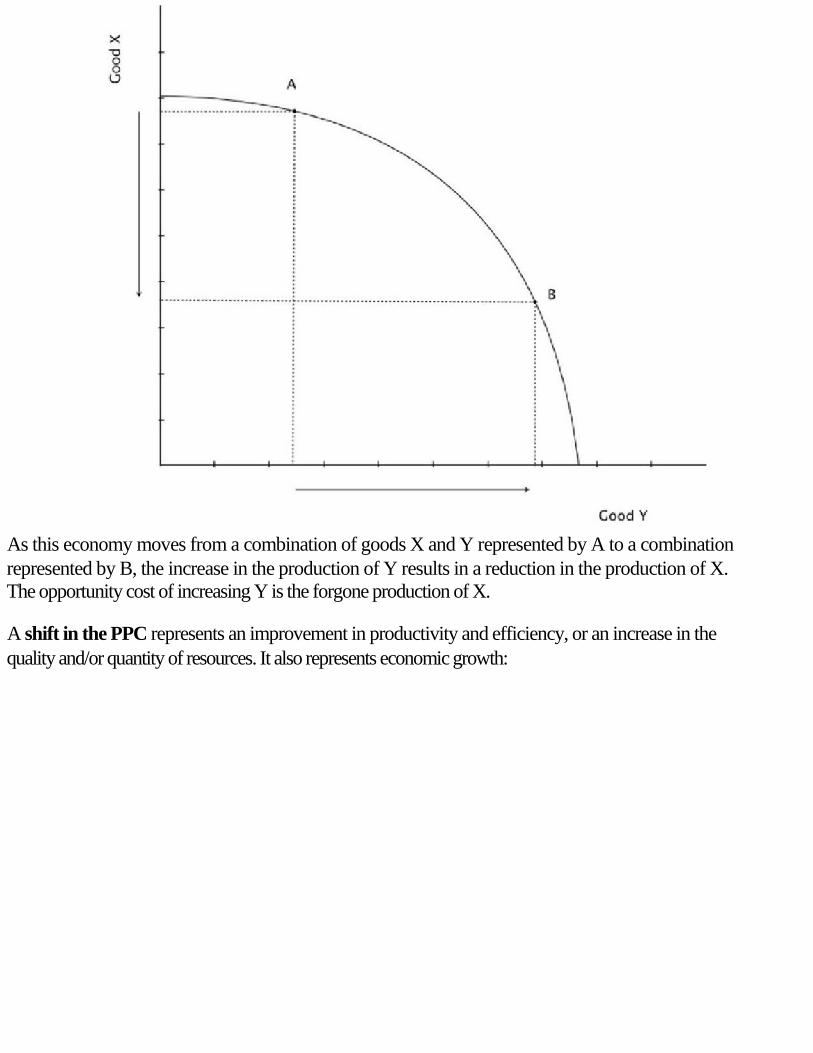
A shift in the PPC represents an improvement in productivity and efficiency, or an increase in the
quality and/or quantity of resources. It also represents economic growth:
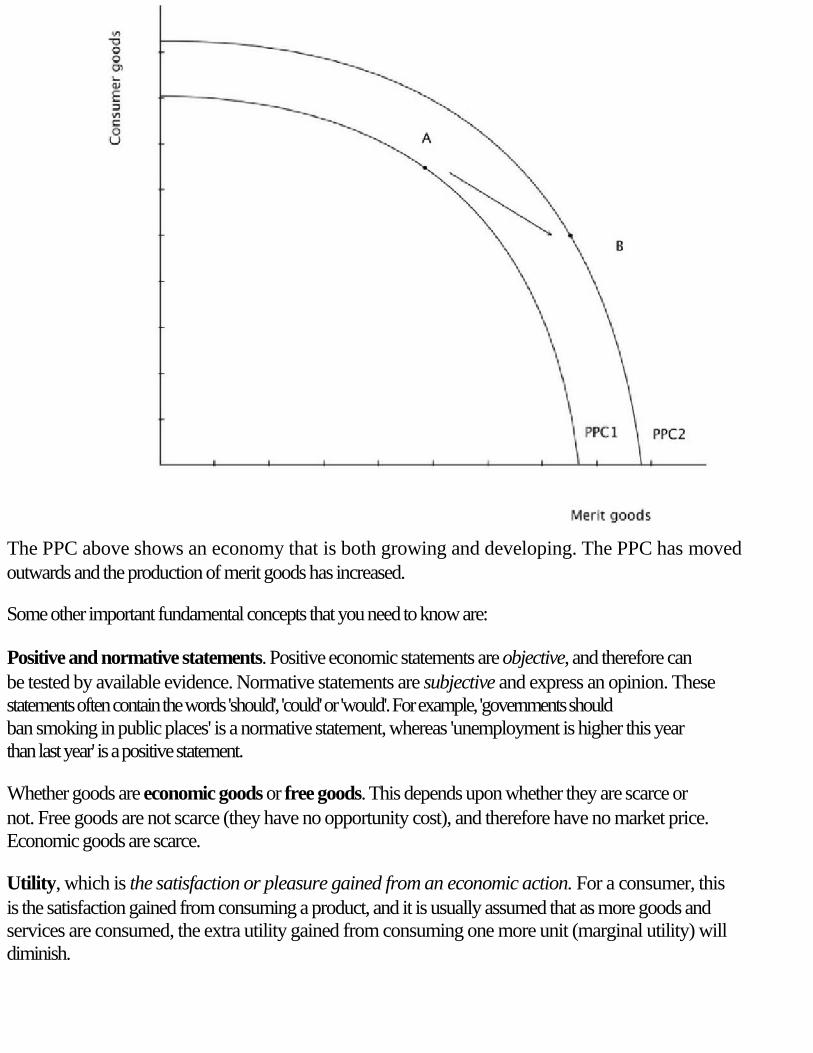
The PPC above shows an economy that is both growing and developing. The PPC has moved
outwards and the production of merit goods has increased.
Some other important fundamental concepts that you need to know are:
Positive and normative statements. Positive economic statements are objective, and therefore can
be tested by available evidence. Normative statements are subjective and express an opinion. These
statements often contain the words 'should', 'could' or 'would'. For example, 'governments should
ban smoking in public places' is a normative statement, whereas 'unemployment is higher this year
than last year' is a positive statement.
Whether goods are economic goods or free goods. This depends upon whether they are scarce or
not. Free goods are not scarce (they have no opportunity cost), and therefore have no market price.
Economic goods are scarce.
Utility, which is the satisfaction or pleasure gained from an economic action. For a consumer, this
is the satisfaction gained from consuming a product, and it is usually assumed that as more goods and
services are consumed, the extra utility gained from consuming one more unit (marginal utility) will
diminish.
MARKETS
You cannot avoid knowing about this most important area of syllabus areas. You MUST expect it to be tested in all three papers on
markets, how they work, how governments intervene in them and how they fail.
A market is a place where buyers (demand) and sellers (supply) meet to exchange goods or
services at the market-clearing price. Prices are determined in a free market solely by the
interaction of demand and supply. As we shall see later on, governments can and do intervene to
influence both price and output, and therefore the allocation of resources.
Demand
Other things being equal, or ceteris paribus, is an important assumption made by economists so that they can isolate the effect of a
single variable on something else.
Effective demand is a want (quantity of goods/services) backed by the willingness and ability to
buy at a given price. Other things being equal, more will be demanded at lower prices than at higher
prices, and so there will be an inverse relationship between price and quantity.
• Movement along the demand curve (extension/contraction)
It is absolutely crucial to be able to distinguish clearly between a movement along a demand curve (caused by a change in price) and a movement of the demand curve (caused by a change in one or more of the determinants of demand). This also applies to the distinction between a change in the quantity supplied and a change in supply. Your exam will test you on this knowledge in a variety of different ways, ranging from part (a) of essays, and early data response questions and numerical questions.
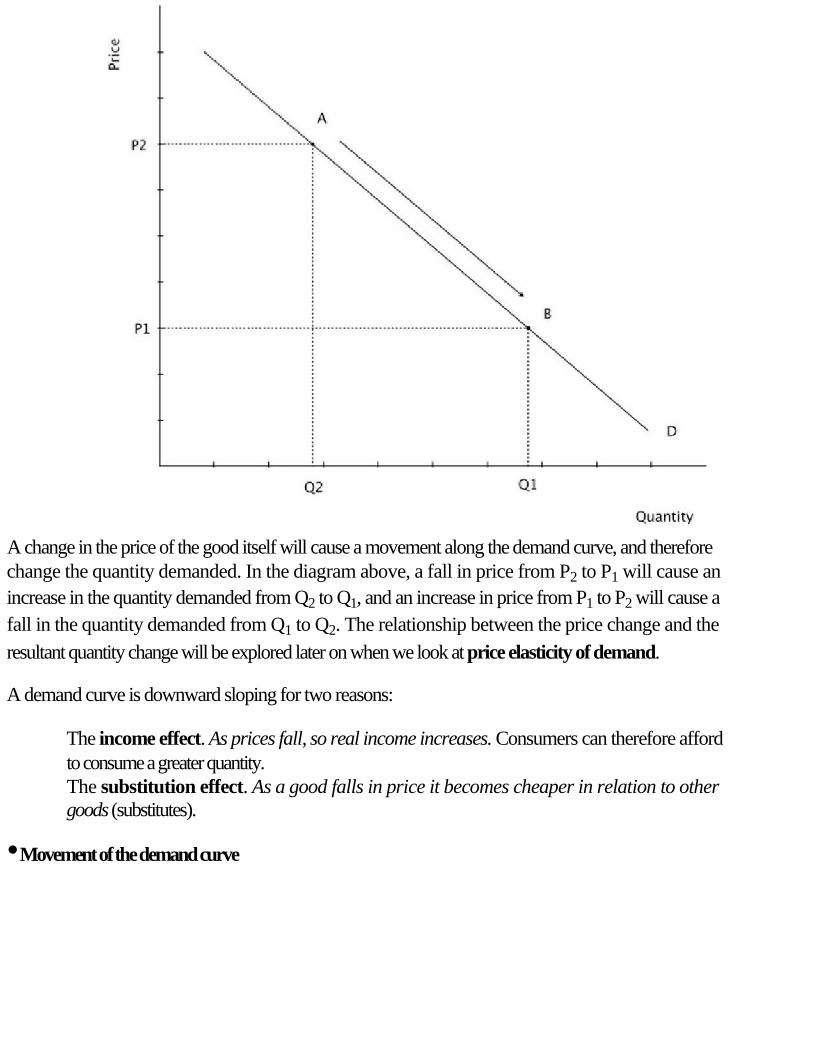
A change in the price of the good itself will cause a movement along the demand curve, and therefore
change the quantity demanded. In the diagram above, a fall in price from P2 to P1 will cause an
increase in the quantity demanded from Q2 to Q1, and an increase in price from P1 to P2 will cause a
fall in the quantity demanded from Q1 to Q2. The relationship between the price change and the
resultant quantity change will be explored later on when we look at price elasticity of demand.
A demand curve is downward sloping for two reasons:
The income effect. As prices fall, so real income increases. Consumers can therefore afford
to consume a greater quantity.
The substitution effect. As a good falls in price it becomes cheaper in relation to other
goods (substitutes).
• Movement of the demand curve
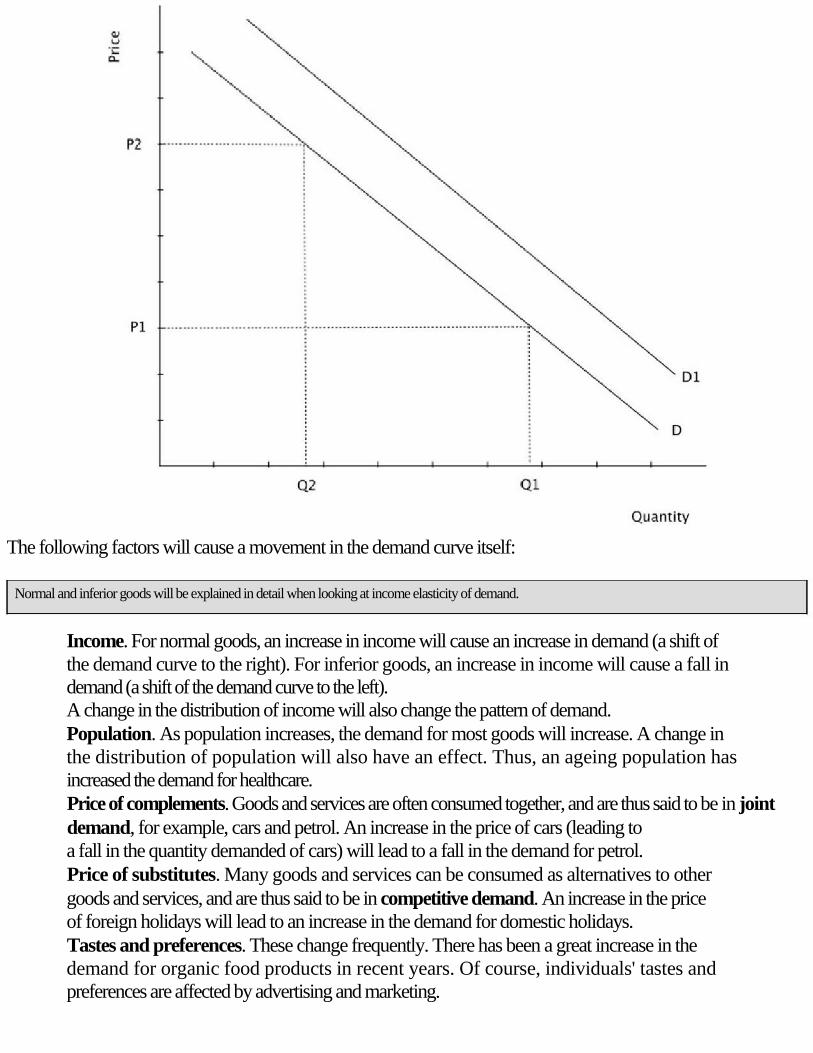
The following factors will cause a movement in the demand curve itself:
Normal and inferior goods will be explained in detail when looking at income elasticity of demand.
Income. For normal goods, an increase in income will cause an increase in demand (a shift of
the demand curve to the right). For inferior goods, an increase in income will cause a fall in
demand (a shift of the demand curve to the left).
A change in the distribution of income will also change the pattern of demand.
Population. As population increases, the demand for most goods will increase. A change in
the distribution of population will also have an effect. Thus, an ageing population has
increased the demand for healthcare.
Price of complements. Goods and services are often consumed together, and are thus said to be in joint
demand, for example, cars and petrol. An increase in the price of cars (leading to
a fall in the quantity demanded of cars) will lead to a fall in the demand for petrol.
Price of substitutes. Many goods and services can be consumed as alternatives to other
goods and services, and are thus said to be in competitive demand. An increase in the price
of foreign holidays will lead to an increase in the demand for domestic holidays.
Tastes and preferences. These change frequently. There has been a great increase in the
demand for organic food products in recent years. Of course, individuals' tastes and
preferences are affected by advertising and marketing.
Supply
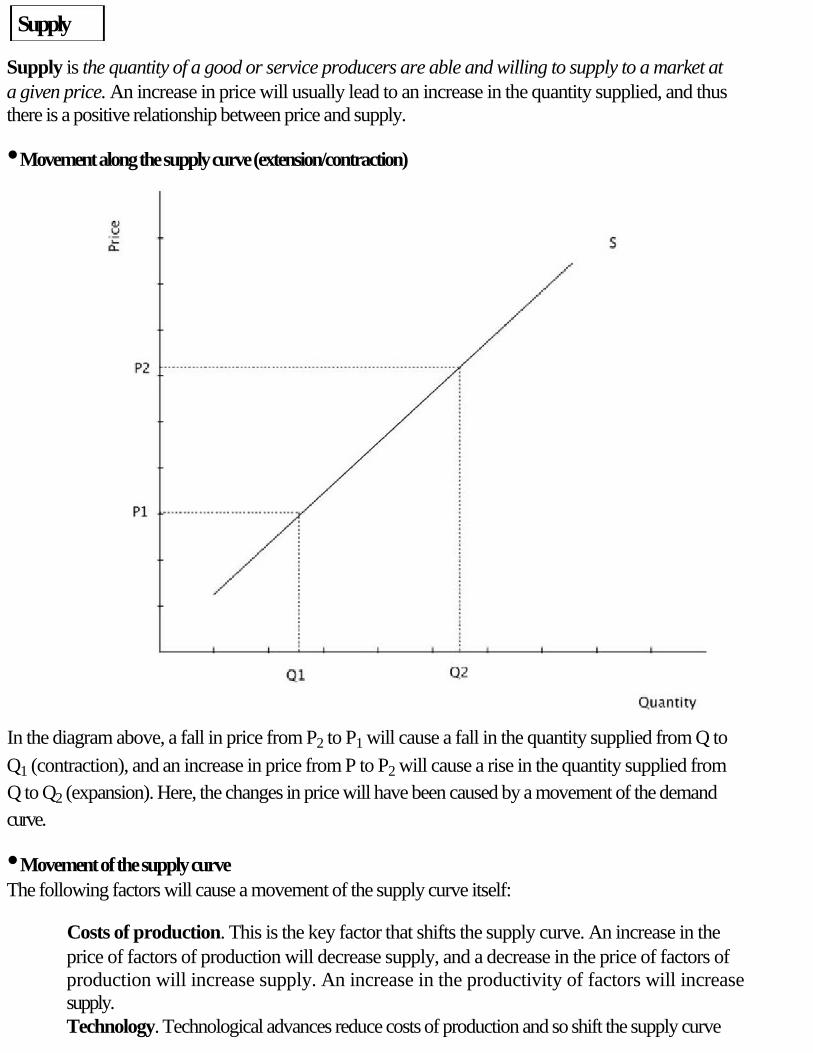
Supply is the quantity of a good or service producers are able and willing to supply to a market at
a given price. An increase in price will usually lead to an increase in the quantity supplied, and thus
there is a positive relationship between price and supply.
• Movement along the supply curve (extension/contraction)
In the diagram above, a fall in price from P2 to P1 will cause a fall in the quantity supplied from Q to
Q1 (contraction), and an increase in price from P to P2 will cause a rise in the quantity supplied from
Q to Q2 (expansion). Here, the changes in price will have been caused by a movement of the demand
curve.
• Movement of the supply curve
The following factors will cause a movement of the supply curve itself:
Costs of production. This is the key factor that shifts the supply curve. An increase in the
price of factors of production will decrease supply, and a decrease in the price of factors of
production will increase supply. An increase in the productivity of factors will increase
supply.
Technology. Technological advances reduce costs of production and so shift the supply curve

to the right.
New firms entering a market. Any new firm that enters a market will increase market
supply. This will be explored more when looking at perfect competition.
Indirect taxes and subsidies. Taxes will decrease supply, and subsides will increase supply.
Price of substitutes. A rise in the price of apples will encourage fruit growers to move from
growing pears etc. to producing apples, and thus the supply of pears will decrease.
Questions quite often ask candidates to comment upon the determinants of demand and supply. If you know your determinants, these
are very simple questions on which to score high marks.
Here S to S1 represents a decrease in supply, and S to S2 represents an increase in supply.
Equilibrium: the interaction of demand and supply
Examination questions in all three papers frequently ask candidates to illustrate, explain and analyse price changes, and a flexible
knowledge of the determinants of demand and supply and the forces that lead to equilibrium is something that any successful candidate must have. You should see the determinants of demand and supply as flexible tools that you can apply to any market (house prices, oil prices and commodity prices) to explain price movements.
Equilibrium exists when demand equals supply (P,Q). Disequilibrium exists if there is a situation of
excess demand (at Pa) or excess supply (at Pb) as shown below:
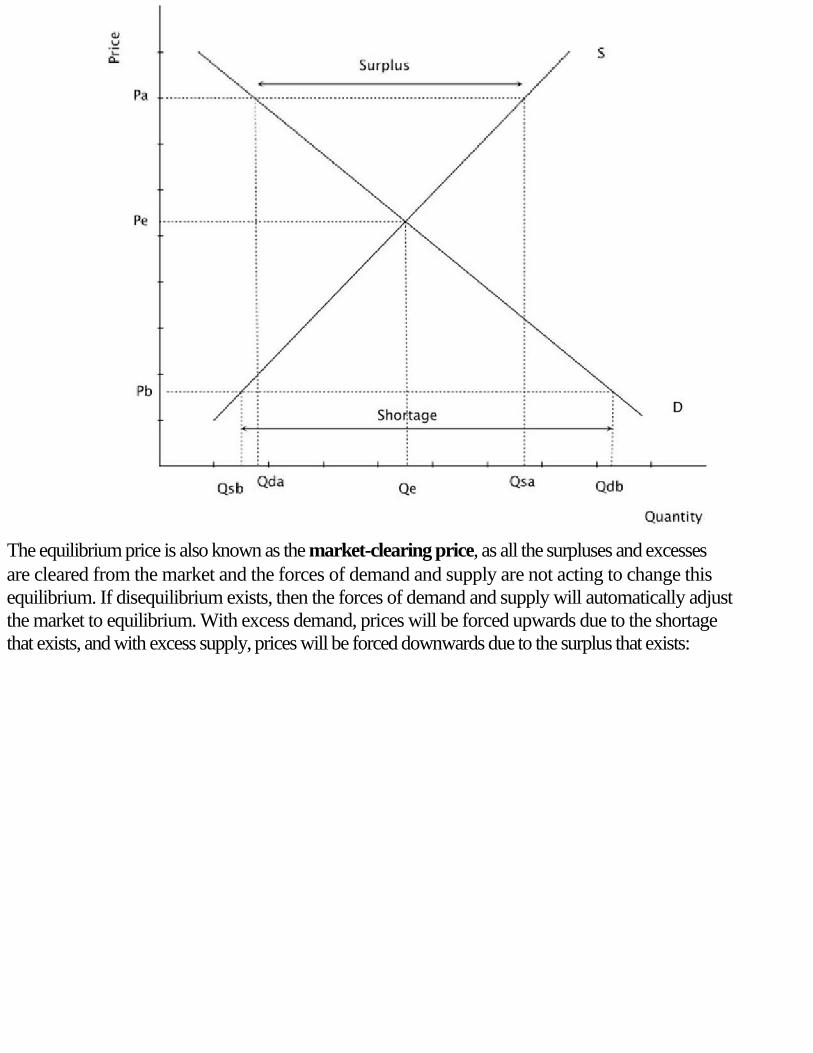
The equilibrium price is also known as the market-clearing price, as all the surpluses and excesses
are cleared from the market and the forces of demand and supply are not acting to change this
equilibrium. If disequilibrium exists, then the forces of demand and supply will automatically adjust
the market to equilibrium. With excess demand, prices will be forced upwards due to the shortage
that exists, and with excess supply, prices will be forced downwards due to the surplus that exists:
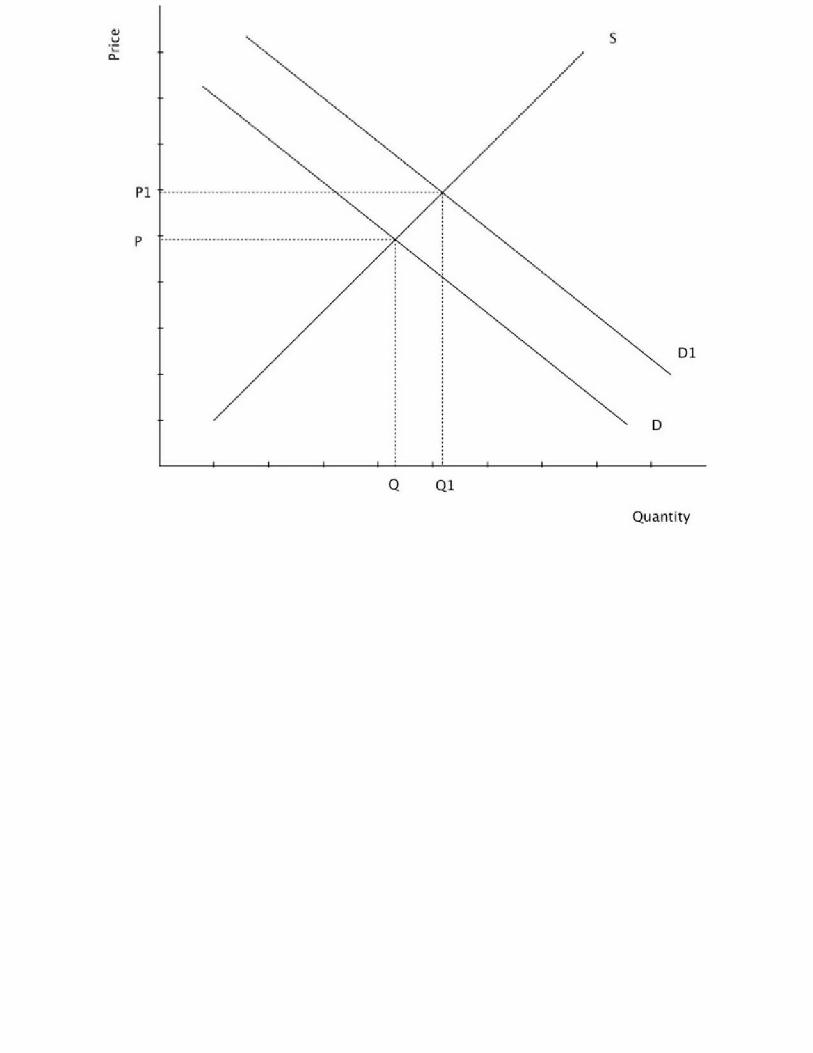
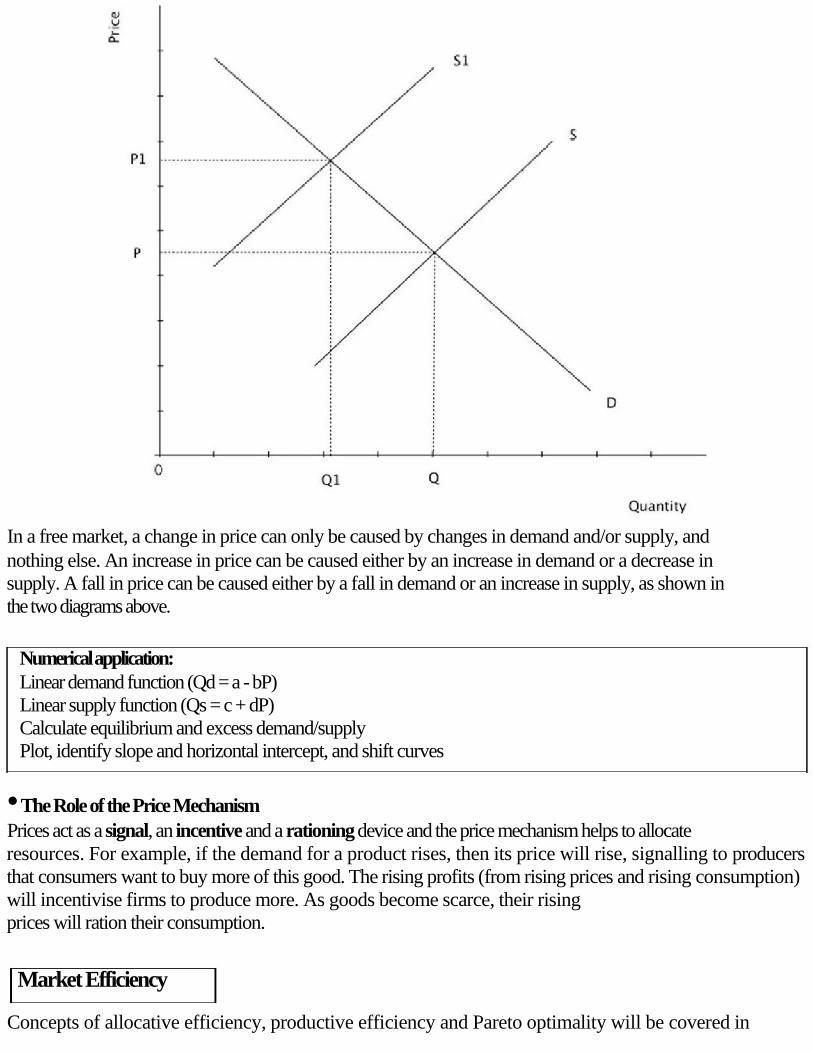
In a free market, a change in price can only be caused by changes in demand and/or supply, and
nothing else. An increase in price can be caused either by an increase in demand or a decrease in
supply. A fall in price can be caused either by a fall in demand or an increase in supply, as shown in
the two diagrams above.
Numerical application:
Linear demand function (Qd = a - bP)
Linear supply function (Qs = c + dP)
Calculate equilibrium and excess demand/supply
Plot, identify slope and horizontal intercept, and shift curves
• The Role of the Price Mechanism
Prices act as a signal, an incentive and a rationing device and the price mechanism helps to allocate
resources. For example, if the demand for a product rises, then its price will rise, signalling to producers
that consumers want to buy more of this good. The rising profits (from rising prices and rising consumption)
will incentivise firms to produce more. As goods become scarce, their rising
prices will ration their consumption.
Market Efficiency
Concepts of allocative efficiency, productive efficiency and Pareto optimality will be covered in
detail under the heading of Market Structures.
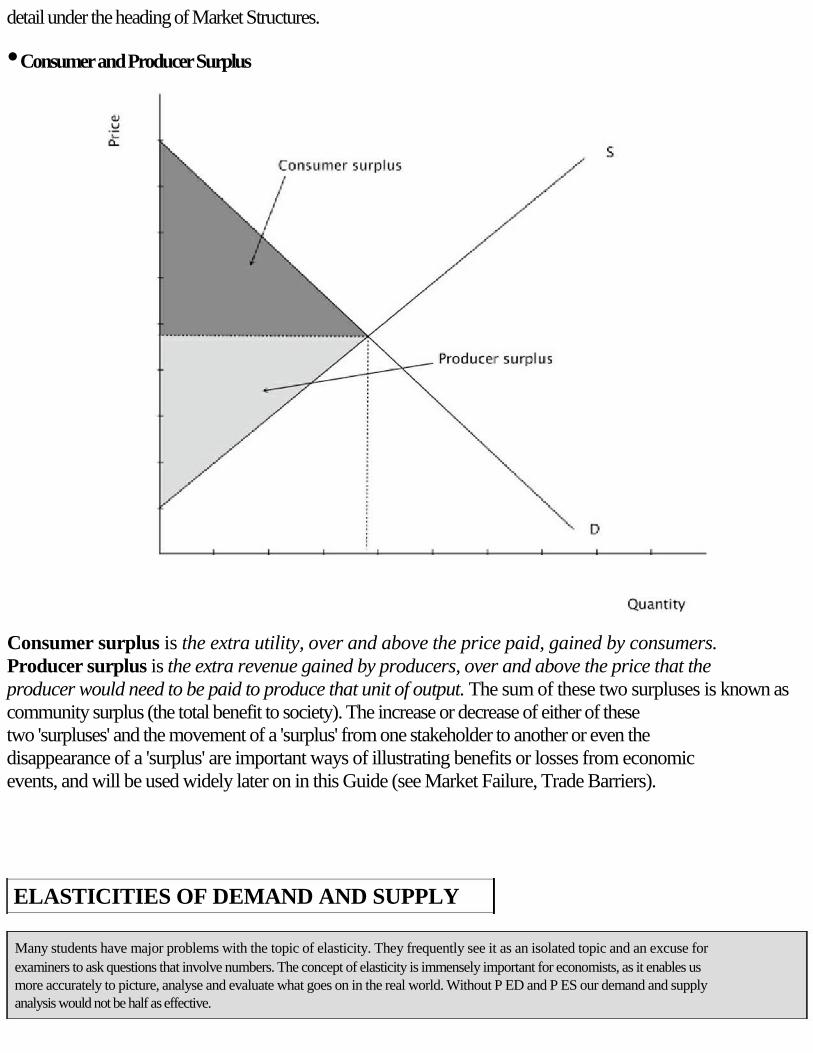
• Consumer and Producer Surplus
Consumer surplus is the extra utility, over and above the price paid, gained by consumers.
Producer surplus is the extra revenue gained by producers, over and above the price that the
producer would need to be paid to produce that unit of output. The sum of these two surpluses is known as
community surplus (the total benefit to society). The increase or decrease of either of these
two 'surpluses' and the movement of a 'surplus' from one stakeholder to another or even the
disappearance of a 'surplus' are important ways of illustrating benefits or losses from economic
events, and will be used widely later on in this Guide (see Market Failure, Trade Barriers).
ELASTICITIES OF DEMAND AND SUPPLY
Many students have major problems with the topic of elasticity. They frequently see it as an isolated topic and an excuse for
examiners to ask questions that involve numbers. The concept of elasticity is immensely important for economists, as it enables us more accurately to picture, analyse and evaluate what goes on in the real world. Without P ED and P ES our demand and supply analysis would not be half as effective.
Elasticity measures the responsiveness of one variable to a change in another.
Price Elasticity of Demand
Students should always look to comment on elasticity wherever they can. They should carefully consider whether they can use their
knowledge of P ED and P ES to draw demand and supply curves which accurately reflect the market situation. For example, diagrams to illustrate agricultural and commodity markets should always have price inelastic demand and supply curves.
Price Elasticity of Demand (PED) measures the responsiveness of the quantity demanded to a
change in price.
An alternative formula which is very useful is
where Q is the change in quantity demanded, Q is the original quantity, P is the change in price,
and P is the original price.
The calculation of PED results in a coefficient, or real number, and this tells us two major things
about the responsiveness of the quantity demanded to a change in price.
Sign (positive or negative) gives information about the direction of the relationship. For all Normal
goods, PED will be negative, as there is a negative relationship between price and quantity on a
downward-sloping demand curve. We always ignore this negative sign. If PED is positive, then we
have a perverse demand curve.
Magnitude. The size of the number resulting from the elasticity calculation tells us about the degree
of response. The bigger the number, the bigger the response, and vice versa.
PED > 1 means the good is price elastic
PED < 1 means the good is price inelastic
PED = 1 means the good has unit elasticity
PED = 0 means the good is perfectly price inelastic
PED = means the good is perfectly price elastic
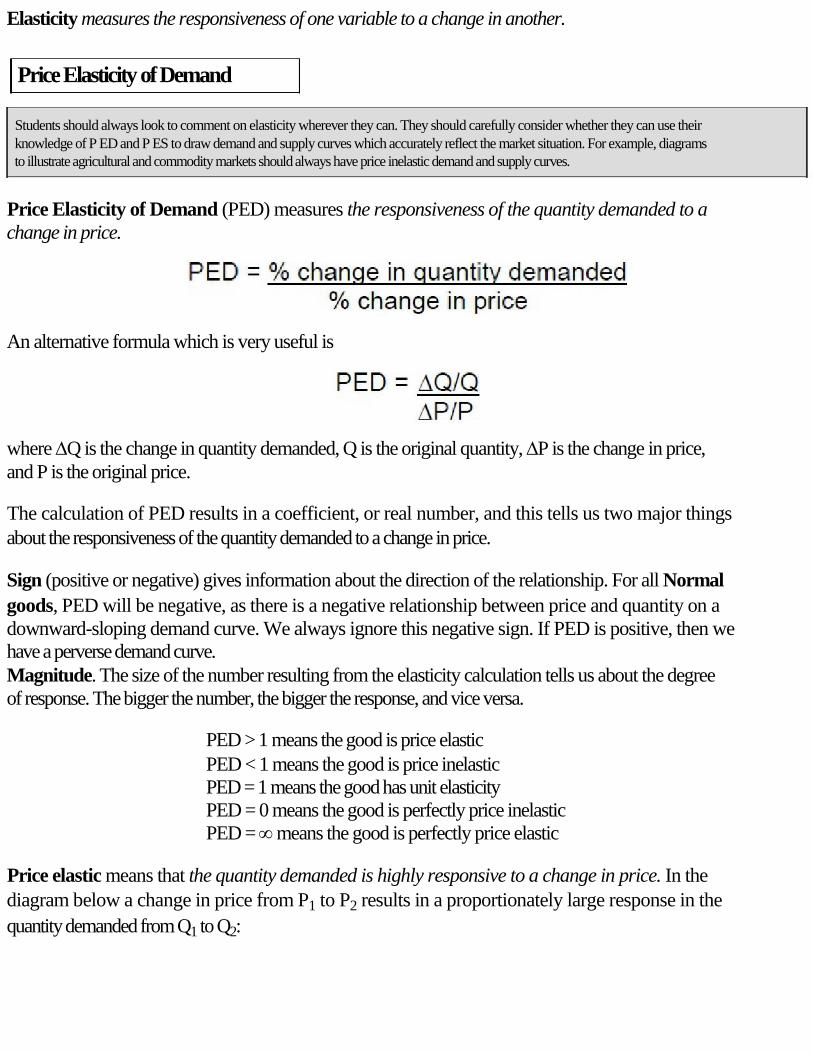
Price elastic means that the quantity demanded is highly responsive to a change in price. In the
diagram below a change in price from P1 to P2 results in a proportionately large response in the
quantity demanded from Q1 to Q2:
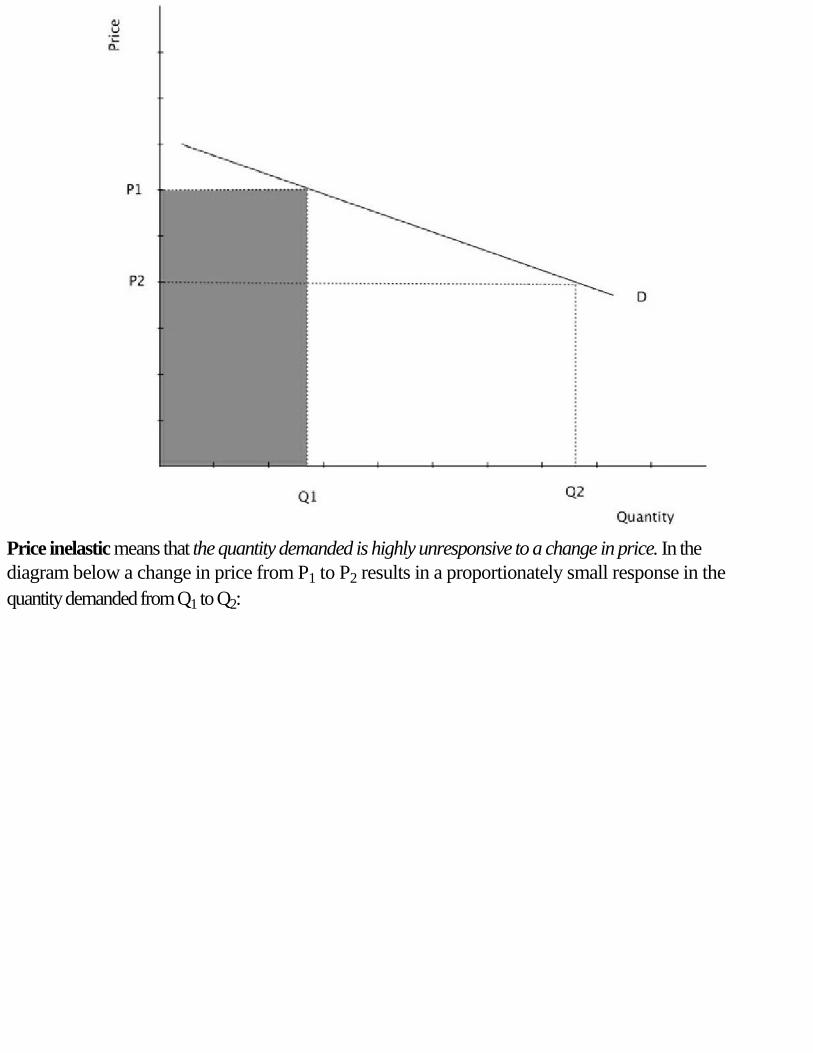
Price inelastic means that the quantity demanded is highly unresponsive to a change in price. In the
diagram below a change in price from P1 to P2 results in a proportionately small response in the
quantity demanded from Q1 to Q2:
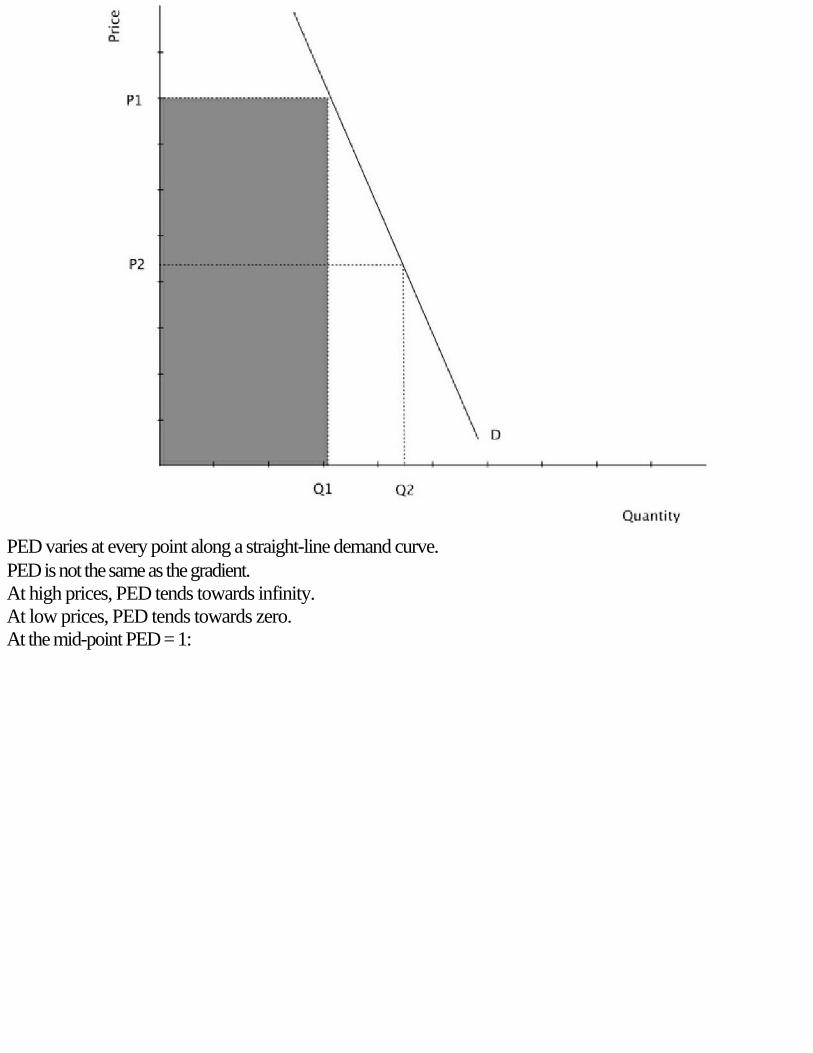
PED varies at every point along a straight-line demand curve.
PED is not the same as the gradient.
At high prices, PED tends towards infinity.
At low prices, PED tends towards zero.
At the mid-point PED = 1:
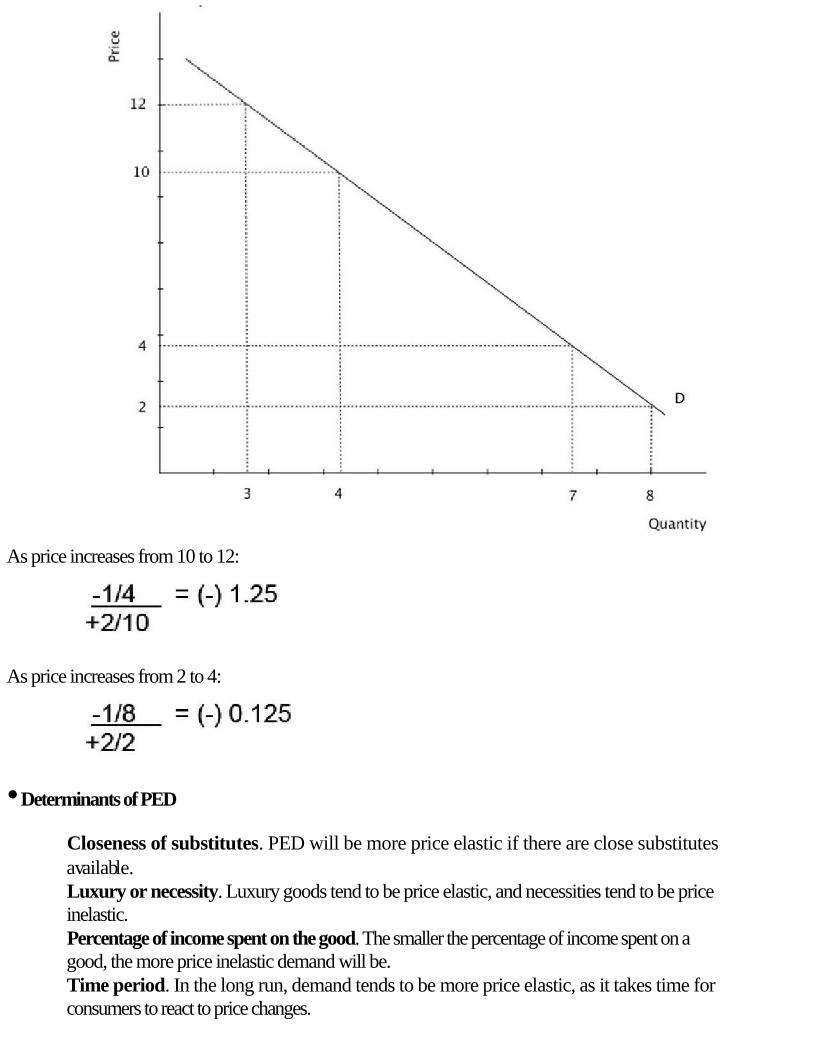
As price increases from 10 to 12:
As price increases from 2 to 4:
• Determinants of PED
Closeness of substitutes. PED will be more price elastic if there are close substitutes
a va i l a bl e .
Luxury or necessity. Luxury goods tend to be price elastic, and necessities tend to be price
inelastic.
Percentage of income spent on the good. The smaller the percentage of income spent on a
good, the more price inelastic demand will be.
Time period. In the long run, demand tends to be more price elastic, as it takes time for
consumers to react to price changes.
• PED of Commodities and Manufactured Goods
P ED will appear again when we look at price discrimination, and the effects of a depreciation in the exchange rate on the balance of payments.
Demand for commodities tends to be price inelastic as they are necessities and have few substitutes.
Therefore, any change in the supply of commodities will cause wide fluctuation in prices. On the
other hand, manufactured goods with more substitutes tend to have price inelastic demand curves, and
thus supply-side fluctuations will cause less substantial changes in prices.
• PED and Total Revenue (TR)
TR = P x Q
Total revenue is a useful way to check the PED of a demand curve. If a rise in price causes total
revenue to increase, then PED is inelastic. If an increase in price causes total revenue to decrease,
then the demand curve is price elastic. If an increase in price causes total revenue to increase then the
demand curve is price inelastic. If a change in price does not change total revenue, the PED is unitary
( = 1) .
In the diagrams on page 16, TR at P2 = P2 x Q2. After an increase in price, TR at P1 = P1 x Q1 (shaded
ar ea) .
Cross Price Elasticity of Demand
You should see the link between XED and the price of other goods, which was compliments and substitutes as determinants of
demand. A fall in the price of a complement will cause an increase in demand (a shift of the demand curve to the right) for the good that is in joint demand. A fall in the price of a substitute will cause a decrease in demand (a shift of the demand curve to the left) for the good that is in competitive demand.
Cross Price Elasticity of Demand (XED) measures the responsiveness of the quantity demanded of
one good to a change in price of another.
An alternative formula which is very useful is
where QA is the change in quantity demanded of good A, QA is the original quantity of good A, PB
is the change in price of good B, and PB is the original price of good B.
Sign (positive or negative). Substitutes (goods in competitive demand) will have a positive
XED. Complements (goods in joint demand) will have a negative XED.
Magnitude. The higher the value of XED the closer the relationship (either complement or
substitute) will be between the two goods in question.
Income Elasticity of Demand
Income Elasticity of Demand (YED) measures the responsiveness of the quantity demanded to a
change in the real income of consumers.
An alternative formula which is very useful is
where Q is the change in quantity demanded, Q is the original quantity, Y is the change in income,
and Y is the original income.
Sign (positive or negative). Positive means that the good is a normal good (as income
increases, so will the quantity demanded). Here an increase in income will result in the
demand curve shifting to the right. Negative means that the good is an inferior good (as
income increases, so the quantity demanded will fall). Here an increase in income will
result in the demand curve shifting to the left.
Magnitude. The higher the value of YED the closer the relationship will be between a
change in income and the change in the quantity demanded (0-1 being necessities and 1-
being luxuries).
Price Elasticity of Supply
Questions quite often ask candidates to comment upon the determinants of P ED and P ES. If you know your determinants, these are
very simple questions on which to score high marks.
Price Elasticity of Supply (PES) measures the responsiveness of the quantity supplied to a change
i n pr i c e .
An alternative formula which is very useful is
where Qs is the change in quantity supplied, Qs is the original quantity supplied, P is the change in
price, and P is the original price.
Sign (positive or negative). Supply curves have a positive PES.
Magnitude. The size of the number resulting from the elasticity calculation tells us about the
degree of response. The bigger the number, the bigger the response, and vice versa.
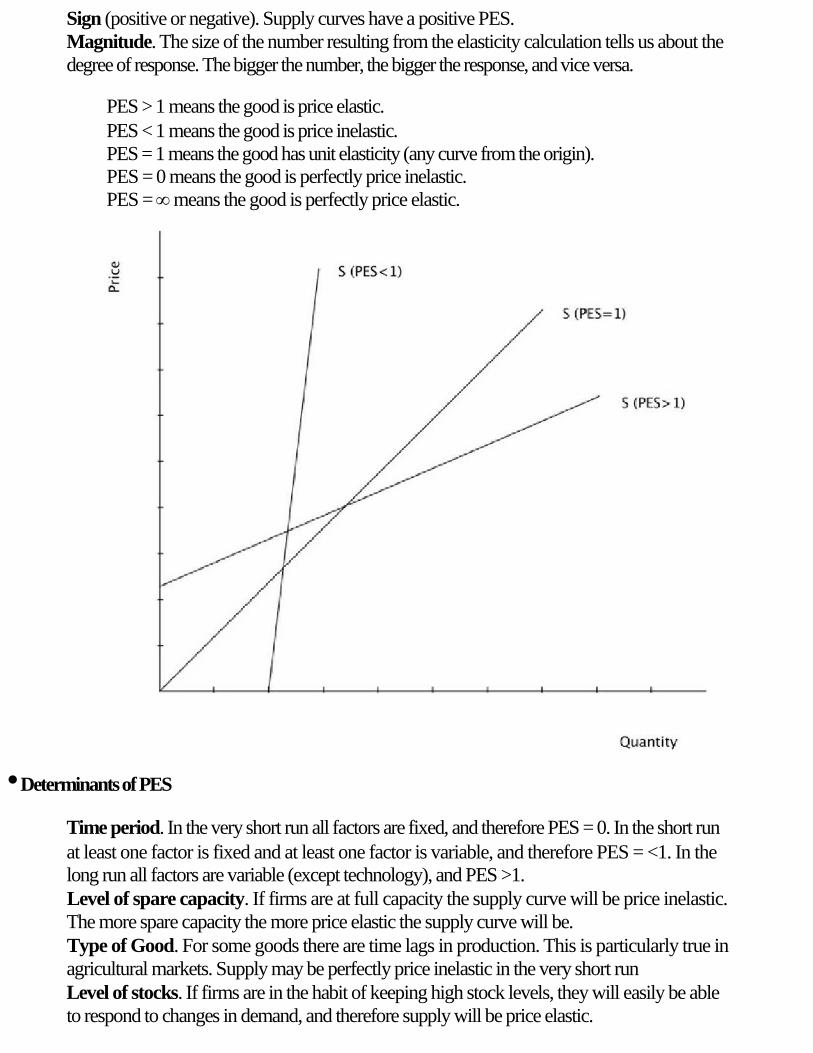
PES > 1 means the good is price elastic.
PES < 1 means the good is price inelastic.
PES = 1 means the good has unit elasticity (any curve from the origin).
PES = 0 means the good is perfectly price inelastic.
PES = means the good is perfectly price elastic.
• Determinants of PES
Time period. In the very short run all factors are fixed, and therefore PES = 0. In the short run
at least one factor is fixed and at least one factor is variable, and therefore PES = <1. In the
long run all factors are variable (except technology), and PES >1.
Level of spare capacity. If firms are at full capacity the supply curve will be price inelastic.
The more spare capacity the more price elastic the supply curve will be.
Type of Good. For some goods there are time lags in production. This is particularly true in
agricultural markets. Supply may be perfectly price inelastic in the very short run
Level of stocks. If firms are in the habit of keeping high stock levels, they will easily be able
to respond to changes in demand, and therefore supply will be price elastic.
• PES of Commodities and Manufactured Goods
Supply of commodities tends to be price inelastic as it takes time for producers to respond to increases
in demand given that not all factors are variable (many commodities have growing
seasons). Manufactured goods tend to have a price elastic supply, as there are not the same time-lags
in production.
Price inelastic supply combined with price inelastic demand for commodities means that any changes
in demand or supply lead to considerable fluctuations in prices. The volatility of commodity prices
makes commodity producers vulnerable to fluctuations in income (the major source of investment).
Numerical application:
Calculate PED, XED, YED and PES
Sign and magnitude
Application and implication for stakeholders
GOVERNMENT INTERVENTION
It is important that you see the links between government intervention in the market, price elasticity of demand and supply, and market
failure.
Governments intervene in markets because they believe that the equilibrium reached by the free
market is not desirable. In other words, they believe that price and/or quantity are in the wrong place.
Thus they employ a variety of methods to move both price and quantity. For example, most
governments believe that the free market equilibrium price of cigarettes would be too low and
therefore they tax them. Of course, there are issues of market failure involved here.
Maximum and Minimum Prices
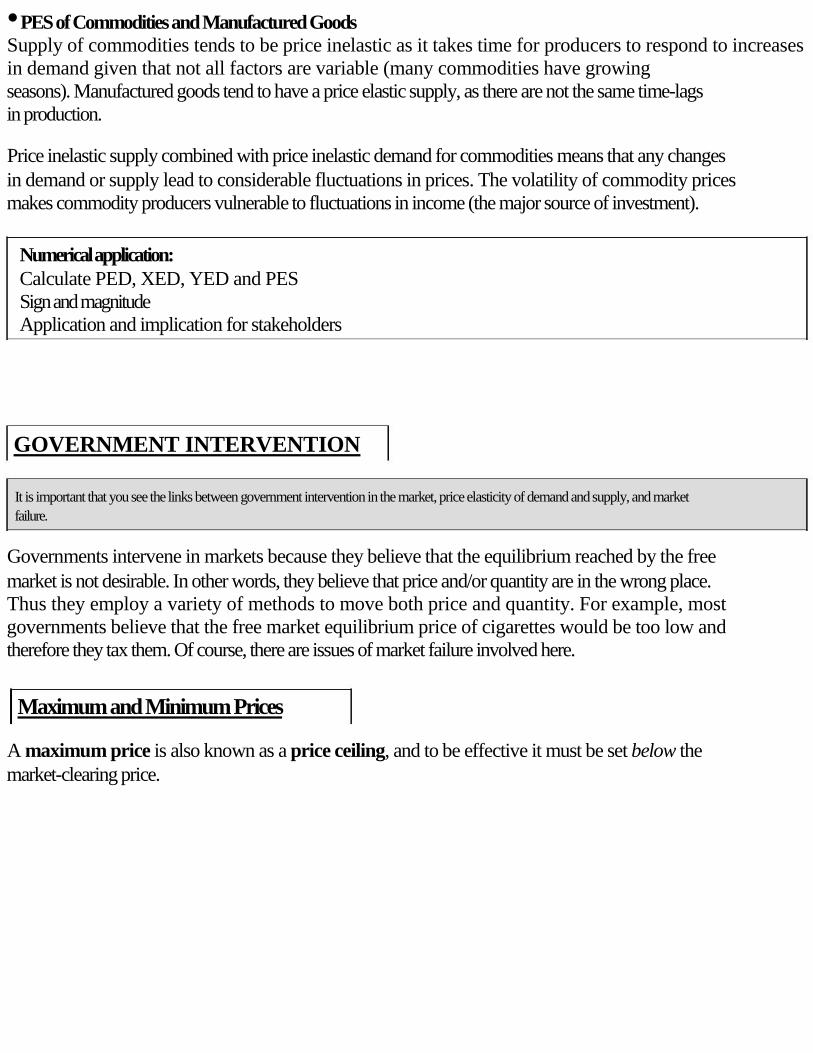
A maximum price is also known as a price ceiling, and to be effective it must be set below the
market-clearing price.
A maximum price will result in a shortage or excess demand (Q1 to Q2), with consumers benefitting
from lower prices. However, often a parallel market will evolve. To cure this problem, a government
might have to introduce rationing, or, as in the graph below, the government could attempt to shift the
supply curve by using subsidies, producing themselves, or releasing stocks of previously produced
goods into the market.
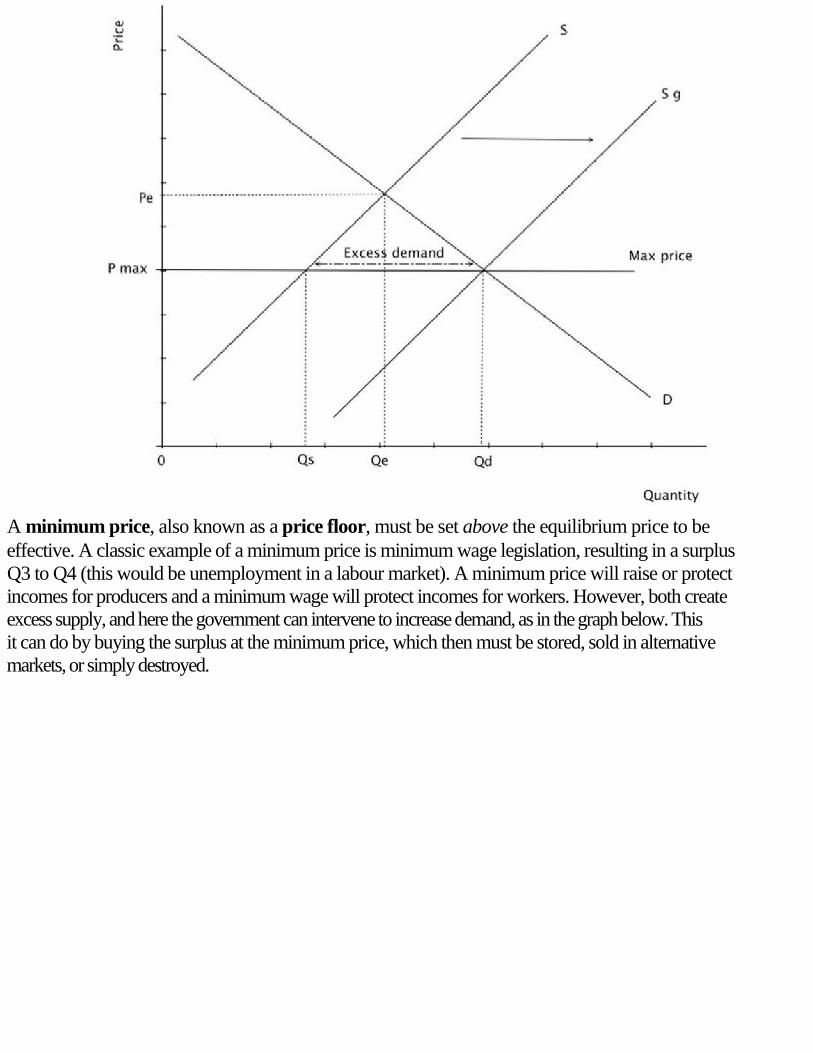
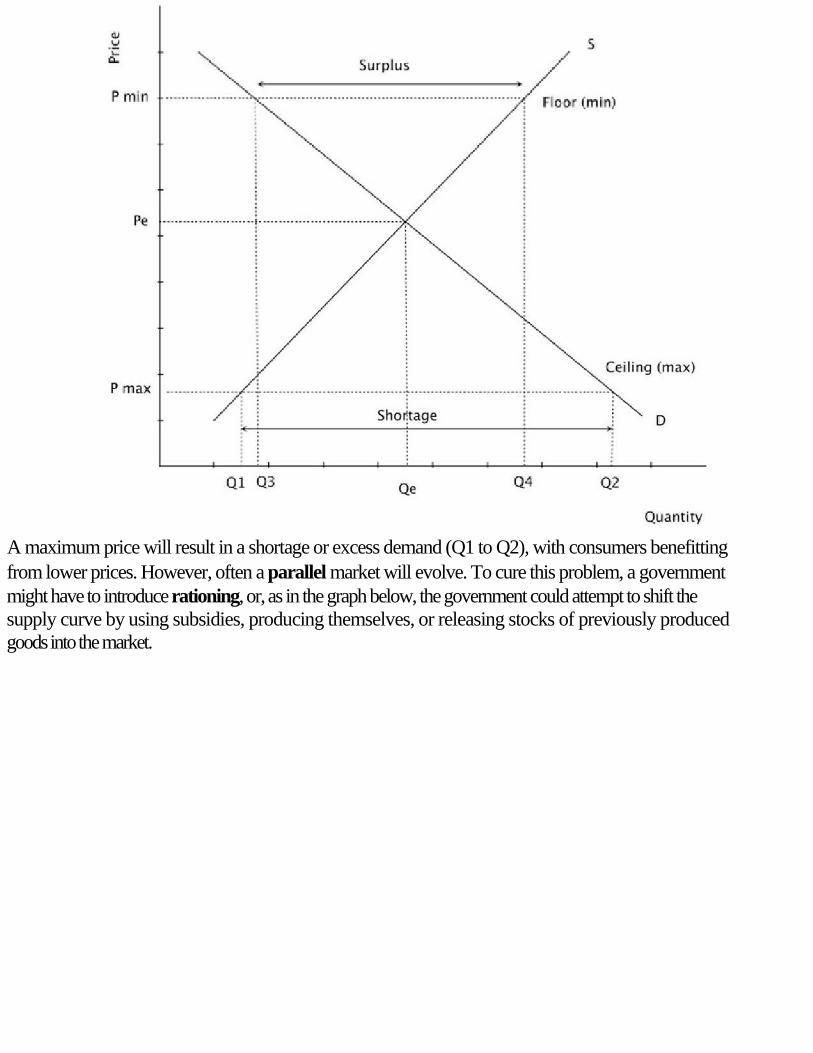
A minimum price, also known as a price floor, must be set above the equilibrium price to be
effective. A classic example of a minimum price is minimum wage legislation, resulting in a surplus
Q3 to Q4 (this would be unemployment in a labour market). A minimum price will raise or protect
incomes for producers and a minimum wage will protect incomes for workers. However, both create
excess supply, and here the government can intervene to increase demand, as in the graph below. This
it can do by buying the surplus at the minimum price, which then must be stored, sold in alternative
markets, or simply destroyed.
Indirect taxation
It is important to be able both to analyse and evaluate the effects of the various methods of government intervention. An average
candidate will simply state the effects. A good candidate will comment on how effective the measures are, and the wider implications. For example, in the diagram below, a good candidate would comment that the tax does not reduce equilibrium quantity very much, and that the consumer pays most of the burden of taxation.
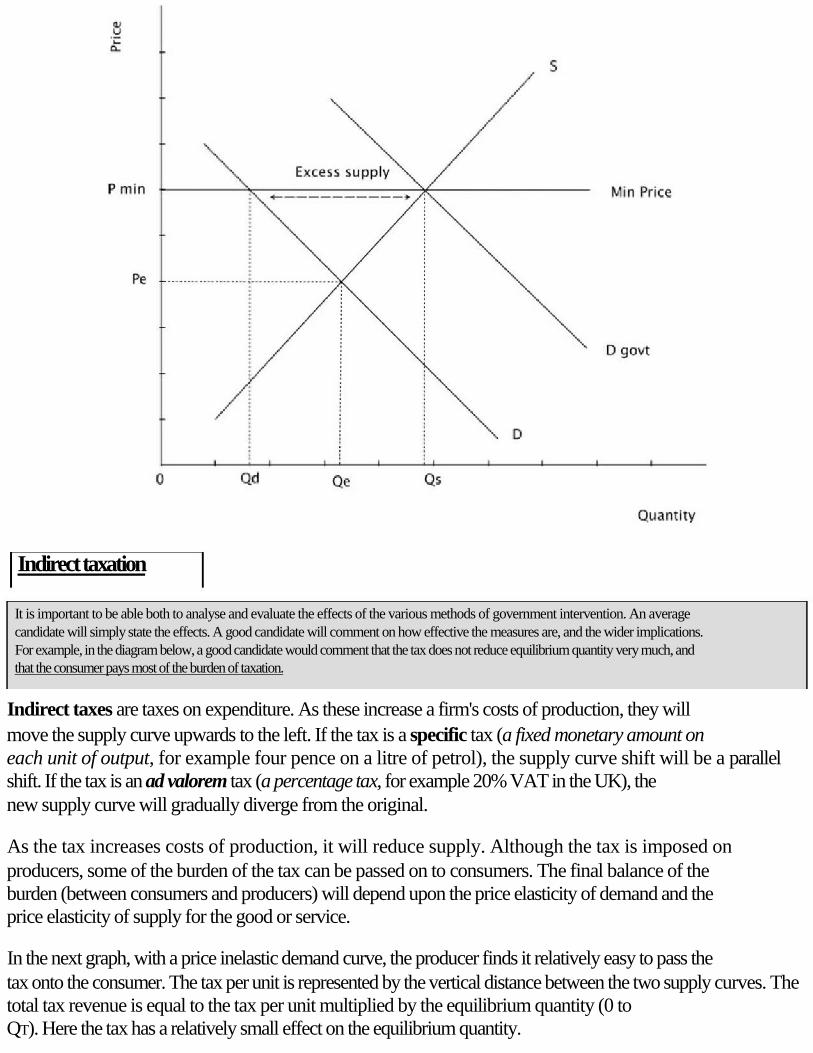
Indirect taxes are taxes on expenditure. As these increase a firm's costs of production, they will
move the supply curve upwards to the left. If the tax is a specific tax (a fixed monetary amount on
each unit of output, for example four pence on a litre of petrol), the supply curve shift will be a parallel
shift. If the tax is an ad valorem tax (a percentage tax, for example 20% VAT in the UK), the
new supply curve will gradually diverge from the original.
As the tax increases costs of production, it will reduce supply. Although the tax is imposed on
producers, some of the burden of the tax can be passed on to consumers. The final balance of the
burden (between consumers and producers) will depend upon the price elasticity of demand and the
price elasticity of supply for the good or service.
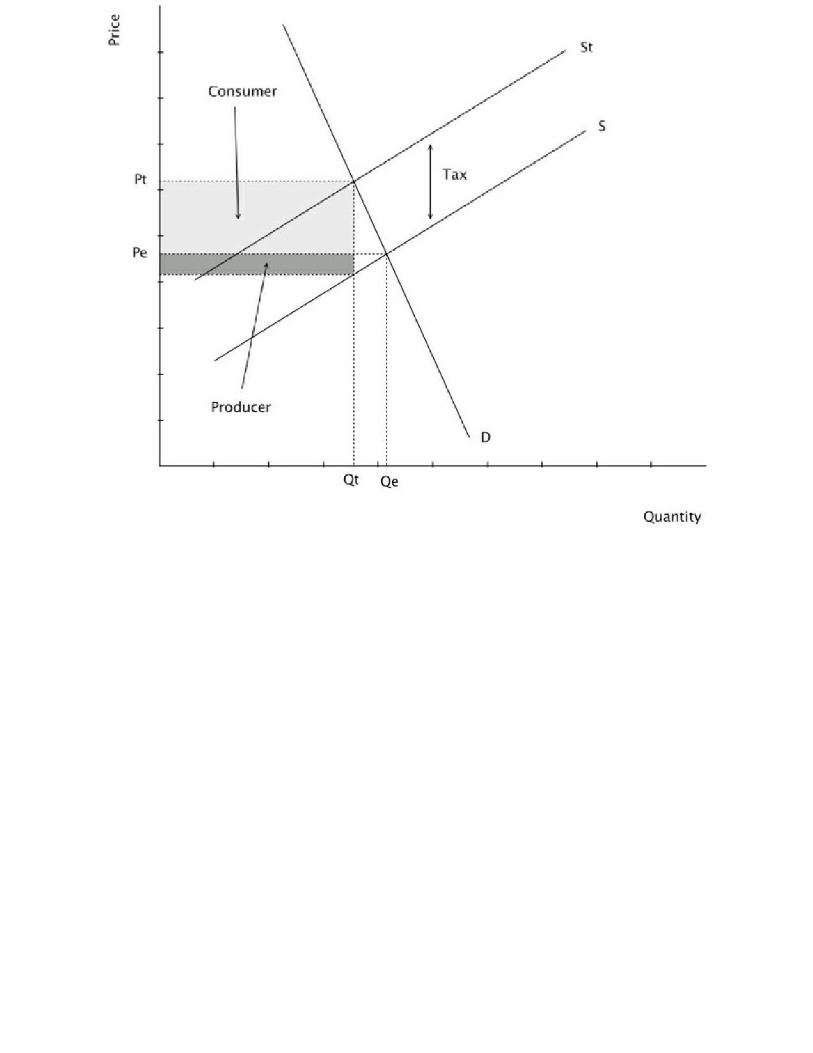
In the next graph, with a price inelastic demand curve, the producer finds it relatively easy to pass the
tax onto the consumer. The tax per unit is represented by the vertical distance between the two supply curves. The
total tax revenue is equal to the tax per unit multiplied by the equilibrium quantity (0 to
QT). Here the tax has a relatively small effect on the equilibrium quantity.

Here, in the graph above, the producer finds it relatively difficult to pass the tax onto the consumer.
The consumer will carry the greater tax burden if price elasticity of demand is inelastic, or price
elasticity of supply is elastic. The producer will carry the greater tax burden if price elasticity of
demand is elastic, or price elasticity of supply is inelastic.
Subsidies
Subsidies are payments by a government to producers. They reduce the costs of production and
increase output. As they reduce the costs of production they will shift the supply curve downwards to
the right. They will have the effect of increasing the price the producer receives for each unit of
output (Pe to Pp in the diagram below), and reducing the price the consumer pays for each unit
consumed (Pe to Pc). The total cost of the subsidy, to the government, is Pp to Pc multiplied by 0 to
Qs (area a+b+c+d+e+f).
Before the subsidy consumer spending was f+e+g. After the subsidy consumer spending is g+i+j for
an increased quantity.
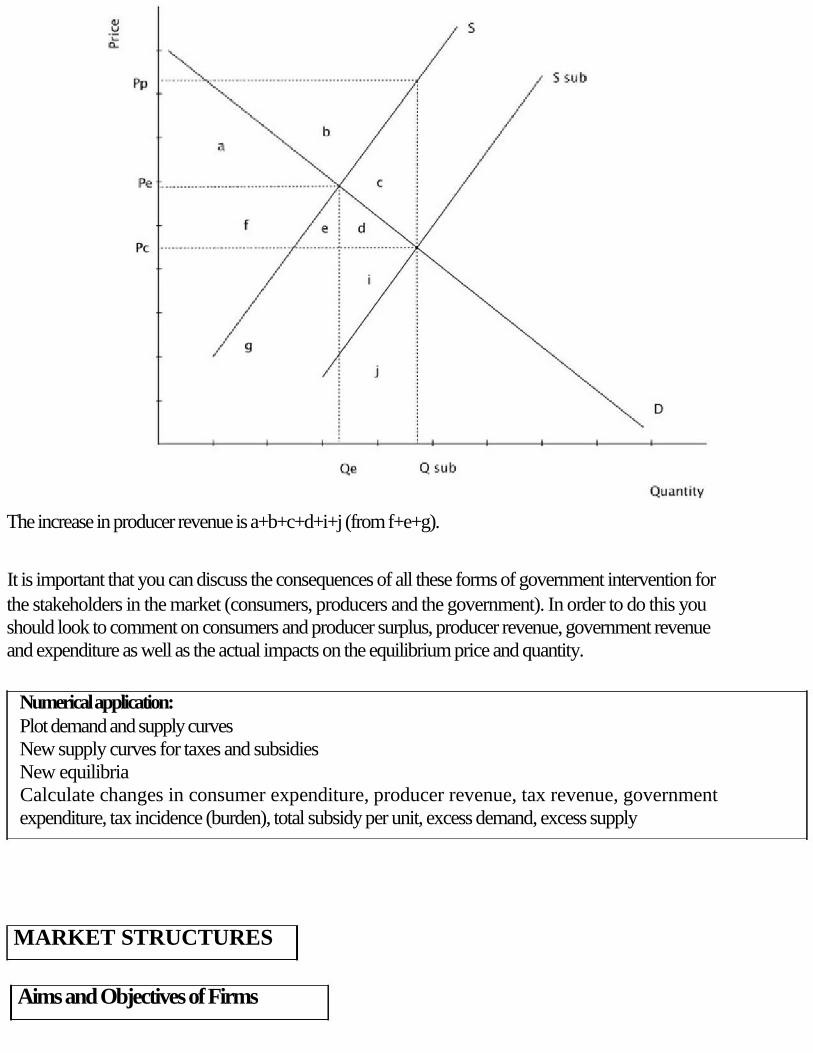
The increase in producer revenue is a+b+c+d+i+j (from f+e+g).
It is important that you can discuss the consequences of all these forms of government intervention for
the stakeholders in the market (consumers, producers and the government). In order to do this you
should look to comment on consumers and producer surplus, producer revenue, government revenue
and expenditure as well as the actual impacts on the equilibrium price and quantity.
Numerical application:
Plot demand and supply curves
New supply curves for taxes and subsidies
New equilibria
Calculate changes in consumer expenditure, producer revenue, tax revenue, government
expenditure, tax incidence (burden), total subsidy per unit, excess demand, excess supply
MARKET STRUCTURES
Aims and Objectives of Firms
Profit maximisation dominates this section. You need, however, to understand where a firm might maximise sales revenue/total revenue.
There is a wide range of possible aims and objectives for firms to target, including sales revenue
maximisation, output maximisation, managerial goals, behavioural goals, market share and satisfising,
but underpinning much of the theory in this section is the aim of profit maximisation.
Profit = total revenue - total cost
Total revenue = price x quantity
Total cost = average cost x quantity
(Or fixed costs + variable costs)
To understand effectively how a firm works, you need to understand costs and revenue in some detail.
Production and Costs
TC = FC + VC
ATC = TC / Q ATC = AFC + AVC AFC = FC / Q AVC = VC / Q MC = TC / Q MC = the slope of TC
• Costs in the Short Run
Questions asking you to distinguish between short and long run costs do appear in the essay paper (part a), but elsewhere all you will be required to do is to draw your cost curves accurately, and in combination with revenue curves, analyse the behaviour of firms.
A firm is a combination of the four factors of production. These four factors are transformed into
output. As these factors must be paid for, production incurs costs.
In the short run, at least one factor is variable, and at least one factor is fixed. Even though the
firm's size is fixed, increasing amounts of a variable factor (eg. labour) can be added to the firm.
Here the law of diminishing returns applies. This law states that as successive units of the variable
factor are added, the extra (marginal) output produced will at first increase and then decrease.
This results in the marginal product (MP) and average product (AP) curves below:
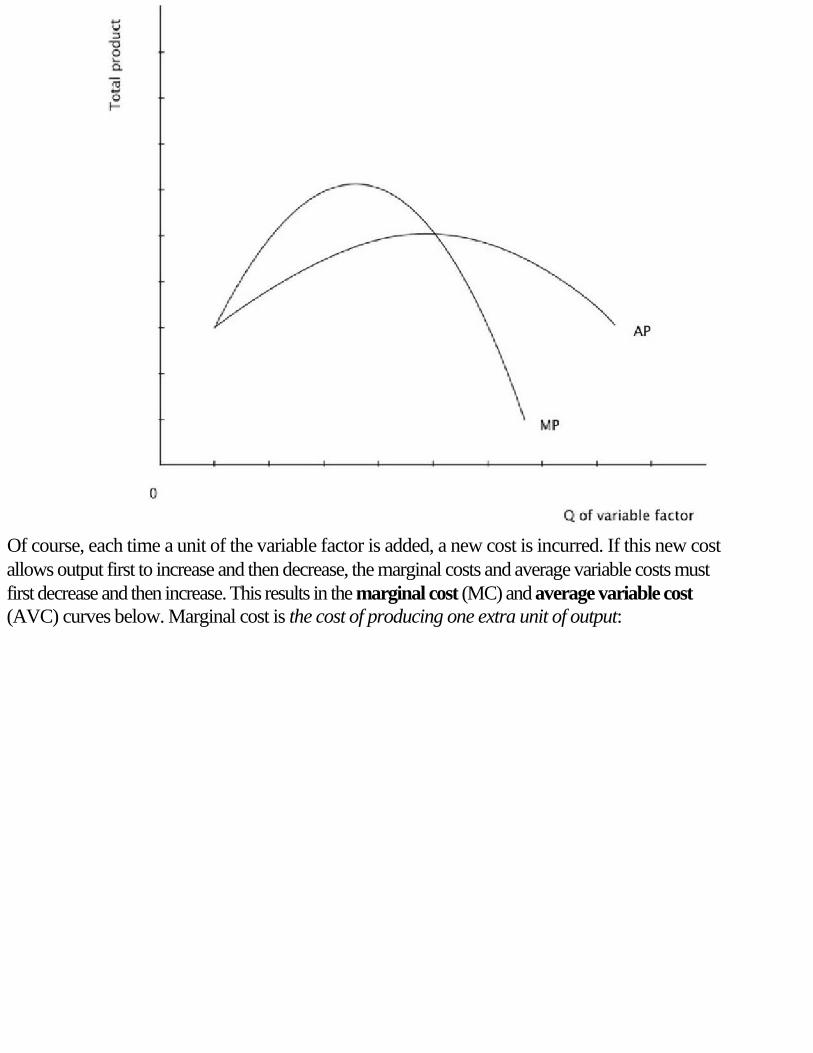
Of course, each time a unit of the variable factor is added, a new cost is incurred. If this new cost
allows output first to increase and then decrease, the marginal costs and average variable costs must
first decrease and then increase. This results in the marginal cost (MC) and average variable cost
(AVC) curves below. Marginal cost is the cost of producing one extra unit of output:
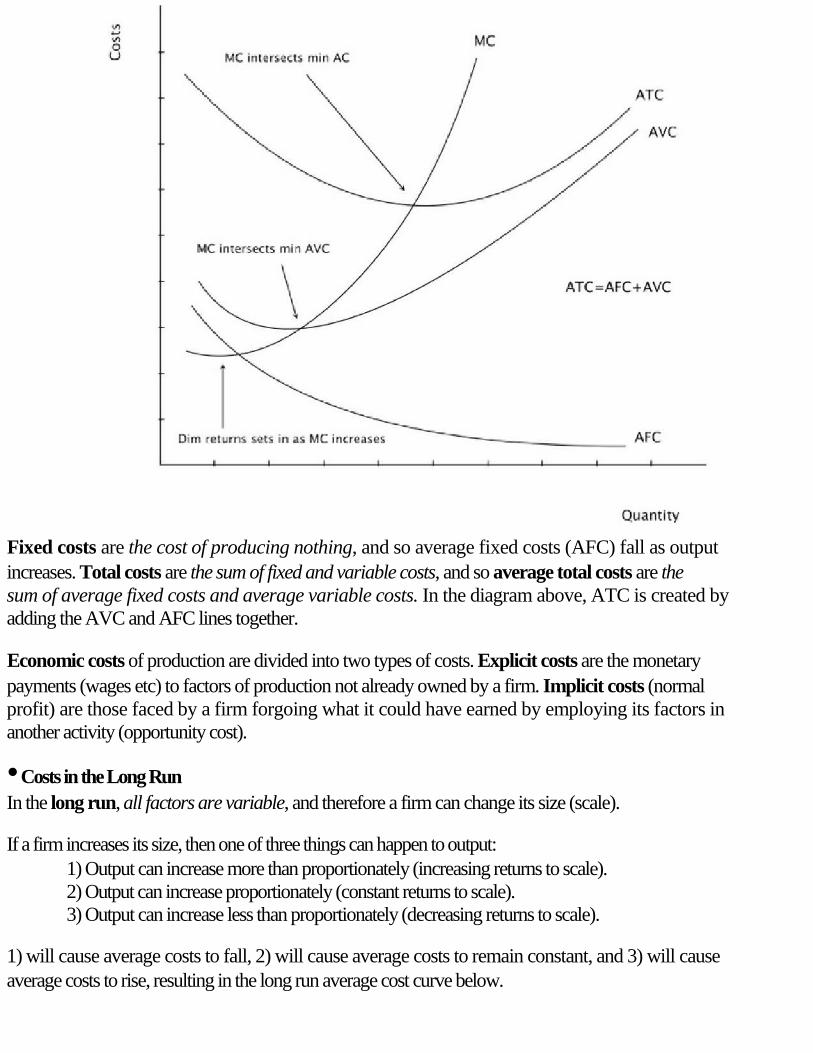
Fixed costs are the cost of producing nothing, and so average fixed costs (AFC) fall as output
increases. Total costs are the sum of fixed and variable costs, and so average total costs are the
sum of average fixed costs and average variable costs. In the diagram above, ATC is created by
adding the AVC and AFC lines together.
Economic costs of production are divided into two types of costs. Explicit costs are the monetary
payments (wages etc) to factors of production not already owned by a firm. Implicit costs (normal
profit) are those faced by a firm forgoing what it could have earned by employing its factors in
another activity (opportunity cost).
• Costs in the Long Run
In the long run, all factors are variable, and therefore a firm can change its size (scale).
If a firm increases its size, then one of three things can happen to output:
1) Output can increase more than proportionately (increasing returns to scale).
2) Output can increase proportionately (constant returns to scale).
3) Output can increase less than proportionately (decreasing returns to scale).
1) will cause average costs to fall, 2) will cause average costs to remain constant, and 3) will cause
average costs to rise, resulting in the long run average cost curve below.
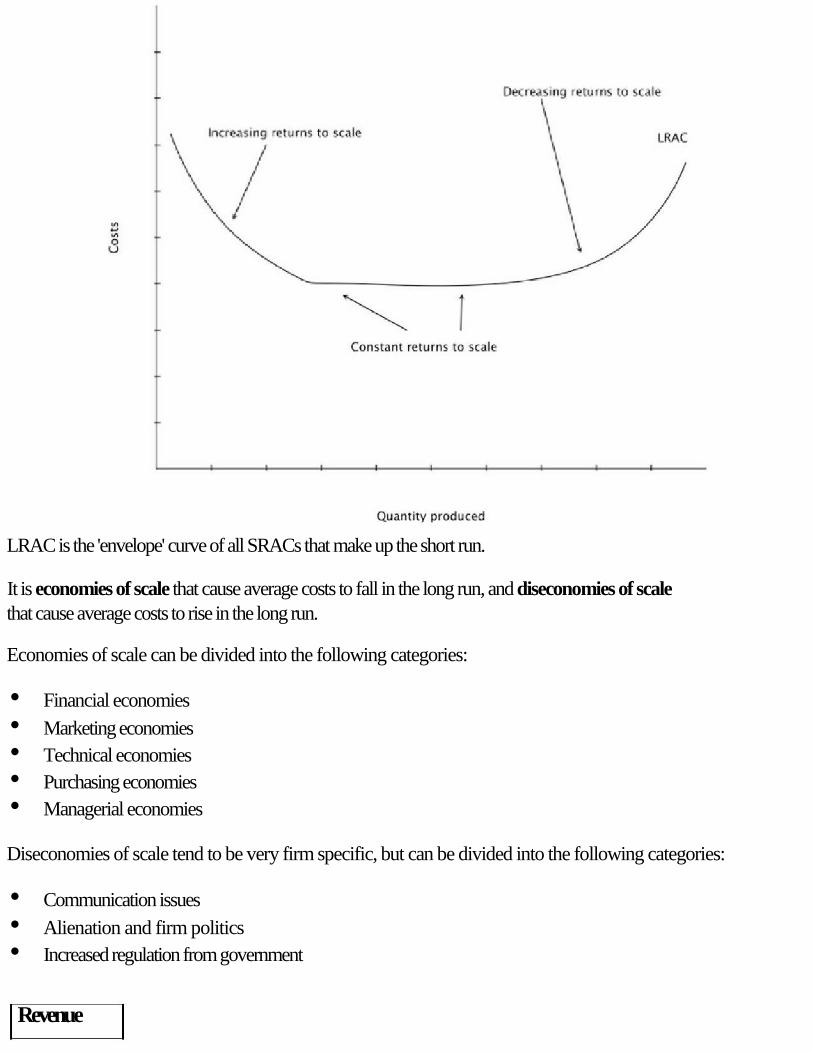
LRAC is the 'envelope' curve of all SRACs that make up the short run.
It is economies of scale that cause average costs to fall in the long run, and diseconomies of scale
that cause average costs to rise in the long run.
Economies of scale can be divided into the following categories:
• Financial economies
• Marketing economies
• Technical economies
• Purchasing economies
• Managerial economies
Diseconomies of scale tend to be very firm specific, but can be divided into the following categories:
• Communication issues
• Alienation and firm politics
• Increased regulation from government
Revenue
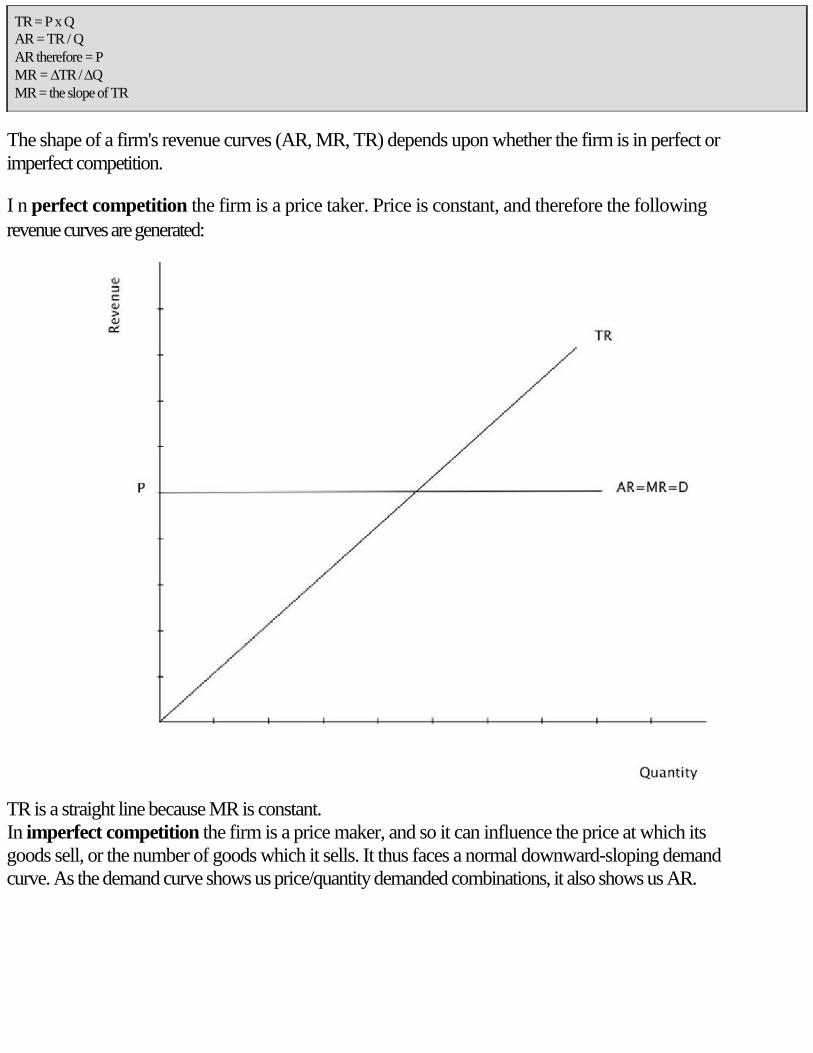
TR = P x Q AR = TR / Q AR therefore = P MR = TR / Q MR = the slope of TR
The shape of a firm's revenue curves (AR, MR, TR) depends upon whether the firm is in perfect or
imperfect competition.
I n perfect competition the firm is a price taker. Price is constant, and therefore the following
revenue curves are generated:
TR is a straight line because MR is constant.
In imperfect competition the firm is a price maker, and so it can influence the price at which its
goods sell, or the number of goods which it sells. It thus faces a normal downward-sloping demand
curve. As the demand curve shows us price/quantity demanded combinations, it also shows us AR.
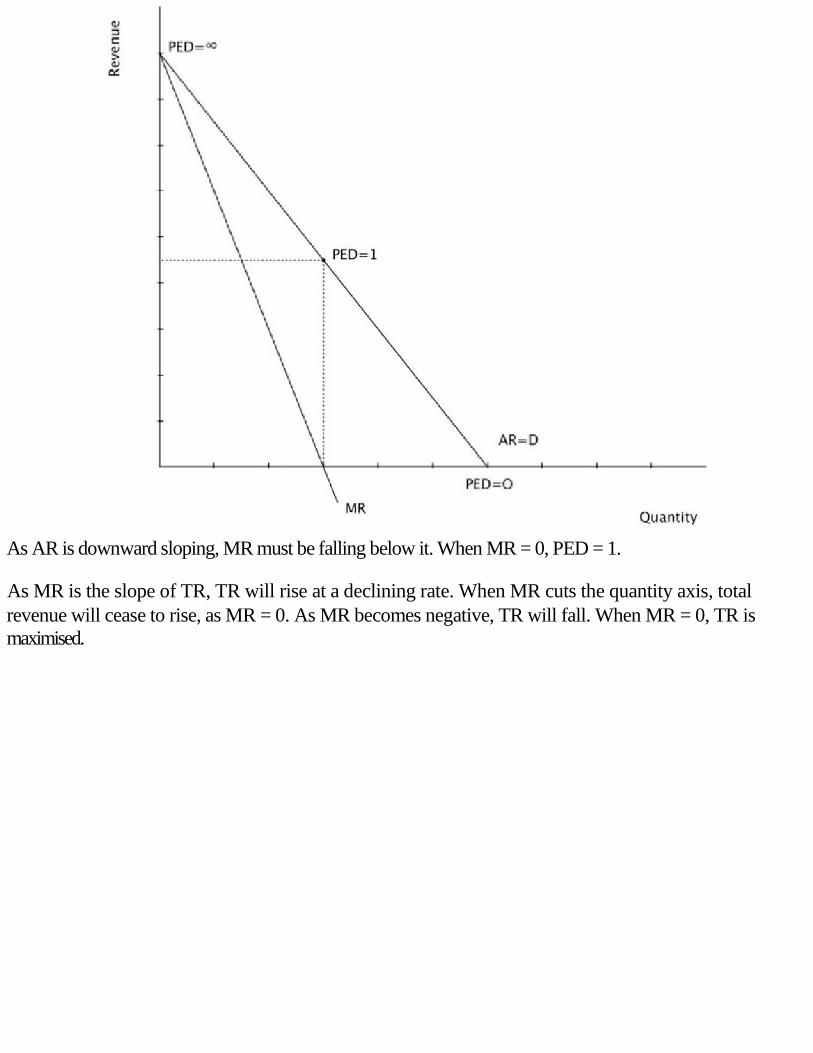
As AR is downward sloping, MR must be falling below it. When MR = 0, PED = 1.
As MR is the slope of TR, TR will rise at a declining rate. When MR cuts the quantity axis, total
revenue will cease to rise, as MR = 0. As MR becomes negative, TR will fall. When MR = 0, TR is
maximised.
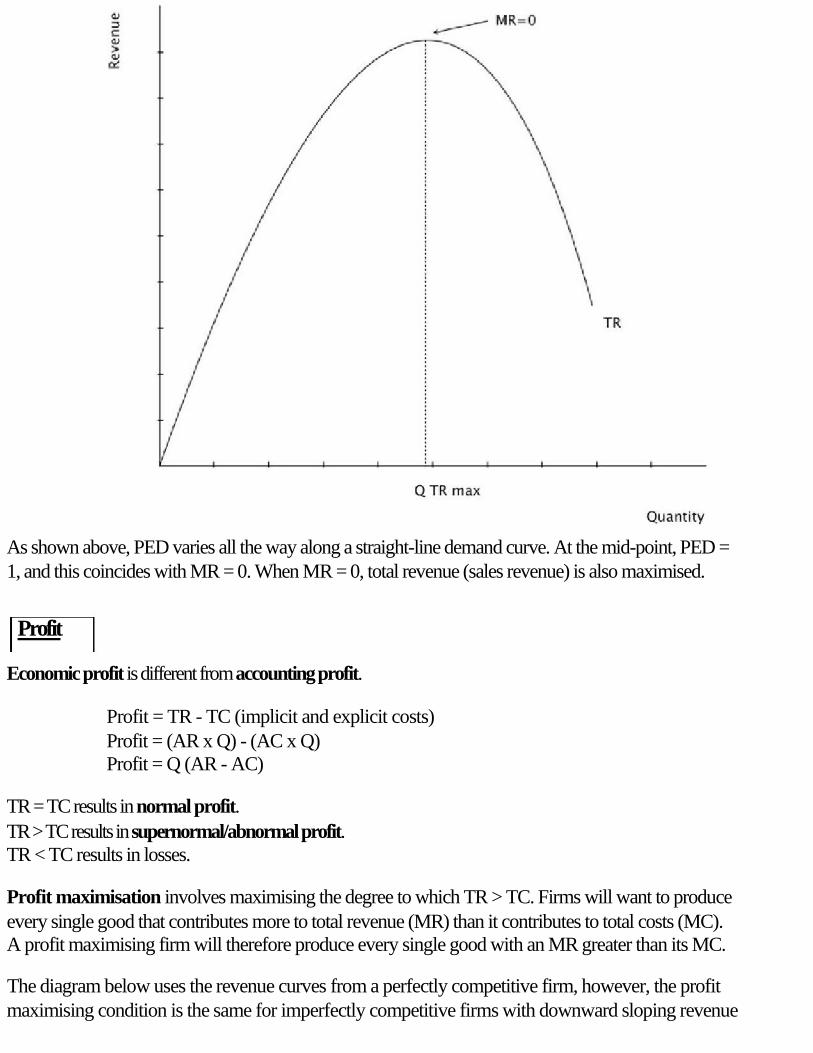
As shown above, PED varies all the way along a straight-line demand curve. At the mid-point, PED =
1, and this coincides with MR = 0. When MR = 0, total revenue (sales revenue) is also maximised.
Profit
Economic profit is different from accounting profit.
Profit = TR - TC (implicit and explicit costs)
Profit = (AR x Q) - (AC x Q)
Profit = Q (AR - AC)
TR = TC results in normal profit.
TR > TC results in supernormal/abnormal profit.
TR < TC results in losses.
Profit maximisation involves maximising the degree to which TR > TC. Firms will want to produce
every single good that contributes more to total revenue (MR) than it contributes to total costs (MC).
A profit maximising firm will therefore produce every single good with an MR greater than its MC.
The diagram below uses the revenue curves from a perfectly competitive firm, however, the profit
maximising condition is the same for imperfectly competitive firms with downward sloping revenue
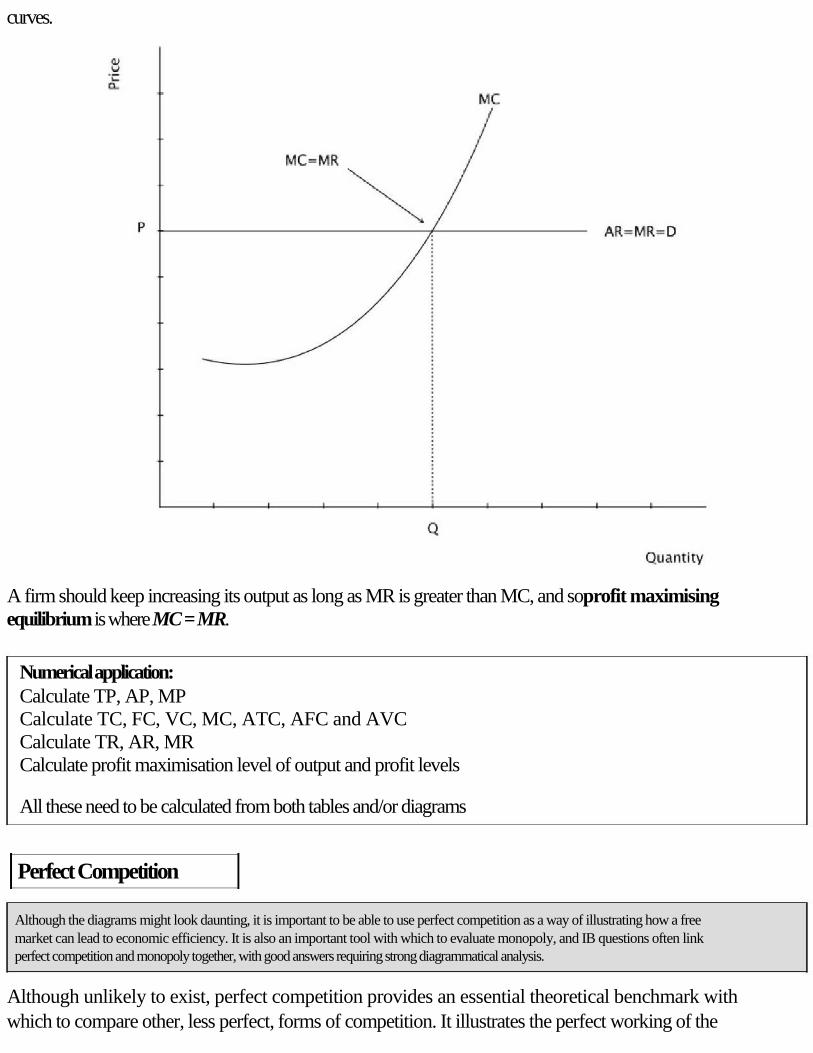
curves.
A firm should keep increasing its output as long as MR is greater than MC, and soprofit maximising
equilibrium is where MC = MR.
Numerical application:
Calculate TP, AP, MP
Calculate TC, FC, VC, MC, ATC, AFC and AVC
Calculate TR, AR, MR
Calculate profit maximisation level of output and profit levels
All these need to be calculated from both tables and/or diagrams
Perfect Competition
Although the diagrams might look daunting, it is important to be able to use perfect competition as a way of illustrating how a free
market can lead to economic efficiency. It is also an important tool with which to evaluate monopoly, and IB questions often link perfect competition and monopoly together, with good answers requiring strong diagrammatical analysis.
Although unlikely to exist, perfect competition provides an essential theoretical benchmark with
which to compare other, less perfect, forms of competition. It illustrates the perfect working of the
price mechanism. It is based on the following assumptions:
• Perfect knowledge
• A large number of small firms
• Freedom of entry and exit
• Homogeneous product
• Profit maximisation
Because of these assumptions, firms are price takers from the market equilibrium. Firms cannot sell
at a higher price and would be irrational to sell at a lower price, as they would not sell a greater
quantity:
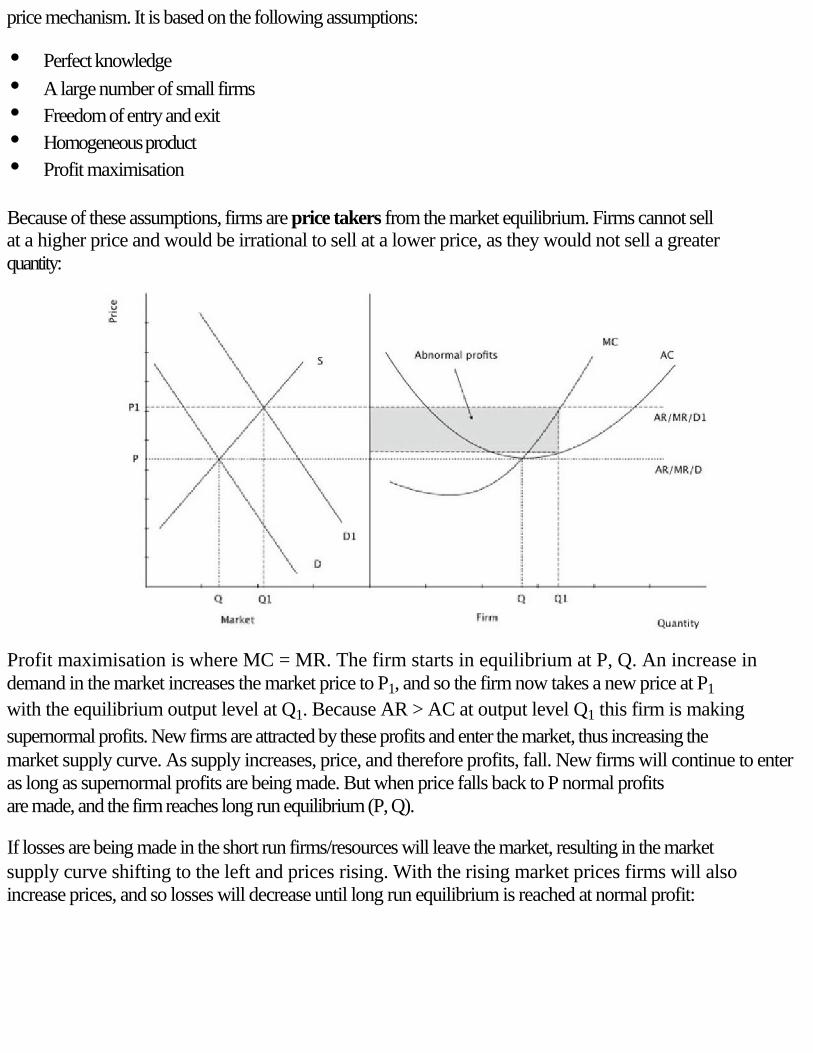
Profit maximisation is where MC = MR. The firm starts in equilibrium at P, Q. An increase in
demand in the market increases the market price to P1, and so the firm now takes a new price at P1
with the equilibrium output level at Q1. Because AR > AC at output level Q1 this firm is making
supernormal profits. New firms are attracted by these profits and enter the market, thus increasing the
market supply curve. As supply increases, price, and therefore profits, fall. New firms will continue to enter
as long as supernormal profits are being made. But when price falls back to P normal profits
are made, and the firm reaches long run equilibrium (P, Q).
If losses are being made in the short run firms/resources will leave the market, resulting in the market
supply curve shifting to the left and prices rising. With the rising market prices firms will also
increase prices, and so losses will decrease until long run equilibrium is reached at normal profit:
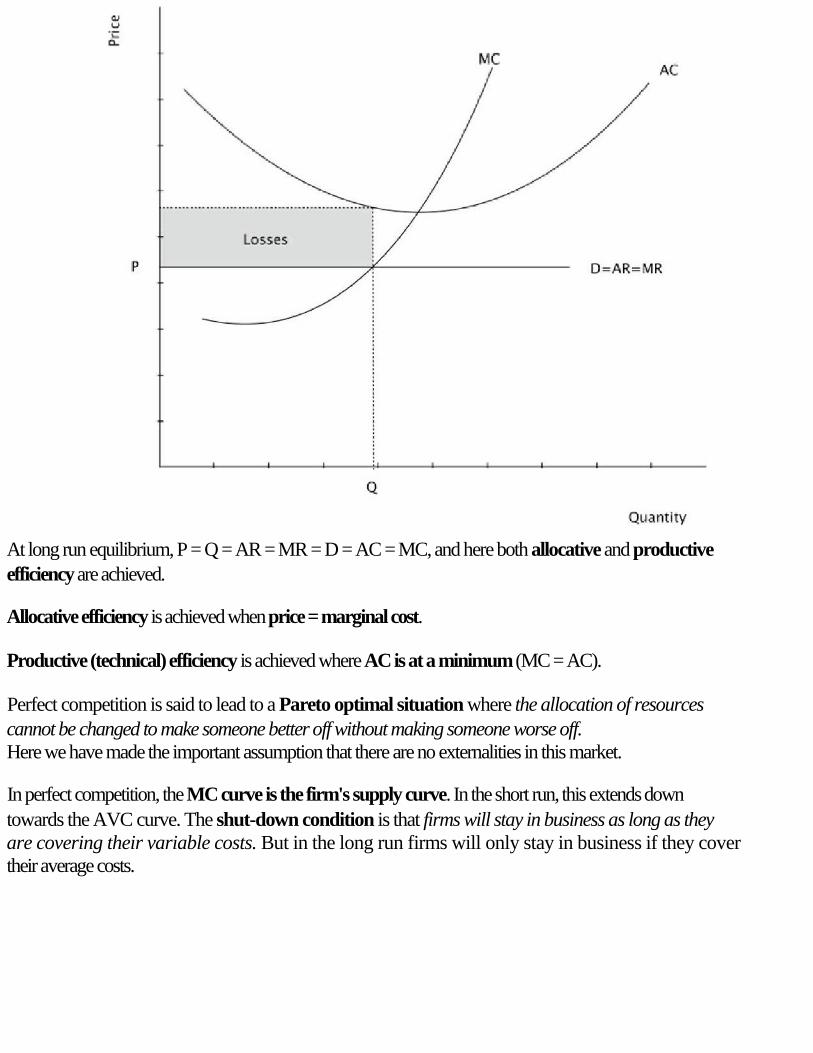
At long run equilibrium, P = Q = AR = MR = D = AC = MC, and here both allocative and productive
efficiency are achieved.
Allocative efficiency is achieved when price = marginal cost.
Productive (technical) efficiency is achieved where AC is at a minimum (MC = AC).
Perfect competition is said to lead to a Pareto optimal situation where the allocation of resources
cannot be changed to make someone better off without making someone worse off.
Here we have made the important assumption that there are no externalities in this market.
In perfect competition, the MC curve is the firm's supply curve. In the short run, this extends down
towards the AVC curve. The shut-down condition is that firms will stay in business as long as they
are covering their variable costs. But in the long run firms will only stay in business if they cover
their average costs.
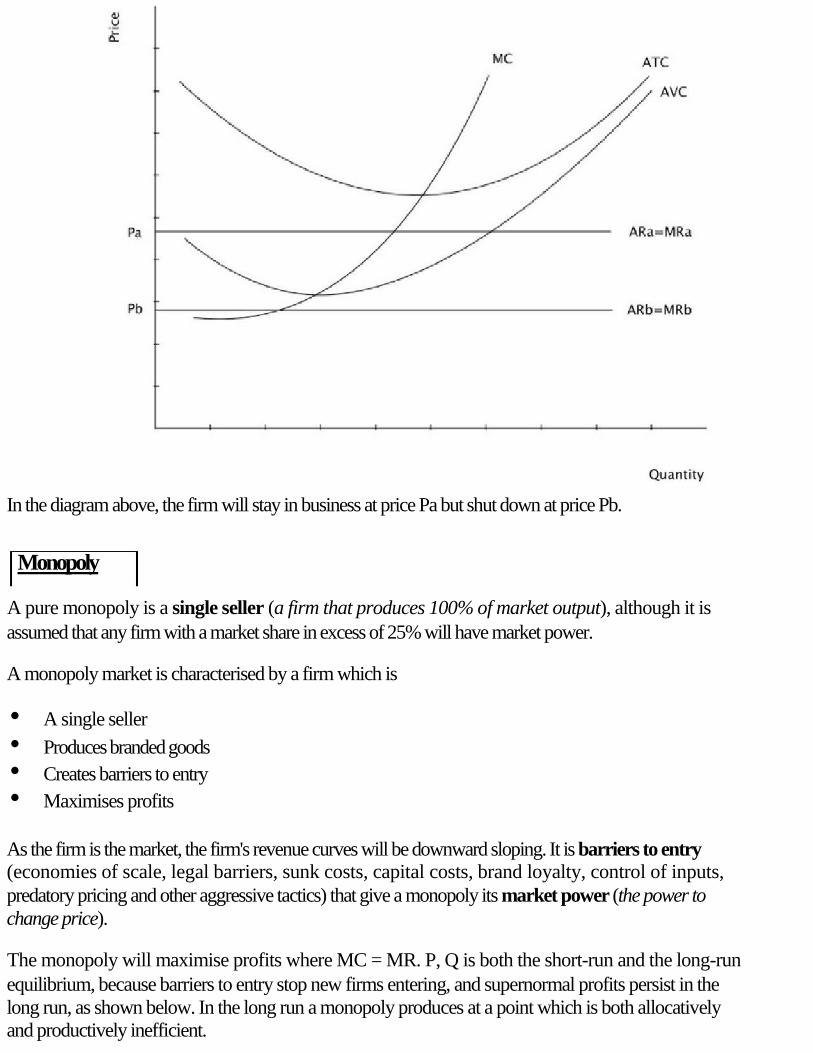
In the diagram above, the firm will stay in business at price Pa but shut down at price Pb.
Monopoly
A pure monopoly is a single seller (a firm that produces 100% of market output), although it is
assumed that any firm with a market share in excess of 25% will have market power.
A monopoly market is characterised by a firm which is
• A single seller
• Produces branded goods
• Creates barriers to entry
• Maximises profits
As the firm is the market, the firm's revenue curves will be downward sloping. It is barriers to entry
(economies of scale, legal barriers, sunk costs, capital costs, brand loyalty, control of inputs,
predatory pricing and other aggressive tactics) that give a monopoly its market power (the power to
change price).
The monopoly will maximise profits where MC = MR. P, Q is both the short-run and the long-run
equilibrium, because barriers to entry stop new firms entering, and supernormal profits persist in the
long run, as shown below. In the long run a monopoly produces at a point which is both allocatively
and productively inefficient.

P > MC. Consumers are willing to pay a price higher than it costs to produce the product. In perfect
competition, output would increase, so P = MC.
Q is not at minimum average cost. The monopoly is not using the most efficient combination of
factors.
A monopoly is assumed to be "bad" because it is both allocatively and productively inefficient, and
because it increases prices and reduces output.
A monopoly aiming to maximise total revenue will produce where MR = 0.
A monopoly aiming to maximise output will produce where AR = AC.
The diagram below illustrates different potential output levels for a monopolist, depending upon its
goals.
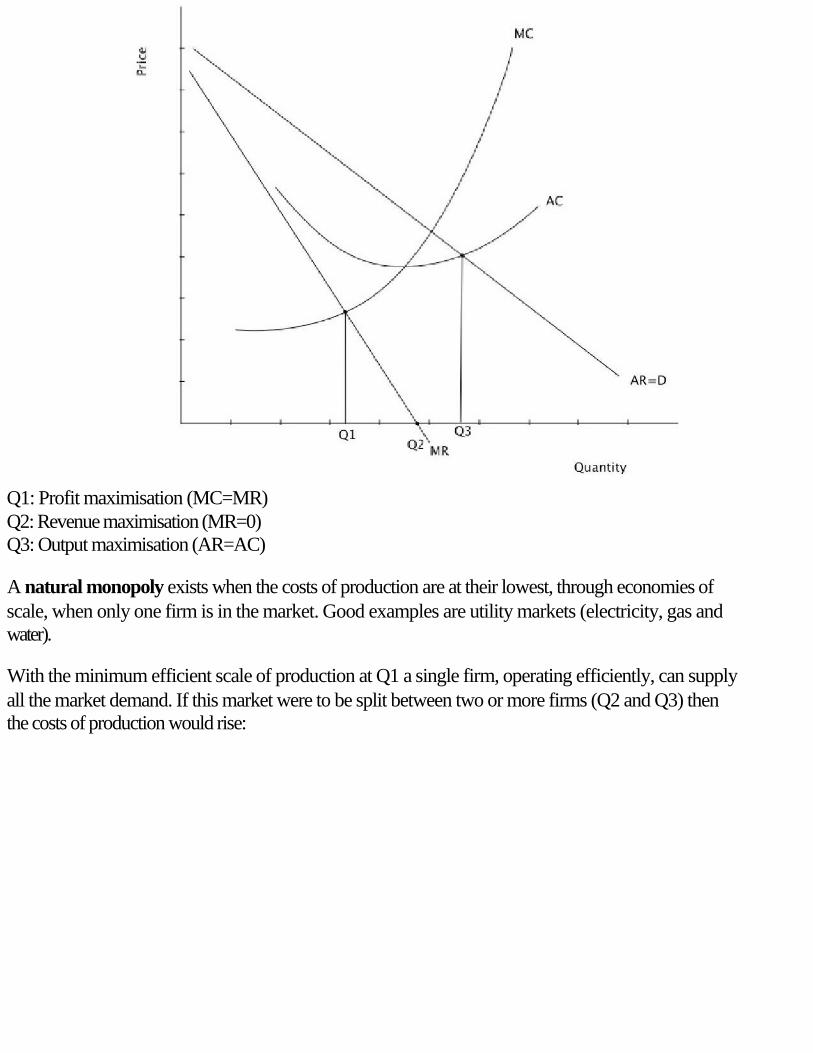
Q1: Profit maximisation (MC=MR)
Q2: Revenue maximisation (MR=0)
Q3: Output maximisation (AR=AC)
A natural monopoly exists when the costs of production are at their lowest, through economies of
scale, when only one firm is in the market. Good examples are utility markets (electricity, gas and
water).
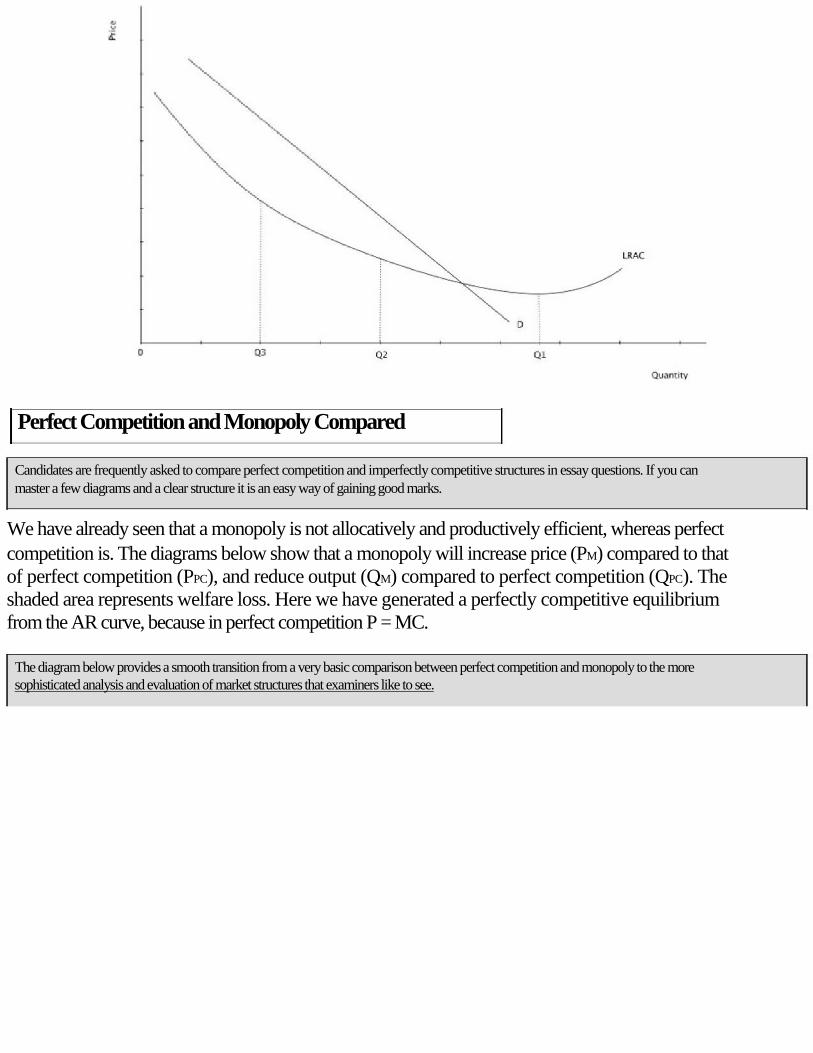
With the minimum efficient scale of production at Q1 a single firm, operating efficiently, can supply
all the market demand. If this market were to be split between two or more firms (Q2 and Q3) then
the costs of production would rise:
Perfect Competition and Monopoly Compared
Candidates are frequently asked to compare perfect competition and imperfectly competitive structures in essay questions. If you can
master a few diagrams and a clear structure it is an easy way of gaining good marks.
We have already seen that a monopoly is not allocatively and productively efficient, whereas perfect
competition is. The diagrams below show that a monopoly will increase price (PM) compared to that
of perfect competition (PPC), and reduce output (QM) compared to perfect competition (QPC). The
shaded area represents welfare loss. Here we have generated a perfectly competitive equilibrium
from the AR curve, because in perfect competition P = MC.
The diagram below provides a smooth transition from a very basic comparison between perfect competition and monopoly to the more sophisticated analysis and evaluation of market structures that examiners like to see.
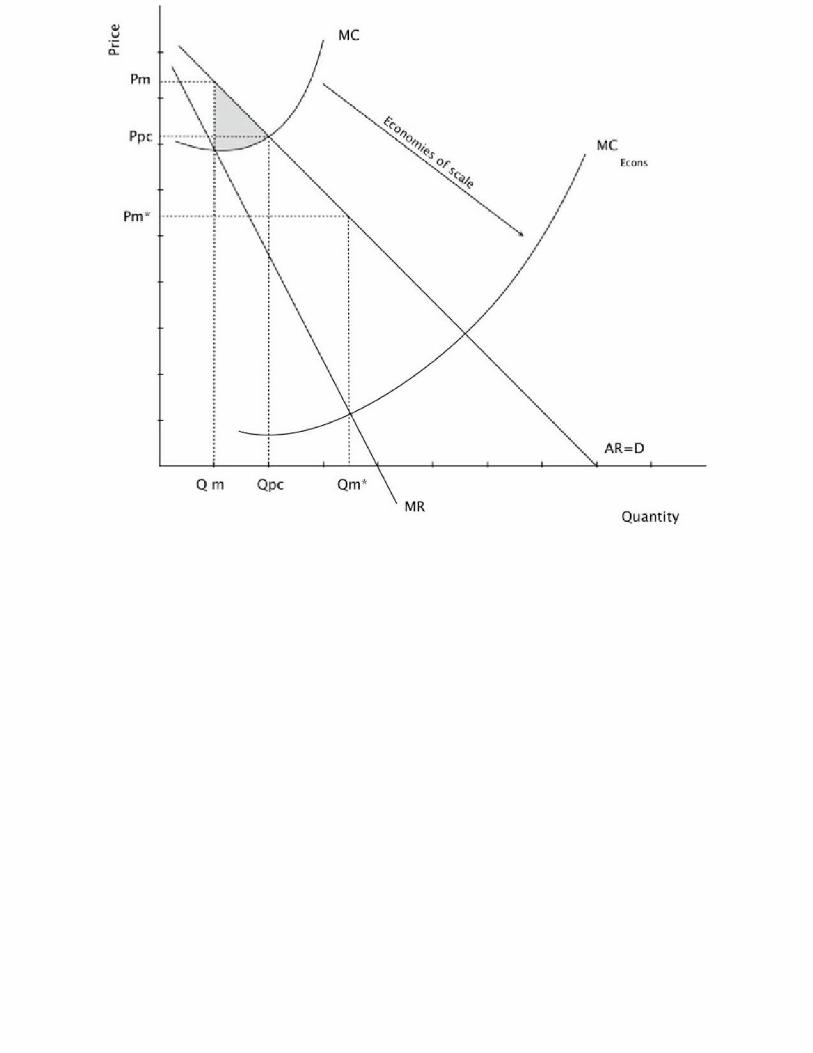

But this initial comparison using MC is flawed. We have assumed the same cost conditions for both
firms, and a monopoly is likely to be able to benefit from economies of scale, thus reducing marginal
costs to MCEcons. If the monopoly can reduce marginal costs far enough, it might be able to produce a
level of output QM* that is greater than QPC and reduce price PM* below PPC.
It is important that you are able to discuss firms in terms of their market power and their impact on efficiency. A good candidate will be able to analyse and evaluate these concepts in a way which takes into account the impact a firm might have on different stakeholders.
There are other reasons why a monopoly may be beneficial:
• Supernormal profits may be used for Research and Development
• Monopolies may be beneficial for both employment and export, and tax revenues
• "Creative destruction"
Monopolistic Competition
Here the assumptions are now differentiated products, relatively free entry and exit for firms and a
relatively large number of firms (in comparison to monopoly). Although the market is still very
competitive, firms now have the ability to set prices. New firms are attracted by abnormal profits (as
a shown in the diagram below) and so long-run equilibrium exists when only normal profits exist.
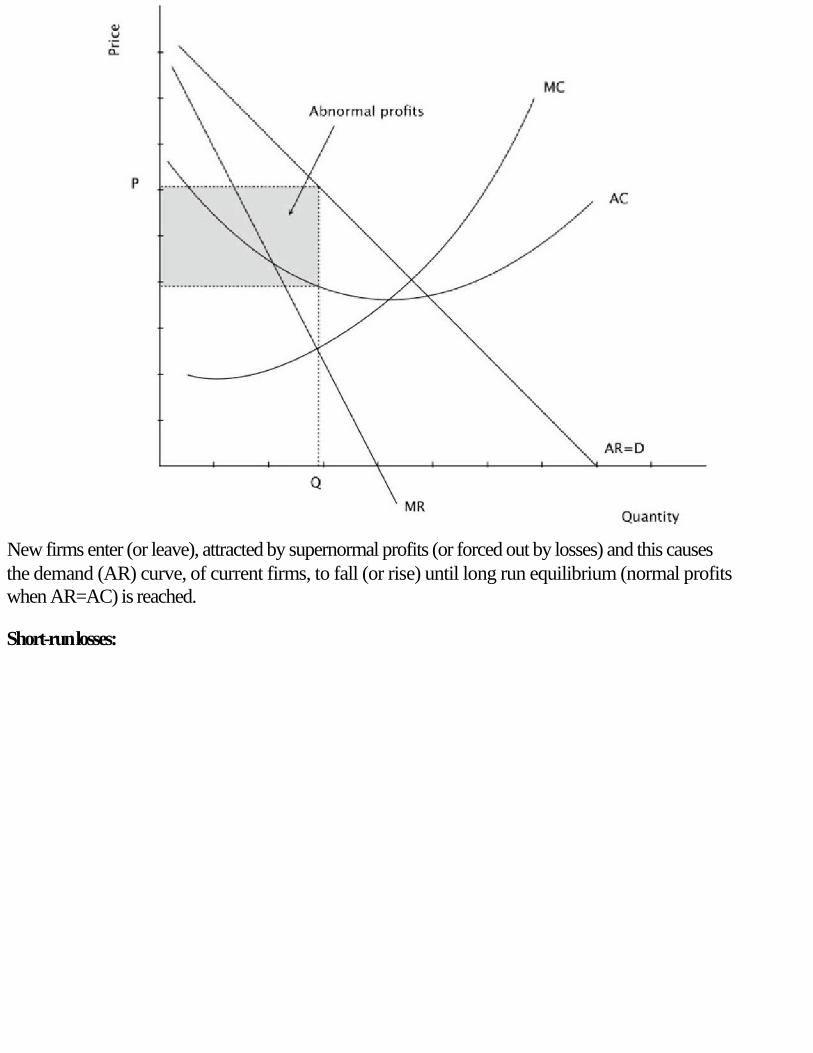
New firms enter (or leave), attracted by supernormal profits (or forced out by losses) and this causes
the demand (AR) curve, of current firms, to fall (or rise) until long run equilibrium (normal profits
when AR=AC) is reached.
Short-run losses:
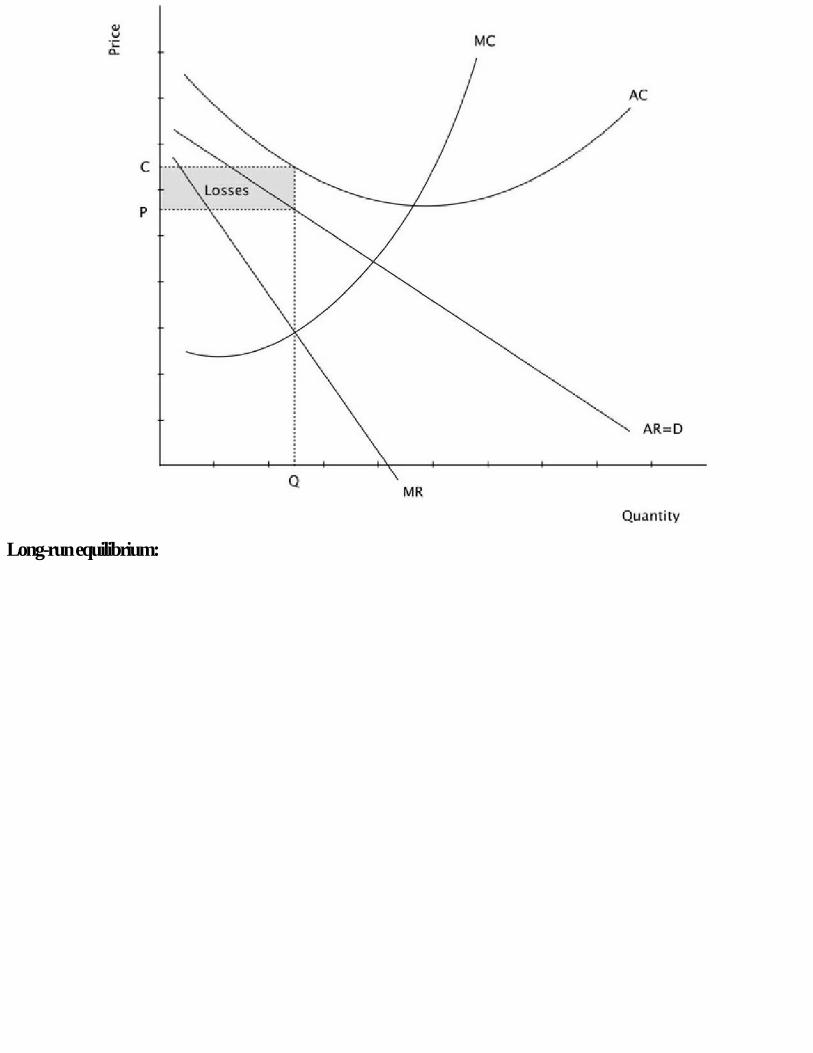
Long-run equilibrium:
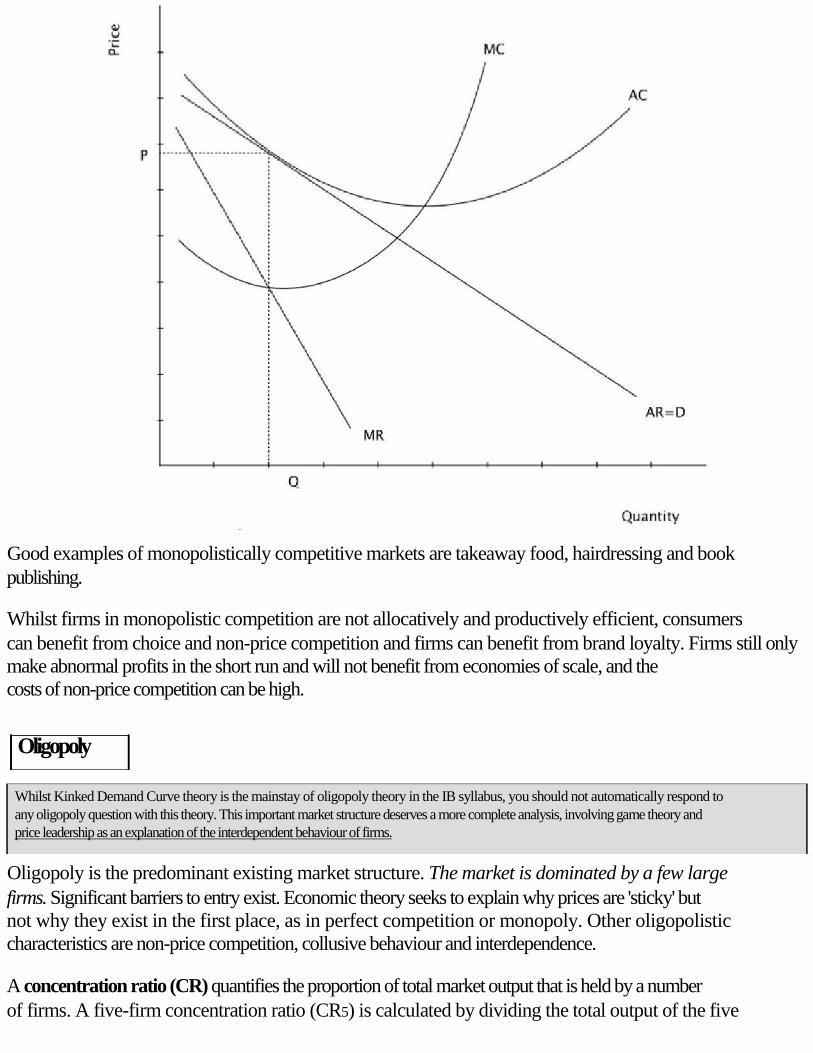
Good examples of monopolistically competitive markets are takeaway food, hairdressing and book
publishing.
Whilst firms in monopolistic competition are not allocatively and productively efficient, consumers
can benefit from choice and non-price competition and firms can benefit from brand loyalty. Firms still only
make abnormal profits in the short run and will not benefit from economies of scale, and the
costs of non-price competition can be high.
Oligopoly
Whilst Kinked Demand Curve theory is the mainstay of oligopoly theory in the IB syllabus, you should not automatically respond to
any oligopoly question with this theory. This important market structure deserves a more complete analysis, involving game theory and price leadership as an explanation of the interdependent behaviour of firms.
Oligopoly is the predominant existing market structure. The market is dominated by a few large
firms. Significant barriers to entry exist. Economic theory seeks to explain why prices are 'sticky' but
not why they exist in the first place, as in perfect competition or monopoly. Other oligopolistic
characteristics are non-price competition, collusive behaviour and interdependence.
A concentration ratio (CR) quantifies the proportion of total market output that is held by a number
of firms. A five-firm concentration ratio (CR5) is calculated by dividing the total output of the five
largest firms in a given market by the aggregate output of that market. The larger the ratio the more
concentrated the market and so the closer to monopoly. A CR of 50-80% (medium CR) would indicate
an oligopolistic market and anything of 80% and above (high CR) would indicate a
monopoly market.
Oligopoly models are divided into collusive and non-collusive models. If you are required to
analyse/evaluate a collusive oligopoly then use the monopoly model as this is when firms have a
formal or informal ('tacit) agreement to limit competition and raise prices. In non-collusive
markets firms do not 'cooperate' and so they have to develop strategies to cope with their
interdependence. Here the Kinked Demand Curve model, game theory and price leadership can be
used to explain their behaviour.
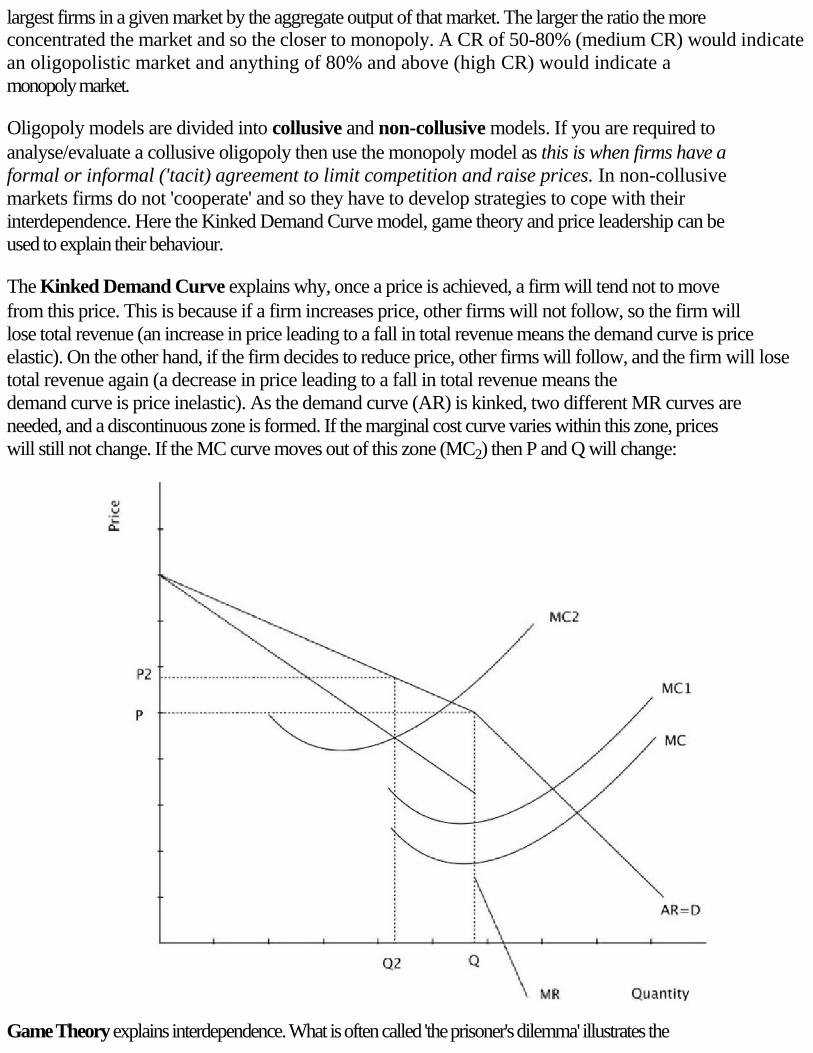
The Kinked Demand Curve explains why, once a price is achieved, a firm will tend not to move
from this price. This is because if a firm increases price, other firms will not follow, so the firm will
lose total revenue (an increase in price leading to a fall in total revenue means the demand curve is price
elastic). On the other hand, if the firm decides to reduce price, other firms will follow, and the firm will lose
total revenue again (a decrease in price leading to a fall in total revenue means the
demand curve is price inelastic). As the demand curve (AR) is kinked, two different MR curves are
needed, and a discontinuous zone is formed. If the marginal cost curve varies within this zone, prices
will still not change. If the MC curve moves out of this zone (MC2) then P and Q will change:
Game Theory explains interdependence. What is often called 'the prisoner's dilemma' illustrates the
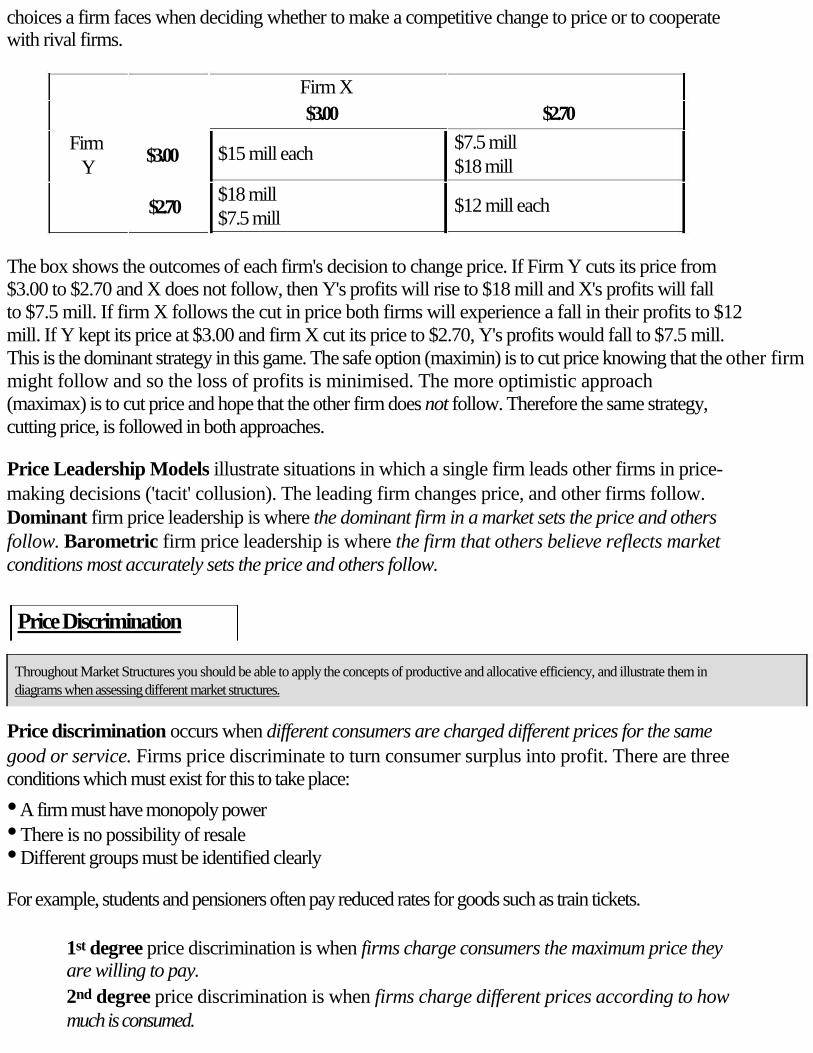
choices a firm faces when deciding whether to make a competitive change to price or to cooperate
with rival firms.
Firm X
$3.00 $2.70
Firm
Y
$3.00
$2.70
$15 mill each
$18 mill
$7.5 mill
$7.5 mill
$18 mill
$12 mill each
The box shows the outcomes of each firm's decision to change price. If Firm Y cuts its price from
$3.00 to $2.70 and X does not follow, then Y's profits will rise to $18 mill and X's profits will fall
to $7.5 mill. If firm X follows the cut in price both firms will experience a fall in their profits to $12
mill. If Y kept its price at $3.00 and firm X cut its price to $2.70, Y's profits would fall to $7.5 mill.
This is the dominant strategy in this game. The safe option (maximin) is to cut price knowing that the other firm
might follow and so the loss of profits is minimised. The more optimistic approach
(maximax) is to cut price and hope that the other firm does not follow. Therefore the same strategy,
cutting price, is followed in both approaches.
Price Leadership Models illustrate situations in which a single firm leads other firms in price-
making decisions ('tacit' collusion). The leading firm changes price, and other firms follow.
Dominant firm price leadership is where the dominant firm in a market sets the price and others
follow. Barometric firm price leadership is where the firm that others believe reflects market
conditions most accurately sets the price and others follow.
Price Discrimination
Throughout Market Structures you should be able to apply the concepts of productive and allocative efficiency, and illustrate them in
diagrams when assessing different market structures.
Price discrimination occurs when different consumers are charged different prices for the same
good or service. Firms price discriminate to turn consumer surplus into profit. There are three
conditions which must exist for this to take place:
• A firm must have monopoly power
• There is no possibility of resale
• Different groups must be identified clearly
For example, students and pensioners often pay reduced rates for goods such as train tickets.
1st degree price discrimination is when firms charge consumers the maximum price they
are willing to pay.
2nd degree price discrimination is when firms charge different prices according to how
much is consumed.
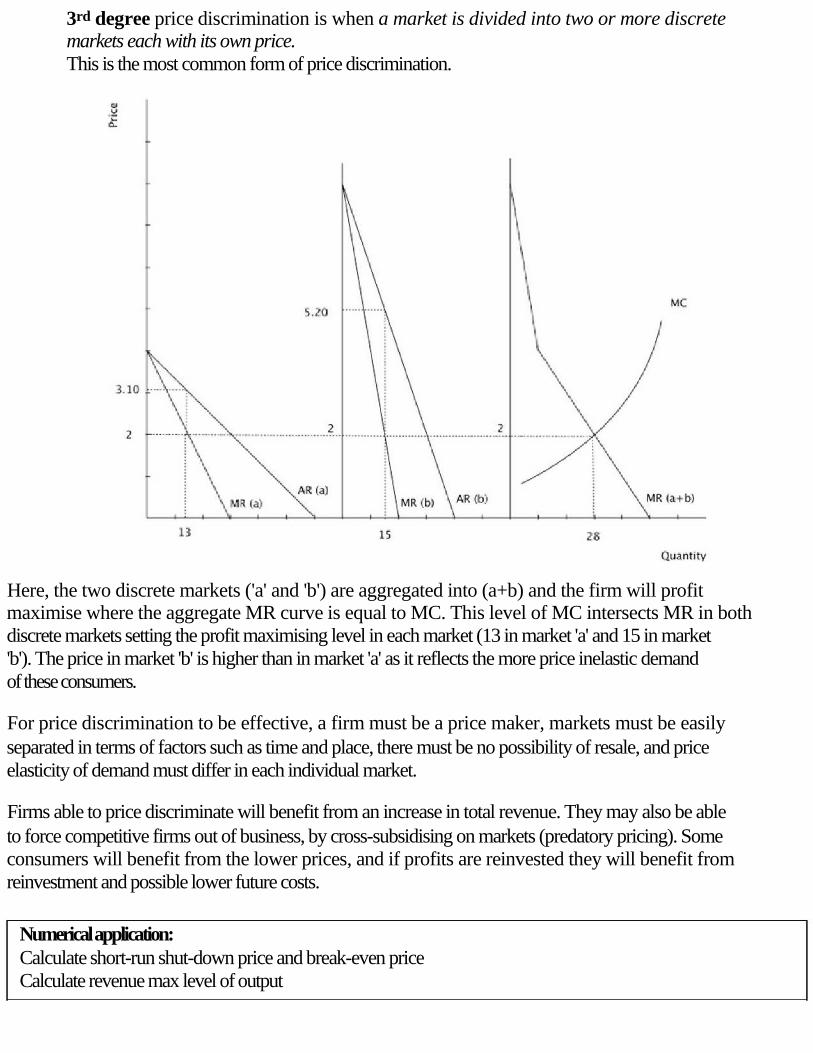
3rd degree price discrimination is when a market is divided into two or more discrete
markets each with its own price.
This is the most common form of price discrimination.
Here, the two discrete markets ('a' and 'b') are aggregated into (a+b) and the firm will profit
maximise where the aggregate MR curve is equal to MC. This level of MC intersects MR in both
discrete markets setting the profit maximising level in each market (13 in market 'a' and 15 in market
'b'). The price in market 'b' is higher than in market 'a' as it reflects the more price inelastic demand
of these consumers.
For price discrimination to be effective, a firm must be a price maker, markets must be easily
separated in terms of factors such as time and place, there must be no possibility of resale, and price
elasticity of demand must differ in each individual market.
Firms able to price discriminate will benefit from an increase in total revenue. They may also be able
to force competitive firms out of business, by cross-subsidising on markets (predatory pricing). Some
consumers will benefit from the lower prices, and if profits are reinvested they will benefit from
reinvestment and possible lower future costs.
Numerical application:
Calculate short-run shut-down price and break-even price
Calculate revenue max level of output
MARKET FAILURE AND GOVERNMENT RESPONSE
This is a very important part of the syllabus, and there are plenty of current real-world examples of market failure. Your exam will
contain questions on market failure, particularly on the short answer and essay paper. When writing about market failure it is important
that you are able to explain exactly why the market fails, and analyse the causes of these failures. Once failure has been explained,
cures or responses should not only be listed and described, but evaluated. For each type of market failure, can you complete the
sentence "the market fails because"? If you use this sentence and successfully complete it in your answer, you will have shown your examiner that you can analyse the causes of market failure.
Market Failure is any situation when the market mechanism fails to allocate scarce resources
efficiently. This is often seen as a rationale for government intervention. The main types of market
failure are:
• Negative and positive externalities of production and consumption
• Lack of public goods
• Merit and demerit goods
• Abuse of monopoly power
• Common access resources and sustainability
• Asymmetric information
You should also be aware of income and wealth inequality.
Externalities
Here the market fails because it fails to measure the true costs or benefits of production or
consumption. Externalities are the costs or benefits of production or consumption that are
experienced by third parties, but not by the producers and consumers who cause them.
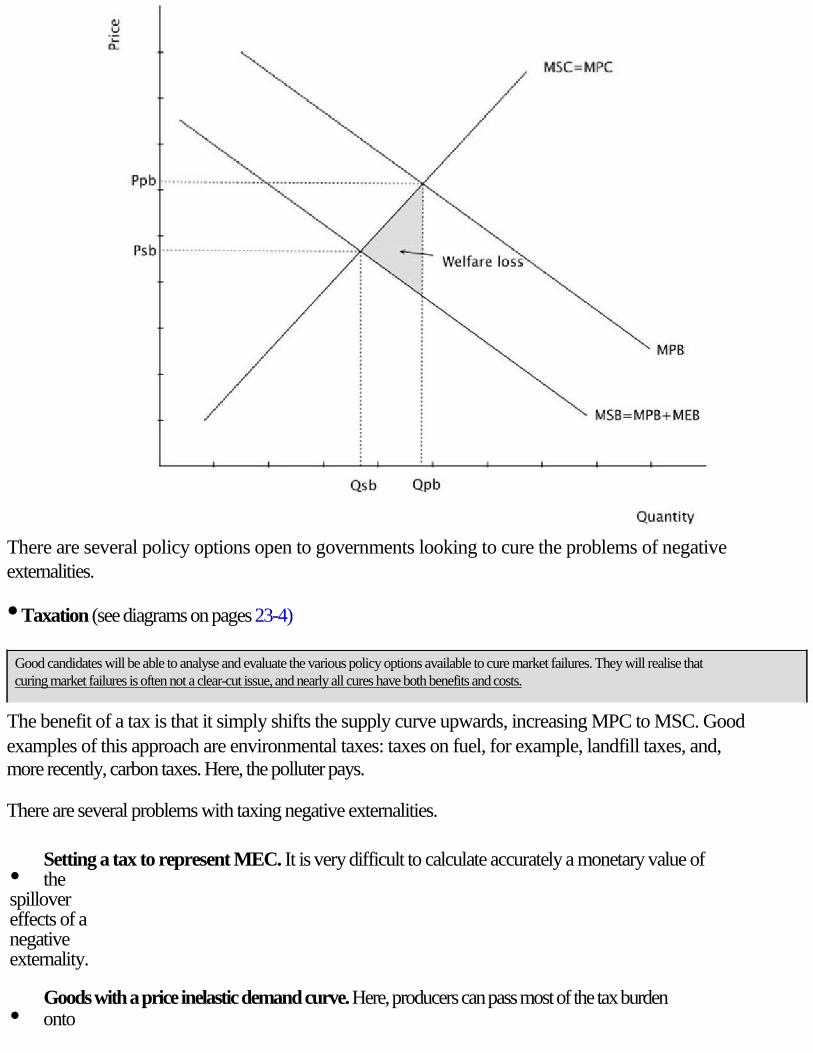
Negative externalities
Classic examples of negative externalities are any form of pollution and traffic congestion. They are
best illustrated as negative externalities from production (this will focus on the supply curve). Here,
the market fails to measure the true costs of production to society. In a free market the supply curve
measures the marginal private cost (MPC), but it fails to measure the marginal external cost
(MEC). The true cost to society, the marginal social cost (MSC), is equal to MPC + MEC. The
shaded area is welfare loss:

The free market equilibrium (where demand = supply, or marginal social benefit MSB = MPC),
results in both over-production and over-consumption of the good or service. In the diagram above,
this is output level QPC. If the market were to take into account the true costs of production, as shown
by the MSC curve, then output would be at QSC (socially optimal level). So here the free market has
failed to allocate resources efficiently, and has overproduced/consumed goods with negative
spillover effects.
The shaded area represents the welfare loss to society created by this overproduction. In the diagram
below, each good has a MSC that is greater than its MSB. In this example, we have assumed that
there is no positive externality in consumption, and therefore marginal private benefits are equal to
marginal social benefits.
There are several policy options open to governments looking to cure the problems of negative
externalities.
• Taxation (see diagrams on pages 23-4)
Good candidates will be able to analyse and evaluate the various policy options available to cure market failures. They will realise that curing market failures is often not a clear-cut issue, and nearly all cures have both benefits and costs.
The benefit of a tax is that it simply shifts the supply curve upwards, increasing MPC to MSC. Good
examples of this approach are environmental taxes: taxes on fuel, for example, landfill taxes, and,
more recently, carbon taxes. Here, the polluter pays.
There are several problems with taxing negative externalities.
Setting a tax to represent MEC. It is very difficult to calculate accurately a monetary value of
• the spillover effects of a negative externality.
Goods with a price inelastic demand curve. Here, producers can pass most of the tax burden • onto
consumers, and so output/consumption will not radically be reduced.
• The regressive nature of some taxation. Income inequality may be widened.
International competitiveness. If a country takes a unilateral action to tax negative • externalities, it may make its exports less competitive as prices rise.
• Optimal tax rates. High taxes might not reduce consumption at all, but create black markets and other illegal activities.
• Tradable Permits
Tradable permits are used to limit the negative activities of firms. These can vary from the emission
of polluting gases to the overfishing of the North Sea. The optimal level of pollution or production is
set by a government or regulatory body, and this total is then divided into individual firm permits to
pollute or produce. Firms are able both to buy and sell these permits. In the case of pollution, firms
have an obvious incentive to be environmentally efficient so they can sell their permits to other firms
(a very profitable activity). In the case of production permits, firms are allowed to maintain their
income while they are not producing (for example a North Sea trawler might be out of action through
repairs, but could still rent out their permits to other firms). Also, efficient producers can buy quotas
from less efficient firms to increase their output.
These tradable permits are presently one of the front-line responses to market failure.
• Regulation
Governments can intervene directly with measures such as quotas to set the optimal level of
production/consumption. Most firms today have to comply with minimum environmental
requirements. For example, building regulations in the UK stipulate minimum insulation requirements
for all new buildings.
There are several problems with regulation:
Setting a limit. It is very easy to over- or underestimate a limit that coincides with a socially
• efficient outcome.
• Costs of regulation. All forms of regulations are costly to administer and enforce.
Benefits greater than costs. Some firms will still not reduce pollution if the benefits from
• pollution are greater than the costs of doing so (fines).
• Extending property rights
Property rights are the legal right to own or to do something. If individuals have the legal right to
clean air, for example, and this right is easily and effectively enforced through the courts, then
polluting activities can be stopped, and/or financial recompense is available.
This approach is only effective in societies where property rights are easily enforced. This is often
not the case in many economically less developed economies and also many of the previously

centrally-planned economies.
• International co-operation
The 1997 United Nations pact signed at Kyoto required the major industrialised nations to make
meaningful reductions in greenhouse gas emissions. The EU's target was to cut 1990 emission levels
by 8% before 2010. In 2004 a report stated that only two countries (UK and Sweden) out of the then
15 would be able to meet these targets. Of course, the USA still refuses to sign up to the treaty and
this is a major blow to any international agreement to cut emissions. International agreements are
beset by political problems with the process of negotiation often taking some time. Policing of
agreements is very difficult and there are great incentives to 'cheat'. In October 2004 Russia agreed to ratify the
Kyoto agreement. Now 30 countries are committed to legally binding reductions in
greenhouse gasses (5% on 1990 levels).
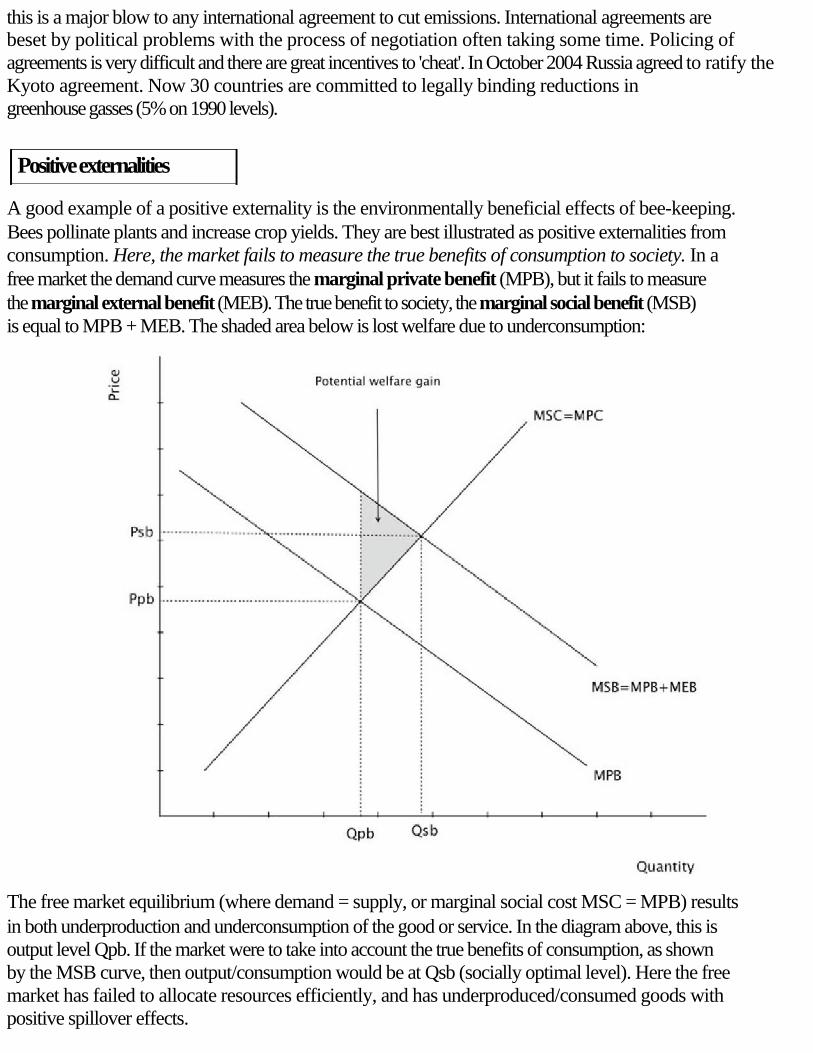
Positive externalities
A good example of a positive externality is the environmentally beneficial effects of bee-keeping.
Bees pollinate plants and increase crop yields. They are best illustrated as positive externalities from
consumption. Here, the market fails to measure the true benefits of consumption to society. In a
free market the demand curve measures the marginal private benefit (MPB), but it fails to measure
the marginal external benefit (MEB). The true benefit to society, the marginal social benefit (MSB)
is equal to MPB + MEB. The shaded area below is lost welfare due to underconsumption:
The free market equilibrium (where demand = supply, or marginal social cost MSC = MPB) results
in both underproduction and underconsumption of the good or service. In the diagram above, this is
output level Qpb. If the market were to take into account the true benefits of consumption, as shown
by the MSB curve, then output/consumption would be at Qsb (socially optimal level). Here the free
market has failed to allocate resources efficiently, and has underproduced/consumed goods with
positive spillover effects.
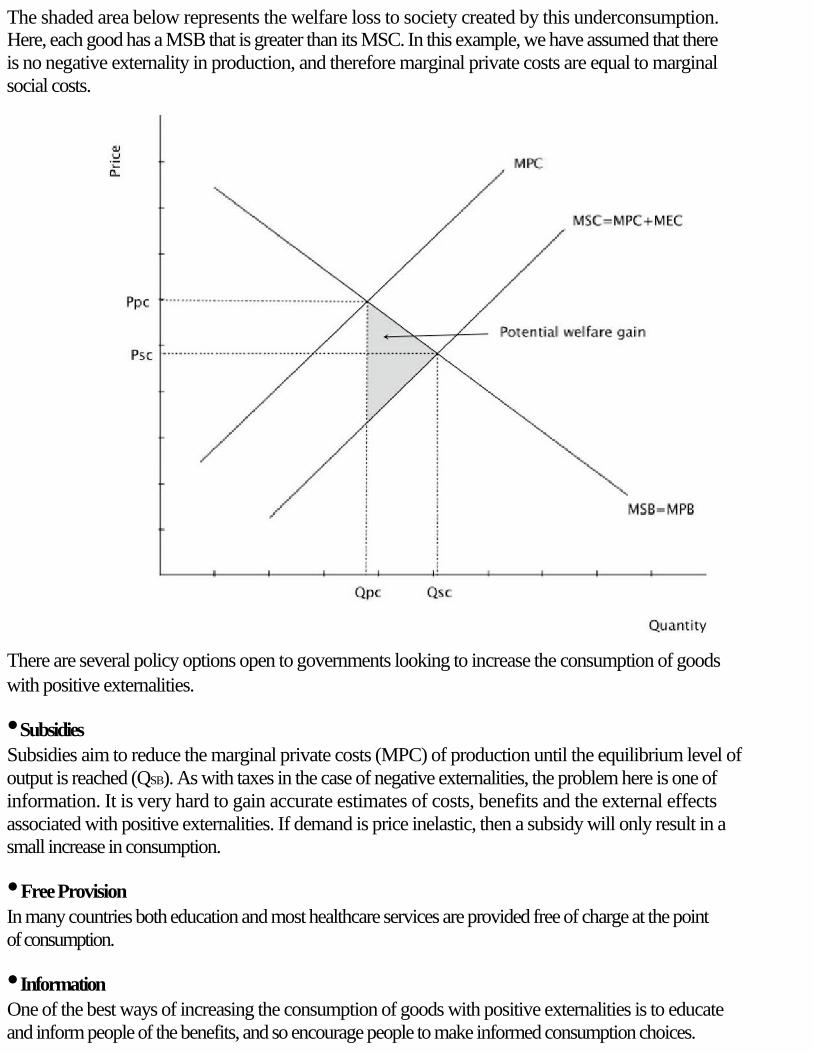
The shaded area below represents the welfare loss to society created by this underconsumption.
Here, each good has a MSB that is greater than its MSC. In this example, we have assumed that there
is no negative externality in production, and therefore marginal private costs are equal to marginal
social costs.
There are several policy options open to governments looking to increase the consumption of goods
with positive externalities.
• Subsidies
Subsidies aim to reduce the marginal private costs (MPC) of production until the equilibrium level of
output is reached (QSB). As with taxes in the case of negative externalities, the problem here is one of
information. It is very hard to gain accurate estimates of costs, benefits and the external effects
associated with positive externalities. If demand is price inelastic, then a subsidy will only result in a
small increase in consumption.
• Free Provision
In many countries both education and most healthcare services are provided free of charge at the point
of consumption.
• Information
One of the best ways of increasing the consumption of goods with positive externalities is to educate
and inform people of the benefits, and so encourage people to make informed consumption choices.
Public Goods
Here the market fails because the key features of public goods are non-excludability and non-rivalry
in consumption.
Non-excludability means that even if you have paid for a good you cannot confine its use to
y our s e l f .
Non-rivalry means that the consumption of a good does not reduce its availability to others.
Good examples of public goods are national defence and street-lighting.
In a free market, public goods would not be provided because of the two above features, and because
individuals could free-ride on others' consumption.
Merit and Demerit Goods
It is important that you do not automatically assume that merit goods are goods with positive externalities and vice versa, and that
demerit goods are goods with negative externalities and vice versa. This is an area in which candidates often muddle their definitions.
Here the market fails because consumers make choices which society defines as wrong. In the case of
merit goods, consumers consume too few goods and services that are seen as being good for them
(like education, art galleries). In the case of demerit goods, consumers consume too many goods
and services that are seen as being bad for them (alcohol and cigarettes, for example). Merit goods can also
(but not always) have positive externalities. Demerit goods can also (but not always) have
negative externalities.
If merit and demerit goods do have externalities, then the cures mentioned above can be used. But
education and information are very valid approaches, as consumer choices are at the heart of the
failure of the market mechanism.
Monopoly Power
Along with externalities, this is the key area of market failure on which exams focus. You should be prepared to answer both short answer and essay questions on monopolies and the comparison of monopoly with other market forms, especially perfect competition. Whilst the diagrammatic analysis is both detailed and complex, it is a very well-structured part of the syllabus. With some careful planning, therefore, you should be able to produce well-directed written answers to examination questions.
A detailed diagrammatic analysis of market power is undertaken in the Market Structures
section of this Revision Guide.
Here the market fails because monopolies (single sellers, or firms with 100% market share) erect
barriers to entry, preventing competition. These barriers enable them to develop market power (the
ability to increase prices). Monopolies will tend to result in both higher prices and lower output, and
a decrease in economic efficiency (with prices greater than market cost and output not produced at
minimum average cost), although, as we shall see later on, this might not necessarily always be the
cas e.
There are a wide variety of cures for market power open to government:
• Banning
The formation of monopolies can be banned and existing monopolies split up. This is the approach
taken by the Sherman Act in America.
• Investigation and Regulation
Most countries have organisations that investigate concentrating markets (in the UK this is the
Competition Commission in combination with the Office of Fair Trading). These organisations make
decisions about whether or not mergers/takeovers/monopolies are in the public interest. They also
investigate trading practices. Recent examples include the concentration of UK supermarkets, concern over the
actions of Microsoft in America, and the EU competition ruling on the production of vitamin
supplements. The powers that individual regulatory organisations have vary widely from country to
country (from fines to prison sentences).
• Regulation of Privatised Industries
Most economies have privatised some or many of their previous nationalised industries in recent
decades. Because these risk becoming private monopolies, they tend to be regulated in terms of price
and quality of service provision, alongside measures to reduce barriers to entry and therefore
encourage competition. This has been especially true in the UK.
• Laissez-faire
Some economists suggest that the problems created by monopolies are best cured by the actions of a
free market.
Common Access Resources and Sustainability
Common Access Resources are resources that are available to everyone without payment, do not
have a price, and are not owned by anyone. Good examples are clean air, fish in the sea, and
biodiversity. It is not possible to exclude anyone from using these resources (they are non-
excludable), however, their use reduces their availability to others (they are rivalrous). As these
resources have no price, they are overused, resulting in serious environmental degradation and
depletion.
Sustainability happens when resources are used today in such a way that does not compromise
their use by future generations. Here we have a conflict between the economic goal of growth and
the environmental goal of sustainability. The concept of negative externalities can be used here to
illustrate how economic activity threatens sustainability. Government responses to sustainability can
be linked into government responses to negative externalities (legislation, carbon taxes, cap and trade
schemes).
The major problem is the global nature of sustainability. 'Common access' means 'world-wide

access', so effective response requires international co-operation. A good example of this is the
European Union Emissions Trading System (a carbon dioxide permit scheme with trading in a carbon
market).
Asymmetric Information
Sometimes, buyers and sellers do not have equal information about the market in which the
economic transaction is taking place. Used car sellers and homeowners have more information than
potential buyers. If consumers are concerned about possible dangers from consumption, then they will
underconsume. If consumers are unaware of possible dangers, then they will overconsume. Both of
these scenarios result in a misallocation of resources.
Governments can respond through legislation, regulation and the provision of information. A major
problem occurs when a risk-taking party does not face the full costs of their risks. This type of
asymmetric information and lack of moral hazard has been seen as one of the major causes of the
financial crisis that begun in 2008.
MICROECONOMICS SAMPLE QUESTIONS
Microeconomics is examined in Paper 1 (extended response/essay) Section A.
pn mr 1. (a) Eixmlsaiwhthe imapontganceiofocnrso.ss elasticity of demand and price elasticity of demand for
fr en k i dec s i
(10 marks)
u a wt em t pr
(b) Stpdilecsyhofveusbhsoanniahayt trhesdng
taandsfoornppeetrtoolltendasmoebheohighlryduicciegineslacsotincs.uEvatliuat.e
a oi s t t l l a i i xe r as t d of e n it mp on
(15 marks)
ai 2. (a) Ursoinigsdiiagtrhaemssh,oerxprlunnatnhdetdiefflernegn-crenb.etween a perfectly competitive firm, in terms of
p ft , n t- ho u

(10 marks)
at
(b) Evaloupoelythe view that perfect competition is a more desirable market structure than
mon .

(15 marks)
Model markschemes to these questions are on pages 126-40.
SECTION 2: MACROECONOMICS
MEASURING NATIONAL INCOME
You need to know how to calculate various measures of national income for the data response paper, but apart from that you should
not concern yourself too much with them.
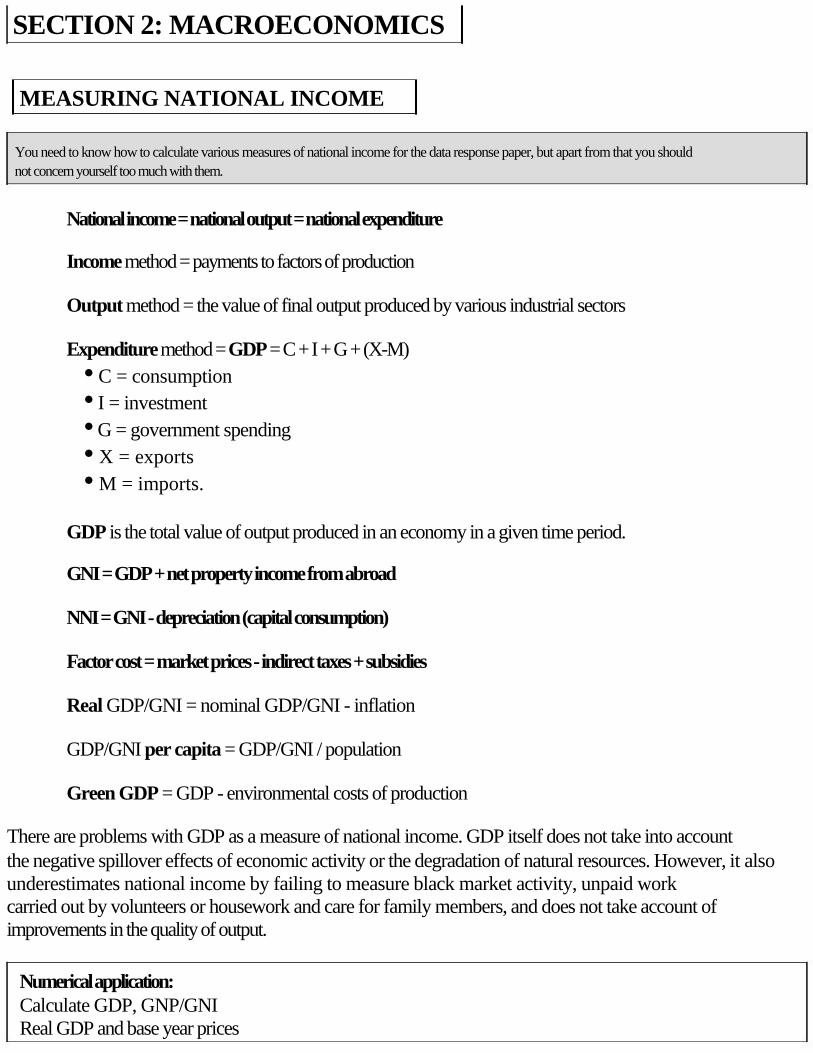
National income = national output = national expenditure
Income method = payments to factors of production
Output method = the value of final output produced by various industrial sectors
Expenditure method = GDP = C + I + G + (X-M)
• C = consumption
• I = investment
• G = government spending
• X = exports
• M = imports.
GDP is the total value of output produced in an economy in a given time period.
GNI = GDP + net property income from abroad
NNI = GNI - depreciation (capital consumption)
Factor cost = market prices - indirect taxes + subsidies
Real GDP/GNI = nominal GDP/GNI - inflation
GDP/GNI per capita = GDP/GNI / population
Green GDP = GDP - environmental costs of production
There are problems with GDP as a measure of national income. GDP itself does not take into account
the negative spillover effects of economic activity or the degradation of natural resources. However, it also
underestimates national income by failing to measure black market activity, unpaid work
carried out by volunteers or housework and care for family members, and does not take account of
improvements in the quality of output.
Numerical application:
Calculate GDP, GNP/GNI
Real GDP and base year prices
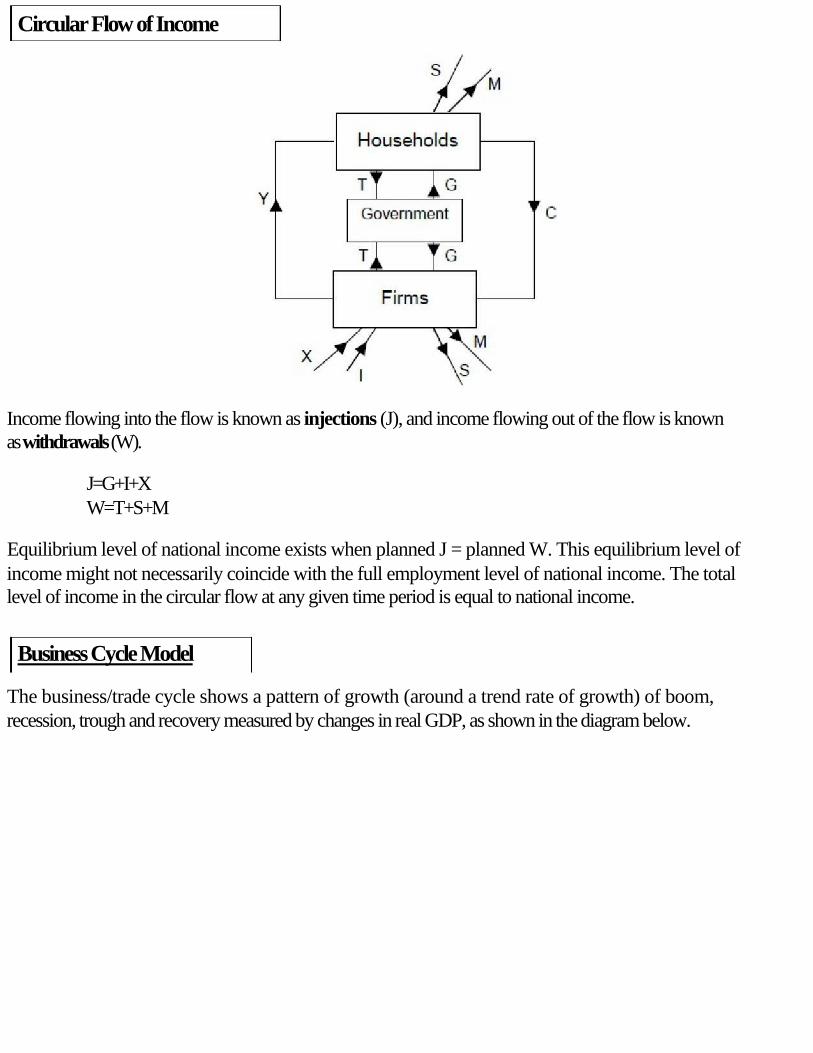
Circular Flow of Income
Income flowing into the flow is known as injections (J), and income flowing out of the flow is known
as withdrawals (W).
J=G+I+X
W=T+S+M
Equilibrium level of national income exists when planned J = planned W. This equilibrium level of
income might not necessarily coincide with the full employment level of national income. The total
level of income in the circular flow at any given time period is equal to national income.
Business Cycle Model
The business/trade cycle shows a pattern of growth (around a trend rate of growth) of boom,
recession, trough and recovery measured by changes in real GDP, as shown in the diagram below.
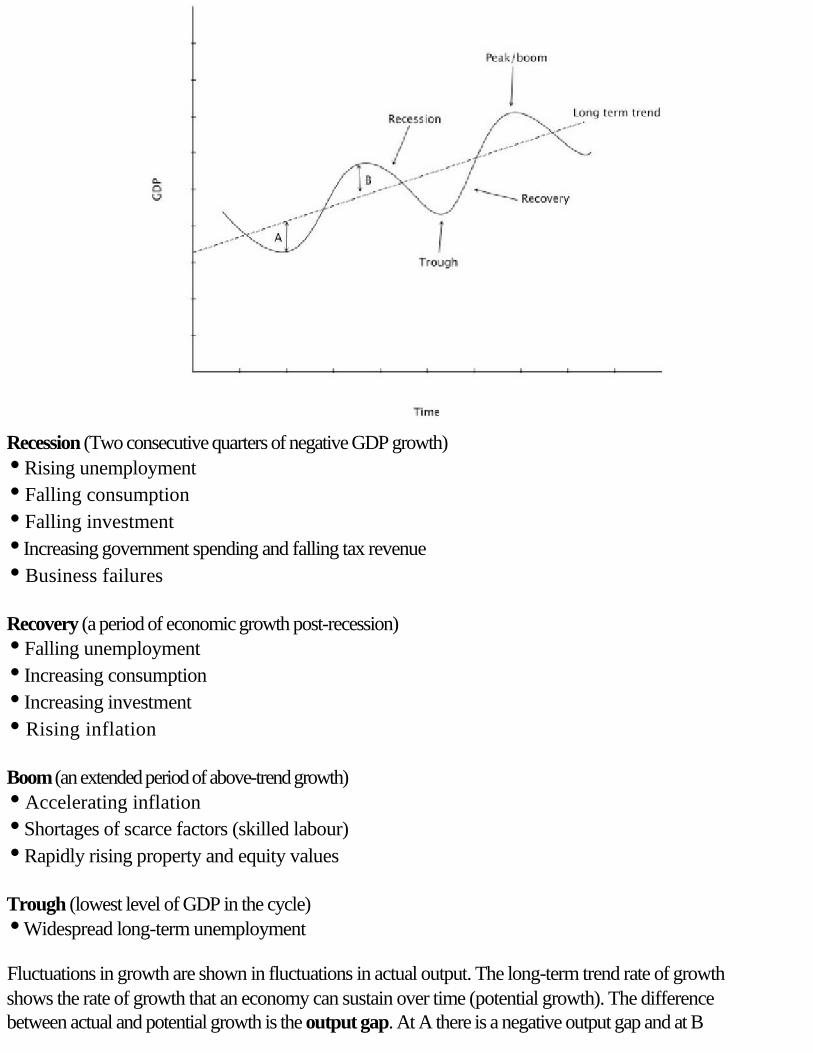
Recession (Two consecutive quarters of negative GDP growth)
• Rising unemployment
• Falling consumption
• Falling investment
• Increasing government spending and falling tax revenue
• Business failures
Recovery (a period of economic growth post-recession)
• Falling unemployment
• Increasing consumption
• Increasing investment
• Rising inflation
Boom (an extended period of above-trend growth)
• Accelerating inflation
• Shortages of scarce factors (skilled labour)
• Rapidly rising property and equity values
Trough (lowest level of GDP in the cycle)
• Widespread long-term unemployment
Fluctuations in growth are shown in fluctuations in actual output. The long-term trend rate of growth
shows the rate of growth that an economy can sustain over time (potential growth). The difference
between actual and potential growth is the output gap. At A there is a negative output gap and at B
there is a positive output gap.
A decrease in GDP (where the economy actually shrinks) is different from a decrease in GDP growth
(where the economy continues to grow, but at a slower rate).
MACROECONOMIC MODELS
Aggregate Demand and Supply Analysis
AD and AS analysis is the main system for analysing macroeconomic problems and policies. Once mastered, it is a very flexible tool
which is easily brought into any macroeconomic situation. You should be able to manipulate AD/AS diagrams accurately to explain any macroeconomic situation.
Equilibrium level of national income is where aggregate demand (AD) is equal to aggregate
supply (AS).
• Aggregate Demand
AD = Consumption (C) + Investment (I) + Government Expenditure (G) + (Exports (X) - Imports
(M)).
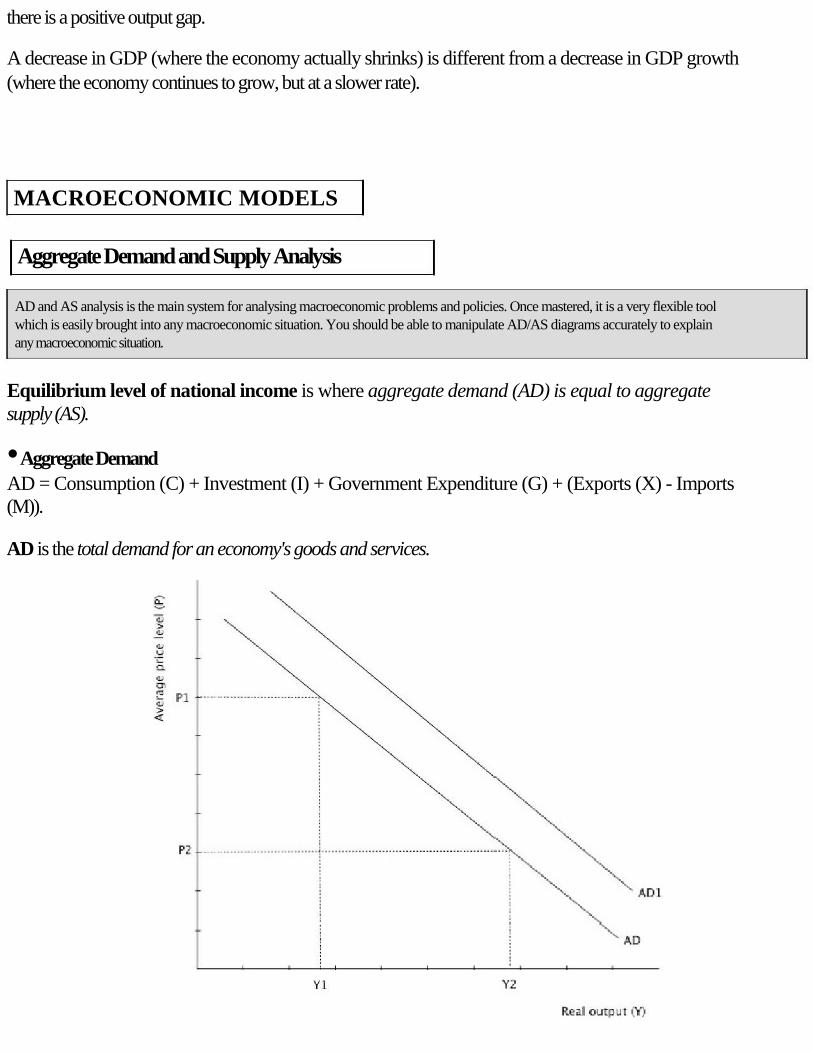
AD is the total demand for an economy's goods and services.

AD is downward-sloping because as prices rise, the demand for an economy's goods and services
will be less. Goods will be less competitive in international markets and real income is less.
AD will shift if any of C + I + G + (X - M) change.
Factors that influence consumption:
• Consumer confidence
• Interest rates
• Wealth
• Income taxes
• Debt
Factors that influence investment:
• Interest rates
• Taxes on profits and investment
• Business confidence
• Corporate debt
Factors that influence government spending:
• Political and economic priorities
Factors that influence net exports:
• Exchange rates
• Protectionism
• Income levels of trading partners
Important Factors that shift the AD curve are:
Diagrams to illustrate these demand-side policies can be found where this guide discusses Macro Equilibrium and the different approaches taken by Keynesian and Monetarist/Neo-Classical Economists. You should be able to draw AD/AS diagrams that illustrate the impacts of expansionary fiscal and monetary policies as well, enabling you to discuss the importance of the shape of the AS curves when analysing and evaluating policy.
Fiscal policy. An increase in government spending will increase AD, and a decrease in
government spending will decrease AD. A decrease in taxation will increase AD, as it will
increase disposable income and thus C. An increase in taxation will decrease AD as it will
decrease disposable income and thus C. Thus, a budget deficit (G > T) will increase AD and
a budget surplus (G < T) will decrease AD. Expansionary fiscal policy (increasing AD) can
thus be used to 'close' a deflationary gap and deflationary fiscal policy (decreasing AD) can
be used to 'close' an inflationary gap.
Monetary policy. An increase in the rate of interest will decrease AD by increasing saving
and so reducing consumption, by decreasing investment, and by strengthening the exchange
rate and so reducing exports. A decrease in the rate of interest would have the opposite effect.
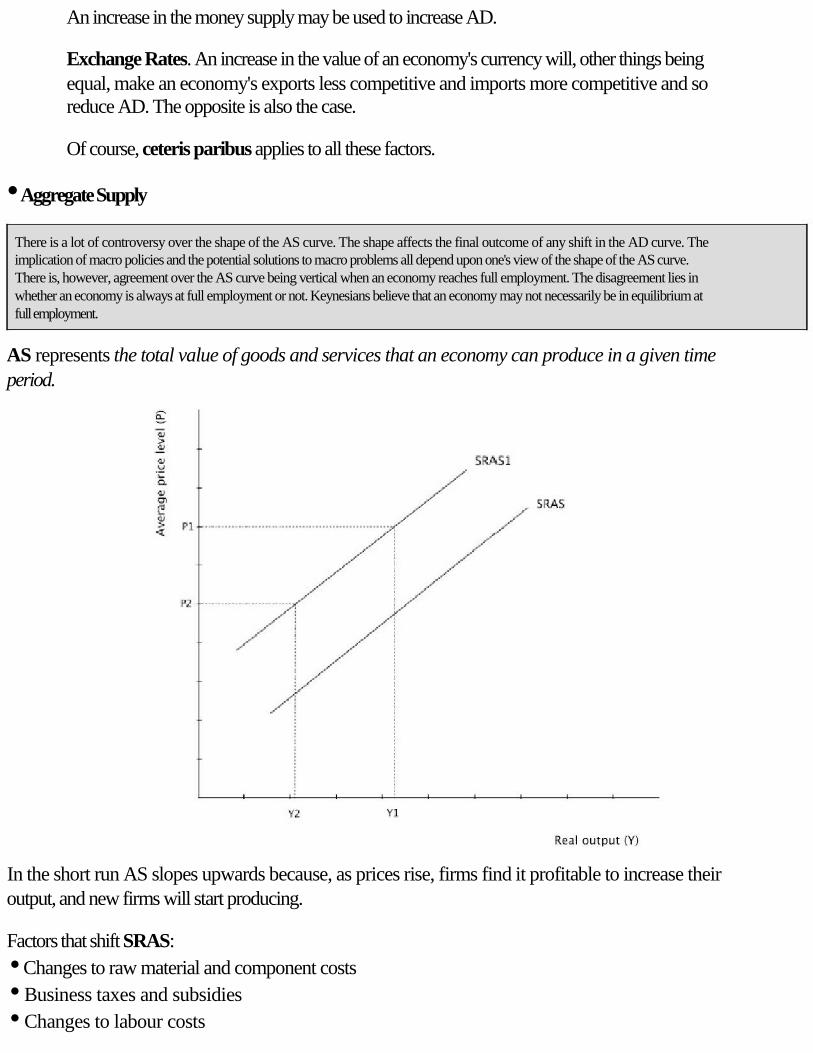
An increase in the money supply may be used to increase AD.
Exchange Rates. An increase in the value of an economy's currency will, other things being
equal, make an economy's exports less competitive and imports more competitive and so
reduce AD. The opposite is also the case.
Of course, ceteris paribus applies to all these factors.
• Aggregate Supply
There is a lot of controversy over the shape of the AS curve. The shape affects the final outcome of any shift in the AD curve. The implication of macro policies and the potential solutions to macro problems all depend upon one's view of the shape of the AS curve. There is, however, agreement over the AS curve being vertical when an economy reaches full employment. The disagreement lies in whether an economy is always at full employment or not. Keynesians believe that an economy may not necessarily be in equilibrium at full employment.
AS represents the total value of goods and services that an economy can produce in a given time
period.
In the short run AS slopes upwards because, as prices rise, firms find it profitable to increase their
output, and new firms will start producing.
Factors that shift SRAS:
• Changes to raw material and component costs
• Business taxes and subsidies
• Changes to labour costs
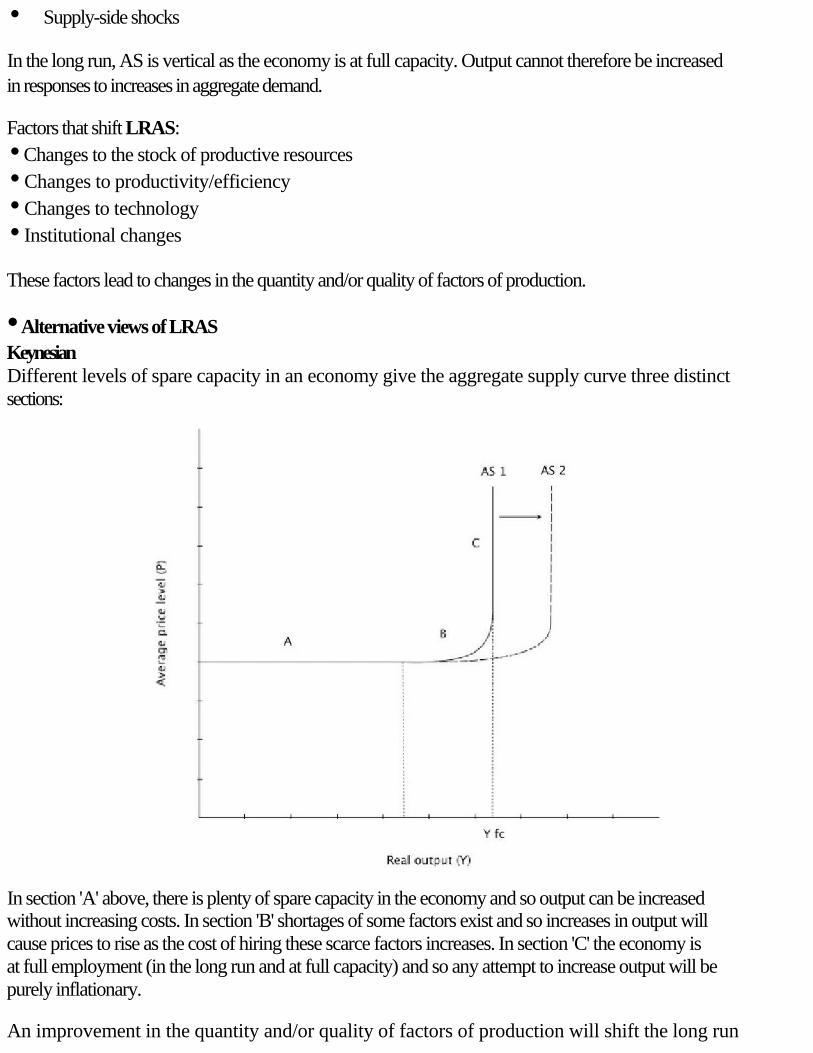
• Supply-side shocks
In the long run, AS is vertical as the economy is at full capacity. Output cannot therefore be increased
in responses to increases in aggregate demand.
Factors that shift LRAS:
• Changes to the stock of productive resources
• Changes to productivity/efficiency
• Changes to technology
• Institutional changes
These factors lead to changes in the quantity and/or quality of factors of production.
• Alternative views of LRAS
Keynesian
Different levels of spare capacity in an economy give the aggregate supply curve three distinct
sections:
In section 'A' above, there is plenty of spare capacity in the economy and so output can be increased
without increasing costs. In section 'B' shortages of some factors exist and so increases in output will
cause prices to rise as the cost of hiring these scarce factors increases. In section 'C' the economy is
at full employment (in the long run and at full capacity) and so any attempt to increase output will be
purely inflationary.
An improvement in the quantity and/or quality of factors of production will shift the long run
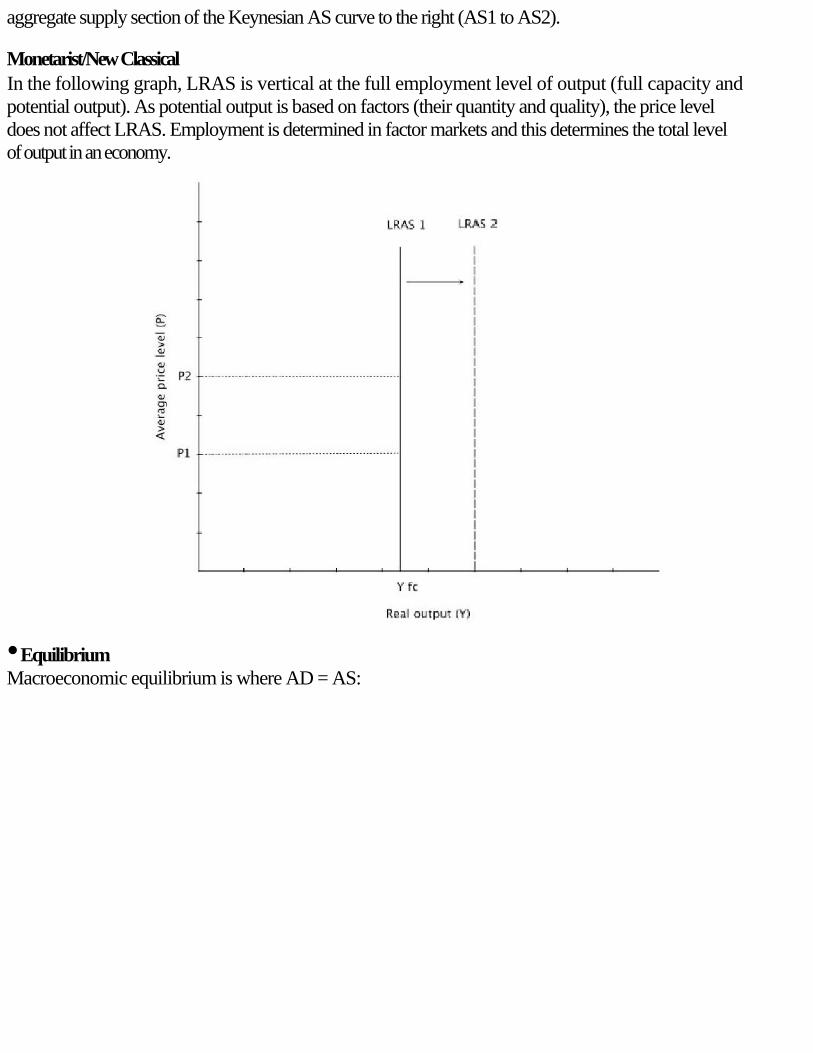
aggregate supply section of the Keynesian AS curve to the right (AS1 to AS2).
Monetarist/New Classical
In the following graph, LRAS is vertical at the full employment level of output (full capacity and
potential output). As potential output is based on factors (their quantity and quality), the price level
does not affect LRAS. Employment is determined in factor markets and this determines the total level
of output in an economy.
• Equilibrium
Macroeconomic equilibrium is where AD = AS:
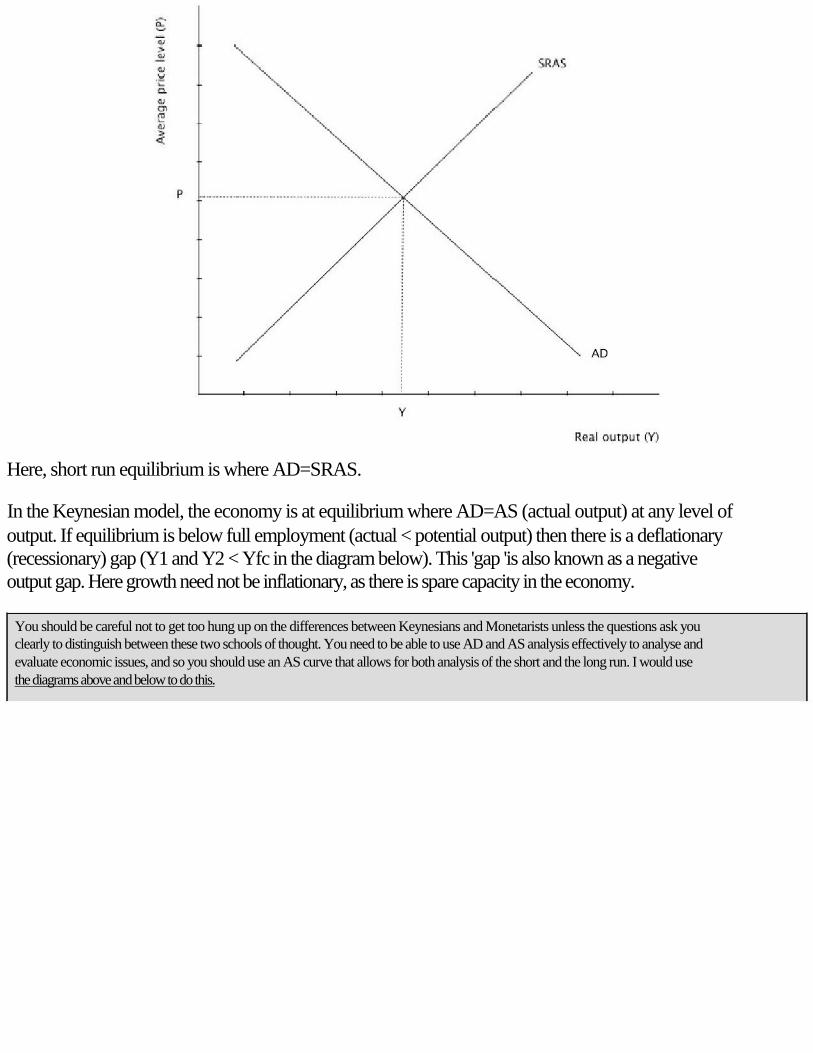
Here, short run equilibrium is where AD=SRAS.
In the Keynesian model, the economy is at equilibrium where AD=AS (actual output) at any level of
output. If equilibrium is below full employment (actual < potential output) then there is a deflationary
(recessionary) gap (Y1 and Y2 < Yfc in the diagram below). This 'gap 'is also known as a negative
output gap. Here growth need not be inflationary, as there is spare capacity in the economy.
You should be careful not to get too hung up on the differences between Keynesians and Monetarists unless the questions ask you clearly to distinguish between these two schools of thought. You need to be able to use AD and AS analysis effectively to analyse and evaluate economic issues, and so you should use an AS curve that allows for both analysis of the short and the long run. I would use the diagrams above and below to do this.
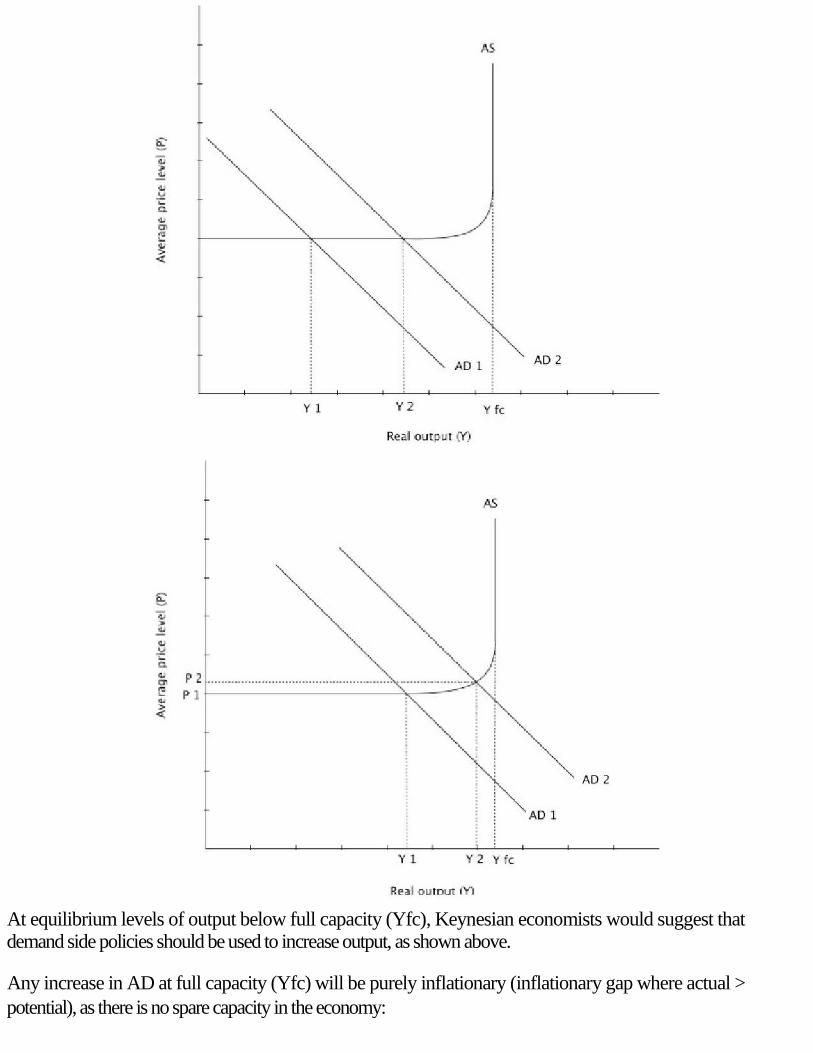
At equilibrium levels of output below full capacity (Yfc), Keynesian economists would suggest that
demand side policies should be used to increase output, as shown above.
Any increase in AD at full capacity (Yfc) will be purely inflationary (inflationary gap where actual >
potential), as there is no spare capacity in the economy:
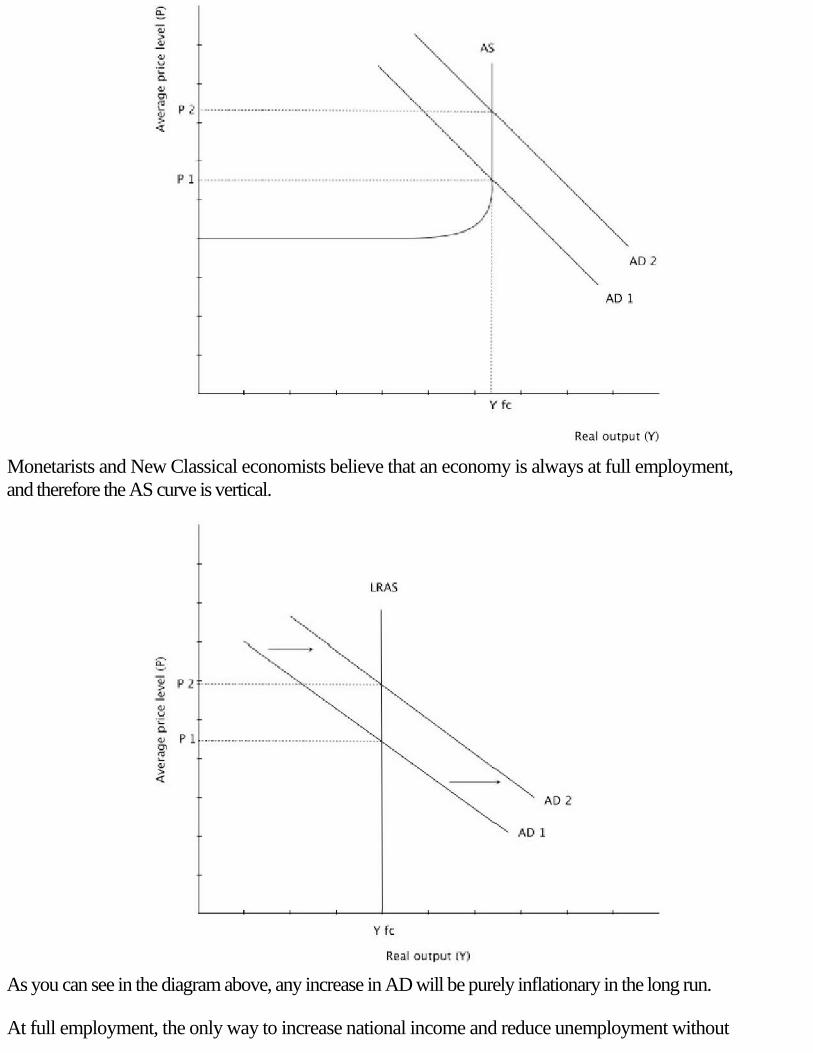
Monetarists and New Classical economists believe that an economy is always at full employment,
and therefore the AS curve is vertical.
As you can see in the diagram above, any increase in AD will be purely inflationary in the long run.
At full employment, the only way to increase national income and reduce unemployment without
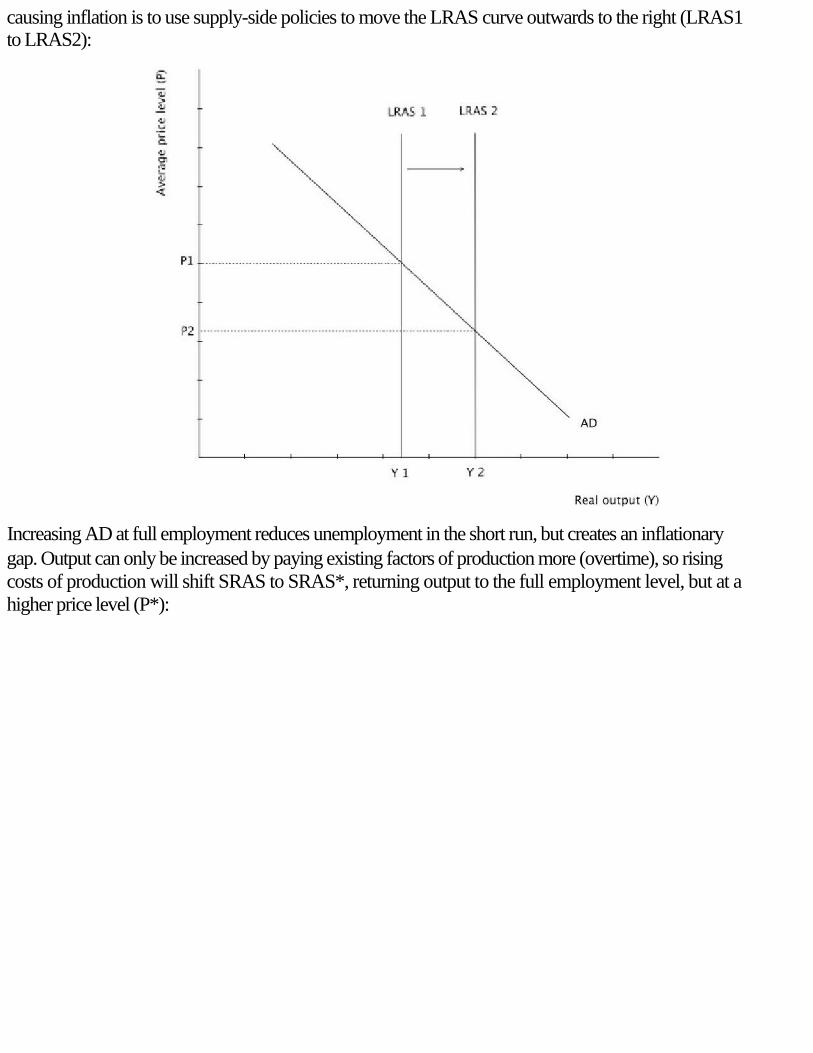
causing inflation is to use supply-side policies to move the LRAS curve outwards to the right (LRAS1
to LRAS2):
Increasing AD at full employment reduces unemployment in the short run, but creates an inflationary
gap. Output can only be increased by paying existing factors of production more (overtime), so rising
costs of production will shift SRAS to SRAS*, returning output to the full employment level, but at a
higher price level (P*):
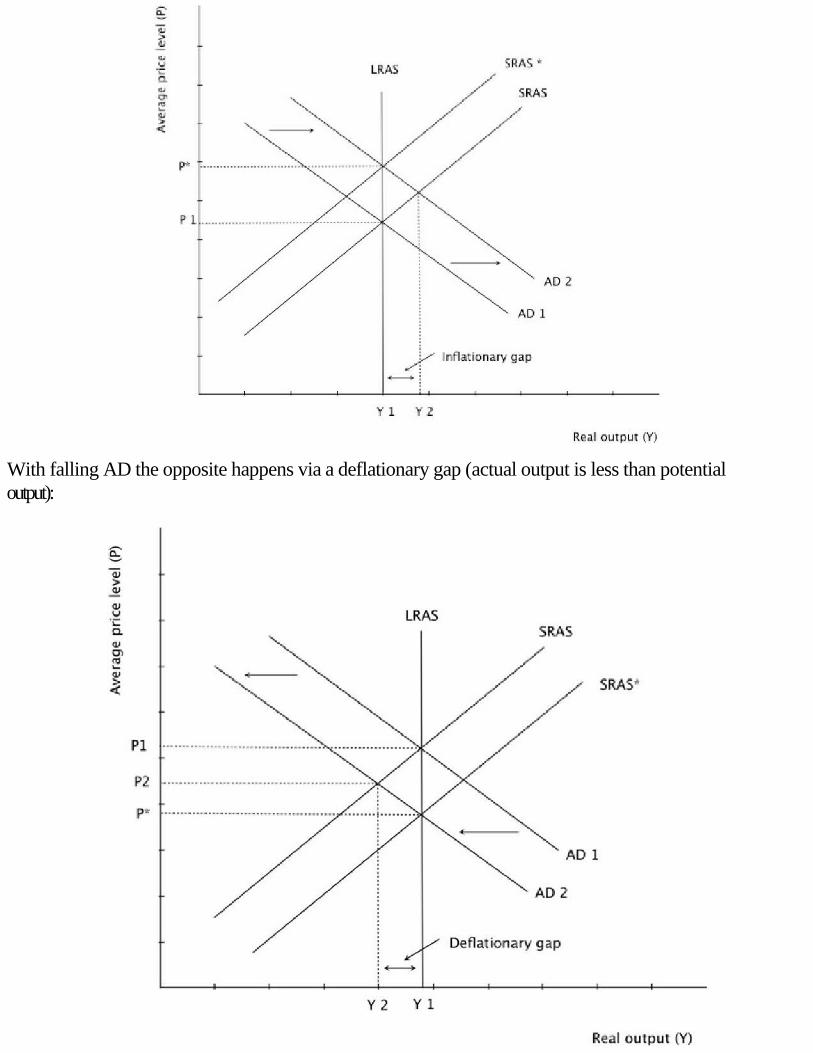
With falling AD the opposite happens via a deflationary gap (actual output is less than potential
output):
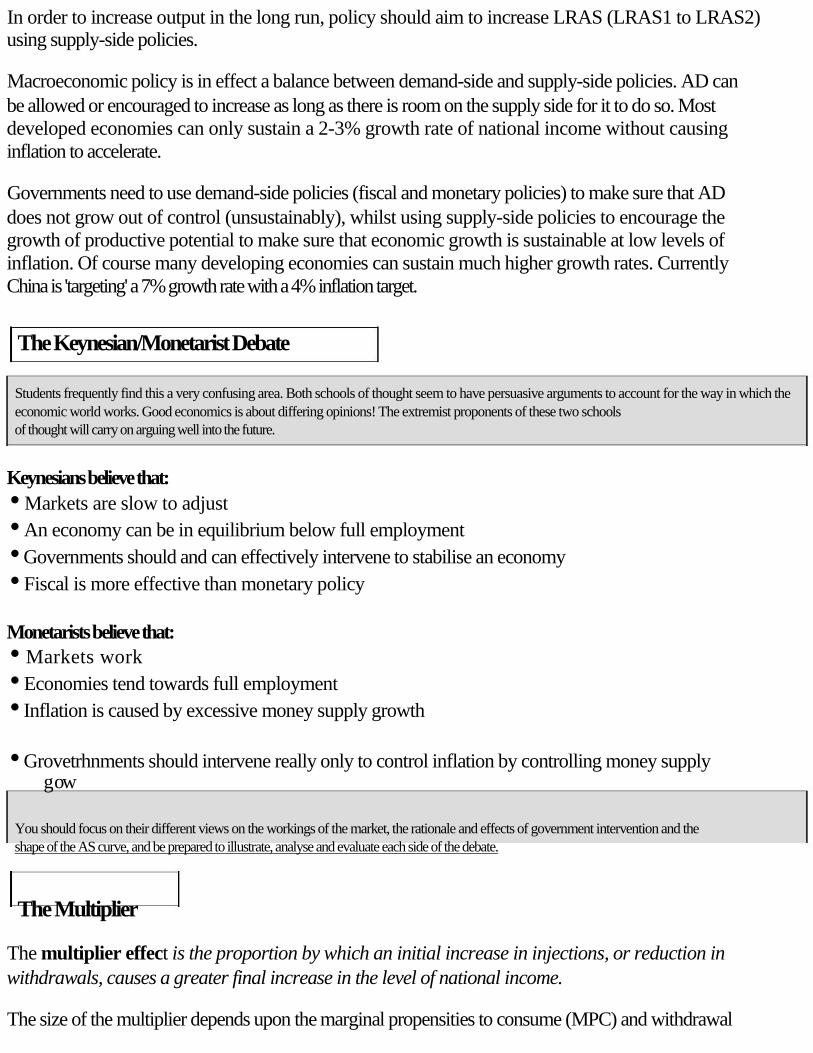
In order to increase output in the long run, policy should aim to increase LRAS (LRAS1 to LRAS2)
using supply-side policies.
Macroeconomic policy is in effect a balance between demand-side and supply-side policies. AD can
be allowed or encouraged to increase as long as there is room on the supply side for it to do so. Most
developed economies can only sustain a 2-3% growth rate of national income without causing
inflation to accelerate.
Governments need to use demand-side policies (fiscal and monetary policies) to make sure that AD
does not grow out of control (unsustainably), whilst using supply-side policies to encourage the
growth of productive potential to make sure that economic growth is sustainable at low levels of
inflation. Of course many developing economies can sustain much higher growth rates. Currently
China is 'targeting' a 7% growth rate with a 4% inflation target.
The Keynesian/Monetarist Debate
Students frequently find this a very confusing area. Both schools of thought seem to have persuasive arguments to account for the way in which the
economic world works. Good economics is about differing opinions! The extremist proponents of these two schools of thought will carry on arguing well into the future.
Keynesians believe that:
• Markets are slow to adjust
• An economy can be in equilibrium below full employment
• Governments should and can effectively intervene to stabilise an economy
• Fiscal is more effective than monetary policy
Monetarists believe that:
• Markets work
• Economies tend towards full employment
• Inflation is caused by excessive money supply growth
• Grovetrhnments should intervene really only to control inflation by controlling money supply
g ow
You should focus on their different views on the workings of the market, the rationale and effects of government intervention and the
shape of the AS curve, and be prepared to illustrate, analyse and evaluate each side of the debate.
The Multiplier
The multiplier effect is the proportion by which an initial increase in injections, or reduction in
withdrawals, causes a greater final increase in the level of national income.
The size of the multiplier depends upon the marginal propensities to consume (MPC) and withdrawal

(MPW = MPS + MPT + MPM). The greater the MPC (the less the MPW), the greater the multiplie
will be, as all income is either consumed or withdrawn (Y = C + W). This is because a greater
proportion of an increase in income will be spent with domestic firms. Household saving and
consumption plans are difficult to predict, and so the value of the multiplier is hard to predict and it
may change over time.
Numerical application:
Calculate MPC and MPW (MPS + MPT + MPM) from the data
Calculate the value of the multiplier:
Calculate effect on GDP of a change in an injection
Determine the level of G or I needed to generate a given change in
GDP
DEMAND-SIDE AND SUPPLY-SIDE POLICIES
Demand-side Policies
• Fiscal policy
Fiscal policy is the use of government spending (current, capital and transfer payments) and
taxation (direct and indirect) to influence AD, raise revenue, redistribute income and influence
consumption patterns. A government's fiscal stance is how expansionary or contractionary their
budget is. The way in which government spending and taxation influences AD has already been
mentioned above, but there can be problems with fiscal policy.
The government budget:
Budget deficit is when total expenditure > total tax revenue (in a particular year).
Budget surplus is when total expenditure < total tax revenue (in a particular year).
National debt is the accumulation of all the past years' deficits. A budget deficit will increase the
size of the national debt. A budget surplus will reduce the size of the national debt.
Government expenditure:
• Current: spending on factor payments and goods
• Capital: investment spending and spending on assets
rf y : pa e
l

• Teansoererp)awmenetsnoa outymtenst freonmrtahtedg.oIvernammntatnos an
irndiivitrdiualti(oeng.ounemopmoyed or
p nsi n her pu i g e e t i s e of ed s bu f inc e
Government revenue:
• Direct taxes: taxes on income (wages/salaries, interest, dividends, rent and profit)
• Indirect taxes: taxes on expenditure (paid indirectly by firms supplying goods and services)
• Sale of goods, services and the privatisation of nationalised industries
Automatic (built-in) stabilizers:
In most economies there is an element of automatic fiscal policy creating some stability in GDP. As GDP
grows, government spending decreases (falling benefit payments) and taxation increases
(progressive taxes). As output and GDP fall government spending increases and taxation falls. This
'built-in' process seeks to help stabilize short-term fluctuations in GDP.
Fiscal Policy strengths/weaknesses:
Strengths:
• Targetable
• Direct impact on AD
• Role in recession
Weaknesses:
• Time lags
• Political influence
• Inflexible
t
• Budfgeurdeeficits can lead to increases in interest rates (to encourage bond sales) and taxation in
the ut
Crowding-out is when government bond sales result in the public sector needing to compete with
the private sector for funds. They will have to offer higher rates of interest in order to sell
• bonds, and the availability of funds in the loanable fund market will decrease. Thus the private
sector will be forced to offer high interest rates as well, discouraging investment and spending.
Some economists argue that this will only happen when an economy is at full capacity
Because of the limitations of fiscal policy, most governments focus their demand-side policies around
monetary policy and the rate of interest in particular. Fiscal policy is now often used to improve the
supply-side of an economy, for example by cutting direct taxes and benefits.
Fiscal policy and potential output (LRAS):
Fiscal policy can be, and is increasingly, used to increase potential output and thus long-run economic
growth. Creating incentives via the tax system for firms to invest and individuals to work, creating an
environment that is favourable for business and employment and actual government spending on
infrastructure are all examples of fiscal policies that target potential output.
• Monetary Policy
Monetary policy is the use of the rate of interest predominantly to influence AD (the money supply
control and targeting the exchange rate can also be used).
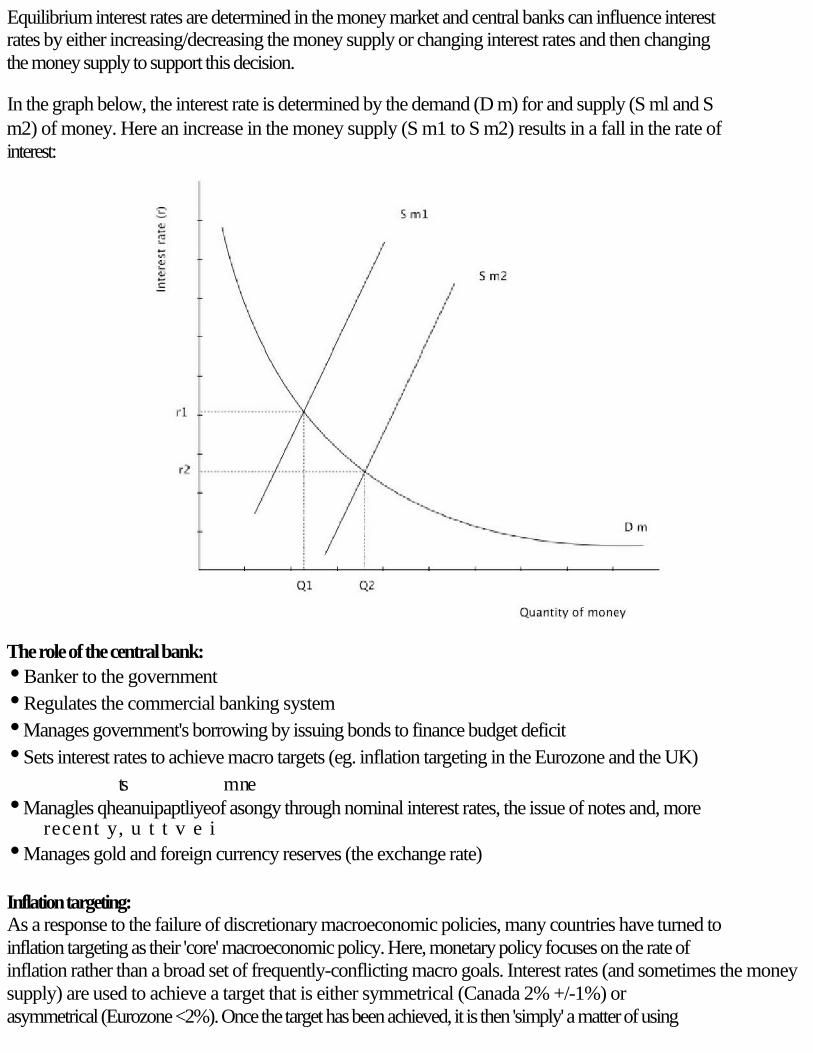
Equilibrium interest rates are determined in the money market and central banks can influence interest
rates by either increasing/decreasing the money supply or changing interest rates and then changing
the money supply to support this decision.
In the graph below, the interest rate is determined by the demand (D m) for and supply (S ml and S
m2) of money. Here an increase in the money supply (S m1 to S m2) results in a fall in the rate of
interest:
The role of the central bank:
• Banker to the government
• Regulates the commercial banking system
• Manages government's borrowing by issuing bonds to finance budget deficit
• Sets interest rates to achieve macro targets (eg. inflation targeting in the Eurozone and the UK)
ts m ne
• Managles qheanuipaptliyeof asongy through nominal interest rates, the issue of notes and, more
recent y, u t t v e i
• Manages gold and foreign currency reserves (the exchange rate)
Inflation targeting:
As a response to the failure of discretionary macroeconomic policies, many countries have turned to
inflation targeting as their 'core' macroeconomic policy. Here, monetary policy focuses on the rate of
inflation rather than a broad set of frequently-conflicting macro goals. Interest rates (and sometimes the money
supply) are used to achieve a target that is either symmetrical (Canada 2% +/-1%) or
asymmetrical (Eurozone <2%). Once the target has been achieved, it is then 'simply' a matter of using

interest rates to maintain the target level.
Until recently, economic growth does not seem to have generated inflation as it had in the past, and so
targets were achieved with relative ease. However, recently, inflation has come from rising
commodity prices resulting from rapid growth in countries such as India and China. Many of these
prices rises have been cost-driven and seen as 'temporal' so a simple interest rate response
(increasing rates) would have reduced AD, causing a recession rather than hitting the 'cost-push'
causes of the inflation.
Monetary Policy strengths/weaknesses:
Strengths
• Independence of central banks removes political influence
• Incremental changes are possible
• Relative speed of change
Weaknesses
• Investment can be interest-inelastic
• Time lags
• One policy fits all (blunt instrument)
• Ineffective against cost-push inflation
rv co ces s
s
• Leoswocnonsoumew/ibnorersotoringnfitdenacnedin
deepparebacsionbmseannstthatdcoofnbumerwiand firms fail to
r p d t lo w r a es may y k de t i e a orro ng
Most developed economies now actively use the rate of interest to influence AD. Independent central
banks dominate rate of interest decision-making. They are able to respond instantly to changing
economic circumstances, whereas fiscal policy often has to wait for the democratic wheels to turn.
Supply-side Policies
Supply-side policies aim to increase an economy's productive potential by changing the quantity
and/or quality of resources in the economy, as shown in the following two diagrams:
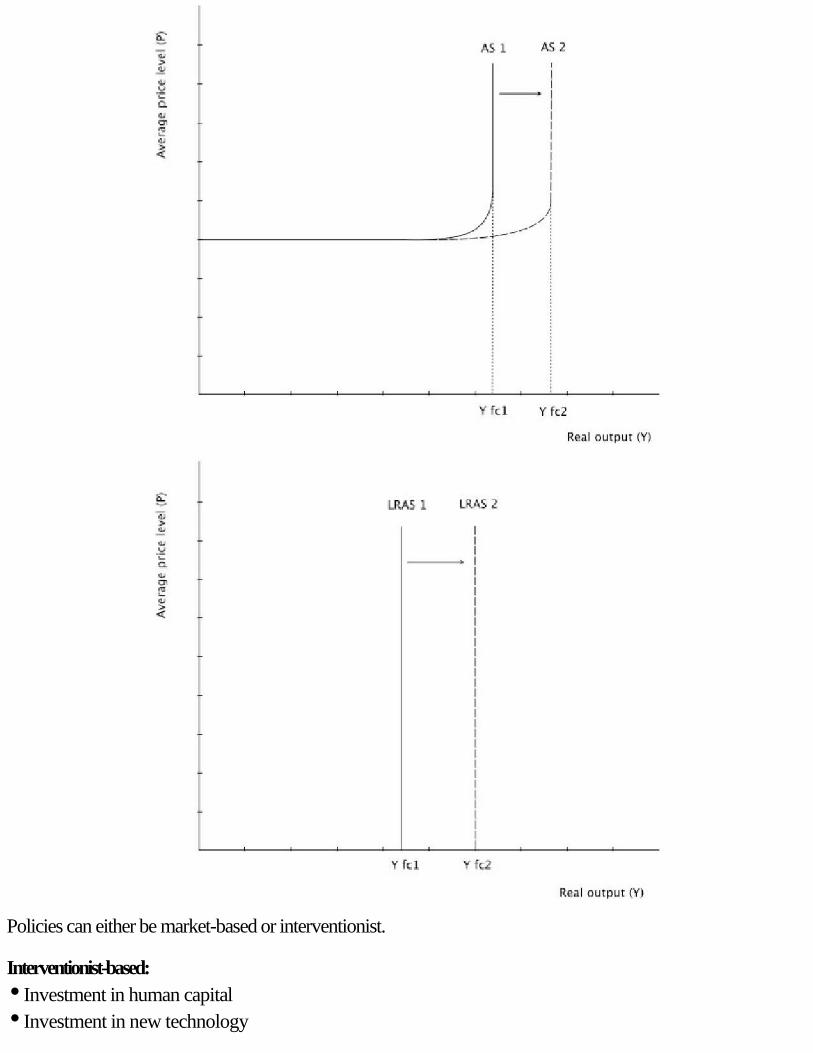
Policies can either be market-based or interventionist.
Interventionist-based:
• Investment in human capital
• Investment in new technology
• Investment in infrastructure
• Industrial policy
Here the individual needs of countries may differ significantly and the needs of ELDCs differ
considerably from developed economies. There may well be negative effects on a government's
budget, and time lags can be substantial.
Market-based:
• Deregulation, privatisation and encouraging competition
• Labour market reforms
• Incentives to work and invest (firms)
These policies can result in increased monopoly power for firms and reduced incomes/job protection
and health and safety measures for workers. They will also redistribute income and the impact of
incentives is not clear as individuals respond in different ways to the same policies.
UNEMPLOYMENT AND INFLATION
Essays ask easy factual questions about the types, causes and cures of both unemployment and inflation.
Unemployment
The Unemployed are the people who are registered as willing, able and available for work at the
market-clearing wage, but who are unable to find work.
The Unemployment Rate is the number of people unemployed as a percentage of the labour force.
Underemployment is when workers who want full-time jobs are only able to find part-time
employment. Low wages and output per worker are reflections of work with low rates of
productivity.
Hidden Unemployment is the part of the working population excluded from any measure of
unemployment because of the definition of unemployment used.
One of the major problems with any measure of unemployment is that it is an aggregated and average
measure that takes no account of regional, gender, age and ethnic variations and disparities.
The costs of unemployment are:
• Loss of output
• Waste of productive potential
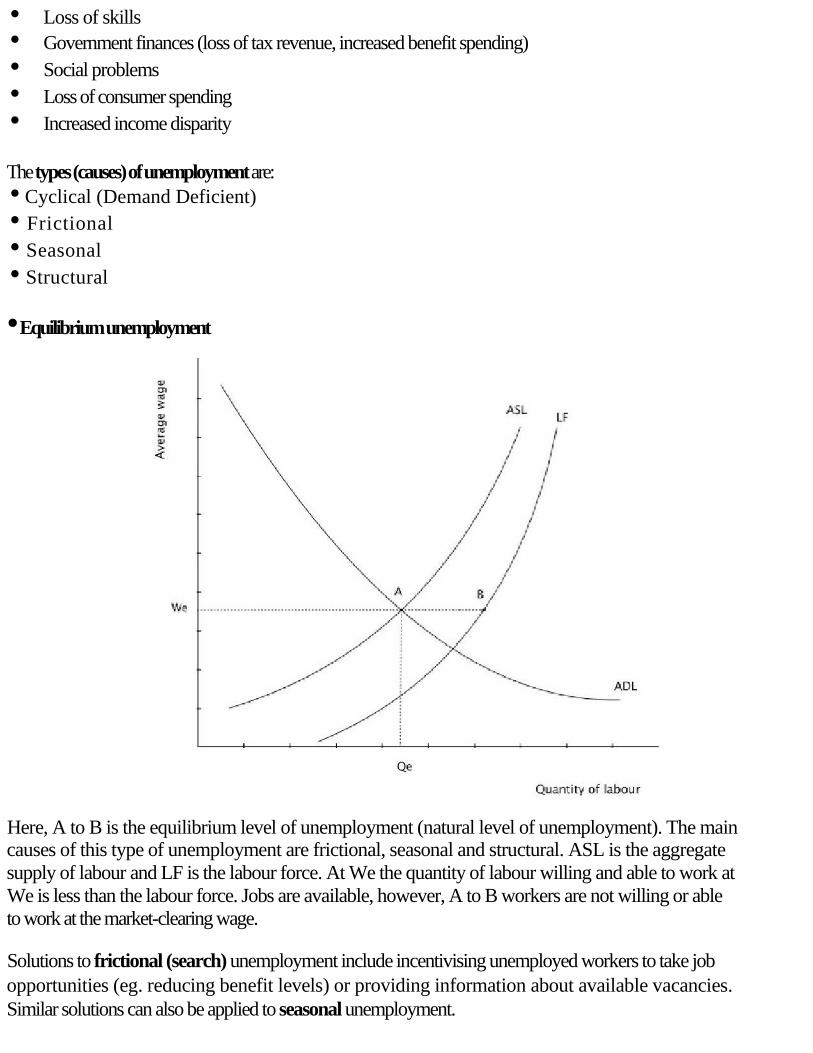
• Loss of skills
• Government finances (loss of tax revenue, increased benefit spending)
• Social problems
• Loss of consumer spending
• Increased income disparity
The types (causes) of unemployment are:
• Cyclical (Demand Deficient)
• Frictional
• Seasonal
• Structural
• Equilibrium unemployment
Here, A to B is the equilibrium level of unemployment (natural level of unemployment). The main
causes of this type of unemployment are frictional, seasonal and structural. ASL is the aggregate
supply of labour and LF is the labour force. At We the quantity of labour willing and able to work at
We is less than the labour force. Jobs are available, however, A to B workers are not willing or able
to work at the market-clearing wage.
Solutions to frictional (search) unemployment include incentivising unemployed workers to take job
opportunities (eg. reducing benefit levels) or providing information about available vacancies.
Similar solutions can also be applied to seasonal unemployment.
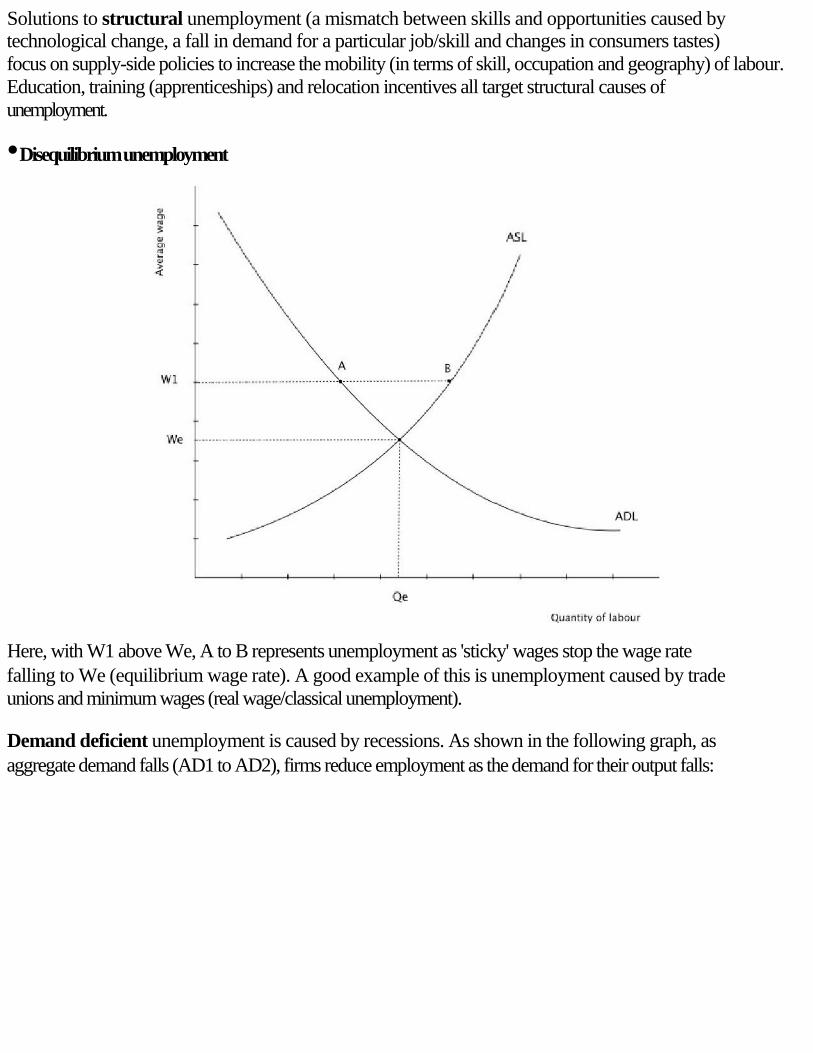
Solutions to structural unemployment (a mismatch between skills and opportunities caused by
technological change, a fall in demand for a particular job/skill and changes in consumers tastes)
focus on supply-side policies to increase the mobility (in terms of skill, occupation and geography) of labour.
Education, training (apprenticeships) and relocation incentives all target structural causes of
unemployment.
• Disequilibrium unemployment
Here, with W1 above We, A to B represents unemployment as 'sticky' wages stop the wage rate
falling to We (equilibrium wage rate). A good example of this is unemployment caused by trade
unions and minimum wages (real wage/classical unemployment).
Demand deficient unemployment is caused by recessions. As shown in the following graph, as
aggregate demand falls (AD1 to AD2), firms reduce employment as the demand for their output falls:
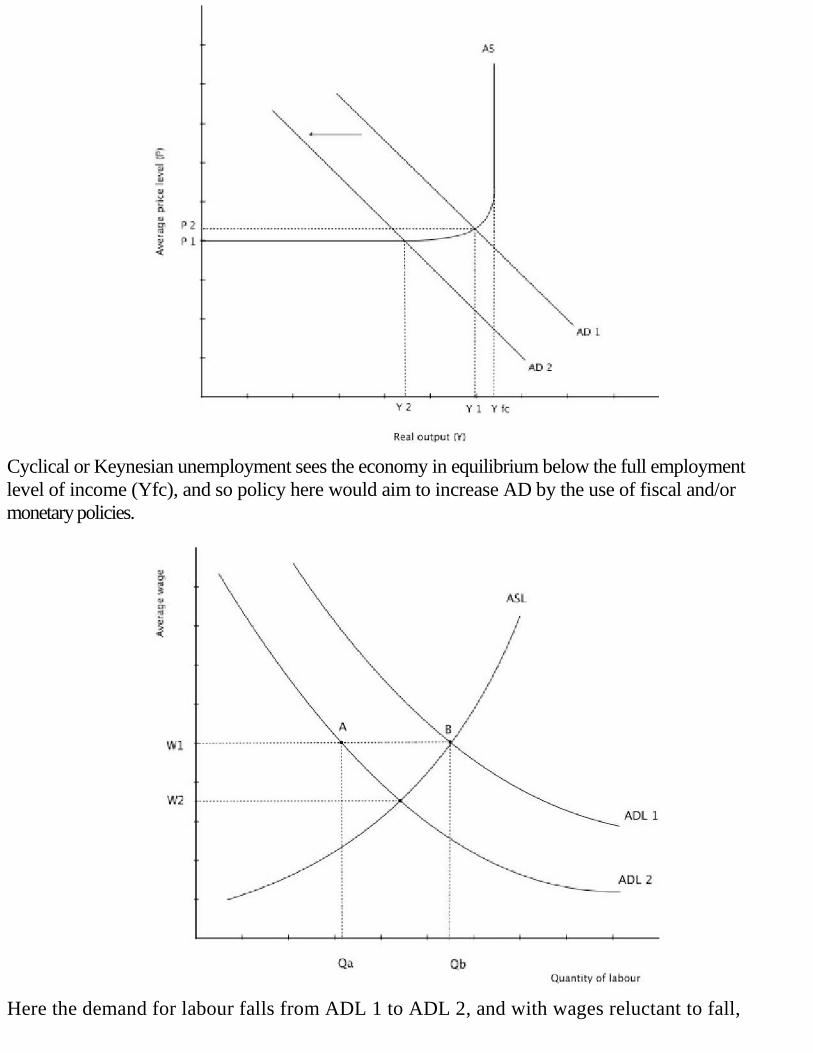
Cyclical or Keynesian unemployment sees the economy in equilibrium below the full employment
level of income (Yfc), and so policy here would aim to increase AD by the use of fiscal and/or
monetary policies.
Here the demand for labour falls from ADL 1 to ADL 2, and with wages reluctant to fall,
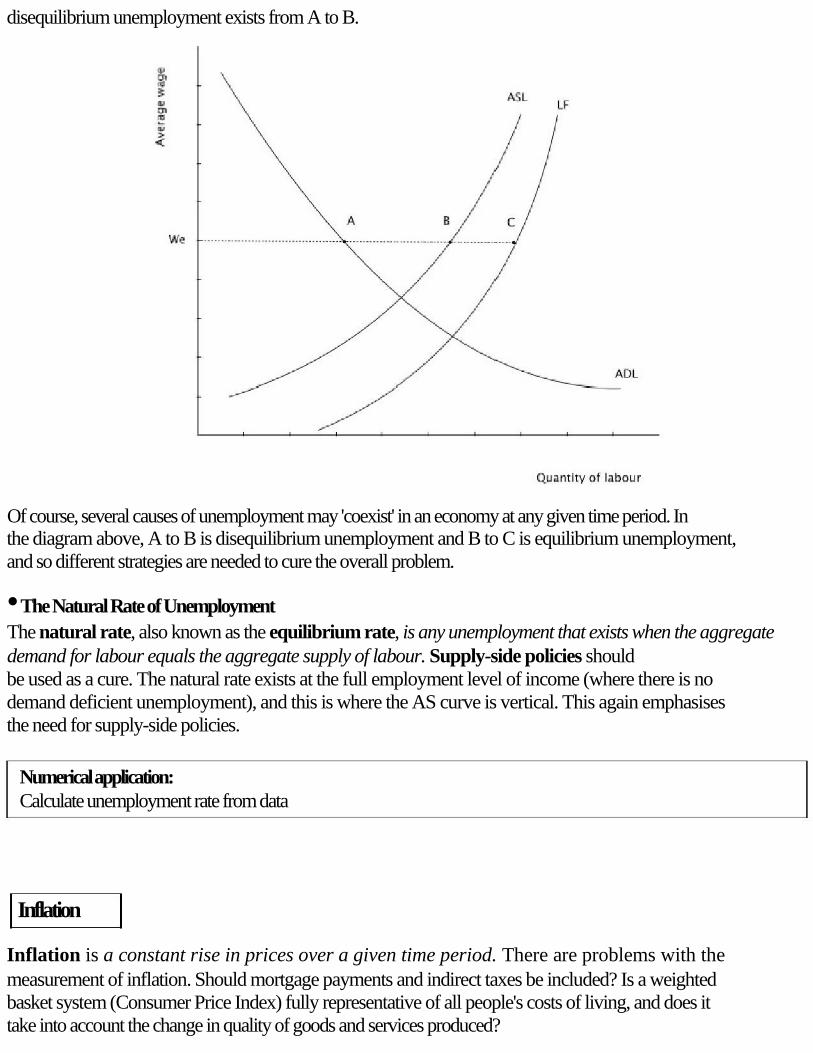
disequilibrium unemployment exists from A to B.
Of course, several causes of unemployment may 'coexist' in an economy at any given time period. In the diagram above, A to B is disequilibrium unemployment and B to C is equilibrium unemployment,
and so different strategies are needed to cure the overall problem.
• The Natural Rate of Unemployment
The natural rate, also known as the equilibrium rate, is any unemployment that exists when the aggregate
demand for labour equals the aggregate supply of labour. Supply-side policies should
be used as a cure. The natural rate exists at the full employment level of income (where there is no
demand deficient unemployment), and this is where the AS curve is vertical. This again emphasises
the need for supply-side policies.
Numerical application:
Calculate unemployment rate from data
Inflation
Inflation is a constant rise in prices over a given time period. There are problems with the
measurement of inflation. Should mortgage payments and indirect taxes be included? Is a weighted
basket system (Consumer Price Index) fully representative of all people's costs of living, and does it
take into account the change in quality of goods and services produced?
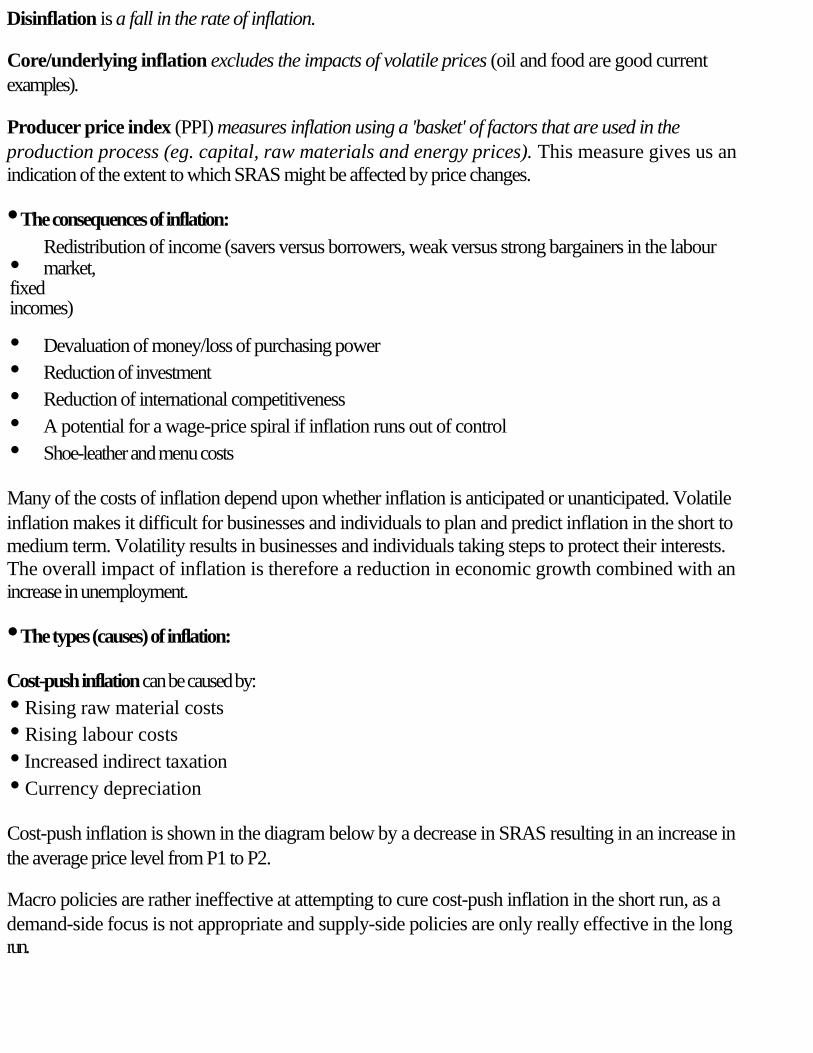
Disinflation is a fall in the rate of inflation.
Core/underlying inflation excludes the impacts of volatile prices (oil and food are good current
examples).
Producer price index (PPI) measures inflation using a 'basket' of factors that are used in the
production process (eg. capital, raw materials and energy prices). This measure gives us an
indication of the extent to which SRAS might be affected by price changes.
• The consequences of inflation:
Redistribution of income (savers versus borrowers, weak versus strong bargainers in the labour
• market, fixed incomes)
• Devaluation of money/loss of purchasing power
• Reduction of investment
• Reduction of international competitiveness
• A potential for a wage-price spiral if inflation runs out of control
• Shoe-leather and menu costs
Many of the costs of inflation depend upon whether inflation is anticipated or unanticipated. Volatile
inflation makes it difficult for businesses and individuals to plan and predict inflation in the short to
medium term. Volatility results in businesses and individuals taking steps to protect their interests.
The overall impact of inflation is therefore a reduction in economic growth combined with an
increase in unemployment.
• The types (causes) of inflation:
Cost-push inflation can be caused by:
• Rising raw material costs
• Rising labour costs
• Increased indirect taxation
• Currency depreciation
Cost-push inflation is shown in the diagram below by a decrease in SRAS resulting in an increase in
the average price level from P1 to P2.
Macro policies are rather ineffective at attempting to cure cost-push inflation in the short run, as a
demand-side focus is not appropriate and supply-side policies are only really effective in the long
run.
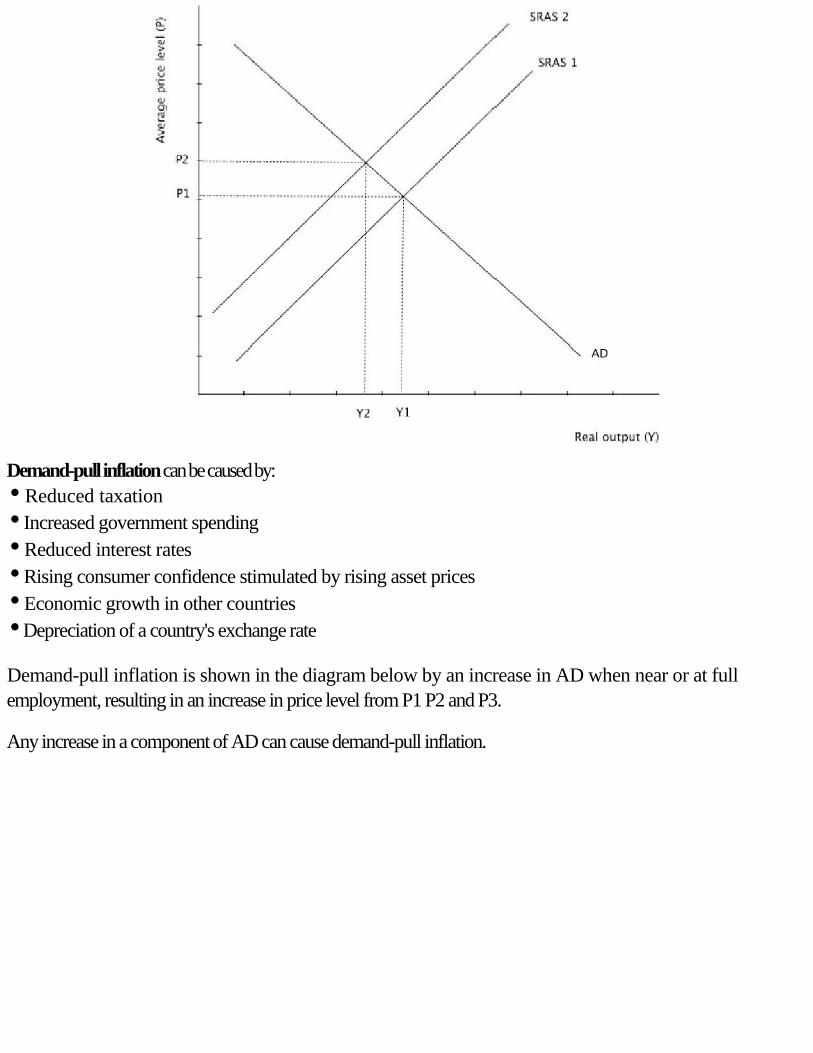
Demand-pull inflation can be caused by:
• Reduced taxation
• Increased government spending
• Reduced interest rates
• Rising consumer confidence stimulated by rising asset prices
• Economic growth in other countries
• Depreciation of a country's exchange rate
Demand-pull inflation is shown in the diagram below by an increase in AD when near or at full
employment, resulting in an increase in price level from P1 P2 and P3.
Any increase in a component of AD can cause demand-pull inflation.
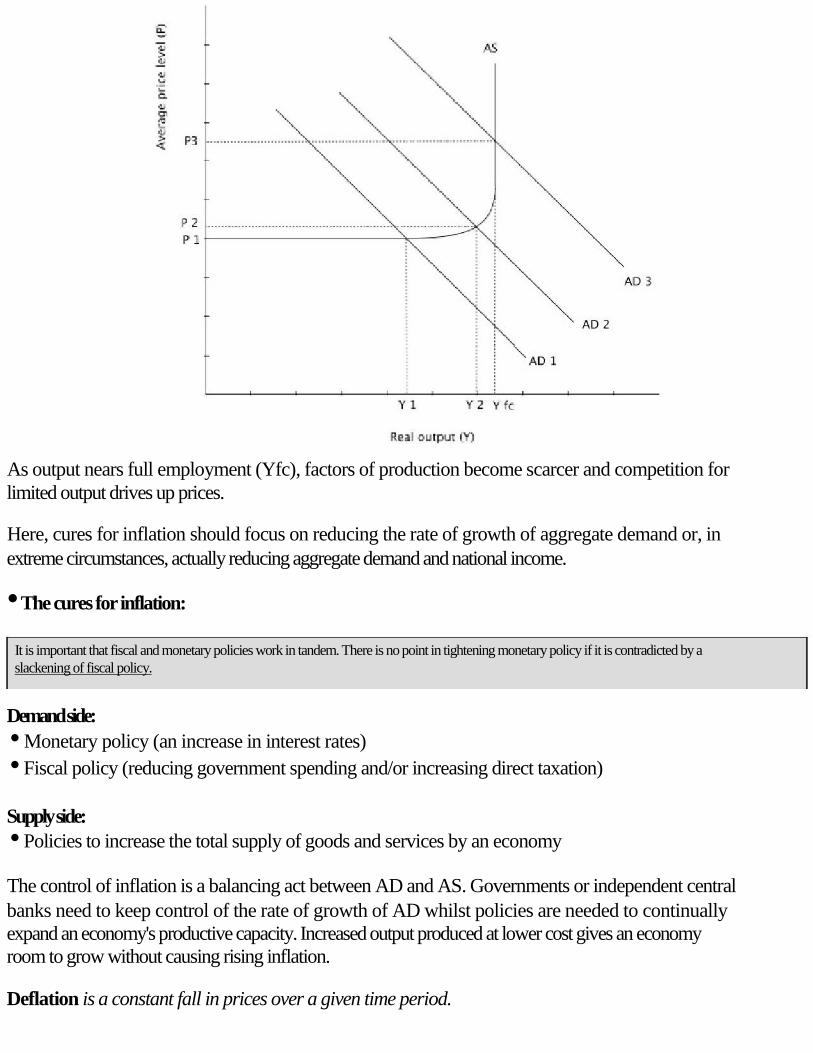
As output nears full employment (Yfc), factors of production become scarcer and competition for
limited output drives up prices.
Here, cures for inflation should focus on reducing the rate of growth of aggregate demand or, in
extreme circumstances, actually reducing aggregate demand and national income.
• The cures for inflation:
It is important that fiscal and monetary policies work in tandem. There is no point in tightening monetary policy if it is contradicted by a slackening of fiscal policy.
Demand side:
• Monetary policy (an increase in interest rates)
• Fiscal policy (reducing government spending and/or increasing direct taxation)
Supply side:
• Policies to increase the total supply of goods and services by an economy
The control of inflation is a balancing act between AD and AS. Governments or independent central
banks need to keep control of the rate of growth of AD whilst policies are needed to continually
expand an economy's productive capacity. Increased output produced at lower cost gives an economy
room to grow without causing rising inflation.
Deflation is a constant fall in prices over a given time period.
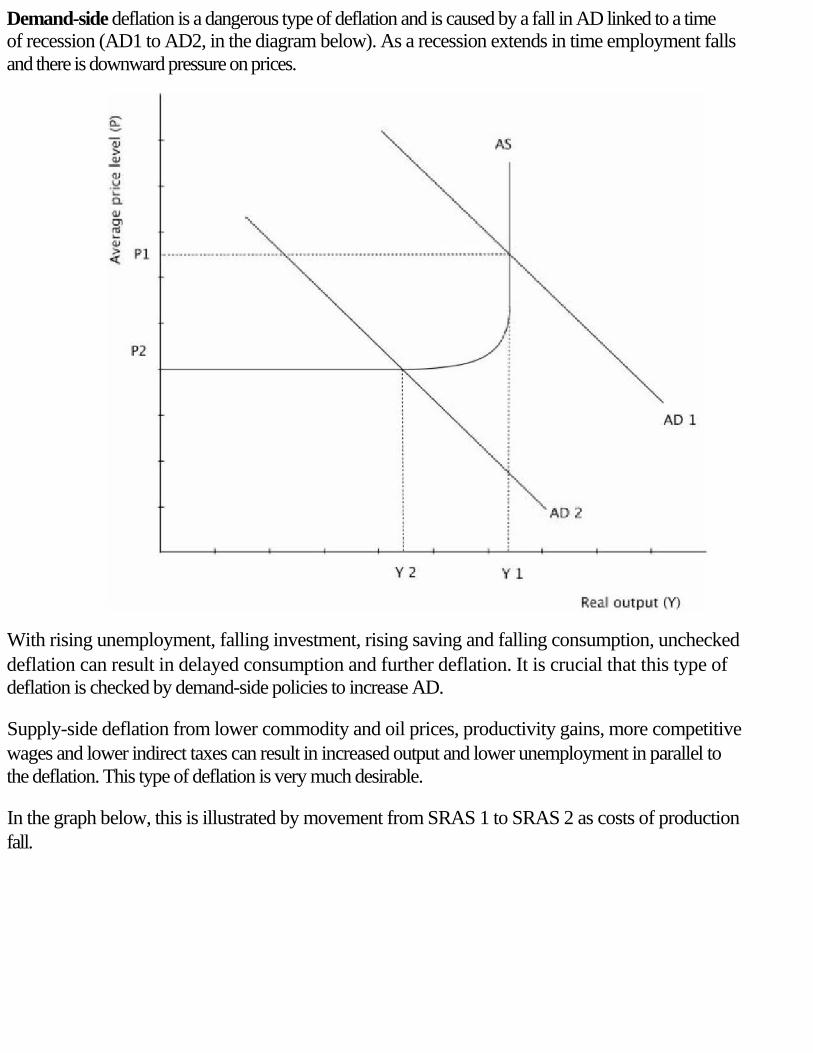
Demand-side deflation is a dangerous type of deflation and is caused by a fall in AD linked to a time
of recession (AD1 to AD2, in the diagram below). As a recession extends in time employment falls
and there is downward pressure on prices.
With rising unemployment, falling investment, rising saving and falling consumption, unchecked
deflation can result in delayed consumption and further deflation. It is crucial that this type of
deflation is checked by demand-side policies to increase AD.
Supply-side deflation from lower commodity and oil prices, productivity gains, more competitive
wages and lower indirect taxes can result in increased output and lower unemployment in parallel to
the deflation. This type of deflation is very much desirable.
In the graph below, this is illustrated by movement from SRAS 1 to SRAS 2 as costs of production
fall.
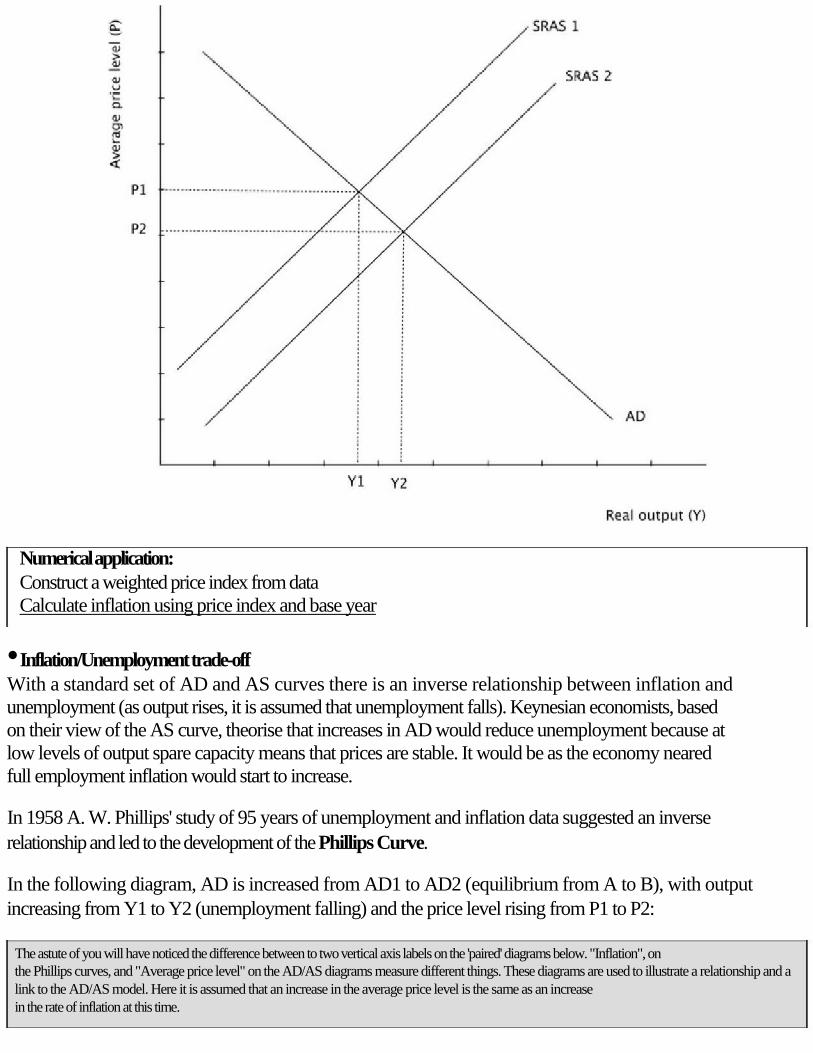
Numerical application:
Construct a weighted price index from data
Calculate inflation using price index and base year
• Inflation/Unemployment trade-off
With a standard set of AD and AS curves there is an inverse relationship between inflation and
unemployment (as output rises, it is assumed that unemployment falls). Keynesian economists, based
on their view of the AS curve, theorise that increases in AD would reduce unemployment because at
low levels of output spare capacity means that prices are stable. It would be as the economy neared
full employment inflation would start to increase.
In 1958 A. W. Phillips' study of 95 years of unemployment and inflation data suggested an inverse
relationship and led to the development of the Phillips Curve.
In the following diagram, AD is increased from AD1 to AD2 (equilibrium from A to B), with output
increasing from Y1 to Y2 (unemployment falling) and the price level rising from P1 to P2:
The astute of you will have noticed the difference between to two vertical axis labels on the 'paired' diagrams below. "Inflation", on the Phillips curves, and "Average price level" on the AD/AS diagrams measure different things. These diagrams are used to illustrate a relationship and a
link to the AD/AS model. Here it is assumed that an increase in the average price level is the same as an increase in the rate of inflation at this time.
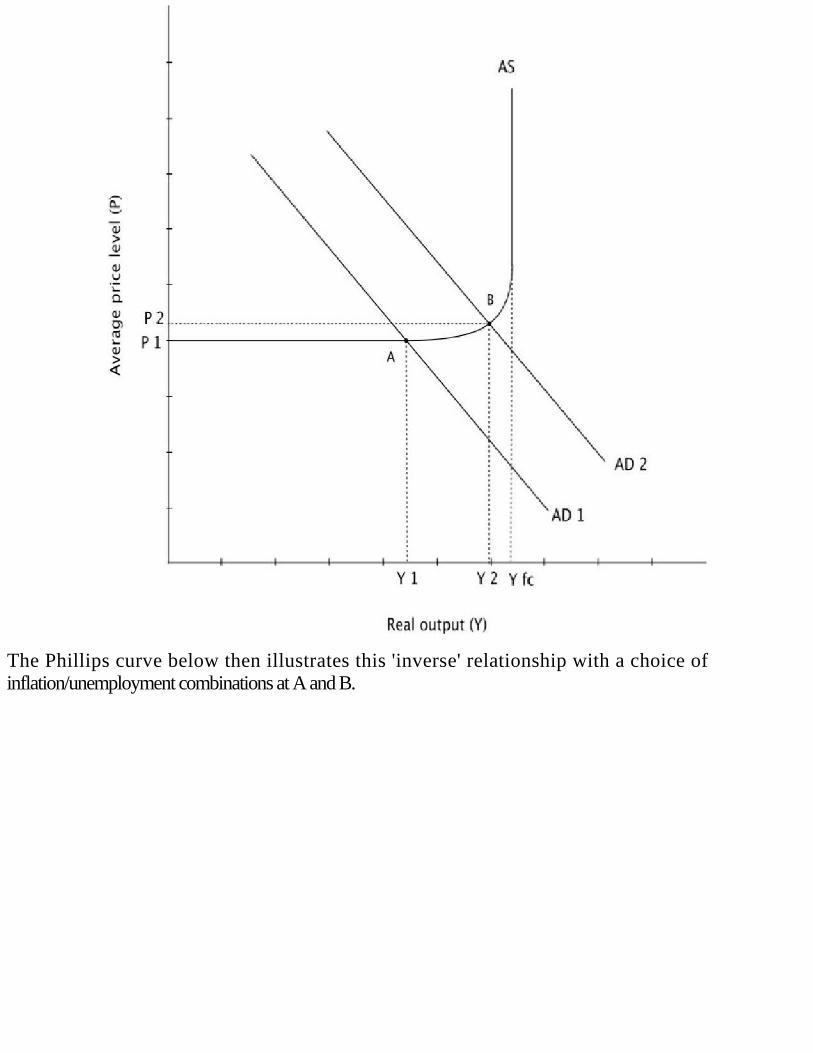
The Phillips curve below then illustrates this 'inverse' relationship with a choice of
inflation/unemployment combinations at A and B.
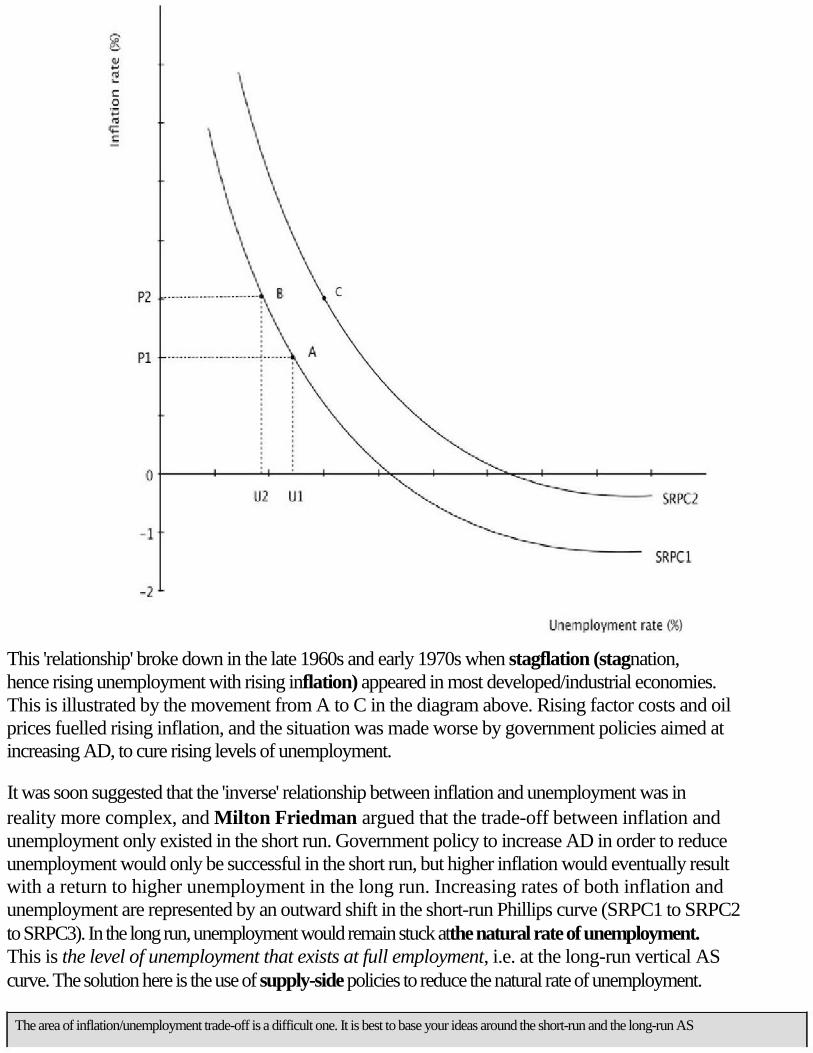
This 'relationship' broke down in the late 1960s and early 1970s when stagflation (stagnation,
hence rising unemployment with rising inflation) appeared in most developed/industrial economies.
This is illustrated by the movement from A to C in the diagram above. Rising factor costs and oil
prices fuelled rising inflation, and the situation was made worse by government policies aimed at
increasing AD, to cure rising levels of unemployment.
It was soon suggested that the 'inverse' relationship between inflation and unemployment was in
reality more complex, and Milton Friedman argued that the trade-off between inflation and
unemployment only existed in the short run. Government policy to increase AD in order to reduce
unemployment would only be successful in the short run, but higher inflation would eventually result
with a return to higher unemployment in the long run. Increasing rates of both inflation and
unemployment are represented by an outward shift in the short-run Phillips curve (SRPC1 to SRPC2
to SRPC3). In the long run, unemployment would remain stuck atthe natural rate of unemployment.
This is the level of unemployment that exists at full employment, i.e. at the long-run vertical AS
curve. The solution here is the use of supply-side policies to reduce the natural rate of unemployment.
The area of inflation/unemployment trade-off is a difficult one. It is best to base your ideas around the short-run and the long-run AS
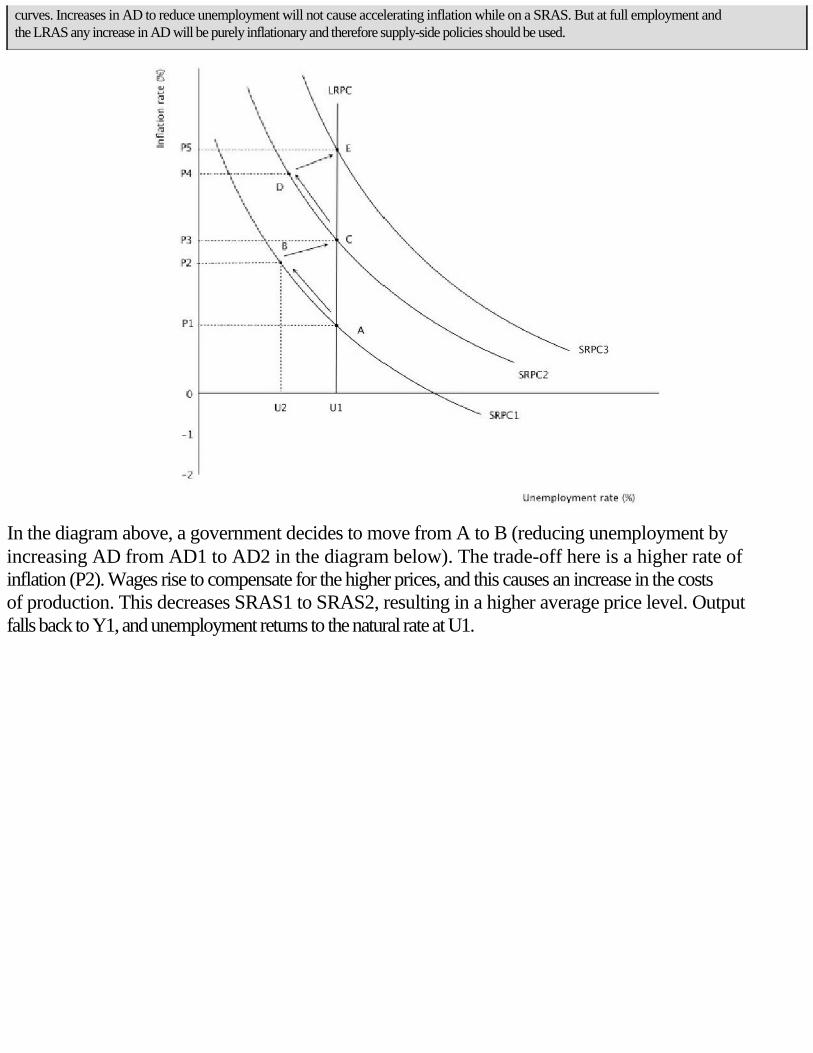
curves. Increases in AD to reduce unemployment will not cause accelerating inflation while on a SRAS. But at full employment and the LRAS any increase in AD will be purely inflationary and therefore supply-side policies should be used.
In the diagram above, a government decides to move from A to B (reducing unemployment by
increasing AD from AD1 to AD2 in the diagram below). The trade-off here is a higher rate of
inflation (P2). Wages rise to compensate for the higher prices, and this causes an increase in the costs
of production. This decreases SRAS1 to SRAS2, resulting in a higher average price level. Output
falls back to Y1, and unemployment returns to the natural rate at U1.
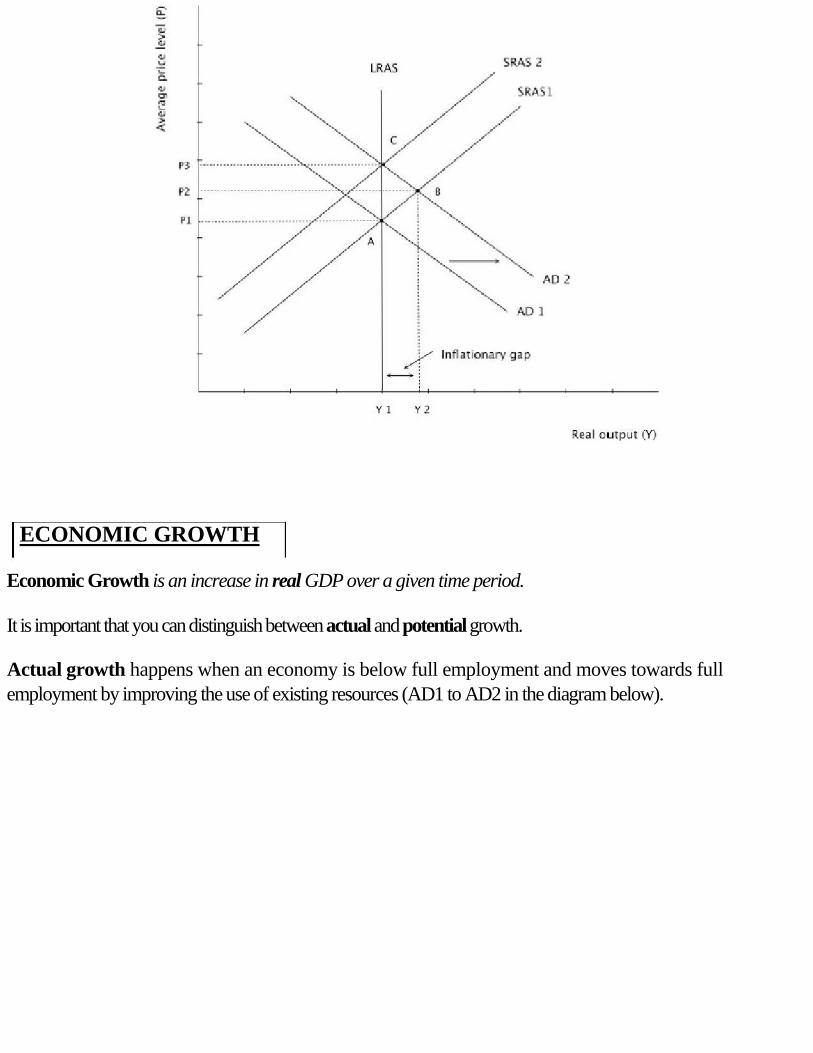
ECONOMIC GROWTH
Economic Growth is an increase in real GDP over a given time period.
It is important that you can distinguish between actual and potential growth.
Actual growth happens when an economy is below full employment and moves towards full
employment by improving the use of existing resources (AD1 to AD2 in the diagram below).
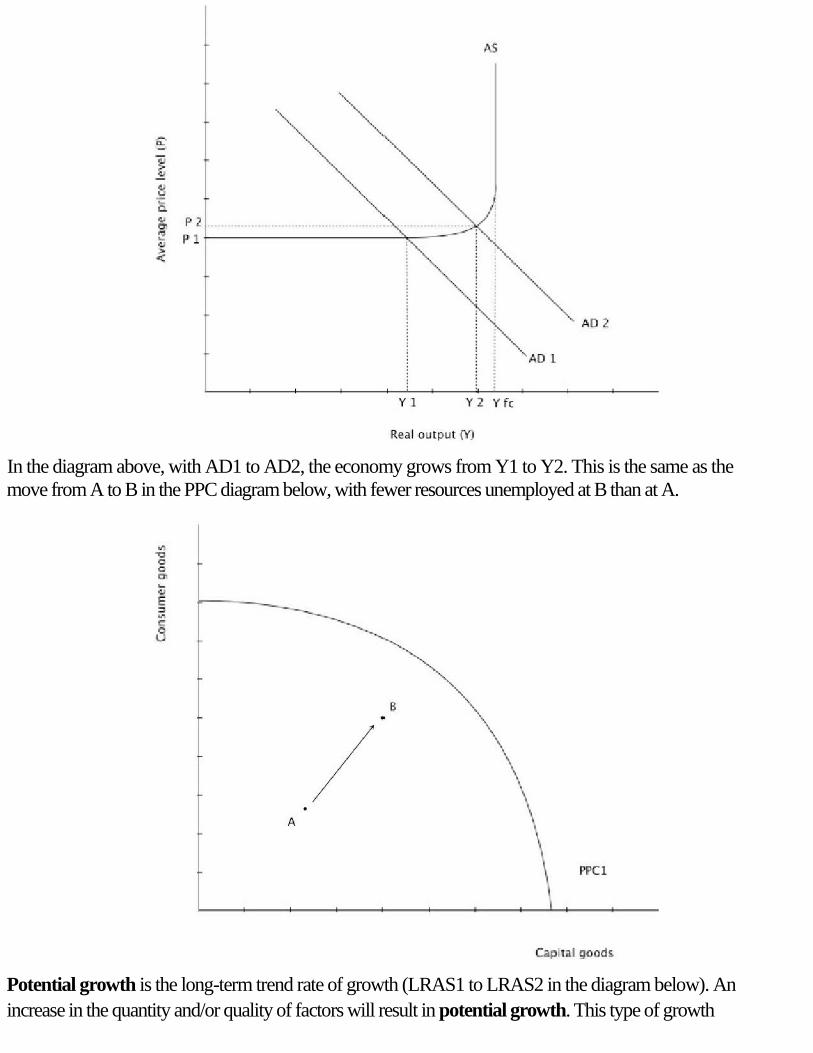
In the diagram above, with AD1 to AD2, the economy grows from Y1 to Y2. This is the same as the
move from A to B in the PPC diagram below, with fewer resources unemployed at B than at A.
Potential growth is the long-term trend rate of growth (LRAS1 to LRAS2 in the diagram below). An
increase in the quantity and/or quality of factors will result in potential growth. This type of growth
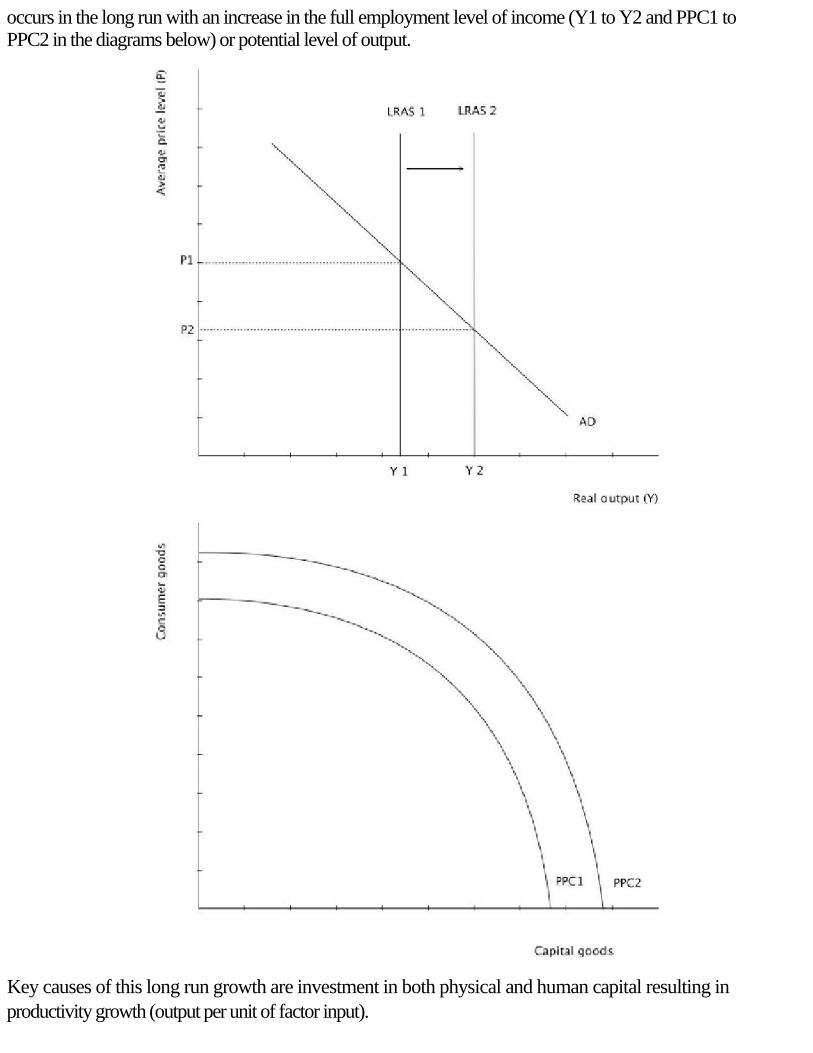
occurs in the long run with an increase in the full employment level of income (Y1 to Y2 and PPC1 to
PPC2 in the diagrams below) or potential level of output.
Key causes of this long run growth are investment in both physical and human capital resulting in
productivity growth (output per unit of factor input).
• Consequences of economic growth
Benefits of growth:
• Per capita income growth and increased consumption
• Higher living standards
• Fiscal dividend (reduced government spending and increased tax revenue)
• Reduced unemployment/increased employment
• Easier to redistribute income/care for the environment
Costs of growth:
• Inflation
• Externalities and resource depletion
• Increased importing and current account deficit
• Unbalanced growth from a focus on consumption
• Unequal distribution of income
Numerical application:
Calculate change in GDP
Calculate % change in real GDP (using a price index)
DISTRIBUTION OF INCOME
Income is unequally distributed within economies, and whilst inequality does provide some useful
functions, such as providing incentives and rewards, there is a broad acceptance of the need for
redistribution from rich to poor. Where the disagreement lies is in the amount of redistribution that
should take place, and by what means. Any analysis of income distribution needs to consider whether
taxes have been removed and benefits been added.
• Measuring the distribution of income
A Lorenz curve shows the proportion of a nation's income that is earned by any given percentage
of the population.
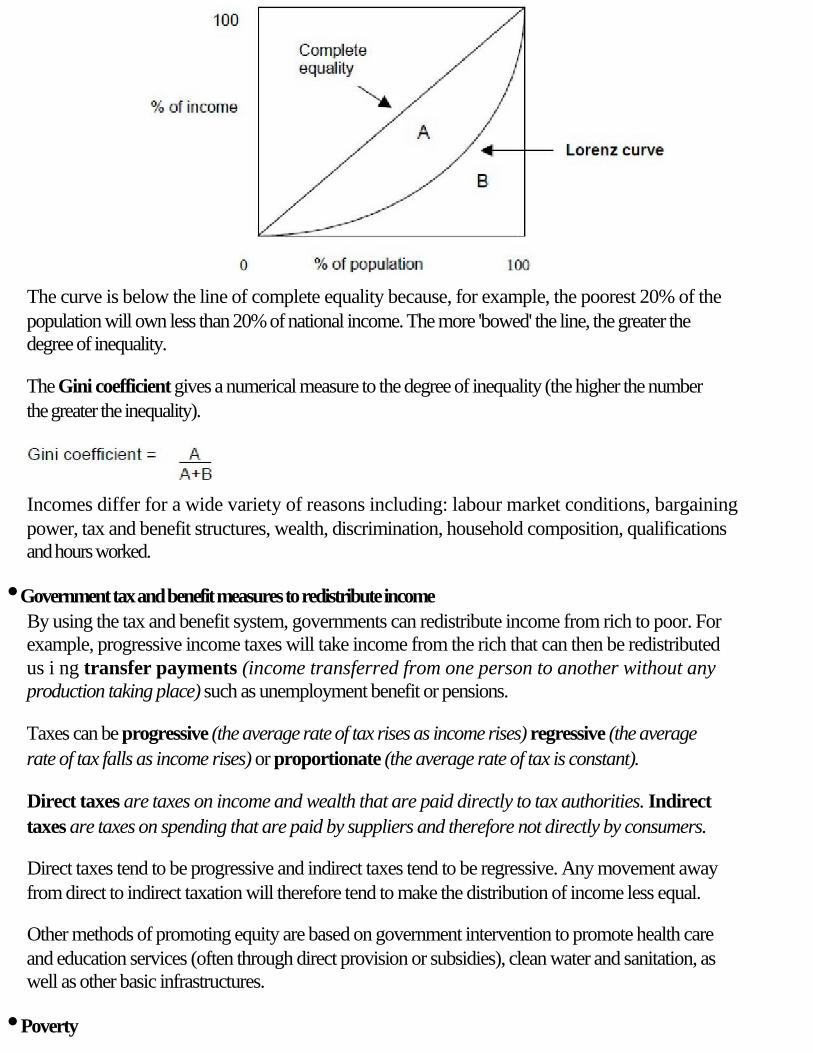
The curve is below the line of complete equality because, for example, the poorest 20% of the
population will own less than 20% of national income. The more 'bowed' the line, the greater the
degree of inequality.
The Gini coefficient gives a numerical measure to the degree of inequality (the higher the number
the greater the inequality).
Incomes differ for a wide variety of reasons including: labour market conditions, bargaining
power, tax and benefit structures, wealth, discrimination, household composition, qualifications
and hours worked.
• Government tax and benefit measures to redistribute income
By using the tax and benefit system, governments can redistribute income from rich to poor. For
example, progressive income taxes will take income from the rich that can then be redistributed
us i ng transfer payments (income transferred from one person to another without any
production taking place) such as unemployment benefit or pensions.
Taxes can be progressive (the average rate of tax rises as income rises) regressive (the average
rate of tax falls as income rises) or proportionate (the average rate of tax is constant).
Direct taxes are taxes on income and wealth that are paid directly to tax authorities. Indirect
taxes are taxes on spending that are paid by suppliers and therefore not directly by consumers.
Direct taxes tend to be progressive and indirect taxes tend to be regressive. Any movement away
from direct to indirect taxation will therefore tend to make the distribution of income less equal.
Other methods of promoting equity are based on government intervention to promote health care
and education services (often through direct provision or subsidies), clean water and sanitation, as
well as other basic infrastructures.
• Poverty
Most countries have a level of income that is defined as a 'poverty line' (set at a level that is the
minimum needed for basic needs), and if a family has an income that is below this then they are in
absolute poverty. The World Bank defines 'extreme poverty' as living on less than $1.25 a day.
Relative poverty compares incomes in a country with median incomes (a measure of income
needed for a lifestyle typical for a certain society and above absolute poverty).
Causes of poverty:
• Low incomes
• Unemployment
• Unequal distribution of ownership of land and resources
• Age, gender and other forms of discrimination
• Lack of human capital
• Poverty cycles
Consequences of poverty:
• Social problems
• Lack of access to health care and education
• Low living standards
• Higher levels of preventable disease and illness, infant mortality, child and maternal mortality
Numerical application:
Calculate marginal and average tax rates
Calculate tax payable at a given level of income
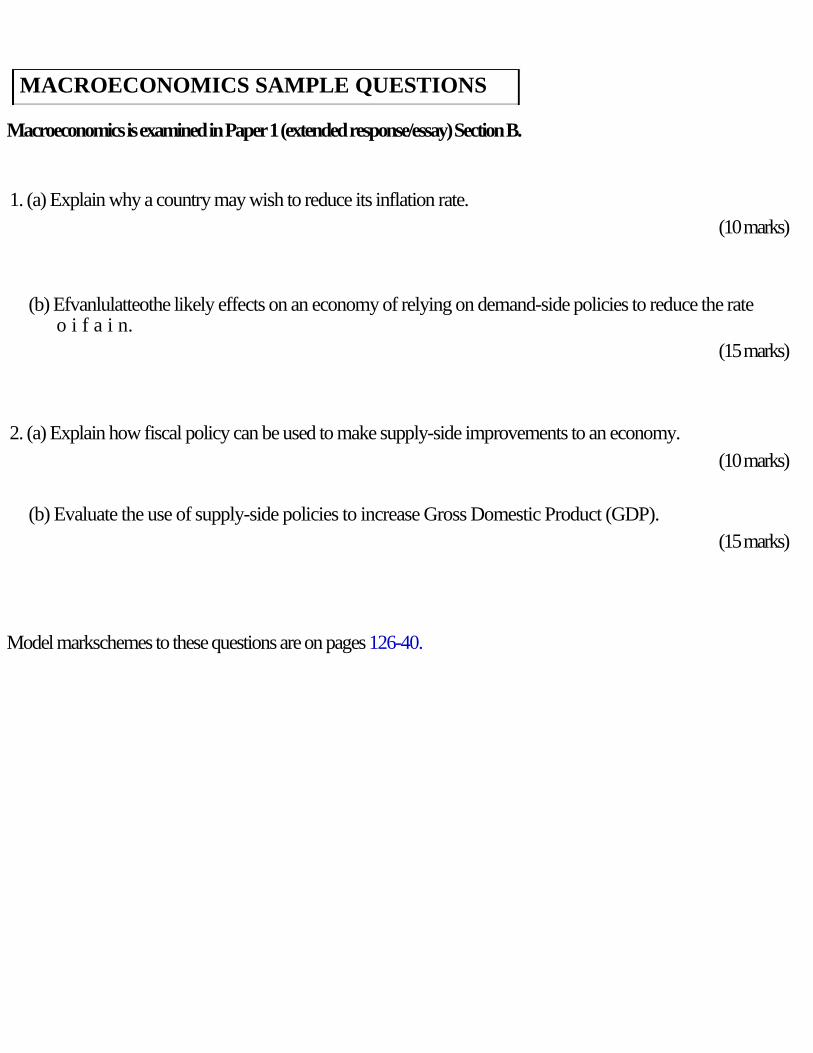
MACROECONOMICS SAMPLE QUESTIONS
Macroeconomics is examined in Paper 1 (extended response/essay) Section B.
1. (a) Explain why a country may wish to reduce its inflation rate.
(10 marks)
(b) Efvanlulatteothe likely effects on an economy of relying on demand-side policies to reduce the rate
o i f a i n.
(15 marks)
2. (a) Explain how fiscal policy can be used to make supply-side improvements to an economy.
(10 marks)
(b) Evaluate the use of supply-side policies to increase Gross Domestic Product (GDP).
(15 marks)
Model markschemes to these questions are on pages 126-40.
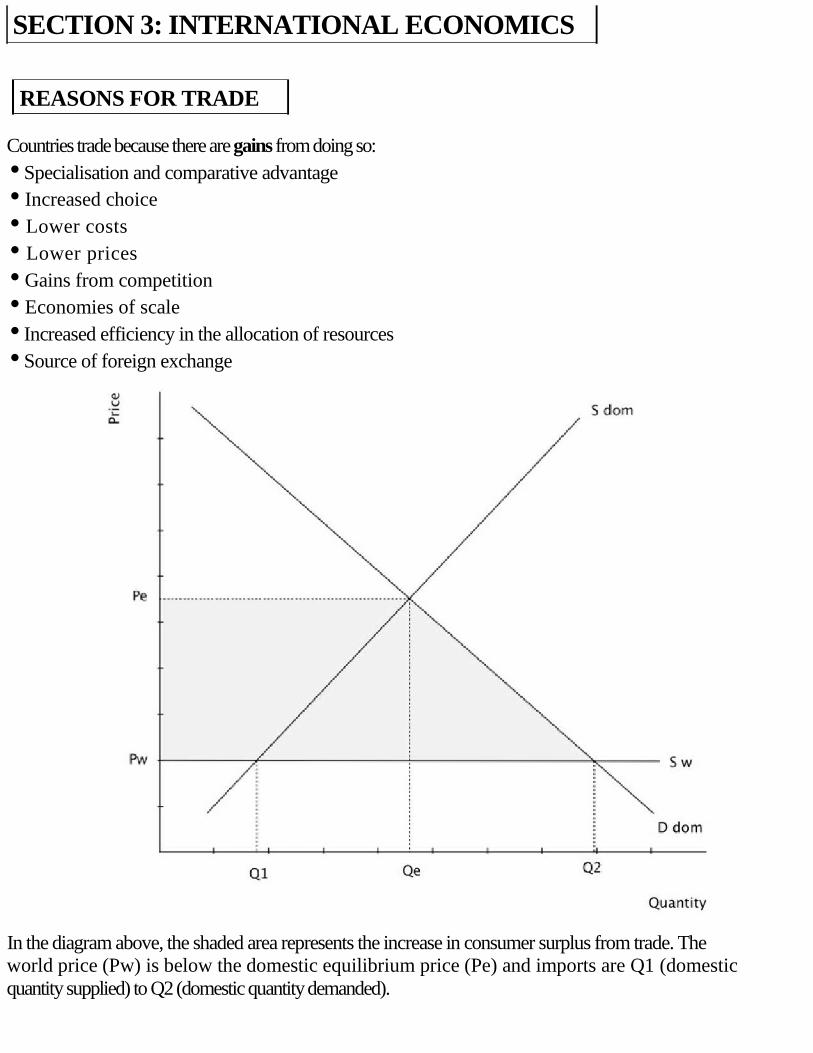
SECTION 3: INTERNATIONAL ECONOMICS
REASONS FOR TRADE
Countries trade because there are gains from doing so:
• Specialisation and comparative advantage
• Increased choice
• Lower costs
• Lower prices
• Gains from competition
• Economies of scale
• Increased efficiency in the allocation of resources
• Source of foreign exchange
In the diagram above, the shaded area represents the increase in consumer surplus from trade. The
world price (Pw) is below the domestic equilibrium price (Pe) and imports are Q1 (domestic
quantity supplied) to Q2 (domestic quantity demanded).
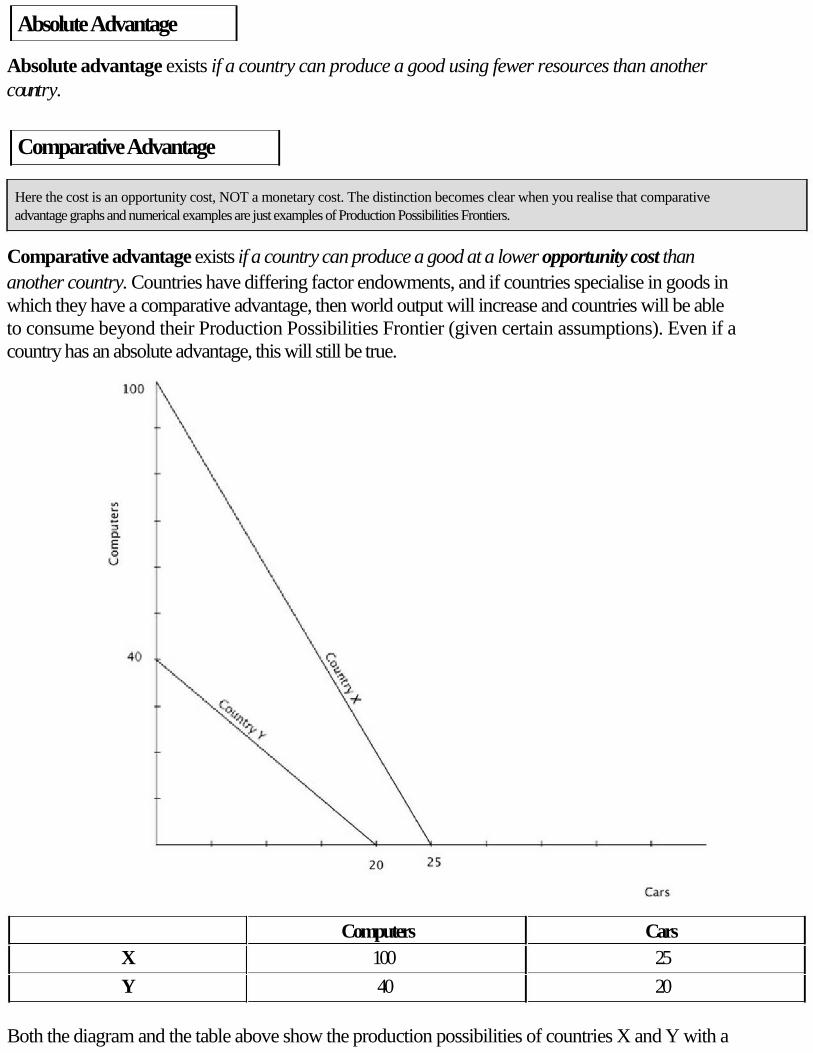
Absolute Advantage
Absolute advantage exists if a country can produce a good using fewer resources than another
c ount r y .
Comparative Advantage
Here the cost is an opportunity cost, NOT a monetary cost. The distinction becomes clear when you realise that comparative
advantage graphs and numerical examples are just examples of Production Possibilities Frontiers.
Comparative advantage exists if a country can produce a good at a lower opportunity cost than
another country. Countries have differing factor endowments, and if countries specialise in goods in
which they have a comparative advantage, then world output will increase and countries will be able
to consume beyond their Production Possibilities Frontier (given certain assumptions). Even if a
country has an absolute advantage, this will still be true.
Computers Cars
X 100 25
Y 40 20
Both the diagram and the table above show the production possibilities of countries X and Y with a
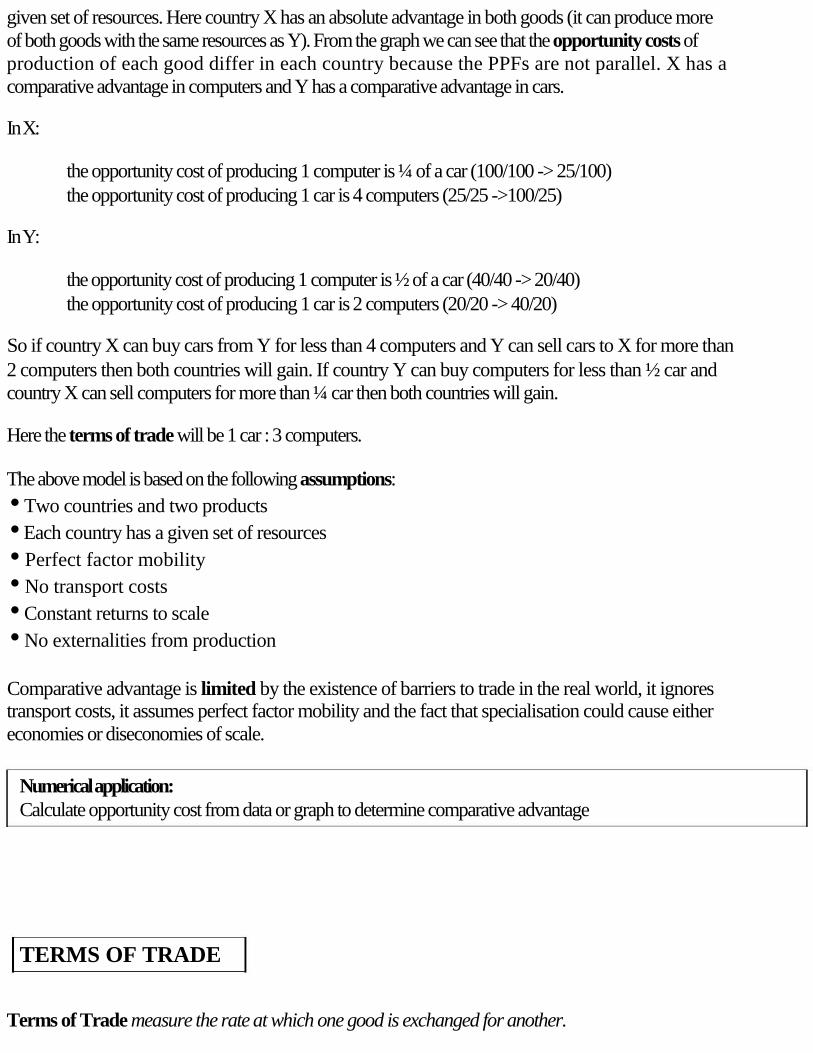
given set of resources. Here country X has an absolute advantage in both goods (it can produce more
of both goods with the same resources as Y). From the graph we can see that the opportunity costs of
production of each good differ in each country because the PPFs are not parallel. X has a
comparative advantage in computers and Y has a comparative advantage in cars.
In X:
the opportunity cost of producing 1 computer is ¼ of a car (100/100 -> 25/100)
the opportunity cost of producing 1 car is 4 computers (25/25 ->100/25)
In Y:
the opportunity cost of producing 1 computer is ½ of a car (40/40 -> 20/40)
the opportunity cost of producing 1 car is 2 computers (20/20 -> 40/20)
So if country X can buy cars from Y for less than 4 computers and Y can sell cars to X for more than
2 computers then both countries will gain. If country Y can buy computers for less than ½ car and
country X can sell computers for more than ¼ car then both countries will gain.
Here the terms of trade will be 1 car : 3 computers.
The above model is based on the following assumptions:
• Two countries and two products
• Each country has a given set of resources
• Perfect factor mobility
• No transport costs
• Constant returns to scale
• No externalities from production
Comparative advantage is limited by the existence of barriers to trade in the real world, it ignores
transport costs, it assumes perfect factor mobility and the fact that specialisation could cause either
economies or diseconomies of scale.
Numerical application:
Calculate opportunity cost from data or graph to determine comparative advantage
TERMS OF TRADE
Terms of Trade measure the rate at which one good is exchanged for another.
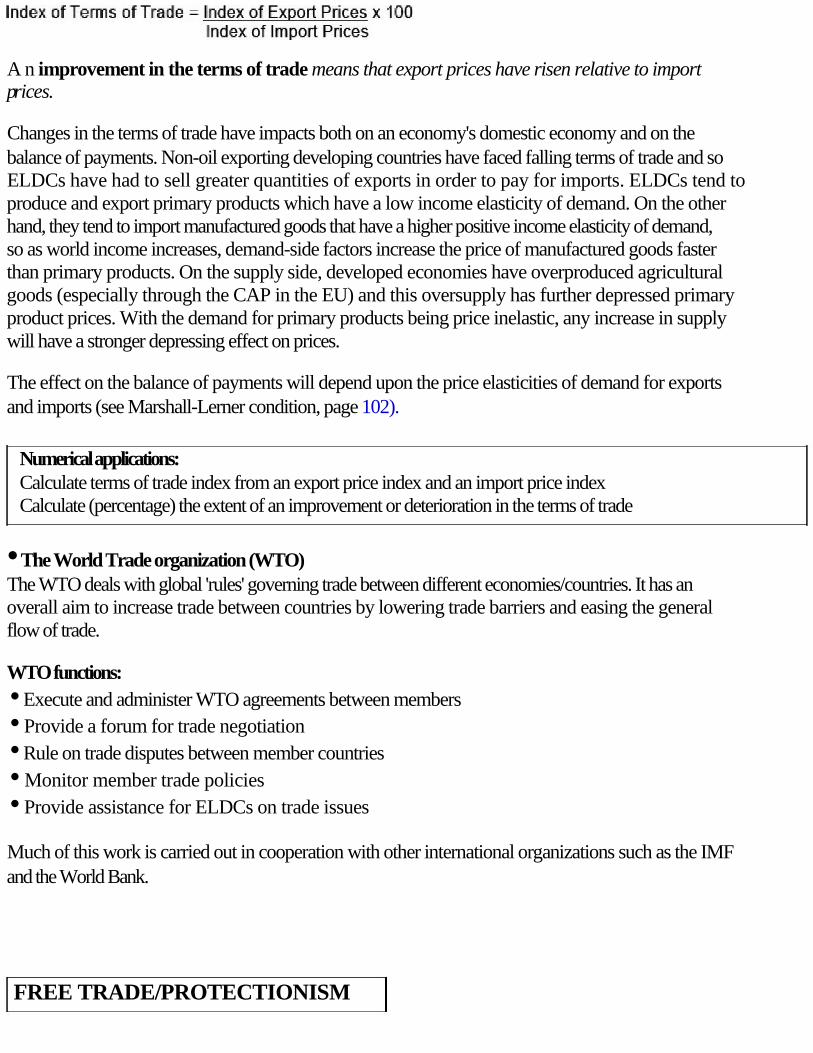
A n improvement in the terms of trade means that export prices have risen relative to import
pr i c e s .
Changes in the terms of trade have impacts both on an economy's domestic economy and on the
balance of payments. Non-oil exporting developing countries have faced falling terms of trade and so
ELDCs have had to sell greater quantities of exports in order to pay for imports. ELDCs tend to
produce and export primary products which have a low income elasticity of demand. On the other
hand, they tend to import manufactured goods that have a higher positive income elasticity of demand,
so as world income increases, demand-side factors increase the price of manufactured goods faster
than primary products. On the supply side, developed economies have overproduced agricultural
goods (especially through the CAP in the EU) and this oversupply has further depressed primary
product prices. With the demand for primary products being price inelastic, any increase in supply
will have a stronger depressing effect on prices.
The effect on the balance of payments will depend upon the price elasticities of demand for exports
and imports (see Marshall-Lerner condition, page 102).
Numerical applications:
Calculate terms of trade index from an export price index and an import price index
Calculate (percentage) the extent of an improvement or deterioration in the terms of trade
• The World Trade organization (WTO)
The WTO deals with global 'rules' governing trade between different economies/countries. It has an
overall aim to increase trade between countries by lowering trade barriers and easing the general
flow of trade.
WTO functions:
• Execute and administer WTO agreements between members
• Provide a forum for trade negotiation
• Rule on trade disputes between member countries
• Monitor member trade policies
• Provide assistance for ELDCs on trade issues
Much of this work is carried out in cooperation with other international organizations such as the IMF
and the World Bank.
FREE TRADE/PROTECTIONISM
Free trade is the international exchange of goods and services without any artificial barriers to
trade (actions taken by governments to either restrict imports or promote domestic production and
exports).
Arguments for protectionism:
• Infant industry argument
• Anti-dumping
• Protecting employment
• Balance of Payments
• Externalities and demerit goods
• Strategic/security reasons
• Unrealistic assumptions of comparative advantage
Arguments against protectionism:
• Loss of comparative advantage
• Costs to consumers/producers
• Increased prices/costs of importing
• Loss of competitiveness and efficiency
• Governments choose the wrong areas to protect
• Retaliation and trade wars
• Misallocation of resources
• Tariffs
A tax on imports both restricts imports and raises revenue for the government.
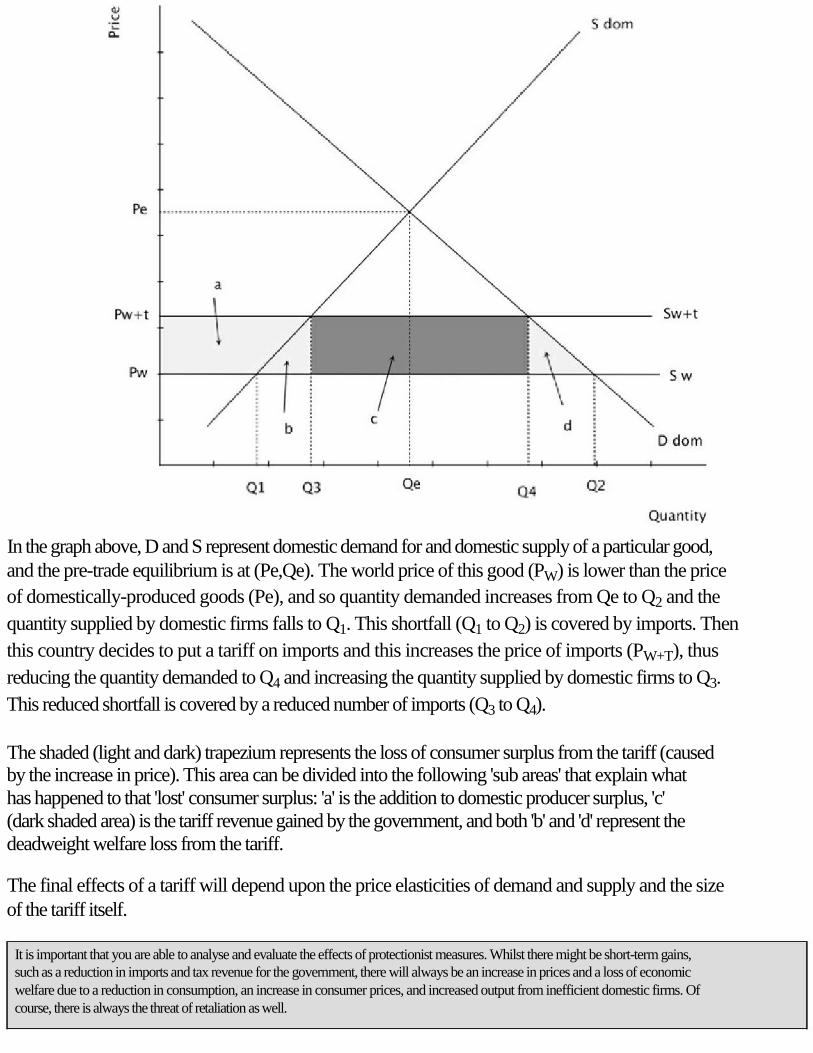
In the graph above, D and S represent domestic demand for and domestic supply of a particular good,
and the pre-trade equilibrium is at (Pe,Qe). The world price of this good (PW) is lower than the price
of domestically-produced goods (Pe), and so quantity demanded increases from Qe to Q2 and the
quantity supplied by domestic firms falls to Q1. This shortfall (Q1 to Q2) is covered by imports. Then
this country decides to put a tariff on imports and this increases the price of imports (PW+T), thus
reducing the quantity demanded to Q4 and increasing the quantity supplied by domestic firms to Q3.
This reduced shortfall is covered by a reduced number of imports (Q3 to Q4).
The shaded (light and dark) trapezium represents the loss of consumer surplus from the tariff (caused
by the increase in price). This area can be divided into the following 'sub areas' that explain what
has happened to that 'lost' consumer surplus: 'a' is the addition to domestic producer surplus, 'c'
(dark shaded area) is the tariff revenue gained by the government, and both 'b' and 'd' represent the
deadweight welfare loss from the tariff.
The final effects of a tariff will depend upon the price elasticities of demand and supply and the size
of the tariff itself.
It is important that you are able to analyse and evaluate the effects of protectionist measures. Whilst there might be short-term gains, such as a reduction in imports and tax revenue for the government, there will always be an increase in prices and a loss of economic welfare due to a reduction in consumption, an increase in consumer prices, and increased output from inefficient domestic firms. Of course, there is always the threat of retaliation as well.
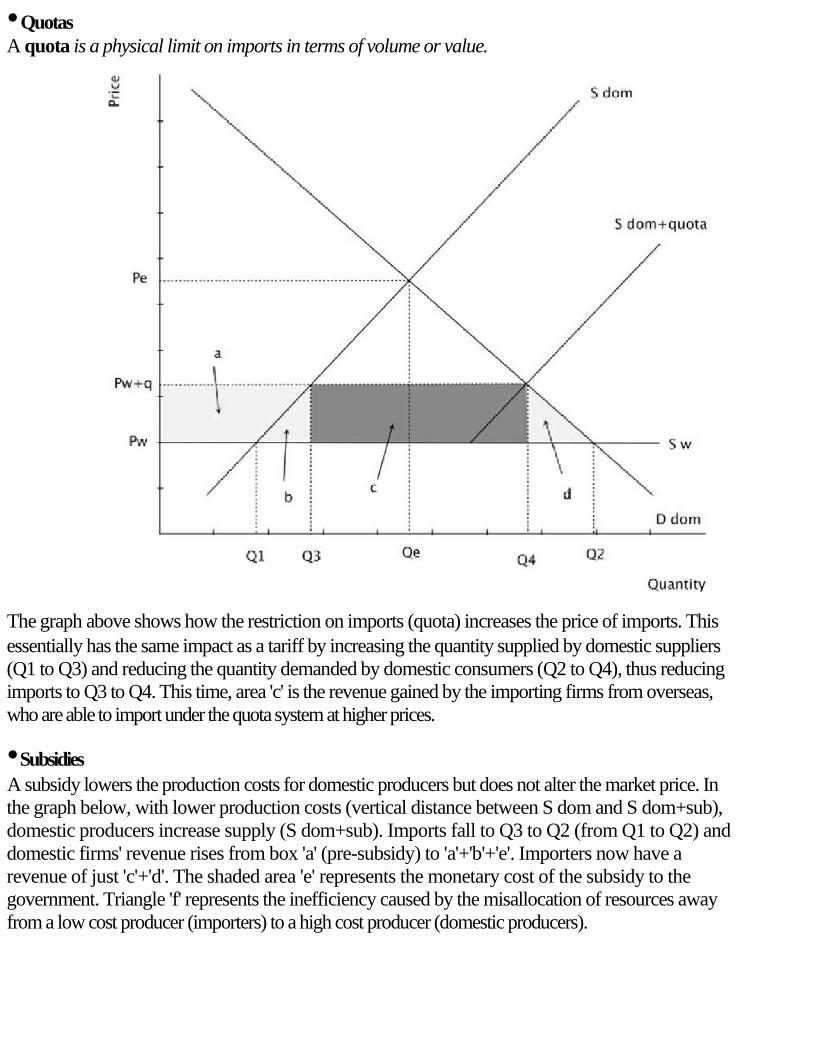
• Quotas
A quota is a physical limit on imports in terms of volume or value.
The graph above shows how the restriction on imports (quota) increases the price of imports. This
essentially has the same impact as a tariff by increasing the quantity supplied by domestic suppliers
(Q1 to Q3) and reducing the quantity demanded by domestic consumers (Q2 to Q4), thus reducing
imports to Q3 to Q4. This time, area 'c' is the revenue gained by the importing firms from overseas,
who are able to import under the quota system at higher prices.
• Subsidies
A subsidy lowers the production costs for domestic producers but does not alter the market price. In
the graph below, with lower production costs (vertical distance between S dom and S dom+sub),
domestic producers increase supply (S dom+sub). Imports fall to Q3 to Q2 (from Q1 to Q2) and
domestic firms' revenue rises from box 'a' (pre-subsidy) to 'a'+'b'+'e'. Importers now have a
revenue of just 'c'+'d'. The shaded area 'e' represents the monetary cost of the subsidy to the
government. Triangle 'f' represents the inefficiency caused by the misallocation of resources away
from a low cost producer (importers) to a high cost producer (domestic producers).
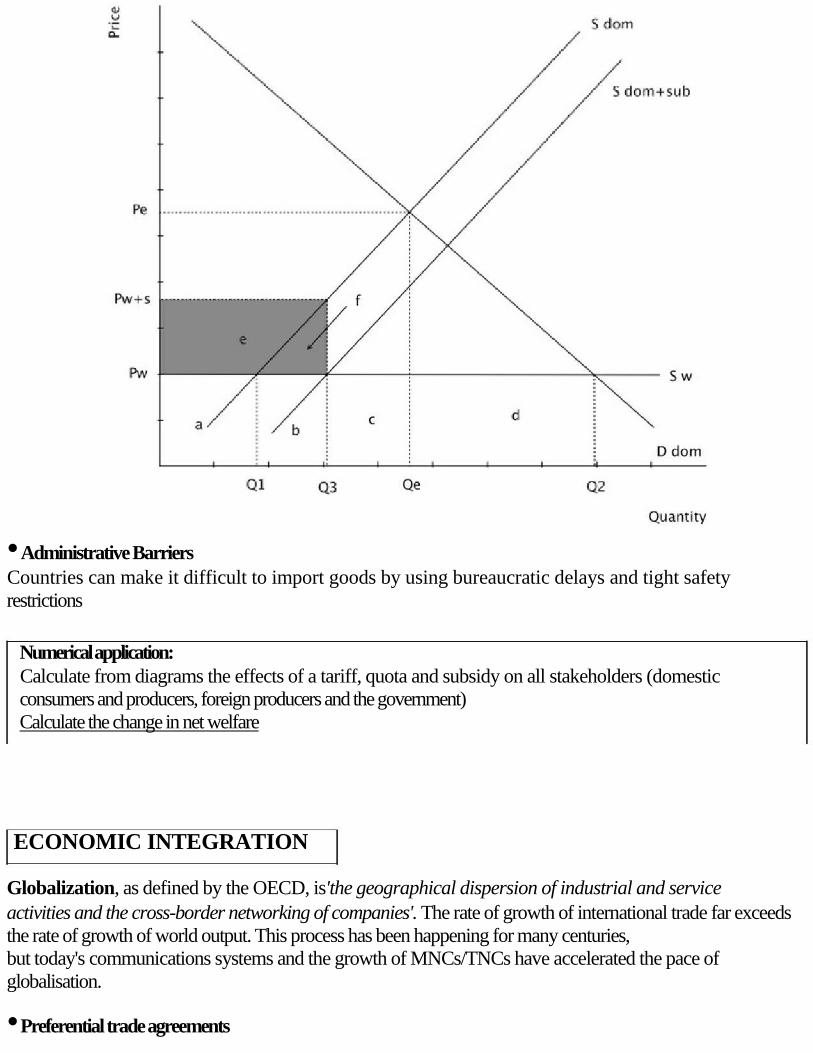
• Administrative Barriers
Countries can make it difficult to import goods by using bureaucratic delays and tight safety
restrictions
Numerical application:
Calculate from diagrams the effects of a tariff, quota and subsidy on all stakeholders (domestic
consumers and producers, foreign producers and the government)
Calculate the change in net welfare
ECONOMIC INTEGRATION
Globalization, as defined by the OECD, is'the geographical dispersion of industrial and service
activities and the cross-border networking of companies'. The rate of growth of international trade far exceeds
the rate of growth of world output. This process has been happening for many centuries,
but today's communications systems and the growth of MNCs/TNCs have accelerated the pace of
globalisation.
• Preferential trade agreements
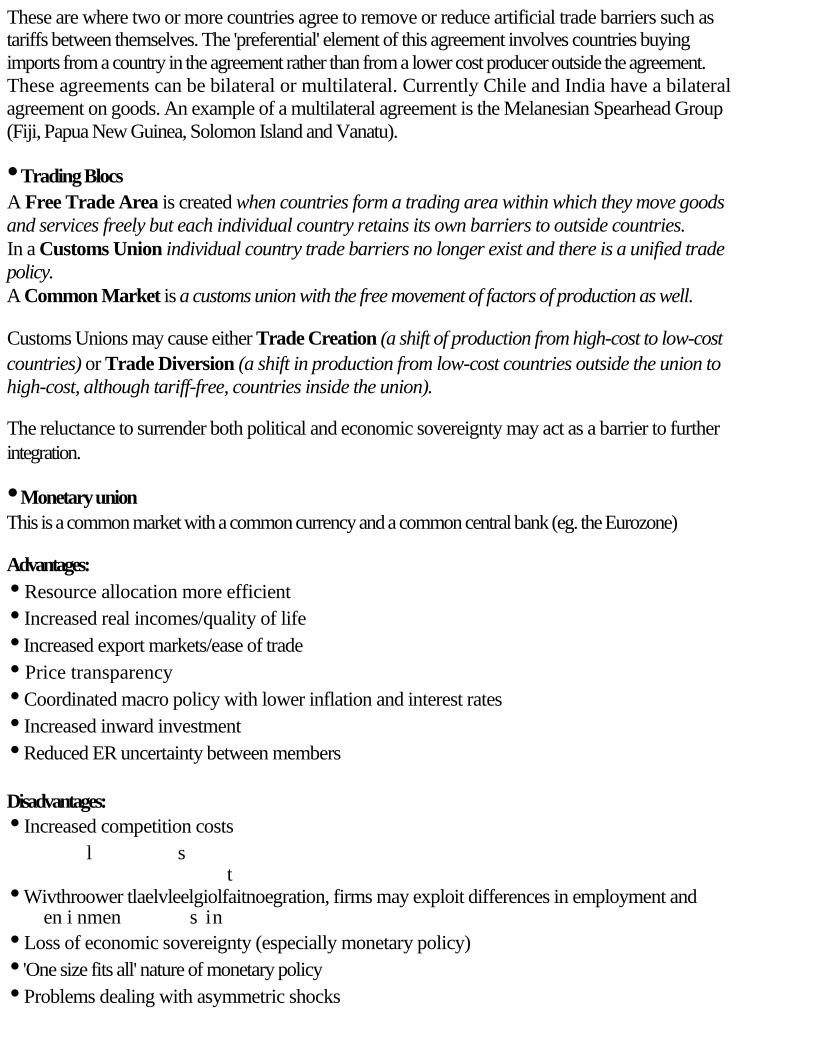
These are where two or more countries agree to remove or reduce artificial trade barriers such as
tariffs between themselves. The 'preferential' element of this agreement involves countries buying
imports from a country in the agreement rather than from a lower cost producer outside the agreement.
These agreements can be bilateral or multilateral. Currently Chile and India have a bilateral
agreement on goods. An example of a multilateral agreement is the Melanesian Spearhead Group
(Fiji, Papua New Guinea, Solomon Island and Vanatu).
• Trading Blocs
A Free Trade Area is created when countries form a trading area within which they move goods
and services freely but each individual country retains its own barriers to outside countries.
In a Customs Union individual country trade barriers no longer exist and there is a unified trade
policy.
A Common Market is a customs union with the free movement of factors of production as well.
Customs Unions may cause either Trade Creation (a shift of production from high-cost to low-cost
countries) or Trade Diversion (a shift in production from low-cost countries outside the union to
high-cost, although tariff-free, countries inside the union).
The reluctance to surrender both political and economic sovereignty may act as a barrier to further
integration.
• Monetary union
This is a common market with a common currency and a common central bank (eg. the Eurozone)
Advantages:
• Resource allocation more efficient
• Increased real incomes/quality of life
• Increased export markets/ease of trade
• Price transparency
• Coordinated macro policy with lower inflation and interest rates
• Increased inward investment
• Reduced ER uncertainty between members
Disadvantages:
• Increased competition costs
l s t
• Wivthroower tlaelvleelgiolfaitnoegration, firms may exploit differences in employment and
en i nmen s in
• Loss of economic sovereignty (especially monetary policy)
• 'One size fits all' nature of monetary policy
• Problems dealing with asymmetric shocks
EXCHANGE RATES
Your work on exchange rates should be structured around a clear understanding of the factors that determine the demand for, and
supply of, a currency. As with a normal market, a clear understanding of the determinants of market forces will enable you to apply your knowledge to a variety of situations.
An exchange rate is the price of one currency in terms of another.
• Floating Exchange Rates
Here the value of a currency is solely determined by the forces of demand and supply. There is no target
exchange rate set by the government and there is no government intervention in foreign currency
markets.
The demand for a currency is based upon:
• The demand for exports of goods and services
• Inflows of direct and portfolio investment
• Speculative buying
• Central Bank officially buying the currency
The supply of a currency is based upon:
• The demand for imported goods and services
• Outflows of direct and portfolio investment
• Speculative selling
• Central Bank officially selling the currency
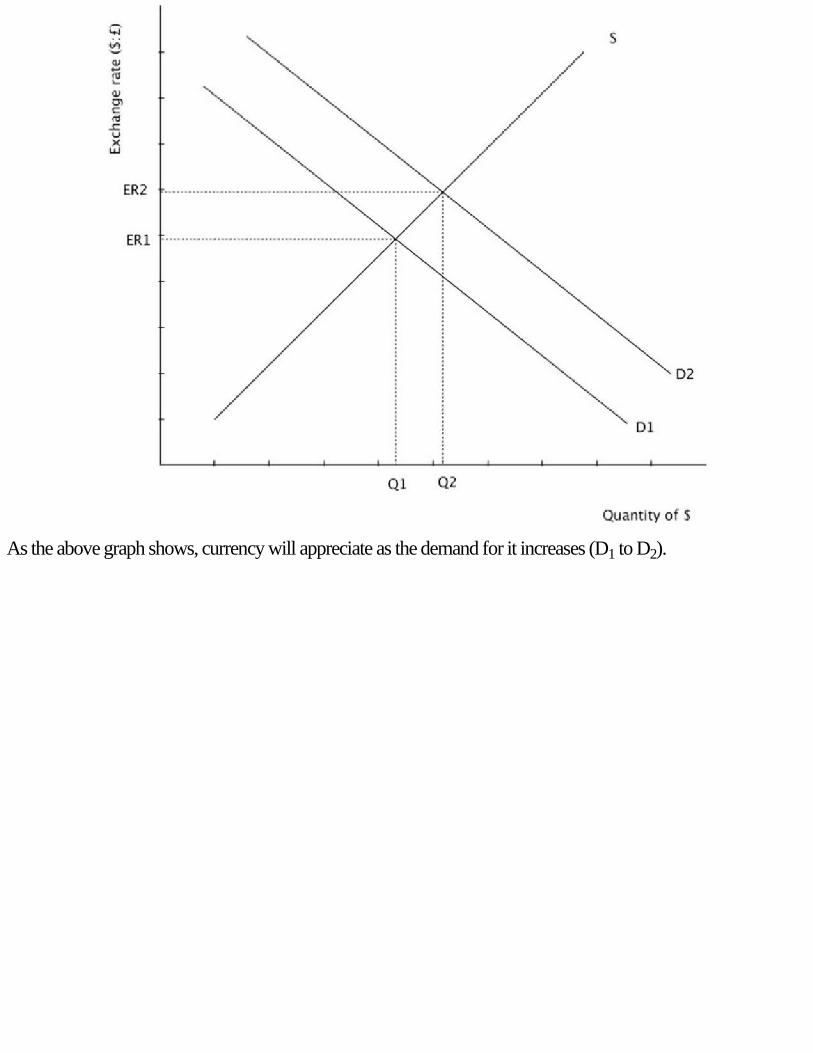
As the above graph shows, currency will appreciate as the demand for it increases (D1 to D2).
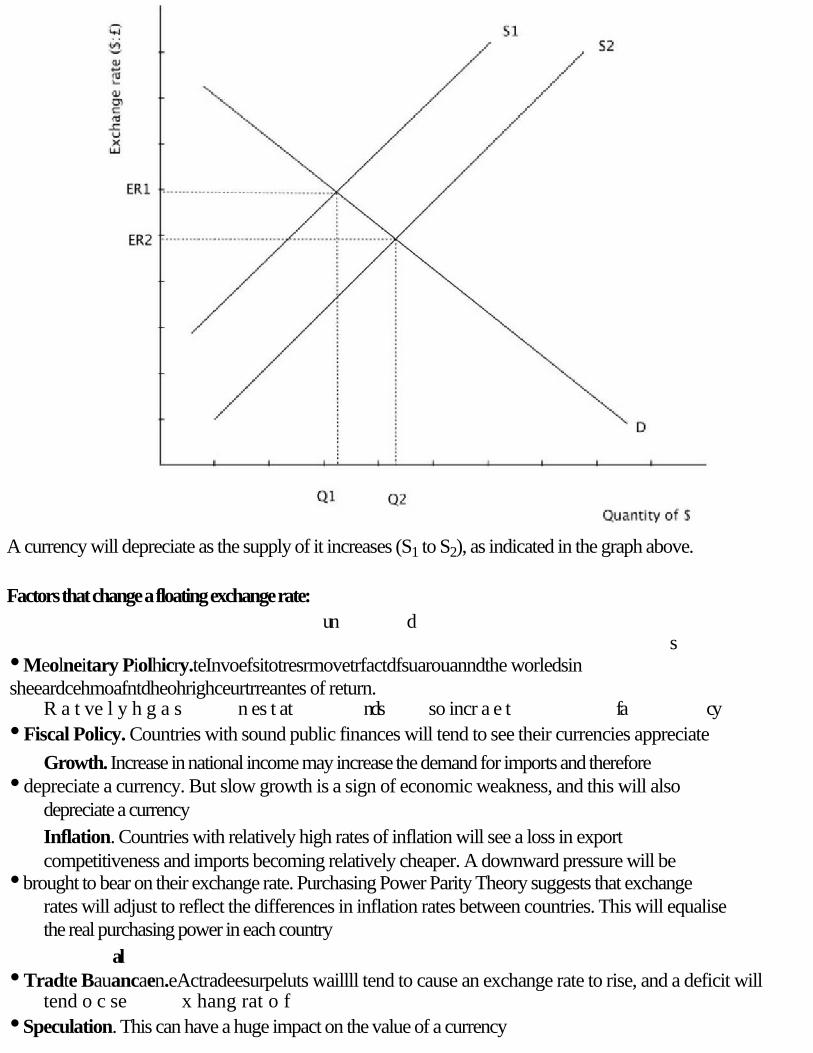
A currency will depreciate as the supply of it increases (S1 to S2), as indicated in the graph above.
Factors that change a floating exchange rate:
un d s
• Meolneitary Piolhicry.teInvoefsitotresrmovetrfactdfsuarouanndthe worledsin
sheeardcehmoafntdheohrighceurtrreantes of return.
R a t ve l y h g a s n es t at nds so incr a e t fa cy
• Fiscal Policy. Countries with sound public finances will tend to see their currencies appreciate
Growth. Increase in national income may increase the demand for imports and therefore
• depreciate a currency. But slow growth is a sign of economic weakness, and this will also
depreciate a currency
Inflation. Countries with relatively high rates of inflation will see a loss in export
competitiveness and imports becoming relatively cheaper. A downward pressure will be
• brought to bear on their exchange rate. Purchasing Power Parity Theory suggests that exchange
rates will adjust to reflect the differences in inflation rates between countries. This will equalise
the real purchasing power in each country
al
• Tradte Bauancaen.eActradeesurpeluts waillll tend to cause an exchange rate to rise, and a deficit will
tend o c se x hang rat o f
• Speculation. This can have a huge impact on the value of a currency
• Managed Floating Exchange Rates (managed float)
Here the exchange rate is determined by the forces of demand and supply, but governments (central
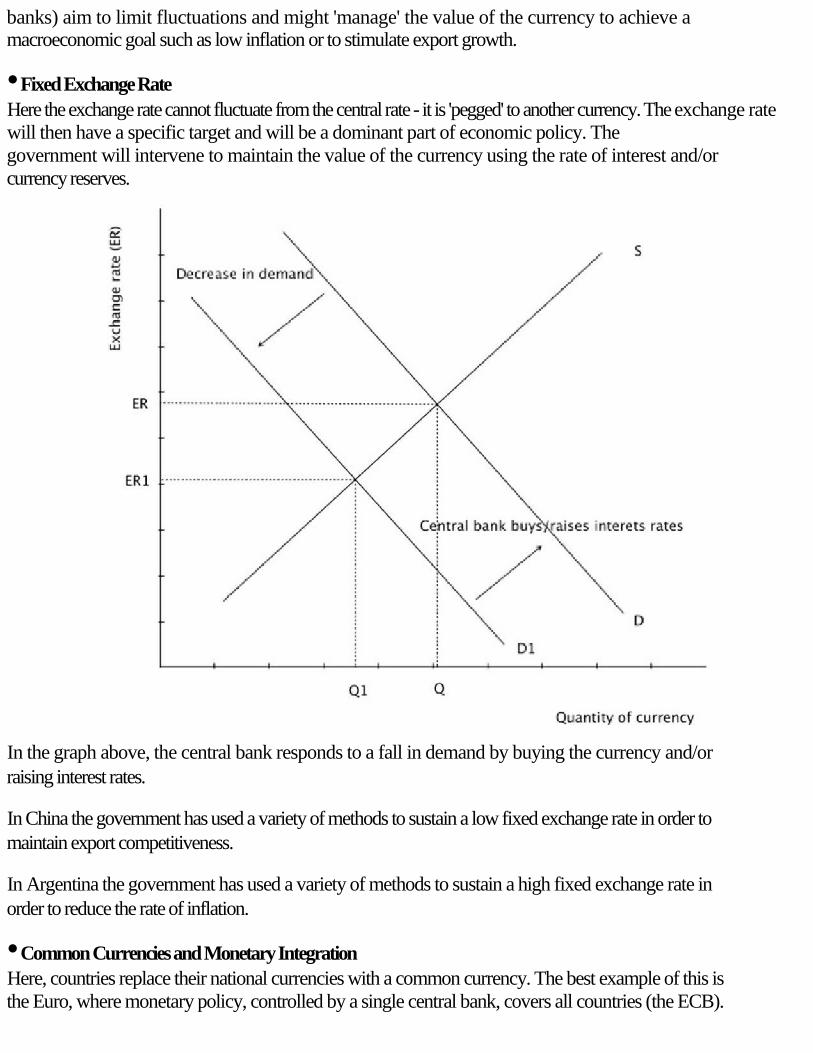
banks) aim to limit fluctuations and might 'manage' the value of the currency to achieve a
macroeconomic goal such as low inflation or to stimulate export growth.
• Fixed Exchange Rate
Here the exchange rate cannot fluctuate from the central rate - it is 'pegged' to another currency. The exchange rate
will then have a specific target and will be a dominant part of economic policy. The
government will intervene to maintain the value of the currency using the rate of interest and/or
currency reserves.
In the graph above, the central bank responds to a fall in demand by buying the currency and/or
raising interest rates.
In China the government has used a variety of methods to sustain a low fixed exchange rate in order to
maintain export competitiveness.
In Argentina the government has used a variety of methods to sustain a high fixed exchange rate in
order to reduce the rate of inflation.
• Common Currencies and Monetary Integration
Here, countries replace their national currencies with a common currency. The best example of this is
the Euro, where monetary policy, controlled by a single central bank, covers all countries (the ECB).
Advantages of a floating exchange rate:
• No need for currency reserves
• Monetary policy free to target domestic goals
• Automatic balance of payments adjustment
• Reduced risk of speculation
Advantages of fixed exchange rates:
• Inflation discipline
• Certainty through currency stability increases trade
• Reduces costs of currency hedging for firms
Advantages of a strong currency:
• Reduced import costs
• Inflationary discipline
• Improvement in the terms of trade
• Increased real purchasing power abroad
Disadvantages of a strong currency:
• Increased import penetration
• Exports struggle to maintain competitiveness
• Reduces economic growth
• Asymmetrical effects on regions and sectors
The disadvantages of each system are the opposite of the advantages of the alternative system. For example, a floating exchange rate does not provide inflation discipline, and a fixed exchange rate requires currency reserves.
Depreciation vs. devaluation
A depreciation is the fall in value of a currency in a floating exchange rate system caused by
movements in the demand for and supply of the currency. A devaluation is the fall in the value of a
currency in a fixed exchange rate system after a conscious decision by a government to reduce the
value of its currency.
Appreciation vs. revaluation
A n appreciation is the rise in value of a currency in a floating exchange rate system caused by
movements in the demand for and supply of the currency. A revaluation is the rise in the value of a
currency in a fixed exchange rate system after a conscious decision by a government to increase the
value of its currency.
Numerical application:
Calculate changes in the value of a currency from a set of data
Calculate an exchange rate from data and using linear demand and supply functions plotted from
data
Calculate, using exchange rates, the price of a good in different currencies
BALANCE OF PAYMENTS
The Balance of Payments is an account of a country's financial transactions with the rest of the
world. The current account measures the value of trade in goods and services and net investment
income and transfers. The capital and financial accounts measure capital flows (shares,
government debt and foreign investment).
The Balance of Payments must balance. If a country runs a current account deficit then this must be
funded by a financial/capital account surplus. This surplus can either come from foreign direct
investment, attracting short-term inflows of funds through attractive rates of interest, or from the
selling of government foreign currency reserves.
Current account:
• Balance of trade in goods
• Balance of trade in services
• Income
• Current transfers
Capital account:
• Capital transfers
• Transactions in non-produced, non-financial assets
Financial account:
• Direct investment
• Portfolio investment
• Reserve assets
Current account = capital account + financial account + errors and omissions
• Current account deficit
When the total value of an economy's exports of goods and services is less than the total value of
imports of goods and services from the rest of the world (including income and transfers).
A deficit will, other things being equal, exert a downward pressure on an economy's exchange rate.
Implications of a persistent current account deficit:
• Ownership of financial and capital assets transfers overseas
nw r
• Doswng iartdrpresrsuee on ER. This is inflationary, and the central bank may need to respond by
r ai i n e es t at s
• Opportunity costs of debt funding
• Effects on credit rating
• Current account surplus
When the total value of an economy's exports of goods and services is greater than the total value of
imports of goods and services from the rest of the world (including income and transfers).
A surplus will (other things being equal) exert an upward pressure on an economy's exchange rate.
Implications of a persistent current account surplus:
• Risk of protectionist measures for deficit countries
• Upward pressure on the currency
Numerical Application:
Calculate the balance of payments from data
CORRECTING A CURRENT ACCOUNT DEFICIT
• Changes in the Exchange Rate
A devaluation of an exchange rate will make exports more competitive and imports more expensive
and vice versa.
The final impact of a devaluation on the balance of payments will depend upon the Marshall-Lerner
condition (a devaluation in the exchange rate will improve the balance of payments if the sum of
the price elasticities and demand for exports and imports is greater than 1). A devaluation might
take time to have a positive effect on the balance of payments, and it might even make thing worse
initially, because of the 'J' curve effect. It takes time for traders to adjust to new prices and so the
Marshall-Lerner condition is not immediately satisfied.
• Changes in Aggregate Demand
There is obviously a strong link between international trade and
AD=C+I+G+(X-M).
An increase in export revenues will increase AD, and an increase in expenditure on imports will
decrease AD.

For a country with a high marginal propensity to import, an increase in AD will increase import
expenditure and so move the balance of payments towards a deficit.
• Protectionism
A country with a fixed exchange rate will not be able to rely upon a devaluation in order to improve the
competitiveness of its exports and so it might well have to consider protectionist measures to
attempt to improve its balance of payments.
• Supply-side policies
These aim to increase the productive potential of an economy, enabling it competitively to produce
goods for which there is an international market. These are policies that encourage resources to be
mobile towards goods and services that are in demand, and the development of areas where
comparative advantage exists. Other policies that encourage investment, innovation, competition and
flexible factor payments (especially wages) are key areas for policy focus.
• Expenditure Switching and Expenditure Changing
Under a managed exchange rate system there are some long-term options for making balance of
payments adjustments:
Expenditure switching aims to encourage domestic consumers to switch expenditure from imports to
domestic goods using policies such as protectionism, devaluation (see Marshall-Lerner condition and
the 'J' curve) and increasing competitiveness.
Expenditure changing aims to reduce aggregate demand (especially for countries with a high
marginal propensity to import) and so reduce expenditure on imports by using fiscal and monetary
policies to influence AD.
• Persistent Current Account Deficits
A deficit is caused by cyclical and structural factors and a persistent deficit will tend to be caused
by structural factors. An economy might have a problem with its competitiveness or it simply may not
produce the type of goods that are needed by its domestic consumers or in export markets. In a
floating exchange rate system the currency will depreciate, but in a fixed exchange rate system this is
not an option. Here the government will have to encourage inflows on the capital account and buy up excess
foreign currency. This can only happen in the short term, as it requires foreign currency
reserves to be used.
A country might improve its international competitiveness by increasing productivity, reducing the
costs of production, devaluing the currency, improving the quality of output, encouraging investment
and innovation, and stimulating competition by reducing protectionist measures.
• Persistent Current Account Surplus
If a country imports far less than it exports (China) then this essentially means that a country is not
using the total value of its national income to consume. The surplus national income is then 'saved' by
buying overseas financial and physical capital (a financial account inflow for countries with a current
account deficit), thus funding current accounts deficits in other countries. There will, of course, be
upward pressure on the surplus country's exchange rate. However, China maintains a 'weak' RMB in
the forex markets.
INTERNATIONAL TRADE AND EXCHANGE RATE SAMPLE
QUESTIONS
International Economics is examined in Paper 2 (data response) Section A.
1. (a) Define the following terms:
(i) Exchange rate (2 marks)
(ii) Appreciation (2 marks)
o
(b) Unsienxgcannagpeprratpr.iate diagram, explain how increased spending on food imports could affect
a ha e
(4 marks)
r en (c) Usitngiansacpopurlopaifaetetdtihaegrame,reaxpplaiicnehlowetlhancootuitnuitng increase in prices for
imported raw
ma er al d fc gen l r ev d pu .
(4 marks)
o t and
(d) Unsiencgoinnoforymoaftiton fdrecmstihentteoxti/ndtaoa uce tyoufrfsk.nowledge of economics, evaluate
the impact on
a m he io rd ar i
(8 marks)
Data responses are questions that are based upon text and data, which are not included here. There is
more information on this with the model markschemes at the end of the book.
SECTION 4: DEVELOPMENT ECONOMICS
Many economic models that appear in the section on Development Economics have already
appeared in earlier sections of this guide (as they do in the syllabus). You should seek to apply
these concepts to development issues, thus giving a topic that is often seen as not having a
theory structure behind it a clear structure for economic analysis and evaluation.
Development Economics is a dangerous area for most students, because they forget all the pure theories and concepts around which good economics is structured. Instead, Development Economics tends to slide into an unstructured mass of anecdotal stories that do little to explain, analyse and evaluate the problems experienced by developing economies. Good Development Economics will make
use of as many economic concepts as any other area of the syllabus. To help you with this, economic concepts are highlighted in bold
type.
Theory already highlighted in the micro part of the course:
• Prices: volatile commodity prices, PED/PES
• Externalities: education (+ve) and environmental damage (-ve)
• Merit goods
• Public good and common resource issues
• PPC - investment
• Opportunity cost
Theory already highlighted in the macro part of the course:
• Sources of growth
• Factor endowments and global inequality
• Gains from trade
• Problems with trade and trade barriers
• Measuring GDP etc
• Income inequality and Lorenz curves/Gini coefficients
• Government policies to targets growth (demand and supply-side)
INTRODUCTION TO DEVELOPMENT
Distinction between Growth and Development
Growth is not the same as development. Growth, measured in terms of an increase in GDP, is a
quantitative measure.
Real GDP per capita figures are an inadequate means of making comparisons both within countries
and between countries.
Limitations of GDP as a measure to compare welfare between countries:
• The 'shadow' economy often means that GDP calculations are an underestimation of actual GDP
• Regional variations exist within countries
• Externalities are unaccounted for
• New products and improvements in quality are unaccounted for
• Some countries have more leisure time for similar levels of GDP
e i n y ts s
• Curormncoesciuroennecco(untrmamabyenuostehatvemhekeacme purcshoansing power as in another country
and so
a c m n r y $ ) y do a ompari
d
• Even wriethoaccommeosn currencryenotieasllflgoouasteare traded, products are regionally
differentiated,
there a l al tax , and cur nc uct
Development is a qualitative measure of an improvement in the quality of life. An economy can
grow without developing and an economy can develop without growth, however in the long run,
economic growth is usually a necessary condition for development.
Economic development is a broad concept involving:
• Improvement in the standard of living
• Reduction in poverty
• Improved health care and education
• Reduction in underemployment
• Greater income distribution equality
• Increased freedom and choice
• Environmental protection
Characteristics of Economic Growth
• Variations in long-run growth rates
Given compound growth rates, small differences in annual growth rates can open up wide gaps in
growth and income between countries. Poor countries find it easier to achieve high growth rates than
rich countries, as they are growing from comparatively low levels of income. Growth also needs to
take into account changes in population (GDP per capita).
• Changes associated with economic growth
• Primary ⇒ Secondary ⇒ Tertiary (changes driven by income elasticity of demand)
• Urbanisation
• Growth of GDP per capita
• Increased productivity

• Increased international trade
• Pollution and environmental degradation
All economies damage the environment as they grow. Developed economies, with high levels of
consumption demand, cause environmental damage, as do countries developing from modest
foundations. Deforestation caused by clearing for farmland, timber use for fuel and exportation
causes soil erosion and contributes to global warming and a loss of biodiversity. Over-farming leads
to soil degradation. Hazardous waste products are generated by unregulated industries and slums.
Polluted water generates disease. Air pollution is caused by lack of government controls on
pollution, overpopulation and the burning for fuel of polluting materials. Carbon dioxide emissions
deplete the ozone layer, causing global warming.
• Income inequality
If growth rather than development is prioritised, investment has a central part to play. In order for
investment to occur there needs to be saving by a high-income sector, and this requires an unequal
distribution of income. In most ELDCs the richest 10% of the population own 40-50% of the total
national income.
• Sustainable development
Sustainable development means that economic growth in the short run must not compromise the
ability of an economy in the long run to meet the needs of future generations.
At the moment many of our actions, particularly those that are permanent and irreversible, are limiting
the actions of future generations. The problem is that whilst a majority of pollution is caused by
highly industrialised economies, serious and unsustainable environmental consequences will be
experienced if ELDCs use the same industrial techniques. But if ELDCs have to develop in a more
sustainable way, their growth and development will be hampered and slowed.
Solutions:
• Government provision of basic sanitation and clean water
• Extension of property rights
• Prohibition of polluting activities
• Pollution taxes
• Tradable pollution permits
• Finding environmental actions that actually promote growth
• Education of farmers and communities
• Family planning
• Removal of subsidies that encourage the use of fossil fuels
Whilst it is dangerous to generalise, there are Common characteristics of ELDCs:
• Low levels of GDP per capita
• High levels of poverty
• Relatively large agricultural/primary sectors
• Large informal/imperfect markets
• High birth rates
• Low levels of productivity
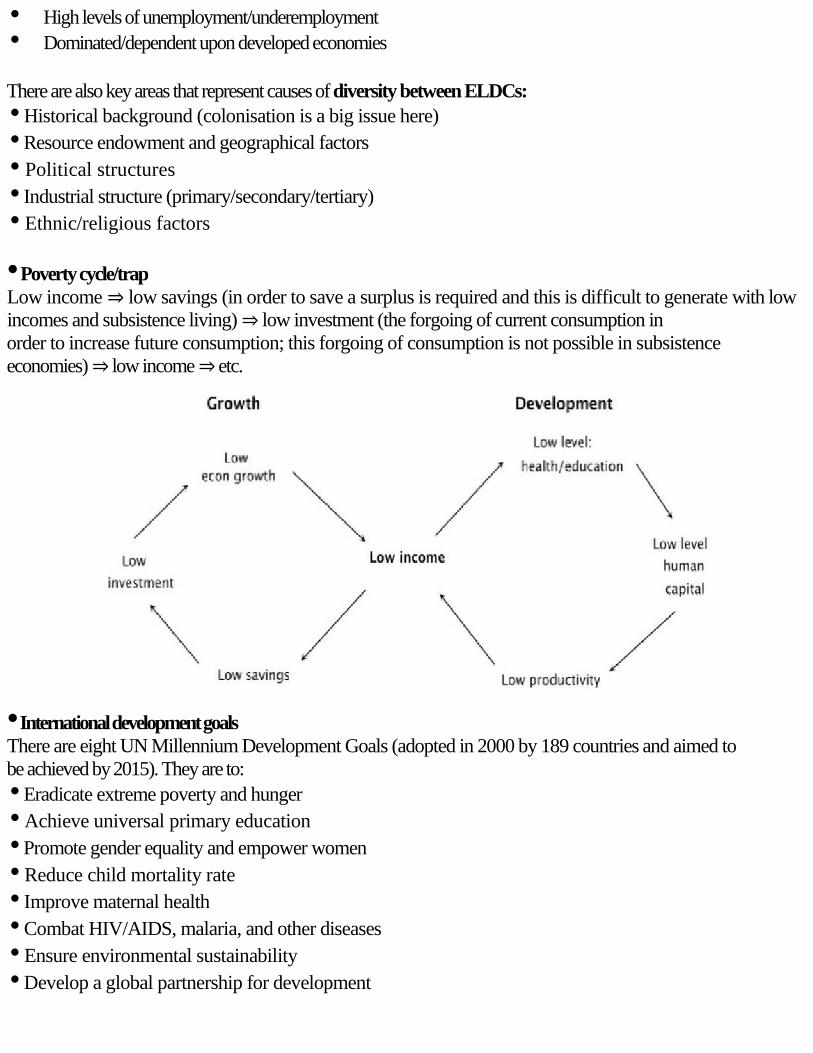
• High levels of unemployment/underemployment
• Dominated/dependent upon developed economies
There are also key areas that represent causes of diversity between ELDCs:
• Historical background (colonisation is a big issue here)
• Resource endowment and geographical factors
• Political structures
• Industrial structure (primary/secondary/tertiary)
• Ethnic/religious factors
• Poverty cycle/trap
Low income ⇒ low savings (in order to save a surplus is required and this is difficult to generate with low
incomes and subsistence living) ⇒ low investment (the forgoing of current consumption in
order to increase future consumption; this forgoing of consumption is not possible in subsistence
economies) ⇒ low income ⇒ etc.
• International development goals
There are eight UN Millennium Development Goals (adopted in 2000 by 189 countries and aimed to
be achieved by 2015). They are to:
• Eradicate extreme poverty and hunger
• Achieve universal primary education
• Promote gender equality and empower women
• Reduce child mortality rate
• Improve maternal health
• Combat HIV/AIDS, malaria, and other diseases
• Ensure environmental sustainability
• Develop a global partnership for development
MEASURING DEVELOPMENT
Indicators of Development
• Indicators
As development is so hard to define, a variety of indicators can be used:
Monetary/financial:
• GNP/GDP
N a -
• GeiP/uGeDPgpenrccapeitdi(ltoiwu,timniddle- and high-income countries). These figures are limited in
th r s , e . i om s r b o
• Use of PPP to make comparisons for GNP/GDP per capita
Health:
• Birth rates in ELDCs tend to be double those in developed countries
ct t u rha
• Loifnestexpeeaatncsytaatdbirrtsh iasndhesnmmcbheroofeyreansEtLatCsnewborn baby can expect to
live given
c ant h l h n a d , i u l w i D
f r r
• Incaundtimobtaliietybatesdmaeda)sure the number of deaths per 1000 under the age of one year (not in l ng ab s orn e
u l i g t
• Popghaetdotnwraorwsthhteendsuno be high in ELDCs, because of poverty, and the age structure is
w e i t o d t y o g
Education:
• Literacy rates are a problem for ELDCs
• Net primary education enrolment
• Primary teacher/pupil ratio
These are not an exhaustive list of possible indicators and you should feel free to develop an
understanding of ELDCs through a variety of different measures.
The key thing that you must be able to do is to compare and contrast figures, for all the above
underlined headings (including HDI data) for economically more developed and economically less
developed countries.
• Composite Indicators

The Human Development Index (HDI) is seen as a method of overcoming issues that surround the
use of single indicators. It combines GNP per capita, life expectancy and literacy rates, and shows
that growth does not necessarily equate with development. There are countries with low GNP per
capita and yet a high HDI, and vice versa.
You must be able to compare and contrast HDI figures for economically more developed and
economically less developed countries.

Often countries have different global rankings for GDP/GNI per capital in comparison to their global
ranking for HDI. Kuwait is a good country to illustrate such differences in ranking (5th for GDP per
capital and 45th for HDI). These differences can be explained by political factors and the choices that
policymakers make in terms of prioritising growth and development. Some countries clearly
underperform in HDI terms in relation to their income levels.
DOMESTIC FACTORS
• Education and health
People create wealth. An expanding population might mean a plentiful labour supply but it will also tend to
reduce GNP per capita. The quality of labour is important and so investment in education, training and health
care needs to take place - but it involves an opportunity cost. Entrepreneurs are
also needed. Social and cultural barriers often exist and inhibit change, new methods of working, and
a more scientific approach to production. There is very strong statistical evidence of the link between
education/health and income growth. Health is a clear improvement of the quality of life and enables
individuals to have a more consistent working life. Both factors enable workers to be more
productive.
In the provision of both education and health care there is often a high degree of opportunity cost for
governments, and also for families 'releasing' children from work to education.
• Appropriate technology
Investment is the forgoing of current consumption for increased future consumption.
Technological change and capital investment often go hand-in-hand. Development depends upon
appropriate technology, enabling ELDCs to focus on reducing poverty instead of simply enabling
income to increase.
• Credit and micro-credit
Investment cannot take place unless there is saving, but saving requires there to be surplus income.
Financial institutions such as stock exchanges, savings and investment banks play an important role in
channelling savings towards investment opportunities. These often do not effectively exist for small
firms and farms, and this is where a large part of economic activity happens in ELDCs and where
inroads can be made into poverty.
Micro-credit schemes are systems of small loans for income-generating activities (eg. fish farming,
mat-weaving, small-scale retailing and brick-making) which enable poor communities in ELDCs to
gain some economic stability. Schemes are planned to provide people with the resources they need
without encouraging debt. Micro-credit represents a significant way in which people can make a
difference to their own lives without the dependence associated with hand-outs. Credit is often only
given after a period of financial and skill training has been completed, and the schemes are designed
to meet the particular needs and circumstances of those individuals taking part. Schemes aim to
enable communities to diversify their skills so that communities do not suffer the problems associated
with an over-concentration on one particular skill. Most micro-credit institutions also encourage
saving.
• Empowerment of women
Women are in a position to play an important role in development. The more educated women
become, the lower birth rates tend to be. This reduces dependency rates and enables existing
education/health/food resources to be divided among fewer people. Of course population growth
rates also affect GDP per capita. Women workers are an important resource, but one which is
'underused' (in terms of the production of output) in many ELDCs.
• Income distribution
A highly unequal distribution of income tends to constrain growth and development because those on
low incomes have a high propensity to consume (low savings results in low levels of investment) and
the wealthy, gaining political power, tend to generate policies that favour the status quo. Wealthy
individuals in ELDCs also tend to have a high marginal propensity to import and generate large
amounts of 'capital flight'.
• Institutional Factors
Taxes, legal frameworks, over-regulation, a lack of effective property rights and traditional
thoughts and practices can all provide the wrong incentives and act as barriers to development. Also
a lack of basic infrastructure inhibits development.
Political instability, a lack of national cohesion and the cultural and economic attitudes needed for
economic growth as well as the desire by developed countries to maintain the present status quo all
act as barriers to growth.
In the formal economy activities are recorded officially but in many ELDCseconomic activity is
often unrecorded and even illegal and this is the informal economy.
INTERNATIONAL TRADE
International trade problems:
• Over-specialisation
Adverse movements in the terms of trade and protectionist measures by developed economies are both strong
barriers to development. The cause of adverse movements in the terms of trade has
already been covered. Many ELDCs also focus on a narrow range of exports.
• Primary product price volatility
The volatility of commodity prices has already been covered earlier in this guide. The volatility of
prices will affect revenues/incomes, making investment and planning difficult for both firms and
governments.
• Inability to access international markets
Many ELDCs are concerned that countries such as the USA and those in the European Union support
free trade on the one hand and yet use subsidies and other methods as trade barriers. These are used
to unfairly support their domestic industries with the result that world markets are flooded with
surplus goods, driving prices down. Many protectionist measures that exist do so in the form of
standards and regulations that are technically hard or costly for ELDCs to comply with.
Trade strategies:
• Open, outward-oriented (export promotion) vs. closed, inward-oriented (import substitution)
An open, outward-oriented strategy aims to encourage export production to fund imports, and a
closed, inward-oriented strategy aims to discourage imports and provide domestically-produced
substitutes.
An open, outward-oriented strategy embraces free trade (although facing problems caused by
developed world protectionism), MNCs and the free movement of productive resources. Because of
the problems mentioned above with primary products, exports will tend to centre on manufactured
goods. This approach has been key to rapid growth rates in China and India.
In theory, countries should specialise in producing goods and services in which they have a
comparative advantage. Practically, for most ELDCs, this meansprimary goods. Developed
economies dominate world trade, with ELDCs representing around 20% of world exports (although
this figure is inflated by ELDCs that export oil). A dependence on primary products has resulted in a
slow growth of exports (low YED and protectionism by developed countries), fast growth of imports
(high YED), and worsening terms of trade.
A closed, inward-oriented strategy erects tariffs and other protectionist measures. It does not
embrace the activities of MNCs, and restricts the movement of resources. Many countries taking this
approach have experienced low growth (Ghana, and many South American countries).
• Trade liberalisation
Moves towards 'freer' trade, it is believed, will help ELDCs focus on exporting goods and services
in which they have a comparative advantage (covered earlier on in this guide).
• The role of the WTO
This is covered earlier on in this guide.
• Diversification
As already mentioned, a narrow focus on primary product exports is problematic for ELDCs.
Diversification aims to move production into the secondary sector exporting manufactured/semi-
manufactured goods and thus avoiding the problems of primary products. With this strategy should come
higher and more stable revenues as well as gains in skill, capital investment, productivity and
incomes.
• Bilateral and regional preferential trade agreements
These are covered earlier on in this guide.
• Fair Trade organizations
The 48 least-developed countries are home to 10 per cent of the world's citizens and their share of
world exports has declined to 0.4 per cent over the past two decades. The USA and EU contain
roughly the same number of people and account for nearly 50 per cent of world exports. Small traders
find it hard to compete in a world in which trade has been 'liberalised' by the WTO. If small traders
and ELDCs can be helped to overcome the significant barriers to fair trade, then trade can be a
solution to slow growth and underdevelopment.
Fair Trade guarantees a price for producers that covers their costs of production and provides a
sustainable living. It also provides long-term contracts and business training vital for long-term
stability. Fair trade allows consumers to purchase goods that actually start to favour commodity
producers in ELDCs.
FOREIGN DIRECT INVESTMENT
• Foreign Investment (MNCs)
FDI is often centred on the activities of MNCs (multi national corporations) who invest, in the long
run, in expanding existing productive capacity or buying out existing firms overseas. These
corporations do not just bring investment funds into ELDCs, but they also bring new technology,
training, entrepreneurial skills (helping fill resource gaps), open new markets and have a multiplier
effect on the wider economy. These new enterprises create jobs, generate export and tax revenue. On
the other hand, monopolistic MNCs can be criticised for beinginefficient, exploiting cheap labour
and avoiding paying tax wherever possible as well as exploiting relaxed environmental regulations.
MNCs are attracted by new markets, natural resources, low labour, costs and regulatory frameworks
that are often more 'relaxed' than in more developed countries.
Potential advantages of FDI:
• Investment in physical and financial resources overcoming the saving 'gap'
• Employment
• Training and education, expertise and R&D
• Improvements to local infrastructure
• Tax revenue
• Local multiplier effects
• Competition benefits
• Wider choice and lower prices for ELDC consumers
Potential disadvantages of FDI:
• Little impact on employment as own management teams are 'parachuted' in with impact of training thus limited
• Profits repatriated and taxes avoided
• Borrowing from ELDC financial sectors 'crowds out' local domestic investment spending
• Political power/influence over ELDC governments
• Transfer pricing to take advantage of different tax rates between countries
• Use/extract resources then leave
• Take advantage of 'relaxed' labour market and environmental regulations
AID AND MULTILATERAL ASSISTANCE
You need to be able to compare and contrast the nature and sources of ODA in two ELDCs.
• Aid
Aid to ELDCs comes from two sources:
• Donor governments, called official development assistance (ODA)
• Non-governmental organisations (NGOs)
Humanitarian aid (alleviation of short-term issues and NGO priority):
• Food aid
• Medical aid
• Emergency relief aid
Development aid (long-term aid and often ODA focus):
• Grants
• Concessional long-term loans
• Project aid
• Tied aid
• Technical assistance
Bilateral aid is given by individual governments and multilateral aid is given by multilateral
agencies such as the World Bank.
Aid can help to fill resource gaps, which probably most often appear as a lack of capital goods. Aid
can also involve developing much needed skills with which the aid itself can effectively be used.
Tied aid is very common, and donor countries often have one eye on how they will benefit from
giving aid. Aid can also delay much needed reforms, do little to reduce income inequalities, and
support/fund dictatorships.
Grants may be used to fund specific projects or education and soft loans have lower rates of interest
and more relaxed conditions. Food aid might be given using surpluses.
There are often less than ideal motives for countries giving aid, with politics and self-interest in
ELDCs with abundant natural resources playing a part.
Benefits of aid:
• Fills savings and foreign exchange gaps
• Funds health/education/infrastructure
• Aids recovery from disaster
Disadvantages of aid:
• Does not reach those most in need
• ELDCs lack skills to carry out projects effectively
• Food aid causes dependency
• Tied aid
• Dependency culture develops
• Aid strengthens government control
• Industrialisation might happen too quickly
• Resources diverted away from productive sectors
• Corruption
Whilst aid might help fill in 'gaps', and certainly NGOs do provide a lot of important funds which
often bypass governments and so reach the people most in need, aid is no substitute for sound
economic policies and good economic management in general. Whilst the amount ($) of aid is
growing in absolute terms when measured as a percentage of donor country national incomes, it is in
relative decline. Few countries (Denmark, Luxembourg, Netherlands, Norway and Sweden) have
reached the OECD guideline of 0.7% of GNI. The USA donates around 0.2% of GNI.
• Trade vs. aid
The theoretical benefits of trade to ELDCs have already been outlined. Trade could expand export
markets and enable a growth in incomes/revenues that can then be used to fund capital and human
capital investment, and primary sectors may be able to access the benefits from economies of scale.
Diversification may also be possible and enable ELDCs to access further export markets. Increases in
income may then play a key role in reversing existing poverty cycles/traps. With increased incomes
comes the possibility of a reduced reliance on aid.
However there are a number of significant barriers to such a process. Currently the USA and EU
subsidise/protect their agricultural markets to a significant extent and this acts as a very effective
barrier to 'free' trade in exactly the markets in which many ELDCs have a comparative advantage.
ELDCs have had to also contend with falling commodity prices due to over-production by the
subsidised US and EU economies. Freer trade would also result in many exceptions to WTO rules,
which would have to be abandoned by ELDCs, and this would result in a competitive environment in

which they would be at a distinct disadvantage.
• The IMF
The IMF aims to foster global monetary cooperation, secure financial stability, facilitate international
trade, promote high levels of employment and sustainable economic growth, and reduce world
poverty. IMF loans usually come with a package of policies, known as stabilisation policies. These
policies have meant that ELDC governments have been restricted in their use offiscal policy.
Government spending is restricted, and tax systems are reformed to collect revenue more effectively,
be more progressive and counter tax avoidance/evasion by the wealthy. Most policies, focusing on
reforming the structure of ELDC economies, aresupply-side policies. Given the structure of these
economies, an active demand management policy is hard to organise. Stabilisation programmes often
impart a sharp shock to ELDC economies with which they are not able to cope. The tightening of
domestic monetary and fiscal policies reduces aggregate demand leading to recession. The IMF
'blueprint' often fails to recognise the differences between individual countries and there are cases
where countries that have followed a different path from that suggested by the IMF, have been able to
develop just as well, if not better, than those following IMF advice. IMF decision-making is also
dominated by rich countries.
• The World Bank
The World Bank attempted to encourage growth and development through loans for investment with
accompanying advice and tight conditions for repayment. During the 1970s and 1980s Structural
adjustment programmes (SAPs) caused many problems for the ELDCs associated with these two
international institutions. Whilst targeting growth, programmes were criticised for causing de-
development and so the bank now has much more of a focus on sustainable development as well as
poverty alleviation and debt relief for poor countries.
More recently the World Bank has focused on sustainable development, the breaking of poverty
cycles and the institutional reforms needed for the effective working of markets, for example:
• Health care and education provision
• Effective taxation systems
• Access to credit
• Property rights
• Empowerment of women
• Reduced corruption
• Infrastructure
• Innovation
• Political rights
As with the IMF, World Bank decision-making is dominated by rich countries and the scope of the
changes advised can result in a 'loss of sovereignty' for many ELDCs. Tight conditions for ELDCs
(tight fiscal and monetary policies and well as free trade) can seem very harsh for poor countries and
often result in a widening income distribution.
INTERNATIONAL DEBT
• International finance
The debt problem has its roots back in the 1973/4 petrol price inflation and 'petrodollars' flooding
banks in rich countries. Many of these banks loaned this inflow of funds to ELDCs who were
importing oil and thus needed foreign exchange to help with their current account deficits. Debts
involve huge servicing costs (both the principle loan and the interest payments) which have to be paid
before anything else. Debt therefore severely hampers a country's attempts to develop, as income has
to be used for debt repayment rather than investment in capital, human capital or social and economic
infrastructure. A rescheduling of debts has often been accompanied by forced structural reforms. These
reforms have been based upon market forces, supply-side policies, deflationary fiscal and
monetary policies to target inflation, the reduction of government debt and the encouragement of
exports by devaluing the currency. These reforms have often been a painful experience for many
ELDCs, resulting in reduced welfare provision and widening income distribution.
The HIPC (Heavily Indebted Poor Country) Initiative along with the MDRI (Multilateral Debt Relie
Initiative) both seek to provide debt relief to the most indebted ELDCs. Countries qualify if their GNI
per capita is below a certain level and then they have to follow World Bank/IMF policies and use
any 'savings' for poverty reduction.
ELDCs can also suffer problems by not being able to convert their domestic currency(non-
convertible currency) for foreign currencies causing obvious problems for international trade.
Capital flight is a capital outflow from any country, but for ELDCs this can be a particular problem
as valuable funds for investment resources move to another country.
MARKETS VS. INTERVENTION
• Market-oriented policies
Policies:
• Free trade
• Floating exchange rates
• Labour market reforms
• Deregulation and privatisation
• Liberalised flows of capital, goods and services
Strengths:
• Reduced incidence of government failure
• Efficient working of the price mechanism
• Competition and efficiency
• Allocative and productive efficiency from reduced barriers to entry and the movement of
resources
Weaknesses:
• Market failure (externalities and merit goods especially)
• Asymmetric information in markets
• Weak/missing institutions needed for effective markets
• Income/access to resource and credit inequality
• Development of dual economy
• Interventionist policies
Policies:
• Provision of infrastructure
• State provided/subsidised education and health care
• Welfare safety nets
• Demand-side policies to maintain macro stability
Strengths:
• Correction of market failure
• Stable macro objectives
• Reduced income inequality and safety nets provided
• Infrastructure provision
Weaknesses:
• Government failure
• Red tape, bureaucracy and corruption
• Planning problems through lack of information and time-lags
• Market with government intervention
Good governance is key to balancing markets and intervention effectively, focusing on how rather
than what policies are pursued. There are many examples of how intervention can work (health care,
education and infrastructure) and there are many examples where markets work (export promotion,
reduced trade barriers, privatisation). Whilst the poorest ELDCs can certainly benefit from initially
more interventionist policies, a gradual withdrawal of government 'control' is seen as ideal. There is
no 'blueprint' set of policies: all countries are unique, with different histories, resources
endowments, different cultures and different circumstances.
DEVELOPMENT ECONOMICS SAMPLE QUESTIONS
Development Economics is examined in Paper 2 (data response) Section B.
1. (a) Define the following terms:
(i)
(ii)
Economic development
Bilateral aid
(2 marks)
(2 marks)
(b) Explain how foreign aid can help a country to break out of a poverty cycle.
(4 marks)
i fr ]
(c) Wdtehxr(eHeDencegtuore[so,r explnatirn whayntdheroeuinstra difference between the Human
Development
In I) fi f c ou y A c y B.
(4 marks)
otf / (d) Ufsfiengiivnefnermaoifoanidronmptrhemtexitndaetaoannodmyioudrekneolwpledeget.of
economics, evaluate the
e ct ss i o ot g c c v o mn
(8 marks)
Data responses are questions that are based upon text and data, which are not included here. There is
more information on this with the model markschemes at the end of the book.

REVISION ADVICE
Whatever subject you are revising for, your aims, and to a certain extent, your methods, are the same.
You are aiming to learn your subject material, and to develop exam skills.
Each person has to find the revision technique which works best for them. If you are in the final stages
of your IB revision in the run-up to your exams you will probably have been able to try out some
techniques already in your trial exams and will know whether they have worked for you or not. If they
have not worked, then don't use them again. Try something different.
One of the dangers of just reading through your notes (apart from the fact that this tends to send even
the most enthusiastic student to sleep) is that you will confuse understanding with memory.
Understanding and memory are different brain functions. You understand your notes, but you can
never be sure that you have actually acquired and internalised the information they contain. You must
test your knowledge to be sure of this.
The good news is that this doesn't have to mean sitting through three-hour trial exam papers! To learn
your material, you will have to go over it again and again (there is no substitute for this repetition:
it's the way that your brain creates the neurological connections which constitute memory). Practise the
techniques that you will be using in the exam: defining terms, drawing and explaining diagrams,
brainstorming, essay plans (you will be doing essay plans in the exam!), graph drawing etc., all of which will
enable you to test your knowledge, and develop and practise exam skills in an efficient
timeframe. The most effective time period to revisit a chunk of material is between 20-30 minutes;
any more and your brain's efficiency starts to decline (the law of diminishing marginal returns), and
any less it doesn't have time to get into gear. In 20 minutes you can do two essay plans.
Always start with what you know. Say, for example, you are revising monopoly. Your first revision
of this topic might start with a blank sheet of paper on which you write everything you can think of
about monopoly. After you have spent 10 minutes on this, go back to your notes and see what you
didn't know. Add this information to your brainstorm. The next time you revise this topic do, for
example, three monopoly-based questions. Don't waste time actually writing them just jot down a
plan for them (don't forget the graphs), then go back to your notes once again and see what you forgot. You should
remember more than the first time. Not only will you be testing your monopoly knowledge and increasing it as
you go over the material for a second time, but you will be forcing yourself to plan, and almost best of all,
you will be forced to write three different plans which answer the
questions in a structured way, rather than writing your catch-all standard answer on monopoly. While
it is difficult to predict what is going to come up on a paper, it's a certainty that you won't see a
question inviting you to 'Write down everything you know about monopoly'. Your third revision of
monopoly might see you writing out those short answers in full, or doing a couple of essay plans.
The key to making your revision work is to organise your time. Make a revision plan. This plan
should divide the topics you need to revise into the total amount of time you have left before the exam.
Don't wait: do it today! There's always less time than you think. Don't leave out this important stage
in the revision process: you might be working away happily thinking you are accomplishing a great
deal, without a sense of how much you are effectively getting covered. Plan to cover each topic at

least three times, and include in your plan the method you are going to use to cover the material,
whether a brainstorm, getting a really full set of notes, doing two essay plans and two data-response
plans.
This method helps to calm exam fears. As you progress through your revision plan, you will have
positive proof your knowledge is improving as you revisit each topic. You will know your revision
is working. You will be in control of the process, and will be focusing on small, manageable tasks
rather than a gigantic formless mass of syllabus material. Almost everyone will be worried about
their upcoming exams, no matter what grade they will get. Just because you are worried does not
mean that you are not going to do well.
With a structured set of notes, a realistic revision plan and some good old-fashioned graft, you can do
well. Probably better than you think! I wish you all the very best of luck with your revision, and with
your exam.
ASSESSMENT OBJECTIVES (AOS)
These assessment objectives give candidates a clear indication of the type and level of skill required
for each section of the syllabus and in each type of assessment. You should use them as a guide to the
depth of understanding and the types of skills you need to develop for each idea and concept.
AO1: Demonstrate knowledge and understanding.
For example:
• Definitions in part (a) of essays
• Definitions in (a) parts (i) and (ii) of data responses
AO2: Demonstrate application and analysis of knowledge and understanding.
For example:
• Explaining appropriate diagrams in parts (b) and (c) of data responses.
• Developing explanations of theory in part (a) of essays.
AO3: Demonstrate synthesis and evaluation.
For example:
• Part (b) of essays.
• Part (d) of data responses.
AO4: Select, use and apply a variety of appropriate skills and techniques.
For example:
• Selecting the appropriate diagrams in parts (b) and (c) of data responses.
• Selection of mathematical techniques in HL paper 3.
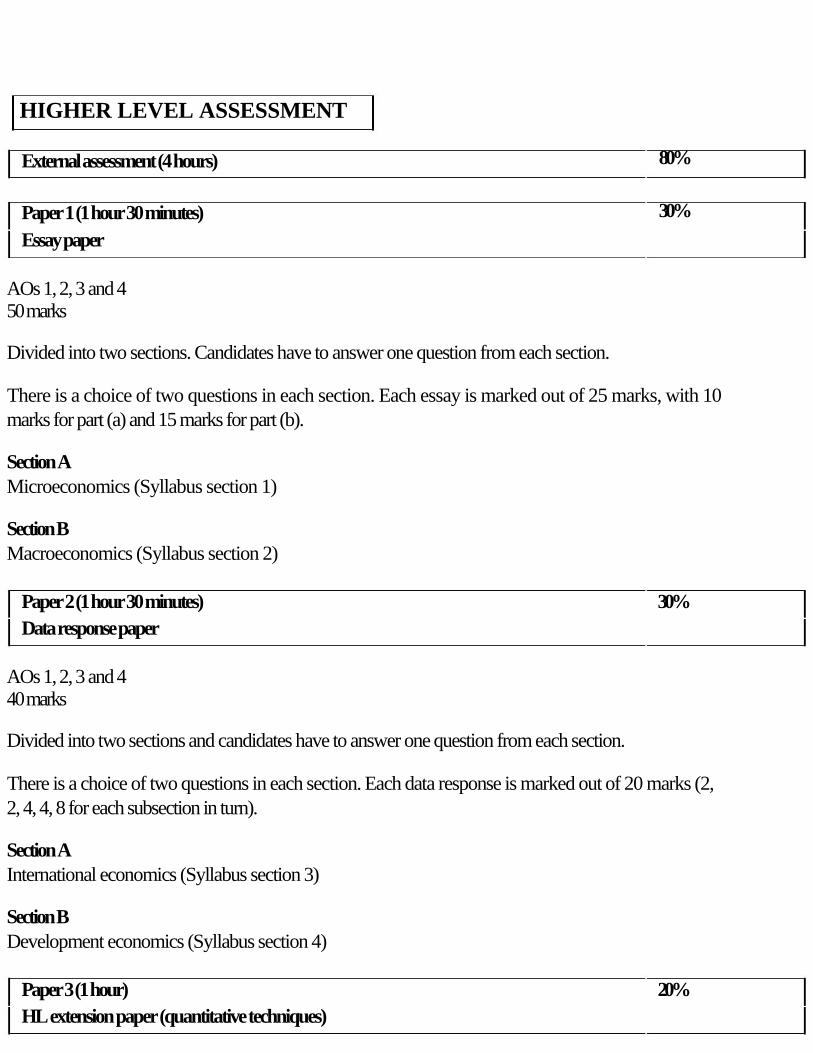
HIGHER LEVEL ASSESSMENT
External assessment (4 hours)
Paper 1 (1 hour 30 minutes)
Essay paper
AOs 1, 2, 3 and 4 50 marks
80%
30%
Divided into two sections. Candidates have to answer one question from each section.
There is a choice of two questions in each section. Each essay is marked out of 25 marks, with 10
marks for part (a) and 15 marks for part (b).
Section A
Microeconomics (Syllabus section 1)
Section B
Macroeconomics (Syllabus section 2)
Paper 2 (1 hour 30 minutes) 30%
Data response paper
AOs 1, 2, 3 and 4 40 marks
Divided into two sections and candidates have to answer one question from each section.
There is a choice of two questions in each section. Each data response is marked out of 20 marks (2,
2, 4, 4, 8 for each subsection in turn).
Section A
International economics (Syllabus section 3)
Section B
Development economics (Syllabus section 4)
Paper 3 (1 hour) 20%
HL extension paper (quantitative techniques)

AOs 1, 2 and 4 50 marks
Candidates answer two questions from a choice of three (25 marks per question).
This paper is based on all the HL extension material throughout all four sections of the syllabus, and
focuses on the mathematical elements of the course.
Internal assessment (4 hours) 20%
AOs 1, 2, 3 and 4 45 marks
A portfolio of three commentaries (20 teaching hours) internally assessed by teachers and
externally moderated by the IB at the end of the course.
Each commentary (max 750 words) is marked out of 14 with 3 marks, overall, for the rubric
requirements.
ESSAY TECHNIQUE
The problem with giving model answers for essays in this kind of revision guide is that one has to be
provided for each area of the syllabus, and space constraints prevent this here. If you are getting
together to revise with friends, you might want to compare essays you have done in the past, looking carefully at
where your teacher has indicated good and bad practice, and where marks have been indicated in the margin,
as well as comments for your future improvement. One surprisingly effective
thing to do is to mark each others' essays, using the readily available markschemes. This will give
you a real insight into what points actually constitute marks.
There is a danger of pre-learning answers to essays in one's revision, resulting in generalised,
unfocused and unstructured answers in an exam. The suggestions offered on the use of essay planning
in one's revision in the revision advice section above will help you to avoid this pitfall.
Examiners often comment on candidates who do not separate the two parts of essays. The
markscheme the examiner is working with instructs him or her to award marks specifically in each
part of the question. If your answer to a two-part question consists of one undifferentiated answer,
your examiner will struggle to apply the markscheme. It is also something which is calculated to annoy
your examiner! Another frequent cause of lost marks is to provide information in part (a) which
should really be in part (b). Careful planning (practised in your revision) will solve this problem
entirely.
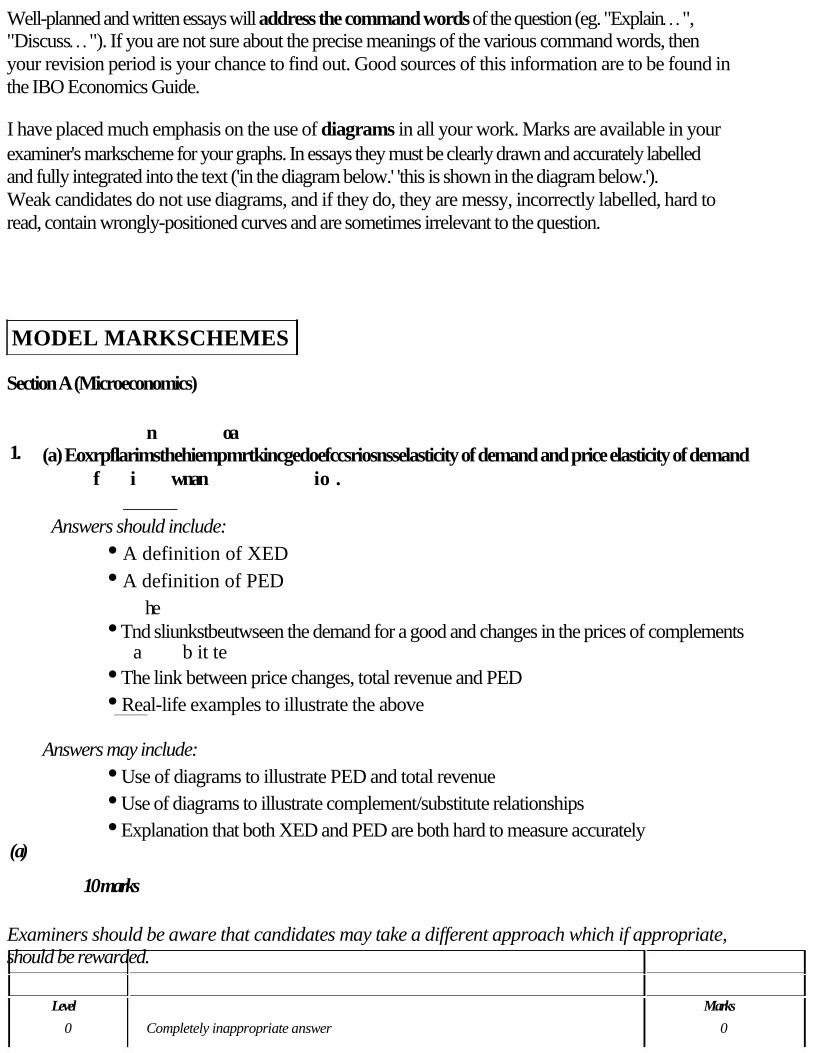
Well-planned and written essays will address the command words of the question (eg. "Explain",
"Discuss"). If you are not sure about the precise meanings of the various command words, then
your revision period is your chance to find out. Good sources of this information are to be found in
the IBO Economics Guide.
I have placed much emphasis on the use of diagrams in all your work. Marks are available in your
examiner's markscheme for your graphs. In essays they must be clearly drawn and accurately labelled
and fully integrated into the text ('in the diagram below.' 'this is shown in the diagram below.').
Weak candidates do not use diagrams, and if they do, they are messy, incorrectly labelled, hard to
read, contain wrongly-positioned curves and are sometimes irrelevant to the question.
MODEL MARKSCHEMES
Section A (Microeconomics)
n oa 1.
( a)
(a) Eoxrpflarimsthehiempmrtkincgedoefccsriosnsselasticity of demand and price elasticity of demand
f i wnan io .
Answers should include:
• A definition of XED
• A definition of PED
he
• Tnd sliunkstbeutwseen the demand for a good and changes in the prices of complements
a b it te
• The link between price changes, total revenue and PED
• Real-life examples to illustrate the above
Answers may include:
• Use of diagrams to illustrate PED and total revenue
• Use of diagrams to illustrate complement/substitute relationships
• Explanation that both XED and PED are both hard to measure accurately
10 marks
Examiners should be aware that candidates may take a different approach which if appropriate,
should be rewarded.
Level Marks
0 Completely inappropriate answer 0

Little understanding of the specific demands of the question
Very little recognition of relevant economic theory
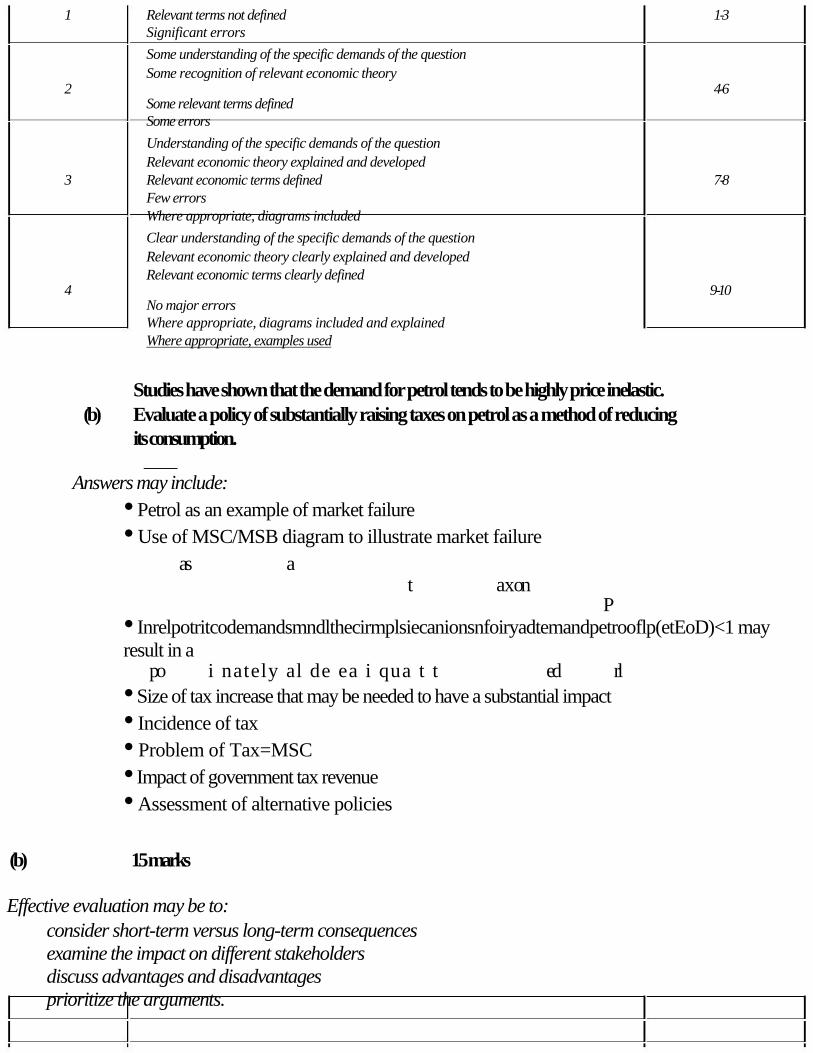
1 Relevant terms not defined 1 -3 Significant errors
Some understanding of the specific demands of the question
Some recognition of relevant economic theory 2 4 -6
Some relevant terms defined Some errors
Understanding of the specific demands of the question
Relevant economic theory explained and developed 3 Relevant economic terms defined 7 -8
Few errors Where appropriate, diagrams included
Clear understanding of the specific demands of the question
Relevant economic theory clearly explained and developed Relevant economic terms clearly defined
4 9 -1 0 No major errors Where appropriate, diagrams included and explained Where appropriate, examples used
Studies have shown that the demand for petrol tends to be highly price inelastic.
(b) Evaluate a policy of substantially raising taxes on petrol as a method of reducing
its consumption.
Answers may include:
• Petrol as an example of market failure
• Use of MSC/MSB diagram to illustrate market failure
as a t a x on
P
• Inrelpotritcodemandsmndlthecirmplsiecanionsnfoiryadtemandpetrooflp(etEoD)<1 may
result in a
po i nately al de ea i qua t t ed rl
• Size of tax increase that may be needed to have a substantial impact
• Incidence of tax
• Problem of Tax=MSC
• Impact of government tax revenue
• Assessment of alternative policies
(b) 15 marks
Effective evaluation may be to:
consider short-term versus long-term consequences
examine the impact on different stakeholders
discuss advantages and disadvantages
prioritize the arguments.
Examiners should be aware that candidates may take a different approach which if appropriate,
should be rewarded.
Level Marks
0 Completely inappropriate answer 0
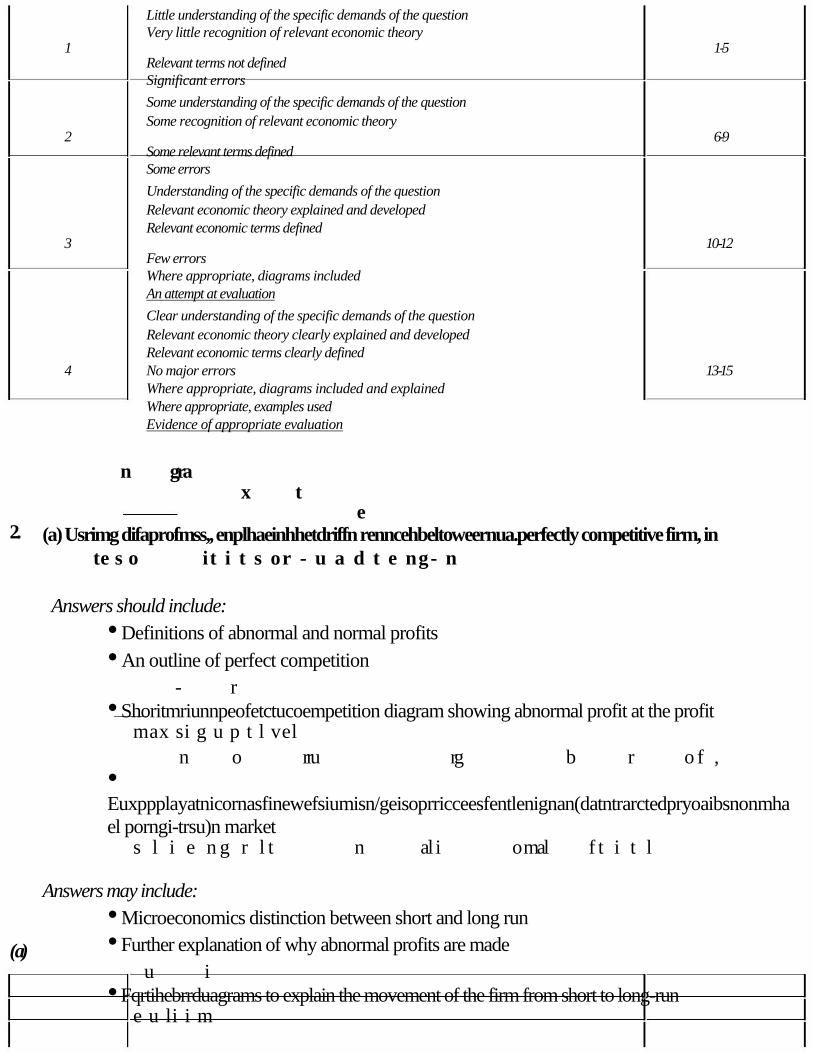
Little understanding of the specific demands of the question Very little recognition of relevant economic theory
1 1 -5 Relevant terms not defined Significant errors
Some understanding of the specific demands of the question
Some recognition of relevant economic theory 2 6 -9
Some relevant terms defined Some errors
Understanding of the specific demands of the question
Relevant economic theory explained and developed Relevant economic terms defined
3 1 0 -1 2 Few errors Where appropriate, diagrams included An attempt at evaluation
Clear understanding of the specific demands of the question
Relevant economic theory clearly explained and developed Relevant economic terms clearly defined
4 No major errors 1 3 -1 5 Where appropriate, diagrams included and explained Where appropriate, examples used Evidence of appropriate evaluation
n gra x t
e 2.
( a)
(a) Usrimg difaprofmss,, enplhaeinhhetdriffn renncehbeltoweernua.perfectly competitive firm, in
te s o it i t s or - u a d t e ng- n
Answers should include:
• Definitions of abnormal and normal profits
• An outline of perfect competition
- r
• Shoritmriunnpeofetctucoempetition diagram showing abnormal profit at the profit
max si g u p t l vel
n o rru rg b r o f ,
• Euxppplayatnicornasfinewefsiumisn/geisoprricceesfentlenignan(datntrarctedpryoaibsnonmha
el porngi-trsu)n market
s l i e n g r l t n al i o mal f t i t l
Answers may include:
• Microeconomics distinction between short and long run
• Further explanation of why abnormal profits are made
u i
• Fqrtihebrrduagrams to explain the movement of the firm from short to long-run
e u li i m
10 marks
Examiners should be aware that candidates may take a different approach which if appropriate,
should be rewarded.
Level Marks
0 Completely inappropriate answer 0
Little understanding of the specific demands of the question
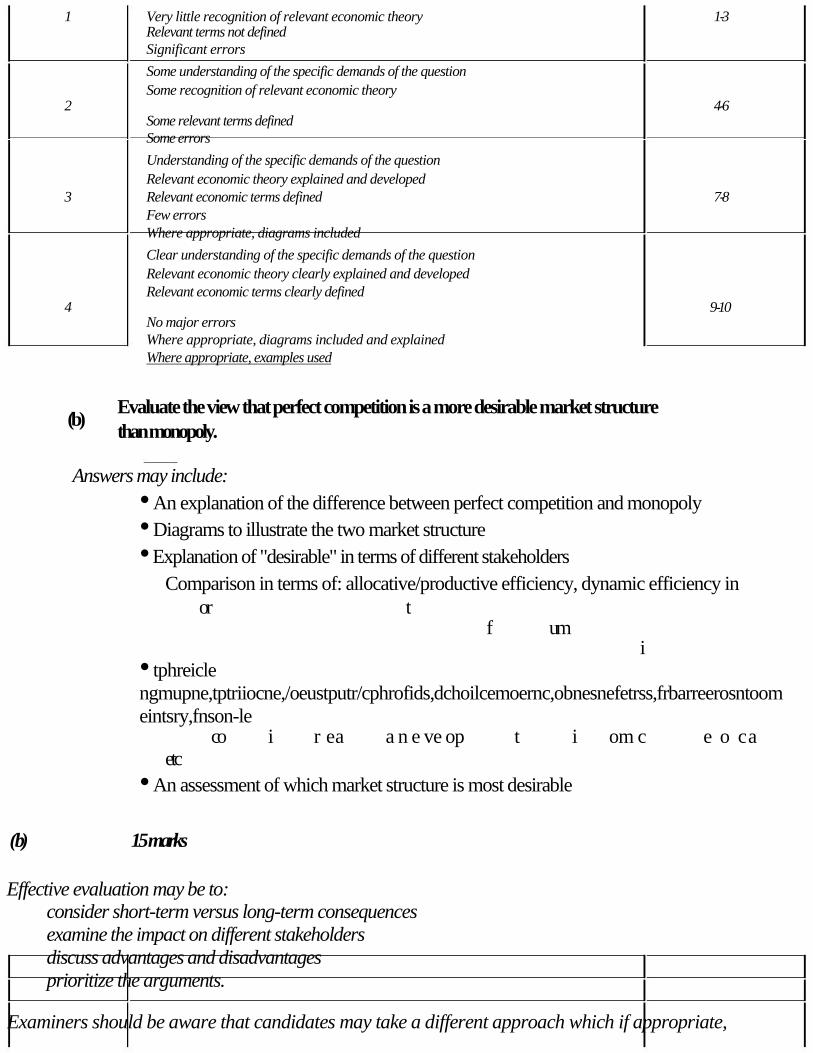
1 Very little recognition of relevant economic theory 1 -3 Relevant terms not defined Significant errors
Some understanding of the specific demands of the question
Some recognition of relevant economic theory 2 4 -6
Some relevant terms defined Some errors
Understanding of the specific demands of the question
Relevant economic theory explained and developed 3 Relevant economic terms defined 7 -8
Few errors Where appropriate, diagrams included
Clear understanding of the specific demands of the question
Relevant economic theory clearly explained and developed Relevant economic terms clearly defined
4 9 -1 0 No major errors Where appropriate, diagrams included and explained Where appropriate, examples used
(b)
Evaluate the view that perfect competition is a more desirable market structure
than monopoly.
Answers may include:
• An explanation of the difference between perfect competition and monopoly
• Diagrams to illustrate the two market structure
• Explanation of "desirable" in terms of different stakeholders
Comparison in terms of: allocative/productive efficiency, dynamic efficiency in
or t f um
i
• tphreicle
ngmupne,tptriiocne,/oeustputr/cphrofids,dchoilcemoernc,obnesnefetrss,frbarreerosntoom
eintsry,fnson-le
co i r ea a n e ve op t i om c e o ca
etc
• An assessment of which market structure is most desirable
( b) 15 marks
Effective evaluation may be to:
consider short-term versus long-term consequences
examine the impact on different stakeholders
discuss advantages and disadvantages
prioritize the arguments.
Examiners should be aware that candidates may take a different approach which if appropriate,
should be rewarded.
Level
0
1
Completely inappropriate answer
Little understanding of the specific demands of the question
Very little recognition of relevant economic theory
Marks
0
1 -5

Relevant terms not defined Significant errors
Some understanding of the specific demands of the question
Some recognition of relevant economic theory 2 6 -9
Some relevant terms defined Some errors
Understanding of the specific demands of the question
Relevant economic theory explained and developed Relevant economic terms defined
3 1 0 -1 2 Few errors Where appropriate, diagrams included An attempt at evaluation
Clear understanding of the specific demands of the question
Relevant economic theory clearly explained and developed Relevant economic terms clearly defined
4 No major errors 1 3 -1 5 Where appropriate, diagrams included and explained Where appropriate, examples used Evidence of appropriate evaluation
Section B (Macroeconomics)
1.
(a)
(a) Explain why a country may wish to reduce its inflation rate.
Answers should include:
• An explanation of the rate of inflation
• An explanation of the causes of inflation
An explanation of the reason to reduce inflation in terms of the various costs of
• inflation. This may include the impact of competitiveness, the price mechanism,
redistribution of incomes, devaluing incomes, confidence etc
10 marks
Examiners should be aware that candidates may take a different approach which if appropriate,
should be rewarded.
Level
0
1
2
3
Comple
tely i
nap
propri
ate an
swer
Little
understandin
g of the
specific
demands of
the question
Ver
y
littl
e
reco
gnit
ion
of
rele
vant
eco
nom
ic
theo
ry R
e
l
e
v
a
n
t
t
e
r
m
s
n
ot defined Significant errors
Some understanding of the specific demands of the question
Some recognition of relevant economic theory Some relevant terms defined Some errors
Understanding of the specific demands of the question
Relevant economic theory explained and developed Relevant economic terms defined
Marks
0
1 -3
4 -6
7 -8
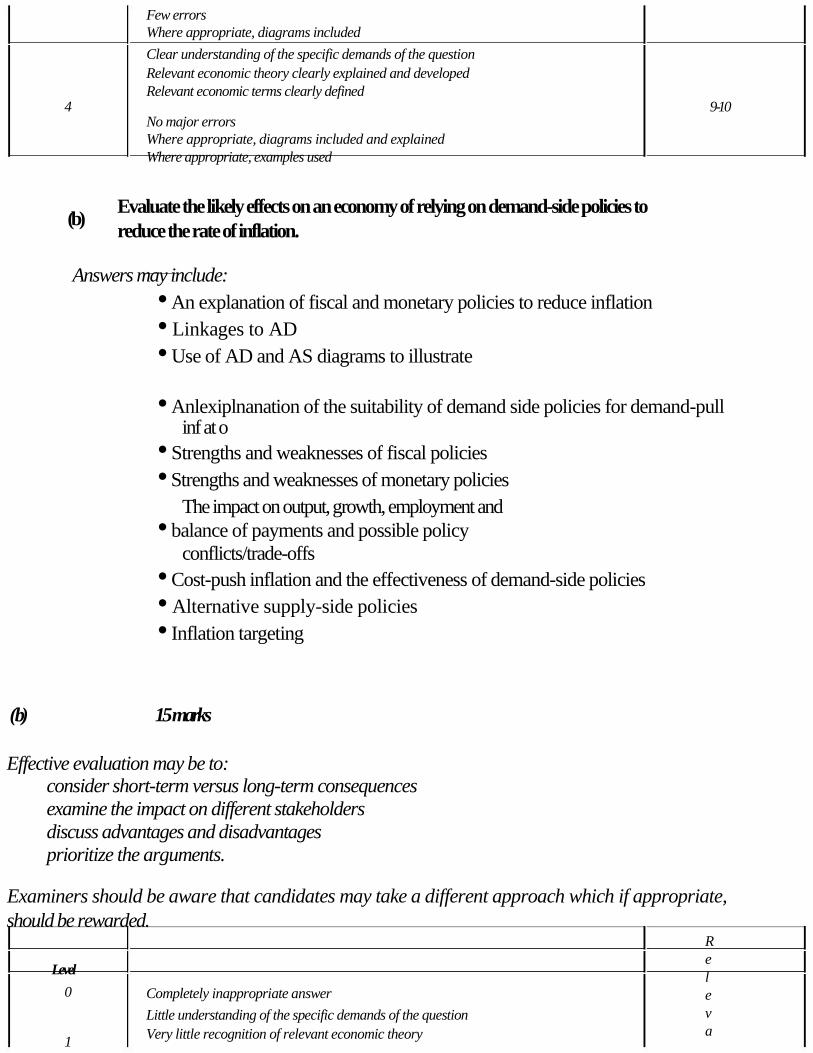
Few errors Where appropriate, diagrams included
Clear understanding of the specific demands of the question
Relevant economic theory clearly explained and developed Relevant economic terms clearly defined
4 9 -1 0 No major errors Where appropriate, diagrams included and explained Where appropriate, examples used
(b)
Evaluate the likely effects on an economy of relying on demand-side policies to
reduce the rate of inflation.
Answers may include:
• An explanation of fiscal and monetary policies to reduce inflation
• Linkages to AD
• Use of AD and AS diagrams to illustrate
• Anlexiplnanation of the suitability of demand side policies for demand-pull
inf at o
• Strengths and weaknesses of fiscal policies
• Strengths and weaknesses of monetary policies
The impact on output, growth, employment and
• balance of payments and possible policy
conflicts/trade-offs
• Cost-push inflation and the effectiveness of demand-side policies
• Alternative supply-side policies
• Inflation targeting
( b) 15 marks
Effective evaluation may be to:
consider short-term versus long-term consequences
examine the impact on different stakeholders
discuss advantages and disadvantages
prioritize the arguments.
Examiners should be aware that candidates may take a different approach which if appropriate,
should be rewarded.
Level
0
1
Completely inappropriate answer
Little understanding of the specific demands of the question
Very little recognition of relevant economic theory
R
e
l
e
v
a
n
t
t
e
r
m
s
n
o
t
d
e
f
i
n
e
d
S
i
g
n
i
f
i
c
a
n
t
e
r
r
o
r
s
Marks
0
1 -5
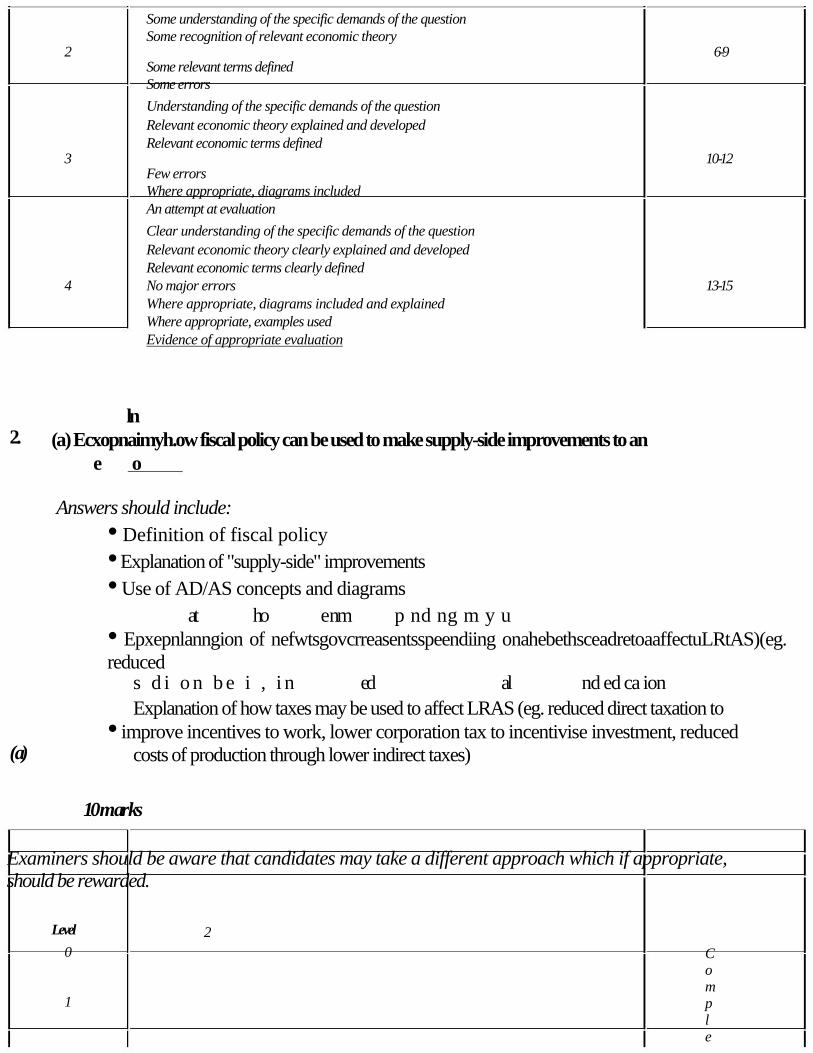
Some understanding of the specific demands of the question Some recognition of relevant economic theory
2 6 -9 Some relevant terms defined Some errors
Understanding of the specific demands of the question
Relevant economic theory explained and developed Relevant economic terms defined
3 1 0 -1 2 Few errors Where appropriate, diagrams included An attempt at evaluation
Clear understanding of the specific demands of the question
Relevant economic theory clearly explained and developed Relevant economic terms clearly defined
4 No major errors 1 3 -1 5 Where appropriate, diagrams included and explained Where appropriate, examples used Evidence of appropriate evaluation
ln 2.
( a)
(a) Ecxopnaimyh.ow fiscal policy can be used to make supply-side improvements to an
e o
Answers should include:
• Definition of fiscal policy
• Explanation of "supply-side" improvements
• Use of AD/AS concepts and diagrams
at ho e nm p nd ng m y u
• Epxepnlanngion of nefwtsgovcrreasentsspeendiing onahebethsceadretoaaffectuLRtAS)(eg.
reduced
s d i o n b e i , i n ed al nd ed ca ion
Explanation of how taxes may be used to affect LRAS (eg. reduced direct taxation to
• improve incentives to work, lower corporation tax to incentivise investment, reduced
costs of production through lower indirect taxes)
10 m ar ks
Examiners should be aware that candidates may take a different approach which if appropriate,
should be rewarded.
Level
0
1
2
Compl
e
tel
y inap
propri
ate an
swer
Little
understandin
g of the
specific
demands of
the question
Ver
y
littl
e
reco
gnit
ion
of
rele
vant
eco
nom
ic
theo
ry R
e
l
e
v
a
n
t
t
erms not defined Significant errors
Some understanding of the specific demands of the question
Some recognition of relevant economic theory Some relevant terms defined Some errors
Marks
0
1 -3
4 -6
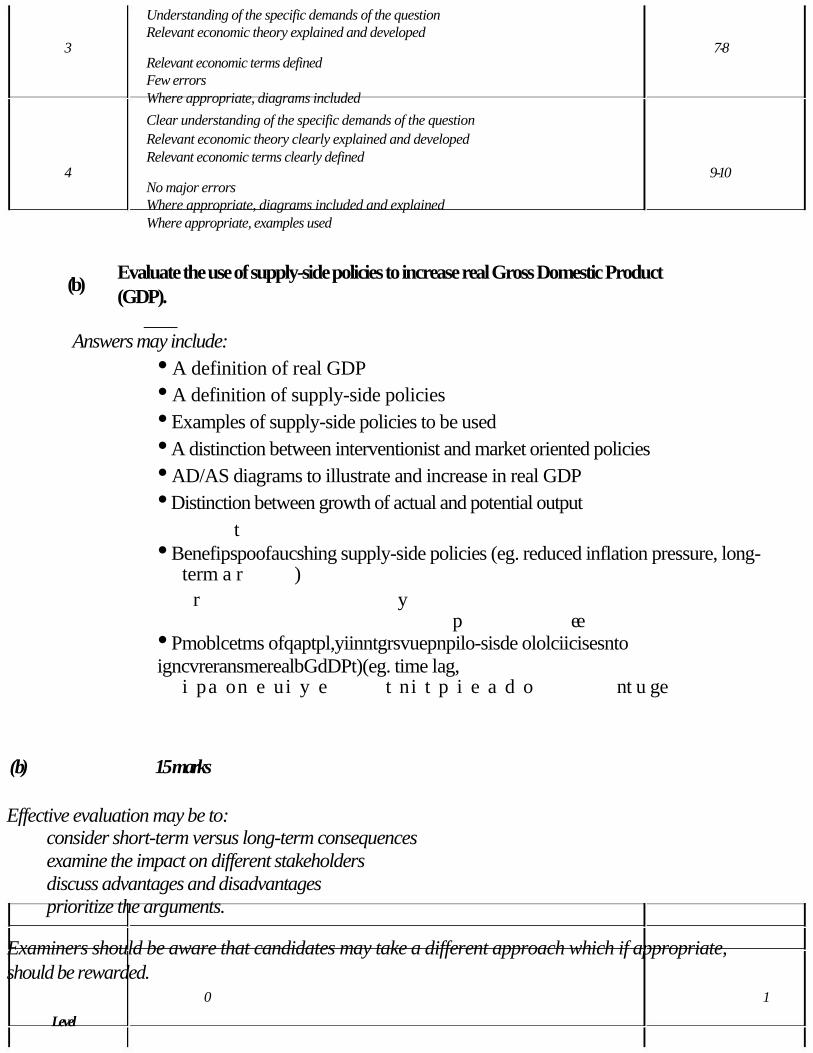
Understanding of the specific demands of the question Relevant economic theory explained and developed
3 7 -8 Relevant economic terms defined Few errors Where appropriate, diagrams included
Clear understanding of the specific demands of the question
Relevant economic theory clearly explained and developed Relevant economic terms clearly defined
4 9 -1 0 No major errors Where appropriate, diagrams included and explained Where appropriate, examples used
(b)
Evaluate the use of supply-side policies to increase real Gross Domestic Product
(GDP).
Answers may include:
• A definition of real GDP
• A definition of supply-side policies
• Examples of supply-side policies to be used
• A distinction between interventionist and market oriented policies
• AD/AS diagrams to illustrate and increase in real GDP
• Distinction between growth of actual and potential output
t
• Benefipspoofaucshing supply-side policies (eg. reduced inflation pressure, long-
term a r )
r y p ee
• Pmoblcetms ofqaptpl,yiinntgrsvuepnpilo-sisde ololciicisesnto
igncvreransmerealbGdDPt)(eg. time lag,
i pa on e ui y e t ni t p i e a d o nt u ge
( b) 15 marks
Effective evaluation may be to:
consider short-term versus long-term consequences
examine the impact on different stakeholders
discuss advantages and disadvantages
prioritize the arguments.
Examiners should be aware that candidates may take a different approach which if appropriate,
should be rewarded.
Level
0
1
C
omplet
ely in
approp
riate
answer
Little
understandin
g of the
specific
demands of
the question
Ver
y
littl
e
reco
gnit
ion
of
rele
vant
eco
nom
ic
theo
ry R
e
levant terms not defined Significant errors
Some understanding of the specific demands of the question
Marks
0
1 -5

Some recognition of relevant economic theory 2 6 -9
Some relevant terms defined Some errors
Understanding of the specific demands of the question
Relevant economic theory explained and developed Relevant economic terms defined
3 1 0 -1 2 Few errors Where appropriate, diagrams included An attempt at evaluation
Clear understanding of the specific demands of the question
Relevant economic theory clearly explained and developed Relevant economic terms clearly defined
4 No major errors 1 3 -1 5 Where appropriate, diagrams included and explained Where appropriate, examples used Evidence of appropriate evaluation
DATA RESPONSE TECHNIQUE
Choose the question by reading all of the individual question parts, especially those with the most
marks. Allocate the time you spend on the different parts of the question according to the
distribution of the marks. You should spend double the amount of time on an 8-mark question than
you spend on a 4-mark question. This sounds obvious, but a number of students will misallocate their
resources each year with catastrophic results. Make sure that you are not one of them!
Data response answers must be planned like any good essay. Use both the text and the data available
to you to illustrate your answers.
The opening questions will require you to be able to provide definitions of key terms in the text. The
next questions will often ask you to use a diagram to explain either an event described in the text or to
explain a specific piece of theory that is applicable to the text. The final question will require you to
analyse and evaluate an issue based upon the text, and as these are most difficult skills needed in the
exam this question is awarded 8/20 marks. If you are to perform well in this paper, then you must
seek to maximise your marks on this question. If you can maximise the number of marks you gain from
the define/describe/explain questions (questions (a), (b) and (c) give you potentially 12/20 marks)
then 4/8 in part (d) will give you 16/20 marks (80%).
Part (a)
2-4 lines will be sufficient to gain full marks on this question. You will need to make at least two
points to gain full marks.
Parts (b) and (c)
There are 2 marks for the diagram, and 2 marks for your writing about the diagram. Diagrams must be

fully labelled. Watch out for details that matter (eg. an ad valorem tax should be illustrated by a
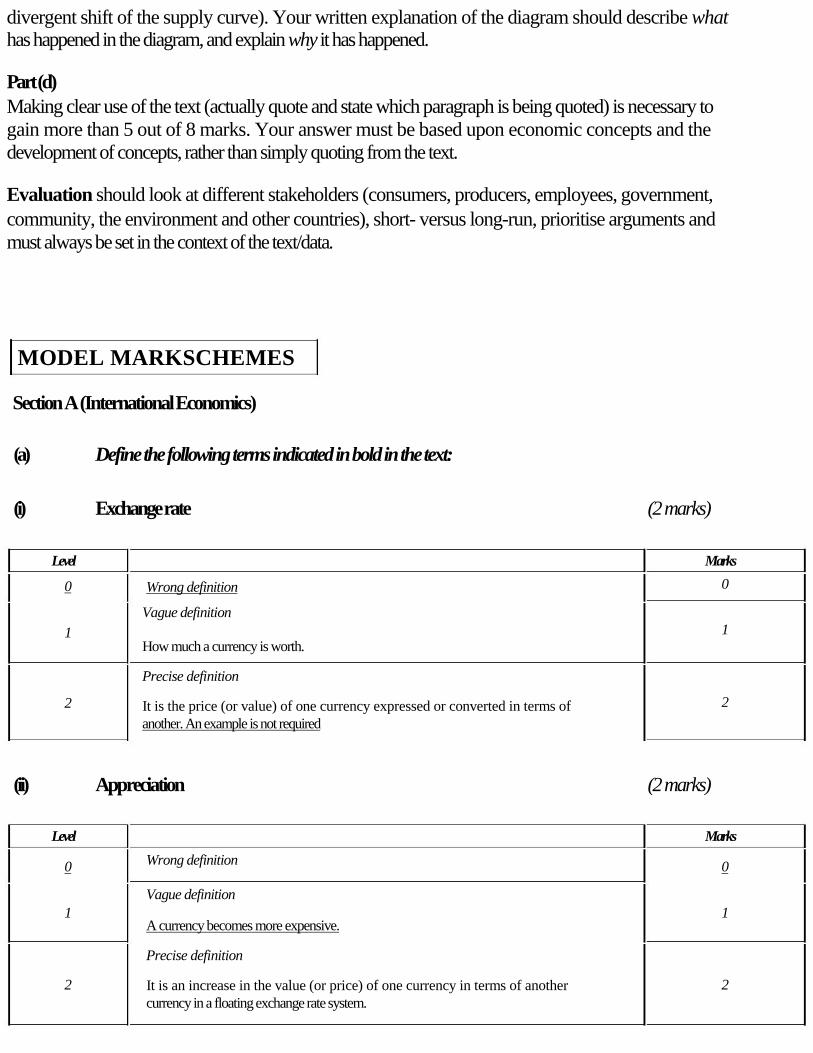
divergent shift of the supply curve). Your written explanation of the diagram should describe what
has happened in the diagram, and explain why it has happened.
Part (d)
Making clear use of the text (actually quote and state which paragraph is being quoted) is necessary to
gain more than 5 out of 8 marks. Your answer must be based upon economic concepts and the
development of concepts, rather than simply quoting from the text.
Evaluation should look at different stakeholders (consumers, producers, employees, government,
community, the environment and other countries), short- versus long-run, prioritise arguments and
must always be set in the context of the text/data.
MODEL MARKSCHEMES
Section A (International Economics)
(a) Define the following terms indicated in bold in the text:
(i) Exchange rate (2 marks)
Level
0
1
2
Wrong definition
Vague definition
How much a currency is worth.
Precise definition
It is the price (or value) of one currency expressed or converted in terms of another. An example is not required
Marks
0
1
2
(ii) Appreciation (2 marks)
Level
0
1
2
Wrong definition
Vague definition
A currency becomes more expensive.
Precise definition
It is an increase in the value (or price) of one currency in terms of another currency in a floating exchange rate system.
Marks
0
1
2
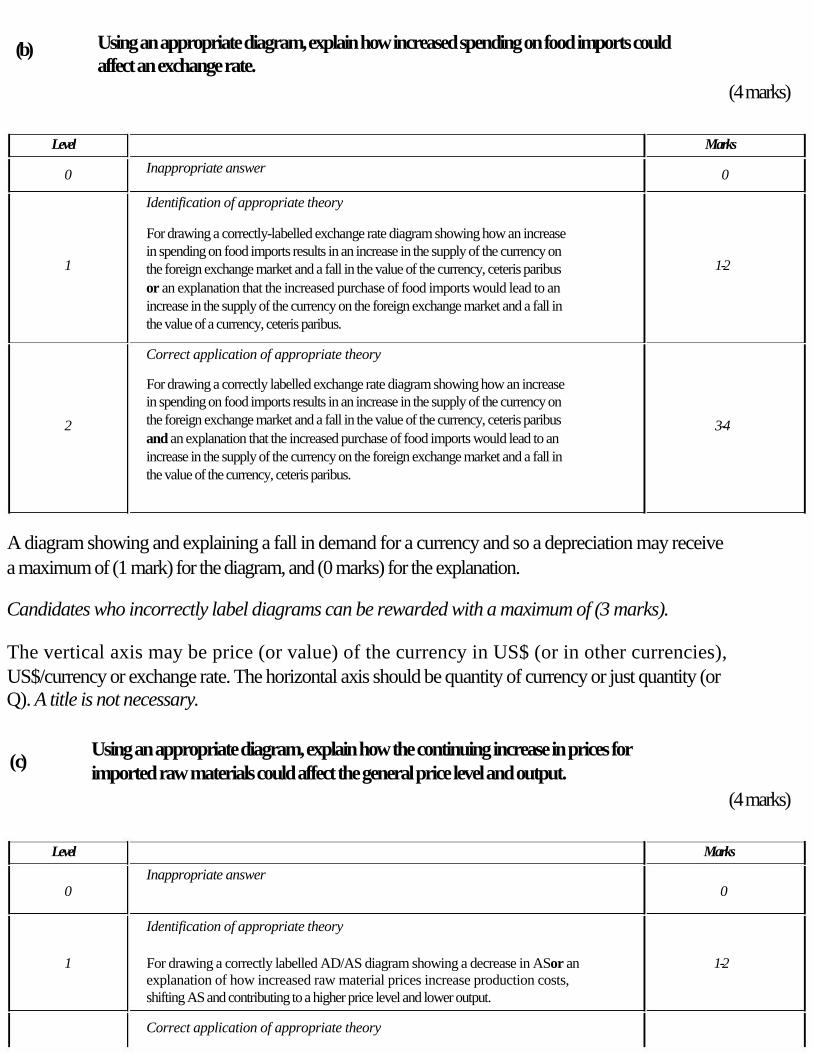
(b) Using an appropriate diagram, explain how increased spending on food imports could
affect an exchange rate.
(4 marks)
Level
0
1
2
Inappropriate answer
Identification of appropriate theory
For drawing a correctly-labelled exchange rate diagram showing how an increase in spending on food imports results in an increase in the supply of the currency on the foreign exchange market and a fall in the value of the currency, ceteris paribus
or an explanation that the increased purchase of food imports would lead to an increase in the supply of the currency on the foreign exchange market and a fall in the value of a currency, ceteris paribus.
Correct application of appropriate theory
For drawing a correctly labelled exchange rate diagram showing how an increase in spending on food imports results in an increase in the supply of the currency on the foreign exchange market and a fall in the value of the currency, ceteris paribus
and an explanation that the increased purchase of food imports would lead to an
increase in the supply of the currency on the foreign exchange market and a fall in the value of the currency, ceteris paribus.
Marks
0
1 -2
3 -4
A diagram showing and explaining a fall in demand for a currency and so a depreciation may receive
a maximum of (1 mark) for the diagram, and (0 marks) for the explanation.
Candidates who incorrectly label diagrams can be rewarded with a maximum of (3 marks).
The vertical axis may be price (or value) of the currency in US$ (or in other currencies),
US$/currency or exchange rate. The horizontal axis should be quantity of currency or just quantity (or
Q). A title is not necessary.
( c)
Using an appropriate diagram, explain how the continuing increase in prices for
imported raw materials could affect the general price level and output.
(4 marks)
Level Marks
Inappropriate answer 0 0
Identification of appropriate theory
1 For drawing a correctly labelled AD/AS diagram showing a decrease in ASor an 1 -2 explanation of how increased raw material prices increase production costs, shifting AS and contributing to a higher price level and lower output.
Correct application of appropriate theory
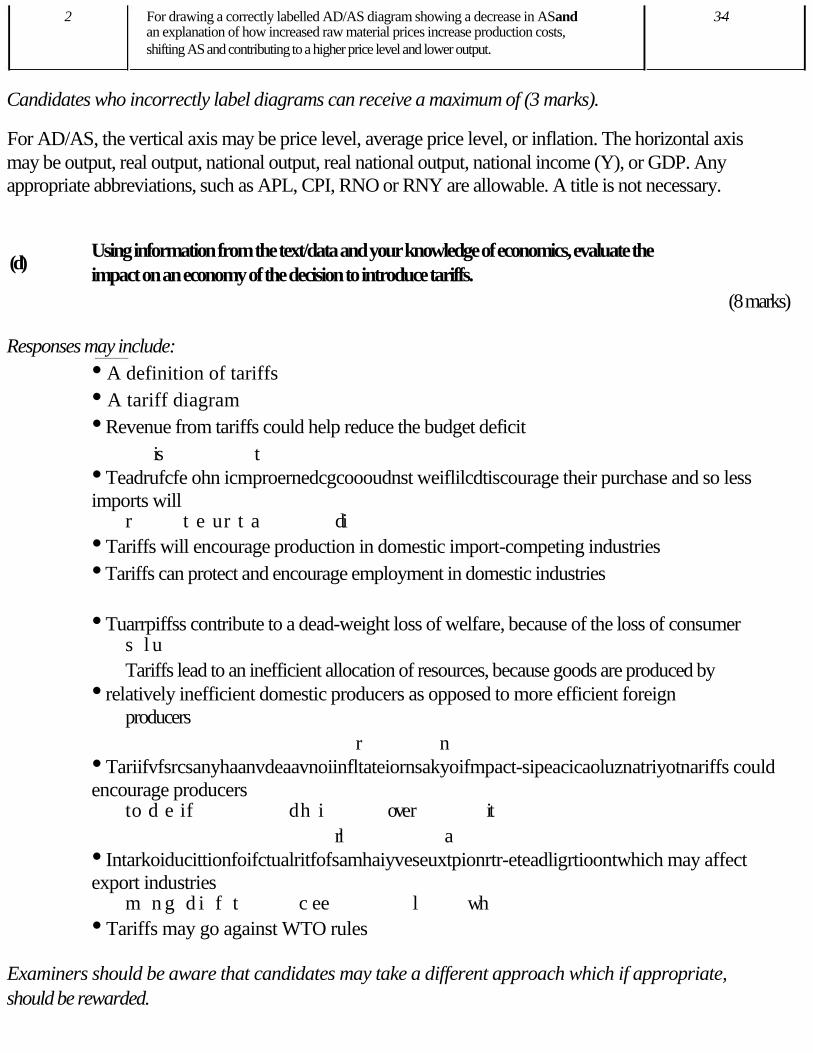
2 For drawing a correctly labelled AD/AS diagram showing a decrease in ASand 3 -4 an explanation of how increased raw material prices increase production costs, shifting AS and contributing to a higher price level and lower output.
Candidates who incorrectly label diagrams can receive a maximum of (3 marks).
For AD/AS, the vertical axis may be price level, average price level, or inflation. The horizontal axis
may be output, real output, national output, real national output, national income (Y), or GDP. Any
appropriate abbreviations, such as APL, CPI, RNO or RNY are allowable. A title is not necessary.
(d)
Using information from the text/data and your knowledge of economics, evaluate the
impact on an economy of the decision to introduce tariffs.
(8 marks)
Responses may include:
• A definition of tariffs
• A tariff diagram
• Revenue from tariffs could help reduce the budget deficit
is t
• Teadrufcfe ohn icmproernedcgcoooudnst weiflilcdtiscourage their purchase and so less
imports will
r t e ur t a di
• Tariffs will encourage production in domestic import-competing industries
• Tariffs can protect and encourage employment in domestic industries
• Tuarrpiffss contribute to a dead-weight loss of welfare, because of the loss of consumer
s l u
Tariffs lead to an inefficient allocation of resources, because goods are produced by
• relatively inefficient domestic producers as opposed to more efficient foreign
producers
r n
• Tariifvfsrcsanyhaanvdeaavnoiinfltateiornsakyoifmpact-sipeacicaoluznatriyotnariffs could
encourage producers
to d e if dh i ove r it
rl a
• Intarkoiducittionfoifctualritfofsamhaiyveseuxtpionrtr-eteadligrtioontwhich may affect
export industries
m n g d i f t c ee l wh
• Tariffs may go against WTO rules
Examiners should be aware that candidates may take a different approach which if appropriate,
should be rewarded.

If there is no direct reference to the text/data, then candidates may not be rewarded beyond level
2.
Effective evaluation may be to:
• consider short-term versus long-term consequences
• examine the impact on different stakeholders
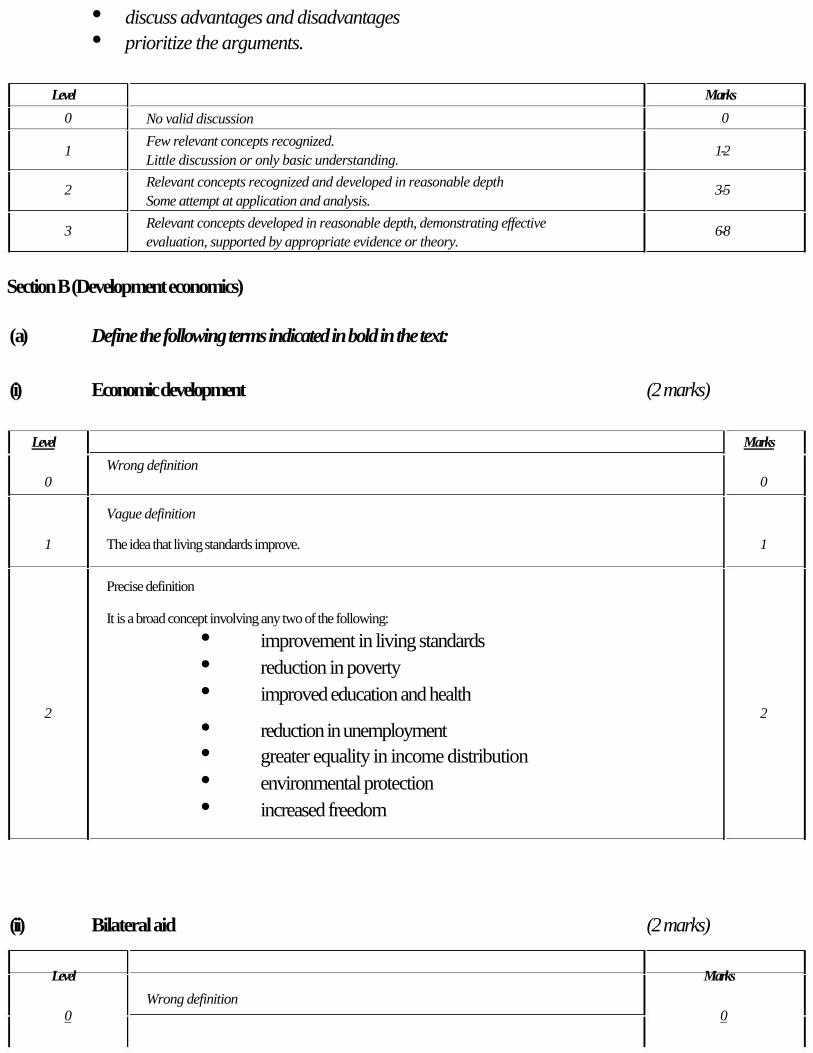
• discuss advantages and disadvantages
• prioritize the arguments.
Level
0
1
2
3
No valid discussion
Few relevant concepts recognized.
Little discussion or only basic understanding.
Relevant concepts recognized and developed in reasonable depth
Some attempt at application and analysis.
Relevant concepts developed in reasonable depth, demonstrating effective
evaluation, supported by appropriate evidence or theory.
Marks
0
1 -2
3 -5
6 -8
Section B (Development economics)
( a) Define the following terms indicated in bold in the text:
(i) Economic development (2 marks)
Level Marks
Wrong definition 0 0
Vague definition
1 The idea that living standards improve. 1
Precise definition
It is a broad concept involving any two of the following:
• improvement in living standards
• reduction in poverty
• improved education and health 2 2
• reduction in unemployment
• greater equality in income distribution
• environmental protection
• increased freedom
(ii) Bilateral aid (2 marks)
Level Marks
Wrong definition 0 0

Vague definition
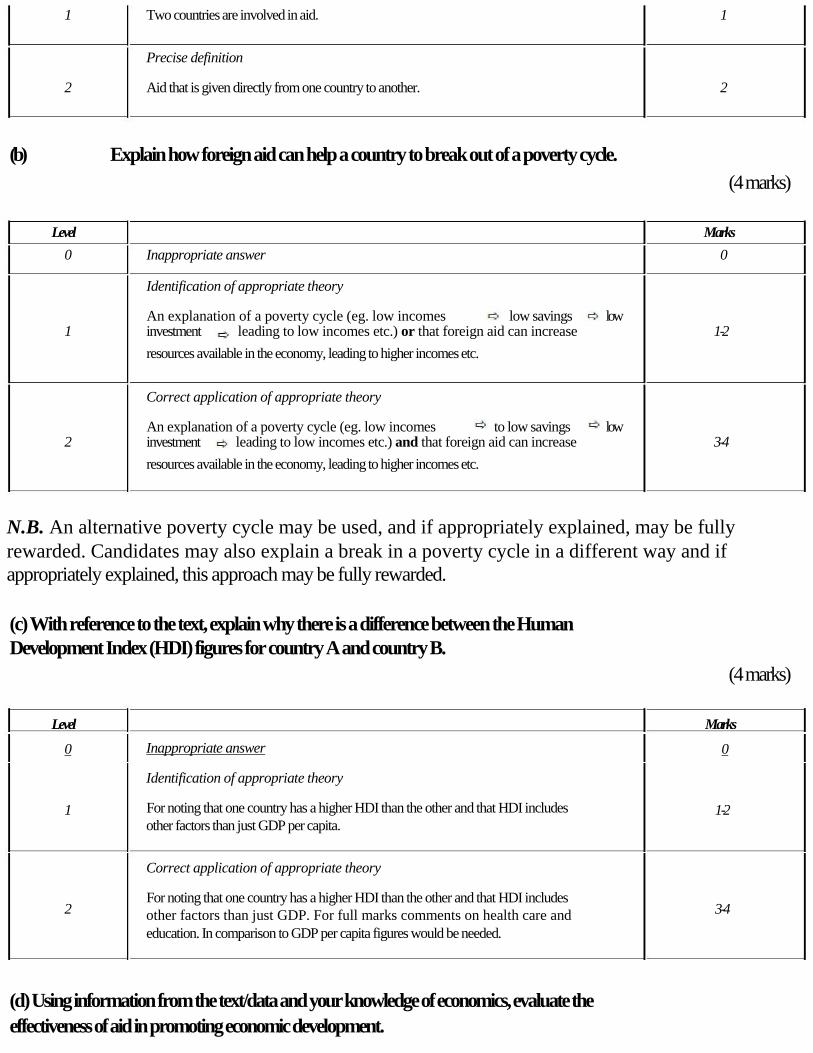
1 Two countries are involved in aid. 1
Precise definition
2 Aid that is given directly from one country to another. 2
(b) Explain how foreign aid can help a country to break out of a poverty cycle.
(4 marks)
Level Marks
0 Inappropriate answer 0
Identification of appropriate theory
An explanation of a poverty cycle (eg. low incomes low savings low 1 investment leading to low incomes etc.) or that foreign aid can increase 1 -2
resources available in the economy, leading to higher incomes etc.
Correct application of appropriate theory
An explanation of a poverty cycle (eg. low incomes to low savings low 2 investment leading to low incomes etc.) and that foreign aid can increase 3 -4
resources available in the economy, leading to higher incomes etc.
N.B. An alternative poverty cycle may be used, and if appropriately explained, may be fully
rewarded. Candidates may also explain a break in a poverty cycle in a different way and if
appropriately explained, this approach may be fully rewarded.
(c) With reference to the text, explain why there is a difference between the Human
Development Index (HDI) figures for country A and country B.
(4 marks)
Level
0
1
2
Inappropriate answer
Identification of appropriate theory
For noting that one country has a higher HDI than the other and that HDI includes other factors than just GDP per capita. Correct application of appropriate theory
For noting that one country has a higher HDI than the other and that HDI includes other factors than just GDP. For full marks comments on health care and education. In comparison to GDP per capita figures would be needed.
Marks
0
1 -2
3 -4
(d) Using information from the text/data and your knowledge of economics, evaluate the
effectiveness of aid in promoting economic development.
(8 marks)
Responses may include:
• Discussion of types of aid, eg. multi-lateral/bilateral, tied etc.
• A comparison of official aid and unofficial aid.
• Benefits of aid which is targeted to meeting development objective
c
• Aeideclanmonttriobuteecttoveconomic growth which might then be used to achieve
d v op e n bj i e s
ne s of at
• Boeverfintmentcoaopelrociaolncbetweentiaeisd) agencies and other agencies and groups
(eg.
g s nd ommuni
• Benefits of aid driven by the needs of the people
• Benefits of aid linked to appropriate domestic policies and good governance
• Problems associated with aid (eg. corruption and dependency)
N.B. To reach level 3, candidates must direct their responses to the issue of promoting economic
development, rather than write in general terms about aid.
Examiners should be aware that candidates may take a different approach which if appropriate,
should be rewarded.
If there is no direct reference to the text/data, then candidates may not be rewarded beyond level 2.
Effective evaluation may be to:
• consider short-term versus long-term consequences
• examine the impact on different stakeholders
• discuss advantages and disadvantages
• prioritize the arguments.
Level
0
1
2
3
No valid discussion
Few relevant concepts recognized. Little discussion or only basic understanding.
Relevant concepts recognized and developed in reasonable depth Some attempt at application and analysis.
Relevant concepts developed in reasonable depth, demonstrating effective evaluation, supported by appropriate evidence or theory.
Marks
0
1 -2
3 -5
6 -8
These 'outline' answers are structured in exactly the same format as the markschemes used by

the IB. The 'generic' markschemes (showing the levels and marks initalics are taken from past
paper markschemes and the Economics Guide).