Embed Size (px)
Citation preview

Prepared forCity of Royal OakJune 2016
SECONDARY RETAIL TRADE AREAPSYCHOGRAPHIC PROFILERoyal Oak, Michigan

2
Copyright © and (P) 1988–2012 Microsoft Corporation and/or its suppliers. All rights reserved. http://www.microsoft.com/mappoint/Certain mapping and direction data © 2012 NAVTEQ. All rights reserved. The Data for areas of Canada includes information taken with permission from Canadian authorities, including: © Her Majesty the Queen in Right of Canada, © Queen's Printer for Ontario. NAVTEQ and NAVTEQ ON BOARD are trademarks of NAVTEQ. © 2012 Tele Atlas North America, Inc. All rights reserved. Tele Atlas and Tele Atlas North America are trademarks of Tele Atlas, Inc. © 2012 by Applied Geographic Solutions. All rights reserved. Portions © Copyright 2012 by Woodall Publications Corp. All rights reserved.
RoyalOakMI_SecRTA_Map_2015
0 mi 2 4 6 8 10
SECONDARY RETAIL TRADE AREARoyal Oak, Michigan
City of Royal Oak | 211 South Williams Street | Royal Oak, Michigan 48067 | 248.246.3208 | [email protected] | www.romi.gov
TODD E. FENTON, ECONOMIC DEVELOPMENT MANAGERCONTACT
ROYAL OAK

3
Tapestry Segmentation classifies US neighborhoods into 67 distinct market segments. Neighborhoods with the most similar characteristics are grouped together, while neighborhoods with divergent characteristics are separated. Tapestry Segmentation combines the “who” of lifestyle demography with the “where” of local neighborhood geography to create a model of various lifestyle classifications, or segments, of actual neighborhoods with addresses—distinct behavioral market segments.
+ WHO SHOULD USE TAPESTRY SEGMENTATION?All companies, agencies, and organizations need to understand consumers/constituents in order to supply them with the right products and services and to reach them via their preferred media. These applications require a robust segmentation system that can accurately profile these diverse markets. The versatility and predictive power of Tapestry Segmentation allow users to integrate their own data or national consumer surveys into Tapestry Segmentation to identify their best market segments and reach them through the most effective channels.
+ TAPESTRY SEGMENTATION SUMMARY GROUPSEsri’s Tapestry Segmentation provides a robust, powerful portrait of the 67 US consumer markets. To provide a broader view of these 67 segments, Esri combined them into 14 LifeMode Summary Groups based on lifestyle and lifestage composition.
L1 Affluent EstatesL2 Upscale AvenuesL3 Uptown IndividualsL4 Family LandscapesL5 GenXurbanL6 Cozy Country LivingL7 Ethnic EnclavesL8 Middle GroundL9 Senior StylesL10 Rustic OutpostsL11 Midtown SinglesL12 HometownL13 New WaveL14 Scholars and Patriots
+ WHAT IS TAPESTRY SEGMENTATION?Tapestry Segmentation is a market segmentation system that classifies US neighborhoods based on their socioeconomic and demographic compositions. Tapestry is a system for classifying consumers and constituents using all the variables that can distinguish consumer behavior, from household characteristics such as income and family type to personal traits like age, education,or employment and even housing choices.
TAPESTRY SEGMENTATION PROFILE

4
+ Affluent Estates
+ Upscale Avenues
+ Uptown Individuals
+ Family Landscapes
+ GenXurban
+ Cozy Country Living
+ Ethnic Enclaves
+ Middle Ground
+ Senior Styles
+ Rustic Outposts
+ Midtown Singles
+ Hometown
+ New Wave
+ Scholars and Patriots
- - - US Median Income $51,000
0 $20k $40k $60k $80k $100k $120k $140k $160k
INCOME RANGE OF LIFEMODE SUMMARY GROUPS

5
+ L1 AFFLUENT ESTATESEstablished wealth — educated, well-traveled married couples
+ L2 UPSCALE AVENUESProsperous, married couplesin higher density neighborhoods
+ L3 UPTOWN INDIVIDUALSYounger, urban singles on the move
+ L4 FAMILY LANDSCAPESSuccessful younger families in newer housing
+ L5 GENXURBANGen X in middle age; families with fewer kids and a mortgage
+ L6 COZY COUNTRYEmpty nesters in bucolic settings
+ L7 ETHNIC ENCLAVESEstablished diversity — young, Hispanic homeowners with families
+ L8 MIDDLE GROUNDLifestyles of thirtysomethings
+ L9 SENIOR STYLESSenior lifestyles reveal the effects of saving for retirement
+ L10 RUSTIC OUTPOSTSCountry life with older families, older homes
+ L11 MIDTOWN SINGLESMillennials on the move; single, diverse, and urban
+ L12 HOMETOWNGrowing up and staying close to home; single householders
+ L13 NEXT WAVEUrban denizens; young, diverse,hardworking families
+ L14 SCHOLARS AND PATRIOTSCollege campuses and military neighborhoods
SECONDARY RETAIL TRADE AREA • LIFEMODE SUMMARY GROUPS MAPRoyal Oak, Michigan
Dominant Tapestry MapRoyalOakMI_SecRTA_Map_2016 Prepared by EsriArea: 133.8 square miles
Source: Esri
June 21, 2016
©2016 Esri Page 1 of 2

6
TAPESTRY SEGMENTATION HOUSEHOLDS PERCENT CUMULATIVE PERCENT US HOUSEHOLDS PERCENT CUMULATIVE PERCENT INDEX
1 Rustbelt Traditions (5D) 13.4% 13.4% 2.2% 2.2% 602
2 Emerald City (8B) 9.9% 23.3% 1.4% 3.6% 701
3 Family Foundations (12A) 7.4% 30.7% 1.1% 4.7% 696
4 Traditional Living (12B) 6.7% 37.4% 2.0% 6.7% 344
5 Comfortable Empty Nesters (5A) 6.7% 44.1% 2.5% 9.2% 271
Subtotal 44.1% 9.2%
6 In Style (5B) 6.5% 50.6% 2.3% 11.5% 289
7 Top Tier (1A) 6.1% 56.7% 1.7% 13.2% 356
8 Savvy Suburbanites (1D) 5.3% 62.0% 3.0% 16.2% 177
9 Modest Income Homes (12D) 4.4% 66.4% 1.3% 17.5% 330
10 Exurbanites (1E) 4.0% 70.4% 1.9% 19.4% 203
Subtotal 26.3% 10.2%
11 Old and Newcomers (8F) 3.6% 74.0% 2.3% 21.7% 154
12 Retirement Communities (9E) 2.8% 76.8% 1.2% 22.9% 229
13 Midlife Constants (5E) 2.4% 79.2% 2.5% 25.4% 95
14 Social Security Set (9F) 2.1% 81.3% 0.8% 26.2% 264
15 Golden Years (9B) 1.8% 83.1% 1.3% 27.5% 135
Subtotal 12.7% 8.1%
16 Urban Chic (2A) 1.7% 84.8% 1.3% 28.8% 130
17 Salt of the Earth (6B) 1.7% 86.5% 2.9% 31.7% 58
18 Heartland Communities (6F) 1.4% 87.9% 2.4% 34.1% 59
19 Enterprising Professionals (2D) 1.4% 89.3% 1.4% 35.5% 97
20 Hardscrabble Road (8G) 1.2% 90.5% 1.2% 36.7% 101
Subtotal 7.4% 9.2%
Total 90.5% 36.8% 246
SECONDARY RETAIL TRADE AREA • TOP TAPESTRY SEGMENTSRoyal Oak, Michigan

7
The backbone of older industrial cities in statessurrounding the Great Lakes, Rustbelt Traditions residents are a mix of married-couple families and singles living in older developments of single-family homes.While varied, the work force is primarily white collar, with a higher concentration of skilled workers in manufacturing, retail trade, and health care. Rustbelt Traditions represents a large market of stable, hard-working consumers with modest incomes but above average net worth (Index 111). Family oriented, they value time spent at home. Most have lived, worked, and played in the same area for years.
US Household // 2,685,000Average Household Size // 2.46Median Age // 38.4Median Household Income // $49,000
LifeMode Group • GenXurban
RUSTBELT TRADITIONS5D

8
+ MARKET PROFILE(Consumer preferences are estimated from data by GfK MRI)
• Residents take advantage of convenience stores for fueling up and picking up incidentals.
• Watching television is a common pastime; many households have more than four TVs.
• Favorite programming ranges from ESPN, Animal Planet, and AMC to children’s shows on Nickelodeon and Cartoon Network.
• Residents are connected; entertainment activities like online gaming dominate their Internet usage.
• Favorite family restaurants include Applebee’s, Outback Steakhouse, and Texas Roadhouse.
• Radio dials are typically tuned to classic rock stations.
+ SOCIOECONOMIC TRAITS• Most have graduated from high school or spent some time at a college or university.
• Unemployment below the US at 8%; labor force participation slightly higher than the US at 67%.
• While most income derived from wages and salaries, nearly 30% of households collecting Social Security and nearly 20% drawing income from retirement accounts.
• Family-oriented consumers who value time spent at home.
• Most lived, worked, and played in the same area for years.
• Budget aware shoppers that favor American-made products.
• Read newspapers, especially the Sunday editions.
+ HOUSINGMedian home value is displayed for markets that are primarilyowner occupied; average rent is shown for renter-occupied markets.Tenure and home value are estimated by Esri. Housing type and average rent are from the Census Bureau’s American Community Survey.
Typical Housing:Single FamilyMedian Value:$118,000US Median $177,000
5D
RU
STB
ELT
TRA
DIT
ION
S Li
feM
ode
Gro
up •
Gen
Xur
ban
+ OUR NEIGHBORHOOD• Almost half (46%) of the households are married-couple families, similar to the US (48%), most without children (also similar to the US); the slightly higher proportion
of singles (Index 105) reflects the aging of the population.
• Average household size is slightly lower at 2.46.
• They are movers, slightly more mobile than the US population (Index 109), but almost half of householders (46%) moved into their current homes before 2000.
• Most residents live in modest, single-family homes in older neighborhoods built in the 1950s (Index 218).
• Nearly three quarters own their homes; over half of households have mortgages.
• A large and growing market, Rustbelt Traditions residents are located in the dense urban fringe of metropolitan areas throughout the Midwest and South.
• Most households have two or more vehicles available.

9
RUSTBELT TRADITIONS LifeMode Group • GenXurban5D
Male Female8% 4% 0 4% 8%
85+80–8475–7970–7465–6960–6455–5950–5445–4940–4435–3930–3425–2920–2415–1910–14
5–9< 5
* Hispanic can be of any race. US Average
82.6%
8.4%
3.6%
2.8%
10.7%
0.8%
1.8%
80%60%40%20%0
White
Black
AmericanIndian
Asian andPac. Island
Other
Multiple
Hispanic*
0
$60k $90k$30k $120k+
Median Household Income
$49,000
US Median $51,000
0
0
$300k$100k $200k $400k+
Median Net Worth
$79,000
US Median $71,000
$60,000
$40,000
$20,000
0 300,000 500,000 700,000
Med
ian
Ear
ning
s
Workers (Age 16+)100,000
Production
Transportation andMaterial Moving
Office andAdministrative Support
Management
Sales and Related
3500 50 100 150 200 250 300
Housing
Food
Apparel & Services
Transportation
Health Care
Entertainment &Recreation
Education
Pensions &Social Security
Other
81
53
83
85
84
79
81
80
80
TAPESTRYSEGMENTATION
TM
esri.com/tapestry
LifeMode Group: GenXurban
Rustbelt Traditions
INCOME AND NET WORTHNet worth measures total household assets (homes, vehicles, investments, etc.) less any debts, secured (e.g., mortgages)or unsecured (credit cards). Household income andnet worth are estimated by Esri.
AGE BY SEX (Esri data)
Median Age: 38.4 US: 37.6| Indicates US
RACE AND ETHNICITY (Esri data)
The Diversity Index summarizes racial and ethnic diversity. The index shows the likelihood that two persons, chosen at random from the same area, belong to different race or ethnic groups. The index ranges from 0 (no diversity) to 100 (complete diversity).
Diversity Index: 44.2 US: 62.1
5D
OCCUPATION BY EARNINGSThe fi ve occupations with the highest number of workers in the market are displayedby median earnings. Data from the Census Bureau’s American Community Survey.
AVERAGE HOUSEHOLD BUDGET INDEXThe index compares the average amount spent in this market’s household budgets for housing, food, apparel, etc., to the average amount spent by all US households. An indexof 100 is average. An index of 120 shows that average spending by consumers in this marketis 20 percent above the national average. Consumer expenditures are estimated by Esri.
10
Emerald City’s denizens live in lower-density neighborhoods of urban areas throughout the country.Young and mobile, they are more likely to rent. Well educated and well employed, half have a collegedegree and a professional occupation. Incomes close to the US median come primarily from wages andself-employment. This group is highly connected, using the Internet for entertainment and making environmentally friendly purchases. Long hours on the Internet are balanced with time at the gym. Many embrace the “foodie” culture and enjoy cooking adventurous meals using local and organic foods. Musicand art are major sources of enjoyment. They travel frequently, both personally and for business.
US Household // 1,677,000Average Household Size // 2.05Median Age // 36.6Median Household Income // $52,000
LifeMode Group • Middle Ground
EMERALD CITY8B
11
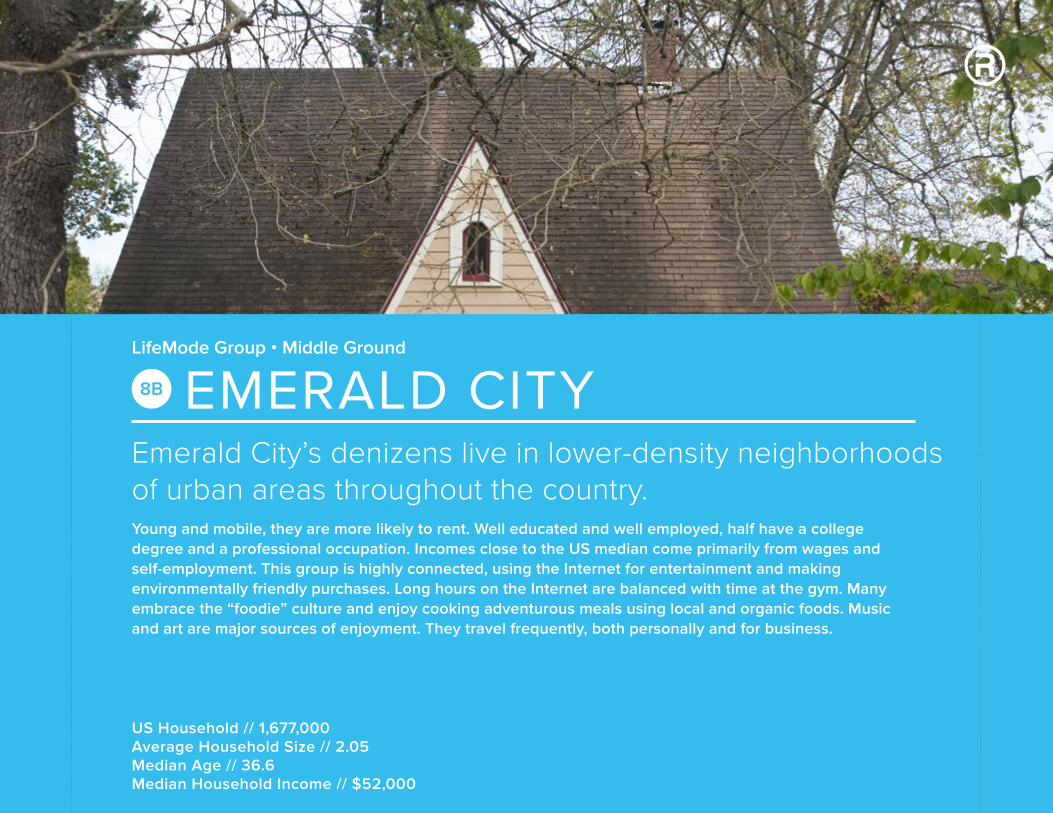
+ MARKET PROFILE(Consumer preferences are estimated from data by GfK MRI)
• Liberal segment that contributes to NPR and PBS.
• Shop at Trader Joe’s and Whole Foods.
• Budget time—utilize home cleaning services so there’s time for yoga.
• Use the web for professional networking, blogging, and online dating.
• Read magazines and books on a tablet, sometimes while exercising at home.
• Go to art galleries and make art at home.
+ SOCIOECONOMIC TRAITS• Well educated, these consumers research products carefully before making purchases.
• They buy natural, green, and environmentally friendly products.
• Very conscious of nutrition, they regularly buy and eat organic foods.
• Cell phones and text messaging are a huge part of everyday life.
• They place importance on learning new things to keep life fresh and variable.
• They are interested in the fine arts and especially enjoy listening to music.
+ HOUSINGMedian home value is displayed for markets that are primarilyowner occupied; average rent is shown for renter-occupied markets Tenure and home value are estimated by Esri. Housing type and average rent are from the Census Bureau’s American Community Survey.
Typical Housing:Single Family;MultiunitsAverage Rent:$1,030US Average $990
8B
EMER
ALD
CIT
Y L
ifeM
ode
Gro
up •
Mid
dle
Gro
und
+ OUR NEIGHBORHOOD• There are mostly older, established neighborhoods with homes built before 1960; around 30% built before 1940.
• Just over half of all homes are renter occupied.
• Single-person and nonfamily types make up over half of all households.
• Median home value and average rent are slightly above the US levels; around half of owned homes are worth $150,000–$300,000.

12
TRADITIONAL LIVING LifeMode Group • Middle Ground8B
Male Female8% 4% 0 4% 8%
85+80–8475–7970–7465–6960–6455–5950–5445–4940–4435–3930–3425–2920–2415–1910–14
5–9< 5
* Hispanic can be of any race. US Average
79.3%
8.9%
3.2%
3.3%
10.5%
0.8%
4.4%
80%60%40%20%0
White
Black
AmericanIndian
Asian andPac. Island
Other
Multiple
Hispanic*
0
$60k $90k$30k $120k+
Median Household Income
$52,000
US Median $51,000
0
0
$300k$100k $200k $400k+
Median Net Worth
$37,000
US Median $71,000
$70,000
$50,000
$30,000
$10,000
0 300,000
Med
ian
Ear
ning
s
Workers (Age 16+)100,000 200,000
Sales and Related
Education, Training,and Library
Office andAdministrative Support
ManagementHealth Care Practitioners
and Technical
3500 50 100 150 200 250 300
Housing
Food
Apparel & Services
Transportation
Health Care
Entertainment &Recreation
Education
Pensions &Social Security
Other
99
68
98
92
100
105
99
95
101
TAPESTRYSEGMENTATION
TM
esri.com/tapestry
LifeMode Group: Middle Ground
Emerald City
INCOME AND NET WORTHNet worth measures total household assets (homes, vehicles, investments, etc.) less any debts, secured (e.g., mortgages)or unsecured (credit cards). Household income andnet worth are estimated by Esri.
AGE BY SEX (Esri data)
Median Age: 36.6 US: 37.6| Indicates US
RACE AND ETHNICITY (Esri data)
The Diversity Index summarizes racial and ethnic diversity. The index shows the likelihood that two persons, chosen at random from the same area, belong to different race or ethnic groups. The index ranges from 0 (no diversity) to 100 (complete diversity).
Diversity Index: 48.1 US: 62.1
8B
OCCUPATION BY EARNINGSThe fi ve occupations with the highest number of workers in the market are displayedby median earnings. Data from the Census Bureau’s American Community Survey.
AVERAGE HOUSEHOLD BUDGET INDEXThe index compares the average amount spent in this market’s household budgets for housing, food, apparel, etc., to the average amount spent by all US households. An indexof 100 is average. An index of 120 shows that average spending by consumers in this marketis 20 percent above the national average. Consumer expenditures are estimated by Esri.
13
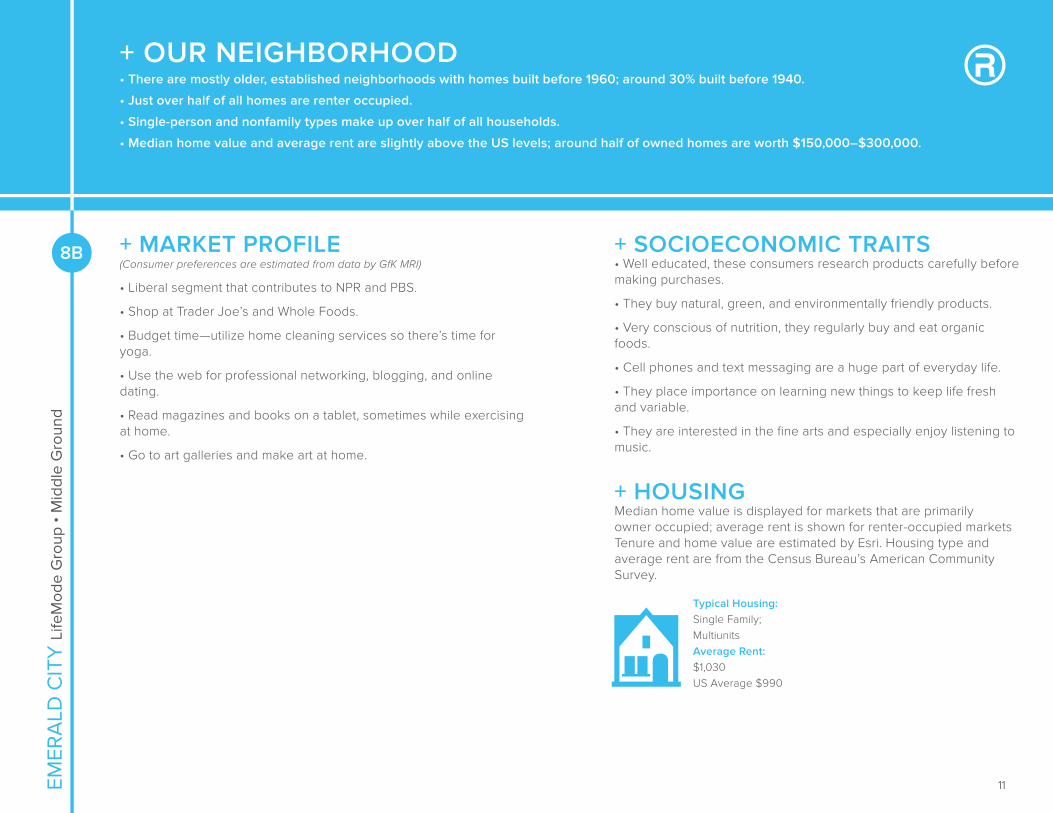
Family and faith are the cornerstones of life inthese communities.Older children, still living at home, working toward financial independence, are common within thesehouseholds. Neighborhoods are stable: little household growth has occurred for more than a decade. Manyresidents work in the health care industry or public administration across all levels of government. Style isimportant to these consumers, who spend on clothing for themselves and their children, as well ason smartphones.
US Household // 1,282,000Average Household Size // 2.70Median Age // 38.8Median Household Income // $40,000
LifeMode Group • Hometown
FAMILY FOUNDATIONS12A
14
+ MARKET PROFILE(Consumer preferences are estimated from data by GfK MRI)
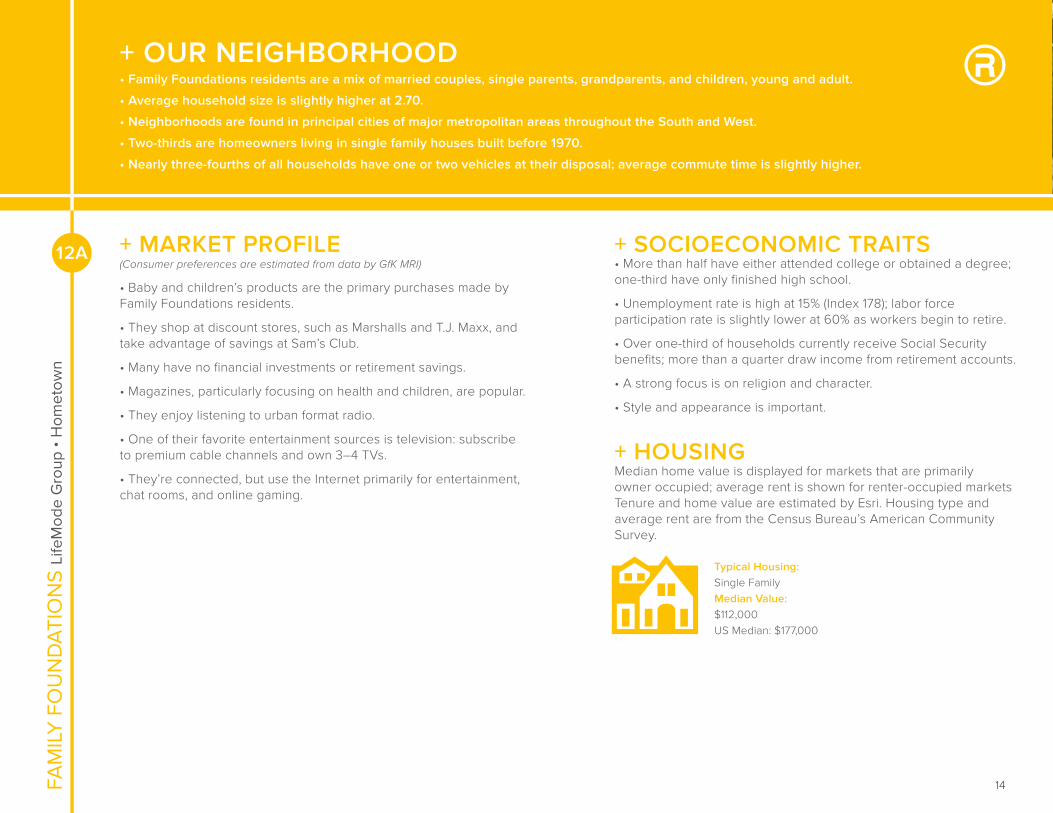
• Baby and children’s products are the primary purchases made byFamily Foundations residents.
• They shop at discount stores, such as Marshalls and T.J. Maxx, and take advantage of savings at Sam’s Club.
• Many have no financial investments or retirement savings.
• Magazines, particularly focusing on health and children, are popular.
• They enjoy listening to urban format radio.
• One of their favorite entertainment sources is television: subscribe to premium cable channels and own 3–4 TVs.
• They’re connected, but use the Internet primarily for entertainment, chat rooms, and online gaming.
+ SOCIOECONOMIC TRAITS• More than half have either attended college or obtained a degree; one-third have only finished high school.
• Unemployment rate is high at 15% (Index 178); labor force participation rate is slightly lower at 60% as workers begin to retire.
• Over one-third of households currently receive Social Security benefits; more than a quarter draw income from retirement accounts.
• A strong focus is on religion and character.
• Style and appearance is important.
+ HOUSINGMedian home value is displayed for markets that are primarilyowner occupied; average rent is shown for renter-occupied markets Tenure and home value are estimated by Esri. Housing type and average rent are from the Census Bureau’s American Community Survey.
Typical Housing:Single FamilyMedian Value:$112,000US Median: $177,000
12A
FAM
ILY
FO
UN
DA
TIO
NS
Life
Mod
e G
roup
• H
omet
own
+ OUR NEIGHBORHOOD• Family Foundations residents are a mix of married couples, single parents, grandparents, and children, young and adult.
• Average household size is slightly higher at 2.70.
• Neighborhoods are found in principal cities of major metropolitan areas throughout the South and West.
• Two-thirds are homeowners living in single family houses built before 1970.
• Nearly three-fourths of all households have one or two vehicles at their disposal; average commute time is slightly higher.

15
FAMILY FOUNDATIONS LifeMode Group • Hometown12A
85+80–8475–7970–7465–6960–6455–5950–5445–4940–4435–3930–3425–2920–2415–1910–14
Male Female
5–9< 5
8% 4% 0 4% 8%
* Hispanic can be of any race. US Average
13.6%
79.9%
2.9%
2.2%
7.1%
0.5%
1.0%
80%60%40%20%0
White
Black
AmericanIndian
Asian andPac. Island
Other
Multiple
Hispanic*
0
$60k $90k$30k $120k+
Median Household Income
$40,000
US Median $51,000
0
0
$300k$100k $200k $400k+
Median Net Worth
$53,000
US Median $71,000
$60,000
$40,000
$20,000
0 300,000
Med
ian
Ear
ning
s
Workers (Age 16+)150,000100,00050,000 250,000200,000
Sales and Related
Office andAdministrative Support
Production
Management
Transportation andMaterial Moving
3500 50 100 150 200 250 300
Housing
Food
Apparel & Services
Transportation
Health Care
Entertainment &Recreation
Education
Pensions &Social Security
Other
73
48
73
76
74
68
71
71
72
TAPESTRYSEGMENTATION
TM
esri.com/tapestry
LifeMode Group: Hometown
Family Foundations
INCOME AND NET WORTHNet worth measures total household assets (homes, vehicles, investments, etc.) less any debts, secured (e.g., mortgages)or unsecured (credit cards). Household income andnet worth are estimated by Esri.
AGE BY SEX (Esri data)
Median Age: 38.8 US: 37.6| Indicates US
RACE AND ETHNICITY (Esri data)
The Diversity Index summarizes racial and ethnic diversity. The index shows the likelihood that two persons, chosen at random from the same area, belong to different race or ethnic groups. The index ranges from 0 (no diversity) to 100 (complete diversity).
Diversity Index: 43.0 US: 62.1
12A
OCCUPATION BY EARNINGSThe fi ve occupations with the highest number of workers in the market are displayedby median earnings. Data from the Census Bureau’s American Community Survey.
AVERAGE HOUSEHOLD BUDGET INDEXThe index compares the average amount spent in this market’s household budgets for housing, food, apparel, etc., to the average amount spent by all US households. An indexof 100 is average. An index of 120 shows that average spending by consumers in this marketis 20 percent above the national average. Consumer expenditures are estimated by Esri.

16
Residents in this segment live primarily in low-density,settled neighborhoods in the Midwest.The households are a mix of married-couple families and singles. Many families encompass two generations who have lived and worked in the community; their children are likely to follow suit. The manufacturing, retail trade, and health care sectors are the primary sources of employment for these residents. This is a younger market—beginning householders who are juggling the responsibilities of living on their own or a new marriage, while retaining their youthful interests in style and fun.
US Household // 2,369,000Average Household Size // 2.50Median Age // 34.8Median Household Income // $37,000
LifeMode Group • Hometown
TRADITIONAL LIVING12B

17
+ MARKET PROFILE(Consumer preferences are estimated from data by GfK MRI)
• They shop for groceries at discount stores such as Walmart supercenters; Kmart is also a favorite for apparel and sundry household and personal care products.
• Convenience stores are commonly used for fuel or picking up incidentals like lottery tickets.
• They tend to carry credit card balances, have student loans, and pay bills in person.
• Half of households have abandoned landlines for cell phones only.
• They watch their favorite channels including QVC, CMT, and Game Show Network.
• They’re fast food devotees.
• They enjoy outdoor activities such as camping and taking trips to the zoo.
+ SOCIOECONOMIC TRAITS• Over 70% have completed high school or some college.
• Unemployment is higher at 10.9% (Index 127); labor force participation is also a bit higher at 64.6%.
• Over three quarters of households derive income from wages and salaries, augmented by Supplemental Security Income (Index 122) and public assistance (Index 149).
• Cost-conscious consumers that are comfortable with brand loyalty, unless the price is too high.
• Connected and comfortable with the Internet, they are more likely to participate in online gaming or to access dating websites.
• TV is seen as the most trusted media.
+ HOUSINGMedian home value is displayed for markets that are primarilyowner occupied; average rent is shown for renter-occupied markets Tenure and home value are estimated by Esri. Housing type and average rent are from the Census Bureau’s American Community Survey.
Typical Housing:Single FamilyMedian Value:$79,000US Median: $177,000
12B
TRA
DIT
ION
AL
LIV
ING
Life
Mod
e G
roup
• H
omet
own
+ OUR NEIGHBORHOOD• Married couples are the dominant household type, but fewer than expected from the younger age profile and fewer with children (Index 79); however, there are higher proportions of single-parent (Index 146) and single-person households (Index 112).• Average household size is slightly lower at 2.50.• Homes are primarily single family or duplexes in older neighborhoods, built before 1940 (Index 183).• Most neighborhoods are located in lower-density urban clusters of metro areas throughout the Midwest and South.• Average commuting time to work is slightly shorter (Index 88).• Households have one or two vehicles.

18
TRADITIONAL LIVING LifeMode Group • Hometown12B
Male Female8% 4% 0 4% 8%
85+80–8475–7970–7465–6960–6455–5950–5445–4940–4435–3930–3425–2920–2415–1910–14
5–9< 5
* Hispanic can be of any race. US Average
75.8%
13.0%
4.8%
3.5%
11.8%
1.5%
1.4%
80%60%40%20%0
White
Black
AmericanIndian
Asian andPac. Island
Other
Multiple
Hispanic*
0
$60k $90k$30k $120k+
Median Household Income
$37,000
US Median $51,000
0
0
$300k$100k $200k $400k+
Median Net Worth
$29,000
US Median $71,000
$40,000
$30,000
$20,000
$10,000
0 500,000
Med
ian
Ear
ning
s
Workers (Age 16+)300,000200,000100,000 400,000
Sales and Related
Food Preparationand Serving Related
Office andAdministrative Support
Production
Transportation andMaterial Moving
3500 50 100 150 200 250 300
Housing
Food
Apparel & Services
Transportation
Health Care
Entertainment &Recreation
Education
Pensions &Social Security
Other
66
43
67
66
66
63
62
62
63
TAPESTRYSEGMENTATION
TM
esri.com/tapestry
LifeMode Group: Hometown
Traditional Living
INCOME AND NET WORTHNet worth measures total household assets (homes, vehicles, investments, etc.) less any debts, secured (e.g., mortgages)or unsecured (credit cards). Household income andnet worth are estimated by Esri.
AGE BY SEX (Esri data)
Median Age: 34.8 US: 37.6| Indicates US
RACE AND ETHNICITY (Esri data)
The Diversity Index summarizes racial and ethnic diversity. The index shows the likelihood that two persons, chosen at random from the same area, belong to different race or ethnic groups. The index ranges from 0 (no diversity) to 100 (complete diversity).
Diversity Index: 53.1 US: 62.1
12B
OCCUPATION BY EARNINGSThe fi ve occupations with the highest number of workers in the market are displayedby median earnings. Data from the Census Bureau’s American Community Survey.
AVERAGE HOUSEHOLD BUDGET INDEXThe index compares the average amount spent in this market’s household budgets for housing, food, apparel, etc., to the average amount spent by all US households. An indexof 100 is average. An index of 120 shows that average spending by consumers in this marketis 20 percent above the national average. Consumer expenditures are estimated by Esri.

19
Residents in this large, growing segment are older, withmore than half of all householders aged 55 or older; many still live in the suburbs where they grew up.Most are professionals working in government, health care, or manufacturing. These Baby Boomers are earning a comfortable living and benefiting from years of prudent investing and saving. Their net worth is well above average (Index 363). Many are enjoying the transition from child rearing to retirement. They value their health and financial well-being.
US Household // 2,973,000Average Household Size // 2.50Median Age // 46.8Median Household Income // $68,000
LifeMode Group • GenXurban
COMFORTABLE EMPTY NESTERS5A

20
+ MARKET PROFILE(Consumer preferences are estimated from data by GfK MRI)
• Residents enjoy listening to sports radio or watching sports on television.
• Physically active, they play golf, ski, ride bicycles, and work out regularly.
• Spending a lot of time online isn’t a priority, so most own older home computers.
• Financial portfolio includes stocks, certificates of deposit, mutual funds, and real estate.
+ SOCIOECONOMIC TRAITS• Education: 34% college graduates; nearly 66% with some college education.
• Low unemployment at 7%; average labor force participation at 61%.
• Most households income from wages or salaries, but a third also draw income from investments (Index 154) and retirement (Index 166).
• Comfortable Empty Nesters residents physically and financially active.
• Prefer eating at home instead of dining out.
• Home maintenance a priority among these homeowners.
+ HOUSINGMedian home value is displayed for markets that are primarilyowner occupied; average rent is shown for renter-occupied markets.Tenure and home value are estimated by Esri. Housing type and average rent are from the Census Bureau’s American Community Survey.
Typical Housing:Single FamilyMedian Value:$187,000US Median $177,000
5A
CO
MFO
RTA
BLE
EM
PTY
NES
TER
S Li
feM
ode
Gro
up •
Gen
Xur
ban
+ OUR NEIGHBORHOOD• Married couples, some with children, but most without (Index 149).
• Average household size slightly lower at 2.50.
• Found throughout the suburbs and small towns of metropolitan areas, where most residents own and live in single-family detached
homes (Index 142).
• Most homes built between 1950 and 1990 (Index 129).
• Households generally have one or two vehicles.

21
COMFORTABLE EMPTY NESTERS LifeMode Group • GenXurban5A
85+80–8475–7970–7465–6960–6455–5950–5445–4940–4435–3930–3425–2920–2415–1910–14
Male Female
5–9< 5
8% 4% 0 4% 8%
* Hispanic can be of any race. US Average
88.3%
5.5%
1.6%
1.9%
6.1%
0.4%
2.2%
80%60%40%20%0
White
Black
AmericanIndian
Asian andPac. Island
Other
Multiple
Hispanic*
0
$60k $90k$30k $120k+
Median Household Income
$68,000
US Median $51,000
0
0
$300k$100k $200k $400k+
Median Net Worth
$258,000
US Median $71,000
$80,000
$60,000
$40,000
$20,000
100,0000 300,000 500,000 700,000
Med
ian
Ear
ning
s
Workers (Age 16+)
Health Care Practitionersand Technical
Education, Training,and Library
Office andAdministrative Support
Management
Sales and Related
3500 50 100 150 200 250 300
Housing
Food
Apparel & Services
Transportation
Health Care
Entertainment &Recreation
Education
Pensions &Social Security
Other
114
76
116
126
123
118
121
118
117
TAPESTRYSEGMENTATION
TM
esri.com/tapestry
LifeMode Group: GenXurban
Comfortable Empty Nesters
INCOME AND NET WORTHNet worth measures total household assets (homes, vehicles, investments, etc.) less any debts, secured (e.g., mortgages)or unsecured (credit cards). Household income andnet worth are estimated by Esri.
AGE BY SEX (Esri data)
Median Age: 46.8 US: 37.6| Indicates US
RACE AND ETHNICITY (Esri data)
The Diversity Index summarizes racial and ethnic diversity. The index shows the likelihood that two persons, chosen at random from the same area, belong to different race or ethnic groups. The index ranges from 0 (no diversity) to 100 (complete diversity).
Diversity Index: 30.6 US: 62.1
5A
OCCUPATION BY EARNINGSThe fi ve occupations with the highest number of workers in the market are displayedby median earnings. Data from the Census Bureau’s American Community Survey.
AVERAGE HOUSEHOLD BUDGET INDEXThe index compares the average amount spent in this market’s household budgets for housing, food, apparel, etc., to the average amount spent by all US households. An indexof 100 is average. An index of 120 shows that average spending by consumers in this marketis 20 percent above the national average. Consumer expenditures are estimated by Esri.

22
Providing more than simple data reports of psychographic and demographic trends, The Retail Coach goes well beyond other retail consulting and market research firms’ offerings by combining current national and statewide demographics and trend data with real-world, “on-the-ground” data gathered through extensive visits within our clients’ communities.
Every community is different, and there is no “one size fits all” retail recruitment solution. Compiling the gathered data into client-tailored information packets that are uniquely designed for, and targeted to, specific retailers and restaurants who meet the community’s needs helps assure our clients that they are receiving the latest and best information for their retail recruitment efforts—all with personal service and coaching guidance that continues beyond the initial project scope and timeline.
Our Retail360® process assures that communities get timely, accurate and relevant information. Translating that data into the information that retailers need and seek assures our clients even better possibilities for tremendous retail growth and success.
C. Kelly Cofer President & CEO The Retail Coach, LLC
The Retail Coach, LLC, is a national retail analytics and locational intelligence firm that specializes in all aspects of retail market analyses and recruitment, from “macro to micro” trade area assessment to actively recruiting retailers on behalf of our clients.
Through its unique Retail360® process, The Retail Coach offers a dynamic system of products and services that better enable communities to maximize their retail development potential.
ABOUT THE RETAIL COACH
The Retail Coach –
“ It’s not about data. It’s about your success.”
P.O. Box 7272 | Tupelo, MS 38802 | 800.851.0962 | [email protected] | www.theretailcoach.net

23
ACKNOWLEDGEMENTS
The observations, conclusions and recommendations contained in this study are solely those of The Retail Coach, LLC and should not be construed to represent the opinions of others, including its clients, or any other entity prior to such entity’s express approval of this study.
All information furnished is from sources deemed reliable and is submitted subject to errors, omissions, change of terms and/or conditions.
Sources used in completing this study include: infoUSA™, Applied Geographic Solutions, Nielsen 2015/2016, ESRI 2015, U.S. Census Bureau, Economy.com, Spatial Insights Inc., Urban Land Institute, CensusViewer.com, International Council of Shopping Centers, and/or U.S. Bureau of Labor and Statistics.
To better represent current data, where applicable, portions of estimated actual sales may be calculated using an average sales per square foot model.
Mapping data is provided by MapInfo, Nielsen, ESRI and/or Microsoft Corporation.
All information furnished is from sources deemed reliable and is submitted subject to errors, omissions, change of terms and/or conditions.
P.O. Box 7272 | Tupelo, MS 38802 | 800.851.0962 | [email protected] | www.theretailcoach.net