Embed Size (px)
Citation preview

RETAIL TRADE AREAPSYCHOGRAPHIC PROFILEMcAllen, Texas
Prepared forCity of McAllenMay 2015

2
Copyright © and (P) 1988–2012 Microsoft Corporation and/or its suppliers. All rights reserved. http://www.microsoft.com/mappoint/Certain mapping and direction data © 2012 NAVTEQ. All rights reserved. The Data for areas of Canada includes information taken with permission from Canadian authorities, including: © Her Majesty the Queen in Right of Canada, © Queen's Printer for Ontario. NAVTEQ and NAVTEQ ON BOARD are trademarks of NAVTEQ. © 2012 Tele Atlas North America, Inc. All rights reserved. Tele Atlas and Tele Atlas North America are trademarks of Tele Atlas, Inc. © 2012 by Applied Geographic Solutions. All rights reserved. Portions © Copyright 2012 by Woodall Publications Corp. All rights reserved.
McAllenTX_RTA_Map_2014
0 mi 5 10 15
Retail Trade AreaMcAllen, Texas
Contact InformationRebecca M. OlaguibelRetail and Business Development DirectorCity Manager’s Office1300 Houston AvenueMcAllen, Texas 78501
Phone [email protected] (@mcallenbusiness) | Twitterwww.mcallenmeansbusiness.comwww.buildmcallen.com

3
Tapestry Segmentation classifies US neighborhoods into 67 distinct market segments. Neighborhoods with the most similar characteristics are grouped together, while neighborhoods with divergent characteristics are separated. Tapestry Segmentation combines the “who” of lifestyle demography with the “where” of local neighborhood geography to create a model of various lifestyle classifications, or segments, of actual neighborhoods with addresses—distinct behavioral market segments.
+ WHO SHOULD USE TAPESTRY SEGMENTATION?All companies, agencies, and organizations need to understand consumers/constituents in order to supply them with the right products and services and to reach them via their preferred media. These applications require a robust segmentation system that can accurately profile these diverse markets. The versatility and predictive power of Tapestry Segmentation allow users to integrate their own data or national consumer surveys into Tapestry Segmentation to identify their best market segments and reach them through the most effective channels.
+ TAPESTRY SEGMENTATION SUMMARY GROUPSEsri’s Tapestry Segmentation provides a robust, powerful portrait of the 67 US consumer markets. To provide a broader view of these 67 segments, Esri combined them into 14 LifeMode Summary Groups based on lifestyle and lifestage composition.
L1 Affluent EstatesL2 Upscale AvenuesL3 Uptown IndividualsL4 Family LandscapesL5 GenXurbanL6 Cozy Country LivingL7 Ethnic EnclavesL8 Middle GroundL9 Senior StylesL10 Rustic OutpostsL11 Midtown SinglesL12 HometownL13 New WaveL14 Scholars and Patriots
+ WHAT IS TAPESTRY SEGMENTATION?Tapestry Segmentation is a market segmentation system that classifies US neighborhoods based on their socioeconomic and demographic compositions. Tapestry is a system for classifying consumers and constituents using all the variables that can distinguish consumer behavior, from household characteristics such as income and family type to personal traits like age, education,or employment and even housing choices.
TAPESTRY SEGMENTATION PROFILE

4
+ Affluent Estates
+ Upscale Avenues
+ Uptown Individuals
+ Family Landscapes
+ GenXurban
+ Cozy Country Living
+ Ethnic Enclaves
+ Middle Ground
+ Senior Styles
+ Rustic Outposts
+ Midtown Singles
+ Hometown
+ New Wave
+ Scholars and Patriots
- - - US Median Income $51,000
0 $20k $40k $60k $80k $100k $120k $140k $160k
INCOME RANGE OF LIFEMODE SUMMARY GROUPS
5
+ L1 AFFLUENT ESTATESEstablished wealth — educated, well-traveled married couples
+ L2 UPSCALE AVENUESProsperous, married couplesin higher density neighborhoods
+ L3 UPTOWN INDIVIDUALSYounger, urban singles on the move
+ L4 FAMILY LANDSCAPESSuccessful younger families in newer housing
+ L5 GENXURBANGen X in middle age; families with fewer kids and a mortgage
+ L6 COZY COUNTRYEmpty nesters in bucolic settings
+ L7 ETHNIC ENCLAVESEstablished diversity — young, Hispanic homeowners with families
+ L8 MIDDLE GROUNDLifestyles of thirtysomethings
+ L9 SENIOR STYLESSenior lifestyles reveal the effects of saving for retirement
+ L10 RUSTIC OUTPOSTSCountry life with older families, older homes
+ L11 MIDTOWN SINGLESMillennials on the move; single, diverse, and urban
+ L12 HOMETOWNGrowing up and staying close to home; single householders
+ L13 NEXT WAVEUrban denizens; young, diverse,hardworking families
+ L14 SCHOLARS AND PATRIOTSCollege campuses and military neighborhoods
RETAIL TRADE AREA • LIFEMODE SUMMARY GROUPS MAPMcAllen, Texas
Dominant Tapestry MapMcAllenTX_RTA_Map_2015Area: 436.93 square miles
Source: Esri
May 06, 2015Prepared by Esri
©2015 Esri www.esri.com/ba 800-447-9778 Try it Now! Page 1 of 2

6
TAPESTRY SEGMENTATION HOUSEHOLDS PERCENT CUMULATIVE PERCENT US HOUSEHOLDS PERCENT CUMULATIVE PERCENT INDEX
1 Southwestern Families (7F) 31.3% 31.3% 0.8% 0.8% 3,749
2 Barrios Urbanos (7D) 26.0% 57.3% 1.0% 1.8% 2,496
3 Up and Coming Families (7A) 8.3% 65.6% 2.2% 4.0% 378
4 Senior Escapes (9D) 3.8% 69.4% 0.9% 4.9% 414
5 Soccer Moms (4A) 3.5% 72.9% 2.8% 7.7% 125
Subtotal 72.9% 7.7%
6 Las Casas (13B) 2.4% 75.3% 0.7% 8.4% 326
7 Metro Fusion (11C) 2.2% 77.5% 1.4% 9.8% 155
8 Boomburbs (1C) 2.1% 79.6% 1.5% 11.3% 141
9 Bright Young Professionals (8C) 1.8% 81.4% 2.2% 13.5% 81
10 Rooted Rural (10B) 1.5% 82.9% 2.0% 15.5% 74
Subtotal 10.0% 7.8%
11 American Dreamers (7C) 1.5% 84.4% 1.5% 17.0% 99
12 Home Improvement (4B) 1.4% 85.8% 1.7% 18.7% 83
13 College Towns (14B) 1.3% 87.1% 0.9% 19.6% 136
14 Middleburg (4C) 1.3% 88.4% 2.8% 22.4% 46
15 In Style (5B) 1.2% 89.6% 2.3% 24.7% 55
Subtotal 6.7% 9.2%
16 Urban Villages (7B) 1.2% 90.8% 1.1% 25.8% 113
17 The Elders (9C) 1.0% 91.8% 0.7% 26.5% 137
18 Down the Road (10D) 1.0% 92.8% 1.1% 27.6% 88
19 NeWest Residents (13C) 0.9% 93.7% 0.8% 28.4% 112
20 City Lights (8A) 0.8% 94.5% 1.5% 29.9% 54
Subtotal 4.9% 5.2%
Total 94.4% 30.0% 315
RETAIL TRADE AREA • TOP TAPESTRY SEGMENTSMcAllen, Texas

7
Residents in these neighborhoods are young families thatform the foundation of Hispanic life in the Southwest.Children are the center of households that are composed mainly of married couples with children and single-parent families. Grandparents are caregivers in some of these households. Recent arrivals and older generations are language-isolated. Much of the working-age population is employed in blue-collar occupations, specializing in skilled work, as well as building maintenance and service jobs. Spending is focused on the family and at-home entertainment, but they do like to gamble (casinos and lottery tickets).
US Household // 1,000,000Average Household Size // 3.17Median Age // 33.8Median Household Income // $27,000
LifeMode Group • Ethnic Enclaves
SOUTHWESTERN FAMILIES7F

8
+ MARKET PROFILE(Consumer preferences are estimated from data by GfK MRI)
• Television is a primary source of entertainment, and most homes have multiple sets.
• Although residents watch their spending, they typically carry balances on credit cards.
• Baby and children’s products, such as food, clothing, and equipment, are common purchases.
• They shop at pharmacies such as CVS, as well as discount department stores like Marshalls and Sears.
• They listen to Hispanic radio and watch Hispanic programming on television.
• Most households have landlines—used frequently for international calls.
• About 2 out of 3 households are connected, although access to the Internet is used primarily for entertainment.
+ SOCIOECONOMIC TRAITS• While close to 30% have attended or graduated from college, over 40% did not complete high school, which has limited their employment prospects.
• High rate of unemployment is at 12% (Index 139), and low labor force participation is at 52% (Index 83).
• Most households receive income from wages or salaries, but over 35% receive contributions from Social Security and over 10% from Supplemental Security Income.
• While budget-conscious consumers, they are also mindful of quality and attentive to environmental concerns in their purchasing decisions.
• Often, purchase decisions are based on how a product may improve or organize their lives.
+ HOUSINGMedian home value is displayed for markets that are primarilyowner occupied; average rent is shown for renter-occupied markets.Tenure and home value are estimated by Esri. Housing type and average rent are from the Census Bureau’s American Community Survey.
Typical Housing:Single FamilyMedian Value:$92,000US Median: $177,000
7F
SOU
THW
ESTE
RN
FA
MIL
IES
Life
Mod
e G
roup
• E
thni
c En
clav
es+ OUR NEIGHBORHOOD• A family market: Married couples with kids, single parents, and grandparents head these households.
• Average household size is higher at 3.17 (Index 123).
• Many residents were born abroad (Index 237); many households have residents who speak only Spanish (Index 594).
• Over 40% of householders rent single-family homes within a mix of urban city centers and the suburbs in metropolitan areas.
• Neighborhoods are older; most of the homes constructed prior to 1970.
• Over 70% of all households have one or two vehicles available.

9
SOUTHWESTERN FAMILIES LifeMode Group • Ethnic Enclaves7F
Male Female8% 4% 0 4% 8%
85+80–8475–7970–7465–6960–6455–5950–5445–4940–4435–3930–3425–2920–2415–1910–14
5–9< 5
* Hispanic can be of any race. US Average
70.2%
5.9%
16.8%
2.7%
81.9%
2.9%
1.5%
80%60%40%20%0
White
Black
AmericanIndian
Asian andPac. Island
Other
Multiple
Hispanic*
0
$60k $90k$30k $120k+
Median Household Income
$27,000
US Median $51,000
0
0
$300k$100k $200k $400k+
Median Net Worth
$14,000
US Median $71,000
$30,000
$20,000
$10,000
0 160,000 200,000
Med
ian
Ear
ning
s
Workers (Age 16+)120,00080,00040,000
Construction andExtraction
Transportationand Material Moving
Building and Grounds Cleaningand Maintenance
Office andAdministrative Support
Sales and Related
3500 50 100 150 200 250 300
Housing
Food
Apparel & Services
Transportation
Health Care
Entertainment &Recreation
Education
Pensions &Social Security
Other
56
36
56
51
53
46
52
50
54
TAPESTRYSEGMENTATION
TM
esri.com/tapestry
LifeMode Group: Ethnic Enclaves
Southwestern Families
INCOME AND NET WORTHNet worth measures total household assets (homes, vehicles, investments, etc.) less any debts, secured (e.g., mortgages)or unsecured (credit cards). Household income andnet worth are estimated by Esri.
AGE BY SEX (Esri data)
Median Age: 33.8 US: 37.6| Indicates US
RACE AND ETHNICITY (Esri data)
The Diversity Index summarizes racial and ethnic diversity. The index shows the likelihood that two persons, chosen at random from the same area, belong to different race or ethnic groups. The index ranges from 0 (no diversity) to 100 (complete diversity).
Diversity Index: 65.0 US: 62.1
7F
OCCUPATION BY EARNINGSThe fi ve occupations with the highest number of workers in the market are displayedby median earnings. Data from the Census Bureau’s American Community Survey.
AVERAGE HOUSEHOLD BUDGET INDEXThe index compares the average amount spent in this market’s household budgets for housing, food, apparel, etc., to the average amount spent by all US households. An indexof 100 is average. An index of 120 shows that average spending by consumers in this marketis 20 percent above the national average. Consumer expenditures are estimated by Esri.

10
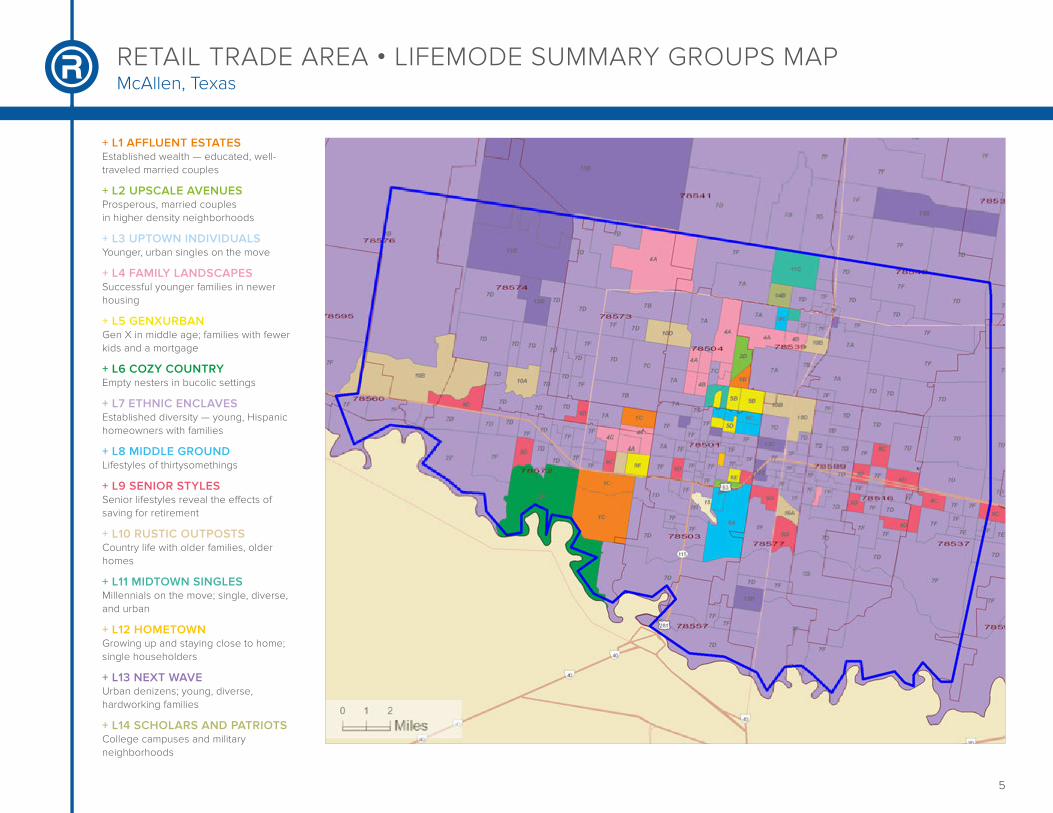
Family is central within these diverse communities.Hispanics make up more than 70% of the residents.More than one in four are foreign born, bringing rich cultural traditions to these neighborhoods in the urbanoutskirts. Dominating this market are younger families with children or single-parent households with multiple generations living under the same roof. These households balance their budgets carefully but also indulge in the latest trends and purchase with an eye to brands. Most workers are employed in skilled positions across the manufacturing, construction, or retail trade sectors.
US Household // 1,243,000Average Household Size // 3.59Median Age // 28.3Median Household Income // $36,000
LifeMode Group • Ethnic Enclaves
BARRIOS URBANOS7D

11
+ MARKET PROFILE(Consumer preferences are estimated from data by GfK MRI)
• Residents shop at discount department stores for baby and children’s products.
• Many households subscribe to satellite television to watch their favorite Hispanic programs.
• Magazines are extremely popular sources of news and the latest trends, including baby, bridal, and parenthood types of magazines.
• Typical of this diverse segment, Hispanic programming dominates the radio dials.
+ SOCIOECONOMIC TRAITS• While a majority finished high school, over 40% have not(Index 303).
• Unemployment is higher at 12% (Index 135); labor force participationis slightly lower at 61%.
• Nearly one in four households is below the poverty level(Index 179).
• Residents balance their budgets carefully by spending only on necessities and limiting activities like dining out.
• Many have no financial investments or retirement savings, but they have their homes.
+ HOUSINGMedian home value is displayed for markets that are primarilyowner occupied; average rent is shown for renter-occupied markets.Tenure and home value are estimated by Esri. Housing type and average rent are from the Census Bureau’s American Community Survey.
Typical Housing:Single FamilyMedian Value:$92,000US Median $177,000
7D
BA
RR
IOS
UR
BA
NO
S Li
feM
ode
Gro
up •
Eth
nic
Encl
aves
+ OUR NEIGHBORHOOD• Family market; over a third of all households are married couples with children, with a number of multigenerational households and single-parent families; household size is higher at 3.59.• While most residents live in single-family homes, almost 10% of householders reside in mobile home parks.• Homes are owner occupied, with slightly higher monthly costs (Index 106) but fewer mortgages (Index 89).• Most are older homes, more than 60% built from 1950 to 1989.• Most households have one or two vehicles; many commuters car pool or walk to work (Index 152).• Barrios Urbanos residents live within the urban periphery of larger metropolitan areas across the South and West.
12
BARRIOS URBANOS LifeMode Group • Ethnic Enclaves7D
Male Female8% 4% 0 4% 8%
85+80–8475–7970–7465–6960–6455–5950–5445–4940–4435–3930–3425–2920–2415–1910–14
5–9< 5
* Hispanic can be of any race. US Average
57.0%
7.8%
28.2%
3.6%
71.7%
1.3%
2.2%
80%60%40%20%0
White
Black
AmericanIndian
Asian andPac. Island
Other
Multiple
Hispanic*
0
$60k $90k$30k $120k+
Median Household Income
$36,000
US Median $51,000
0
0
$300k$100k $200k $400k+
Median Net Worth
$22,000
US Median $71,000
$30,000
$20,000
$10,000
0 100,000 200,000 300,000
Med
ian
Ear
ning
s
Workers (Age 16+)
Constructionand Extraction
Transportationand Material Moving
Office and AdministrativeSupport
ProductionSales and Related
3500 50 100 150 200 250 300
Housing
Food
Apparel & Services
Transportation
Health Care
Entertainment &Recreation
Education
Pensions &Social Security
Other
66
43
66
59
63
56
63
60
65
TAPESTRYSEGMENTATION
TM
esri.com/tapestry
LifeMode Group: Ethnic Enclaves
Barrios Urbanos
INCOME AND NET WORTHNet worth measures total household assets (homes, vehicles, investments, etc.) less any debts, secured (e.g., mortgages)or unsecured (credit cards). Household income andnet worth are estimated by Esri.
AGE BY SEX (Esri data)
Median Age: 28.3 US: 37.6| Indicates US
RACE AND ETHNICITY (Esri data)
The Diversity Index summarizes racial and ethnic diversity. The index shows the likelihood that two persons, chosen at random from the same area, belong to different race or ethnic groups. The index ranges from 0 (no diversity) to 100 (complete diversity).
Diversity Index: 80.3 US: 62.1
7D
OCCUPATION BY EARNINGSThe fi ve occupations with the highest number of workers in the market are displayedby median earnings. Data from the Census Bureau’s American Community Survey.
AVERAGE HOUSEHOLD BUDGET INDEXThe index compares the average amount spent in this market’s household budgets for housing, food, apparel, etc., to the average amount spent by all US households. An indexof 100 is average. An index of 120 shows that average spending by consumers in this marketis 20 percent above the national average. Consumer expenditures are estimated by Esri.

13
Up and Coming Families is a market in transition—residents are younger and more mobile and ethnically diverse than the previous generation.They are ambitious, working hard to get ahead, and willing to take some risks to achieve their goals.The recession has impacted their financial well-being, but they are optimistic. Their homes are new; their families are young. And this is one of the fastest-growing markets in the country.
US Household // 2,562,000Average Household Size // 3.10Median Age // 30.7Median Household Income // $64,000
LifeMode Group • Ethnic Enclaves
UP AND COMING FAMILIES7A

14
+ MARKET PROFILE(Consumer preferences are estimated from data by GfK MRI)
• Rely on the Internet for entertainment, information, shopping, and banking.
• Prefer imported SUVs or compact cars, late models.
• Carry debt from credit card balances to student loans and mortgages, but also maintain retirement plans and make charitable contributions.
• Busy with work and family; use home and landscaping services to save time.
• Find leisure in family activities, movies at home, trips to theme parks or the zoo, and sports, from backpacking and baseball to weight lifting and yoga.
+ SOCIOECONOMIC TRAITS• Education: 66% have some college education or degree(s).
• Hard-working labor force with a participation rate of 71% (Index 114)and low unemployment at 7% (Index 81).
• Most households (63%) have 2 or more workers.
• Careful shoppers, aware of prices, willing to shop around for the best deals and open to influence by others’ opinions.
• Seek the latest and best in technology.
• Young families still feathering the nest and establishing their style.
+ HOUSINGMedian home value is displayed for markets that are primarilyowner occupied; average rent is shown for renter-occupied markets.Tenure and home value are estimated by Esri. Housing type and average rent are from the Census Bureau’s American Community Survey.
Typical Housing:Single FamilyMedian Value:$174,000US Median: $177,000
7A
UP
AN
D C
OM
ING
FA
MIL
IES
Life
Mod
e G
roup
• E
thni
c En
clav
es+ OUR NEIGHBORHOOD• New suburban periphery: new families in new housing subdivisions.
• Building began in the housing boom of the 2000s and continues in this fast-growing market.
• Single-family homes with a median value of $174,000 and a lower vacancy rate.
• The price of affordable housing: longer commute times (Index 116).

15
UP AND COMING FAMILIES LifeMode Group • Ethnic Enclaves7A
Male Female8% 4% 0 4% 8%
85+80–8475–7970–7465–6960–6455–5950–5445–4940–4435–3930–3425–2920–2415–1910–14
5–9< 5
* Hispanic can be of any race. US Average
65.4%
14.8%
8.7%
4.2%
26.7%
0.7%
6.2%
80%60%40%20%0
White
Black
AmericanIndian
Asian andPac. Island
Other
Multiple
Hispanic*
0
$60k $90k$30k $120k+
Median Household Income
$64,000
US Median $51,000
0
0
$300k$100k $200k $400k+
Median Net Worth
$96,000
US Median $71,000
$80,000
$60,000
$40,000
$20,000
100,0000 300,000 500,000 700,000
Med
ian
Ear
ning
s
Workers (Age 16+)
Education, Training,and Library
Transportationand Material Moving
Office and AdministrativeSupport
Management
Sales and Related
3500 50 100 150 200 250 300
Housing
Food
Apparel & Services
Transportation
Health Care
Entertainment &Recreation
Education
Pensions &Social Security
Other
106
72
109
101
111
99
115
104
108
TAPESTRYSEGMENTATION
TM
esri.com/tapestry
LifeMode Group: Ethnic Enclaves
Up and Coming Families
INCOME AND NET WORTHNet worth measures total household assets (homes, vehicles, investments, etc.) less any debts, secured (e.g., mortgages)or unsecured (credit cards). Household income andnet worth are estimated by Esri.
AGE BY SEX (Esri data)
Median Age: 30.7 US: 37.6| Indicates US
RACE AND ETHNICITY (Esri data)
The Diversity Index summarizes racial and ethnic diversity. The index shows the likelihood that two persons, chosen at random from the same area, belong to different race or ethnic groups. The index ranges from 0 (no diversity) to 100 (complete diversity).
Diversity Index: 72.4 US: 62.1
7A
OCCUPATION BY EARNINGSThe fi ve occupations with the highest number of workers in the market are displayedby median earnings. Data from the Census Bureau’s American Community Survey.
AVERAGE HOUSEHOLD BUDGET INDEXThe index compares the average amount spent in this market’s household budgets for housing, food, apparel, etc., to the average amount spent by all US households. An indexof 100 is average. An index of 120 shows that average spending by consumers in this marketis 20 percent above the national average. Consumer expenditures are estimated by Esri.

16
Senior Escapes neighborhoods are heavily concentrated in the warmer states of Florida, California, and Arizona.These areas are highly seasonal, yet owner occupied. Many homes began as seasonal getaways and now serve as primary residences. Forty percent are mobile homes; half are single-family dwellings. About half are in unincorporated and more rural areas. Over a quarter of the population are 65–74 years old. Most are white and fairly conservative in their political and religious views. Residents enjoy watching TV, going on cruises, playing Bingo, golfing, boating, and fishing. They are very conscious of their health and buyspecialty foods and dietary supplements.
US Household // 1,088,000Average Household Size // 2.19Median Age // 52.6Median Household Income // $35,000
LifeMode Group • Senior Styles
SENIOR ESCAPES9D

17
+ MARKET PROFILE(Consumer preferences are estimated from data by GfK MRI)
• Stock up on good deals, especially high-fiber, low-calorie, low-fat, and sugar-free foods.
• Own 3+ TVs and watch news, sports, CMT, Golf Channel, and AMC.
• Belong to veterans’ clubs; maintain AARP and AAA memberships.
• Get most information from TV and the Sunday newspaper;struggle with computers and the Internet.
• Travel in the US via guided tours but weary of security issues.
• Frequently dine out at Denny’s, Golden Corral, and Cracker Barrel.
+ SOCIOECONOMIC TRAITS• Labor force participation is low, but more than half the households are drawing Social Security income.
• They have conservative political views.
• They spend majority of their time with spouse/significant other or alone.
• They are limited by medical conditions but still enjoy gardening and working on their vehicles.
• They take good care of vehicles, but haven’t bought a new one in over five years.
• They only spend within their means, do their banking in person, and do not carry a balance on their credit card.
+ HOUSINGMedian home value is displayed for markets that are primarilyowner occupied; average rent is shown for renter-occupied markets Tenure and home value are estimated by Esri. Housing type and average rent are from the Census Bureau’s American Community Survey.
Typical Housing:Single Family;Mobile Homes/SeasonalMedian Value:$110,000US Median: $177,000
9D
SEN
IOR
ESC
APE
S Li
feM
ode
Gro
up •
Sen
ior S
tyle
s+ OUR NEIGHBORHOOD• Neighborhoods include primary and second homes in rural or semirural settings.
• One quarter of all housing units are vacant; many are for seasonal use only.
• One-third of the households are married couples without children; a third are single-person households.
• Half the homes are single family; another 40% are mobile homes.
• Three-quarters of all homes are owner occupied, and the majority own their homes free and clear.
• Still actively driving, most households have one or two vehicles.

18
SENIOR ESCAPES LifeMode Group • Senior Styles9D
Male Female8% 4% 0 4% 8%
85+80–8475–7970–7465–6960–6455–5950–5445–4940–4435–3930–3425–2920–2415–1910–14
5–9< 5
* Hispanic can be of any race. US Average
86.1%
4.4%
4.2%
2.6%
13.0%
1.3%
1.4%
80%60%40%20%0
White
Black
AmericanIndian
Asian andPac. Island
Other
Multiple
Hispanic*
0
$60k $90k$30k $120k+
Median Household Income
$35,000
US Median $51,000
0
0
$300k$100k $200k $400k+
Median Net Worth
$84,000
US Median $71,000
$60,000
$40,000
$20,000
0 140,000
Med
ian
Ear
ning
s
Workers (Age 16+)60,00020,000 100,000
Sales and Related
Constructionand Extraction
Office andAdministrative Support
Management
Food Preparationand Serving Related
3500 50 100 150 200 250 300
Housing
Food
Apparel & Services
Transportation
Health Care
Entertainment &Recreation
Education
Pensions &Social Security
Other
67
40
68
78
70
50
61
69
64
TAPESTRYSEGMENTATION
TM
esri.com/tapestry
LifeMode Group: Senior Styles
Senior Escapes
INCOME AND NET WORTHNet worth measures total household assets (homes, vehicles, investments, etc.) less any debts, secured (e.g., mortgages)or unsecured (credit cards). Household income andnet worth are estimated by Esri.
AGE BY SEX (Esri data)
Median Age: 52.6 US: 37.6| Indicates US
RACE AND ETHNICITY (Esri data)
The Diversity Index summarizes racial and ethnic diversity. The index shows the likelihood that two persons, chosen at random from the same area, belong to different race or ethnic groups. The index ranges from 0 (no diversity) to 100 (complete diversity).
Diversity Index: 42.5 US: 62.1
9D
OCCUPATION BY EARNINGSThe fi ve occupations with the highest number of workers in the market are displayedby median earnings. Data from the Census Bureau’s American Community Survey.
AVERAGE HOUSEHOLD BUDGET INDEXThe index compares the average amount spent in this market’s household budgets for housing, food, apparel, etc., to the average amount spent by all US households. An indexof 100 is average. An index of 120 shows that average spending by consumers in this marketis 20 percent above the national average. Consumer expenditures are estimated by Esri.

19
Soccer Moms is an affluent, family-oriented market with a country flavor.Residents are partial to new housing away from the bustle of the city but close enough to commute to professional job centers. Life in this suburban wilderness offsets the hectic pace of two working parentswith growing children. They favor time-saving devices, like banking online or housekeeping services, andfamily-oriented pursuits.
US Household // 3,327,000Average Household Size // 2.96Median Age // 36.6Median Household Income // $84,000
LifeMode Group • Family Landscapes
SOCCER MOMS4A

20
+ MARKET PROFILE(Consumer preferences are estimated from data by GfK MRI)
• Most households own at least 2 vehicles; the most popular types are minivans and SUVs.
• Family-oriented purchases and activities dominate, like 4+ televisions (Index 165), movie purchases or rentals, children’s apparel and toys, and visits to theme parks or zoos.
• Outdoor activities and sports are characteristic of life in the suburban periphery, like bicycling, jogging, golfing, boating, and target shooting.
• Home maintenance services are frequently contracted, but these families also like their gardens and own the tools for minor upkeep, like riding mowers and tillers.
+ SOCIOECONOMIC TRAITS• Education: 37.7% college graduates; more than 70% with some college education.
• Low unemployment at 5.9%; high labor force participation rate at 72%; 2 out of 3 households include 2+ workers (Index 124).
• Connected, with a host of wireless devices from iPods to tablets—anything that enables convenience, like banking, paying bills, or even shopping online.
• Well insured and invested in a range of funds, from savings accounts or bonds to stocks.
• Carry a higher level of debt, including first (Index 159) and second mortgages (Index 154) and auto loans (Index 151).
+ HOUSINGMedian home value is displayed for markets that are primarilyowner occupied; average rent is shown for renter-occupied markets.Tenure and home value are estimated by Esri. Housing type and average rent are from the Census Bureau’s American Community Survey.
Typical Housing:Single FamilyMedian Value:$226,000US Median: $177,000
4A
SOC
CER
MO
MS
Life
Mod
e G
roup
• F
amily
Lan
dsca
pes
+ OUR NEIGHBORHOOD• Soccer Moms residents prefer the suburban periphery of metropolitan areas.
• Predominantly single family, homes are in newer neighborhoods, 36% built in the 1990s (Index 253), 31% built since 2000.
• Owner-occupied homes have high rate of mortgages at 74% (Index 163), and low rate vacancy at 5%.
• Median home value is $226,000.
• Most households are married couples with children; average household size is 2.96.
• Most households have 2 or 3 vehicles; long travel time to work including a disproportionate number commuting from a different county (Index 133).

21
SOCCER MOMS LifeMode Group • Family Landscapes4A
85+80–8475–7970–7465–6960–6455–5950–5445–4940–4435–3930–3425–2920–2415–1910–14
Male Female
5–9< 5
8% 4% 0 4% 8%
* Hispanic can be of any race. US Average
79.7%
8.2%
3.1%
2.9%
11.2%
0.5%
5.5%
80%60%40%20%0
White
Black
AmericanIndian
Asian andPac. Island
Other
Multiple
Hispanic*
0
$60k $90k$30k $120k+
Median Household Income
$84,000
US Median $51,000
0
0
$300k$100k $200k $400k+
Median Net Worth
$252,000
US Median $71,000
$90,000
$70,000
$50,000
$30,000
$10,000
200,0000 400,000 600,000 800,000
Med
ian
Ear
ning
s
Workers (Age 16+)
Health Care Practitionersand Technical
Education, Training,and Library
Office andAdministrative Support
Management
Sales andRelated
3500 50 100 150 200 250 300
Housing
Food
Apparel & Services
Transportation
Health Care
Entertainment &Recreation
Education
Pensions &Social Security
Other
135
92
138
136
145
137
152
137
139
TAPESTRYSEGMENTATION
TM
esri.com/tapestry
LifeMode Group: Family Landscapes
Soccer Moms
INCOME AND NET WORTHNet worth measures total household assets (homes, vehicles, investments, etc.) less any debts, secured (e.g., mortgages)or unsecured (credit cards). Household income andnet worth are estimated by Esri.
AGE BY SEX (Esri data)
Median Age: 36.6 US: 37.6| Indicates US
RACE AND ETHNICITY (Esri data)
The Diversity Index summarizes racial and ethnic diversity. The index shows the likelihood that two persons, chosen at random from the same area, belong to different race or ethnic groups. The index ranges from 0 (no diversity) to 100 (complete diversity).
Diversity Index: 48.3 US: 62.1
4A
OCCUPATION BY EARNINGSThe fi ve occupations with the highest number of workers in the market are displayedby median earnings. Data from the Census Bureau’s American Community Survey.
AVERAGE HOUSEHOLD BUDGET INDEXThe index compares the average amount spent in this market’s household budgets for housing, food, apparel, etc., to the average amount spent by all US households. An indexof 100 is average. An index of 120 shows that average spending by consumers in this marketis 20 percent above the national average. Consumer expenditures are estimated by Esri.

22
About The Retail Coach
The Retail Coach, LLC, is a national retail analytics and locational intelligence firm that specializes in all aspects of retail market analyses and recruitment, from “macro to micro” trade area assessment to actively recruiting retailers on behalf of our clients.
Through its unique Retail:360 process, The Retail Coach offers a dynamic system of products and services that better enable communities to maximize their retail development potential.
Retail:360 Process
Providing more than simple data reports of psychographic and demographic trends, The Retail Coach goes well beyond other retail consulting and market research firms’ offerings by combining current national and statewide demographics and trend data with real-world, “on-the-ground” data gathered through extensive visits within our clients’ communities.
Every community is different, and there is no “one size fits all” retail recruitment solution. Compiling the gathered data into client-tailored information packets that are uniquely designed for, and targeted to, specific retailers and restaurants who meet the community’s needs helps assure our clients that they are receiving the latest and best information for their retail recruitment efforts — all with personal service and coaching guidance that continues beyond the initial project scope and timeline.
Our Retail:360 process assures that communities get timely, accurate and relevant information. Translating that data into the information that retailers need and seek assures our clients even better possibilities for tremendous retail growth and success.
The Retail Coach -It’s not about data. It’s about your success.
The Retail Coach, LLC | P. O. Box 7272 | Tupelo, Mississippi 38802tel 800.851.0962 | fax 662.844.2738 | e-mail [email protected] | web www.theretailcoach.net
C. Kelly Cofer President & CEO
The Retail Coach, LLC

23
Acknowledgements
The observations, conclusions and recommendations contained in this study are solely those of The Retail Coach, LLC and should not be construed to represent the opinions of others, including its clients, or any other entity prior to such entity’s express approval of this study.
Sources used in completing this study include: infoUSA™, Applied Geographic Solutions, Nielsen 2014/2015, ESRI 2014, U.S. Census Bureau, Economy.com, Spatial Insights Inc., Urban Land Institute, CensusViewer.com, International Council of Shopping Centers, and/or U.S. Bureau of Labor and Statistics.
To better represent current data, where applicable, portions of estimated actual sales may be calculated using an average sales per square foot model.
Mapping data is provided by MapInfo, Nielsen, ESRI and/or Microsoft Corporation.
All information furnished is from sources deemed reliable and is submitted subject to errors, omissions, change of terms and/or conditions.


![LISTA APPLICAZIONI - Speedup€¦ · SISTEMA BREVETTATO MULTI ATTACCO PER ADATTARSI ... Spider 1.8 Tbi 05/09- 60cm** 45cm AUDI 80 AVANT [8C] 91-96 53cm 53cm 40cm 80 AVANT RS2 [8C]](https://img.dokumen.tips/doc/110x75/5ebdc5df0428716e8933ff52/lista-applicazioni-speedup-sistema-brevettato-multi-attacco-per-adattarsi-.jpg)