Embed Size (px)
DESCRIPTION
Second Attempt at Jump-Detection and Analysis Mike Schwert ECON201FS 2/13/08. My Approach This Week - PowerPoint PPT Presentation
Citation preview

Second Attempt at Jump-Detection and Analysis
Mike SchwertECON201FS
2/13/08
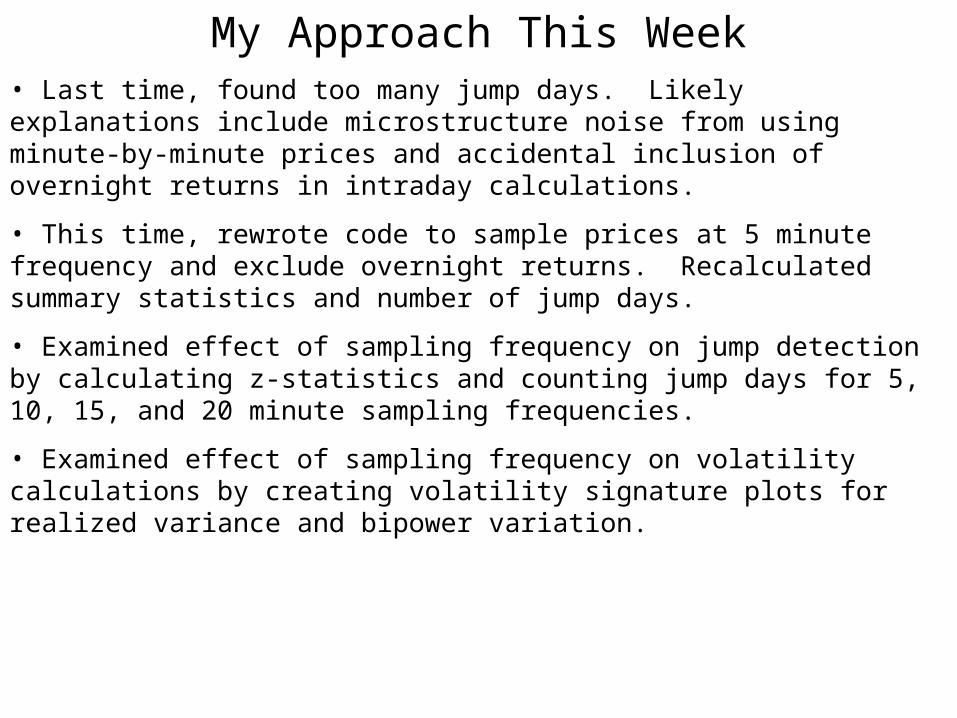
My Approach This Week• Last time, found too many jump days. Likely explanations include microstructure noise from using minute-by-minute prices and accidental inclusion of overnight returns in intraday calculations.
• This time, rewrote code to sample prices at 5 minute frequency and exclude overnight returns. Recalculated summary statistics and number of jump days.
• Examined effect of sampling frequency on jump detection by calculating z-statistics and counting jump days for 5, 10, 15, and 20 minute sampling frequencies.
• Examined effect of sampling frequency on volatility calculations by creating volatility signature plots for realized variance and bipower variation.
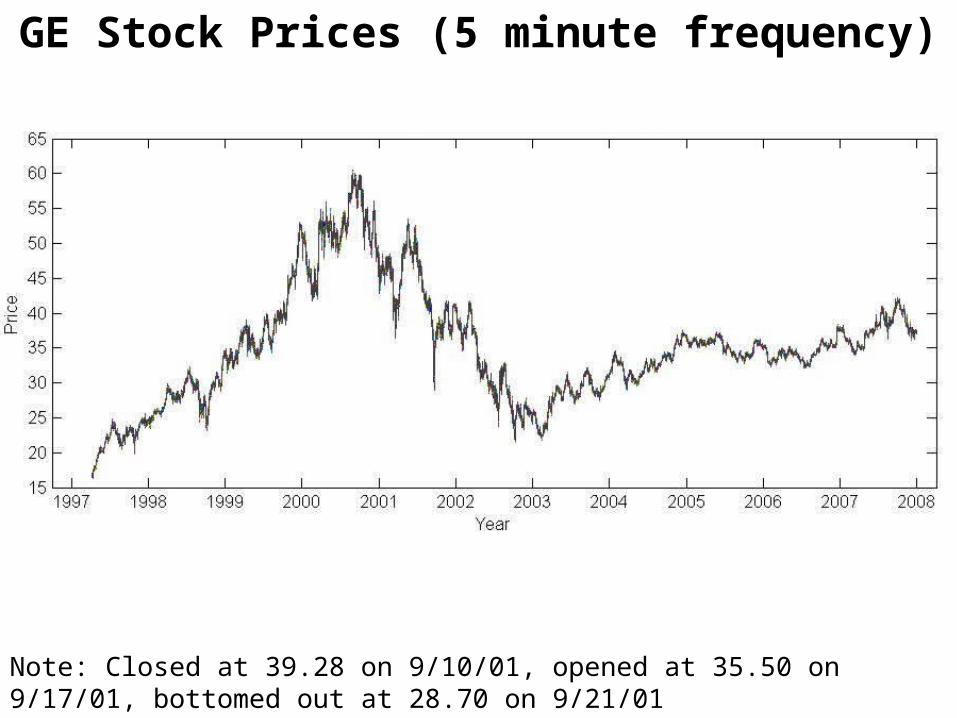
Note: Closed at 39.28 on 9/10/01, opened at 35.50 on 9/17/01, bottomed out at 28.70 on 9/21/01
GE Stock Prices (5 minute frequency)
Statistics Calculated
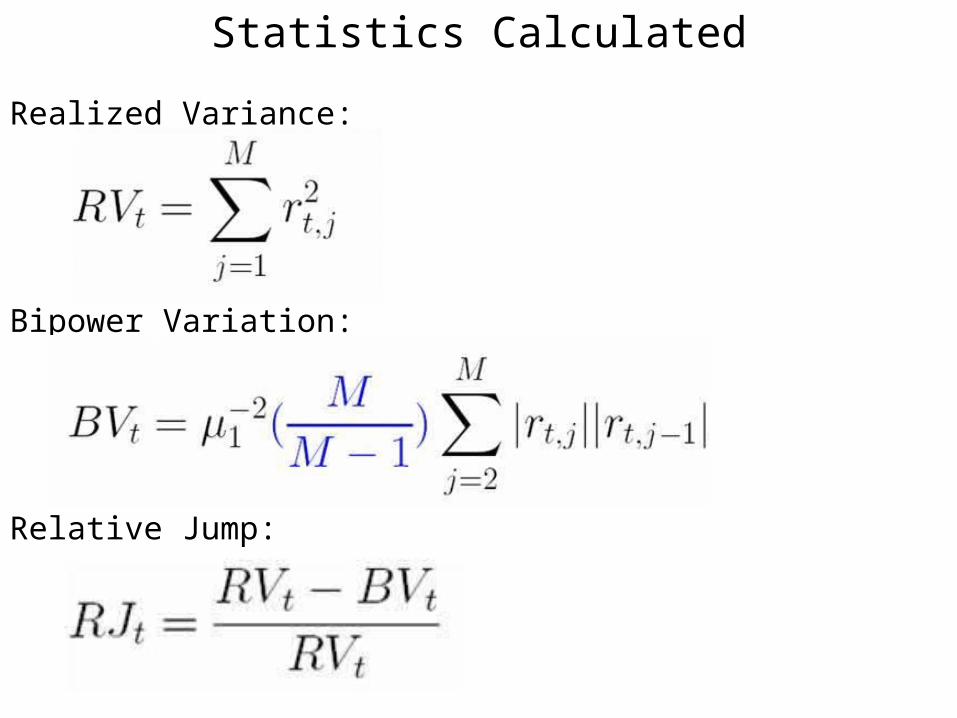
Realized Variance:
Bipower Variation:
Relative Jump:
Statistics Calculated
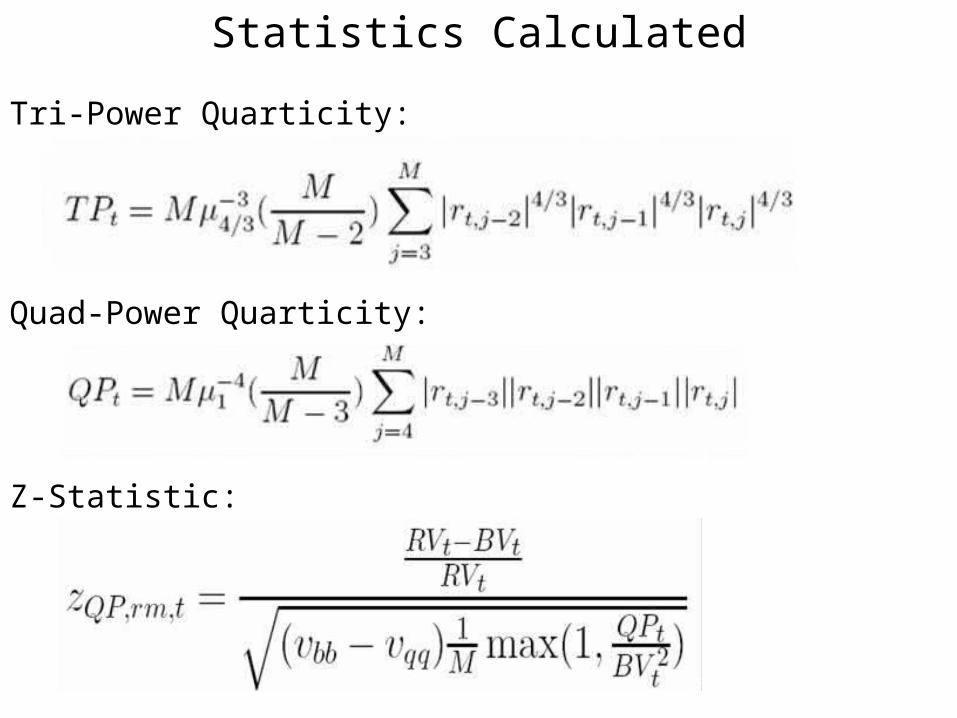
Tri-Power Quarticity:
Quad-Power Quarticity:
Z-Statistic:
Summary Statistics
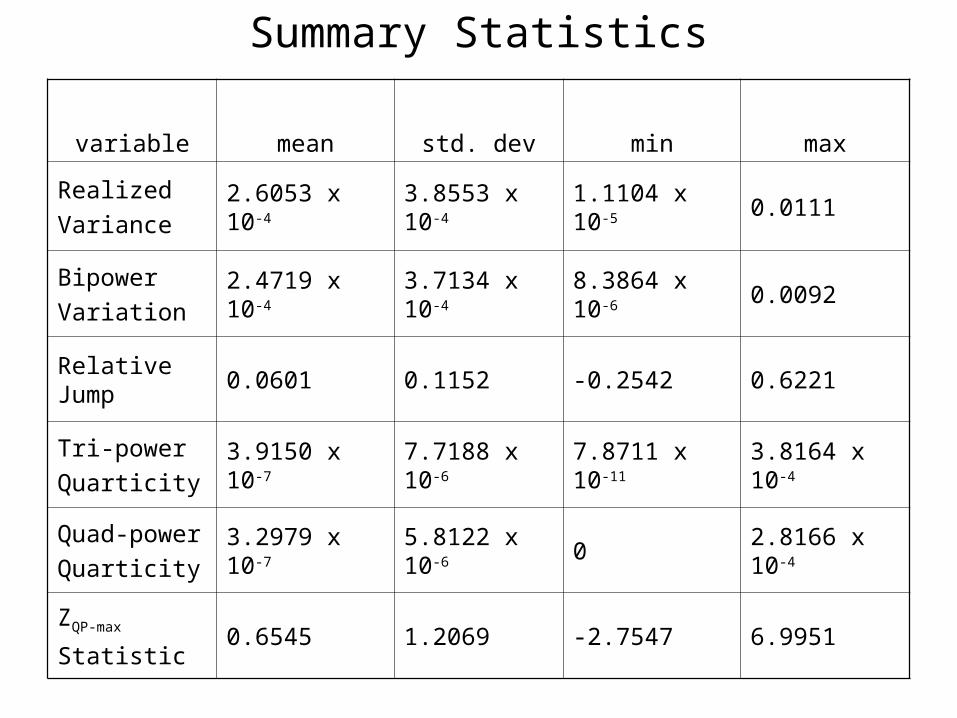
variable mean std. dev min max
Realized
Variance2.6053 x 10-4 3.8553 x 10⁻⁴ 1.1104 x 10⁻⁵ 0.0111
Bipower
Variation2.4719 x 10-4 3.7134 x 10⁻⁴ 8.3864 x 10⁻⁶ 0.0092
Relative Jump
0.0601 0.1152 -0.2542 0.6221
Tri-power
Quarticity3.9150 x 10-7 7.7188 x 10⁻⁶ 7.8711 x 10⁻¹¹ 3.8164 x 10⁻⁴
Quad-power
Quarticity3.2979 x 10-7 5.8122 x 10⁻⁶ 0 2.8166 x 10⁻⁴
ZQP-max
Statistic0.6545 1.2069 -2.7547 6.9951

ZQP-max Statistics – 5 minute sampling frequency
Number of jumps at 1% level of significance: 234 out of 2670 days (8.76%)
Number of jumps at 0.1% level of significance: 84 out of 2670 days (3.15%)
Number of jumps at 0.01% level of significance: 29 out of 2670 days (1.09%)
Note: 1% significance when Z > 2.33, 0.1% significance when Z > 3.09, 0.01% significance when Z > 3.71.

Number of jumps at 1% level of significance: 186 out of 2670 days (6.97%)
Number of jumps at 0.1% level of significance: 60 out of 2670 days (2.25%)
Number of jumps at 0.01% level of significance: 17 out of 2670 days (0.64%)
Note: 1% significance when Z > 2.33, 0.1% significance when Z > 3.09, 0.01% significance when Z > 3.71.
ZQP-max Statistics – 10 minute sampling frequency
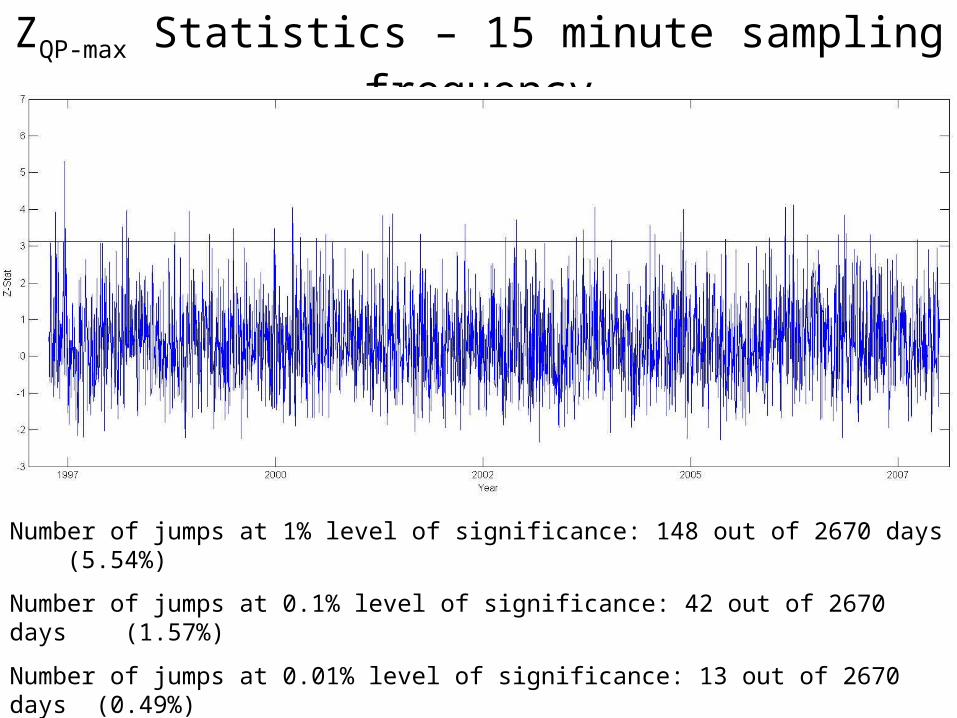
Number of jumps at 1% level of significance: 148 out of 2670 days (5.54%)
Number of jumps at 0.1% level of significance: 42 out of 2670 days (1.57%)
Number of jumps at 0.01% level of significance: 13 out of 2670 days (0.49%)
Note: 1% significance when Z > 2.33, 0.1% significance when Z > 3.09, 0.01% significance when Z > 3.71.
ZQP-max Statistics – 15 minute sampling frequency
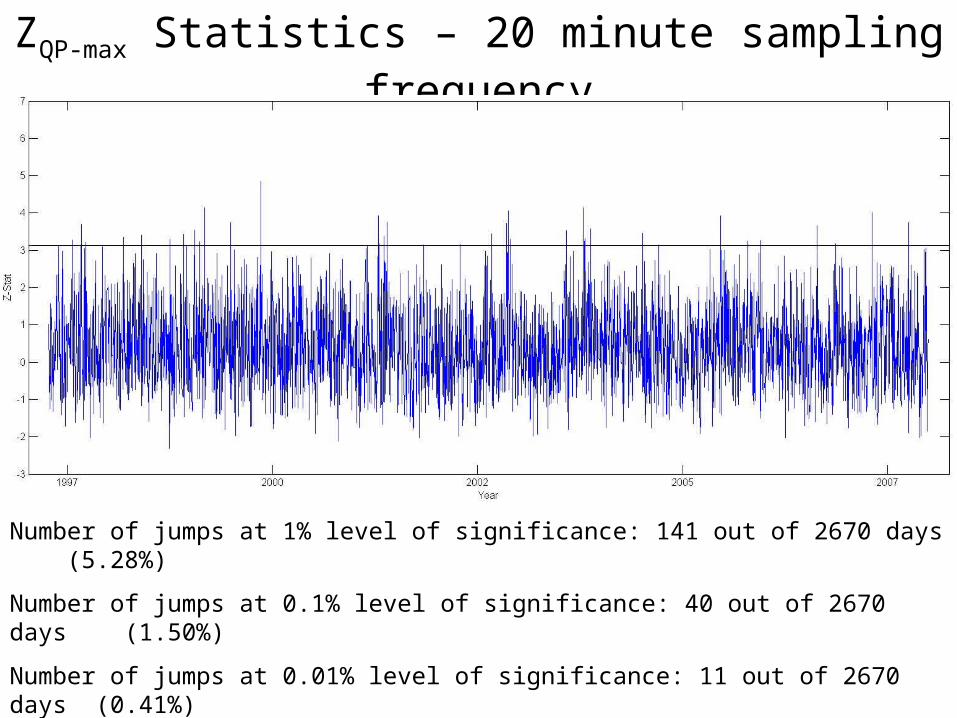
Number of jumps at 1% level of significance: 141 out of 2670 days (5.28%)
Number of jumps at 0.1% level of significance: 40 out of 2670 days (1.50%)
Number of jumps at 0.01% level of significance: 11 out of 2670 days (0.41%)
Note: 1% significance when Z > 2.33, 0.1% significance when Z > 3.09, 0.01% significance when Z > 3.71.
ZQP-max Statistics – 20 minute sampling frequency
Volatility Signature Plots• Used idea introduced by Andersen, Bollerslev, Diebold, and Labys (1999).
• Calculated mean daily realized variance and bipower variation over the sample period under sampling frequencies of 1 minute, 2 minutes, …, 30 minutes.
• Plotted mean realized variance and bipower variation on the y-axis with sampling frequency on the x-axis.
• RV and BV are higher for high-frequency samples because returns are distorted by microstructure noise such as bid-ask bounce.
• RV and BV decrease as interval between samples increases because microstructure noise is cancelled out.
• Must be wary of using too low of a sampling frequency, as sampling variation will affect volatility calculations.
• Balance between sampling variation and microstructure noise appears to be reached around 15 minute sampling frequency.
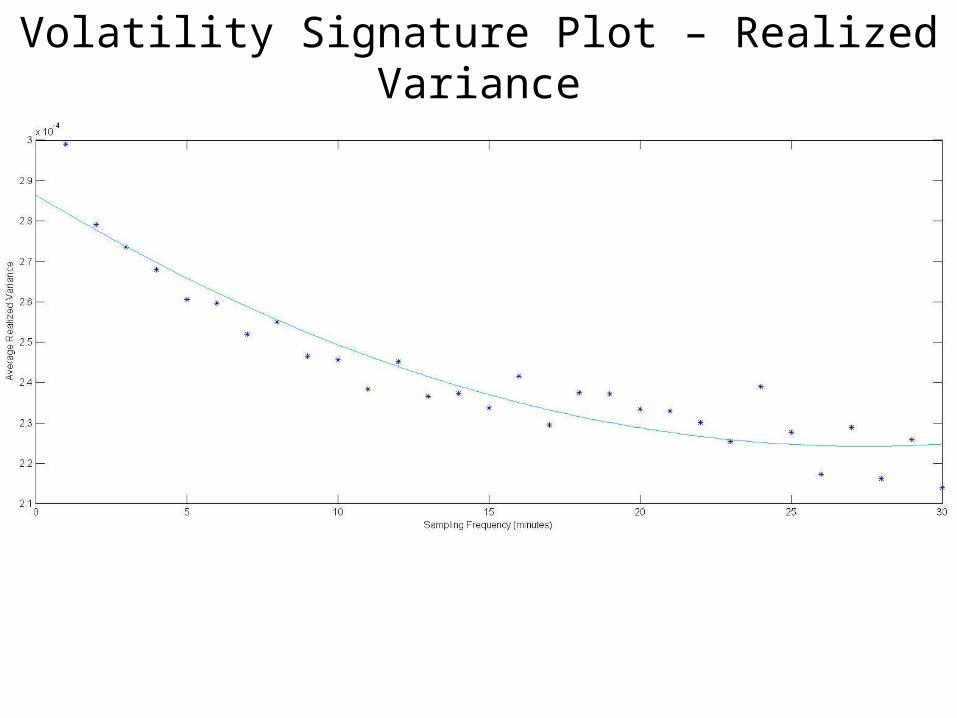
Volatility Signature Plot – Realized Variance

Volatility Signature Plot – Bipower Variation

Possible Extensions• Perform same calculations on S&P 100 index and stocks highly correlated with GE, or those with similar beta, or from a similar industry, etc.
• Check whether GE jumps on the same days as these other assets.
• Determine how much jumps are systematic vs. idiosyncratic.
• Use volatility signature plots from several stocks to determine ideal sampling frequency for jump detection, if possible.
• Incorporate ARCH, GARCH, or stochastic volatility models somehow?