Embed Size (px)
Citation preview
SeaWinds Empirical Rain Correction Using AMSR
January 17, 2005
Bryan Stiles, Svetla Hristova-Veleva, and Scott Dunbar
2
Outline
• Method Overview– Data set description– Variance computation change in objective function– Rain correction methods
• Performance Summary• Metrics
– Direction and Speed Histograms of DIRTH vectors– 2-D NCEP/Retrieved Relative Direction Histograms– Cross Track Bias (by liquid and speed)– Speed Bias (by liquid and speed)– RMS Direction Difference (by liquid and speed)
• Discussion
3
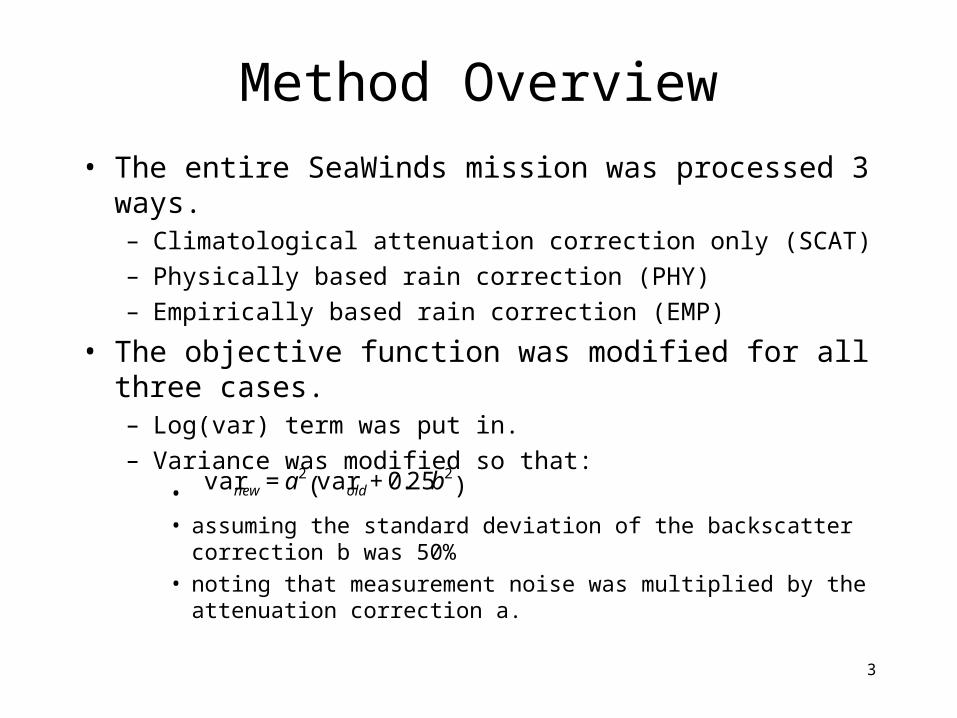
Method Overview
• The entire SeaWinds mission was processed 3 ways.– Climatological attenuation correction only (SCAT)– Physically based rain correction (PHY)– Empirically based rain correction (EMP)
• The objective function was modified for all three cases. – Log(var) term was put in.– Variance was modified so that:
•
• assuming the standard deviation of the backscatter correction b was 50%
• noting that measurement noise was multiplied by the attenuation correction a.
€
varnew = a2 varold+ 0.25b
2( )
4
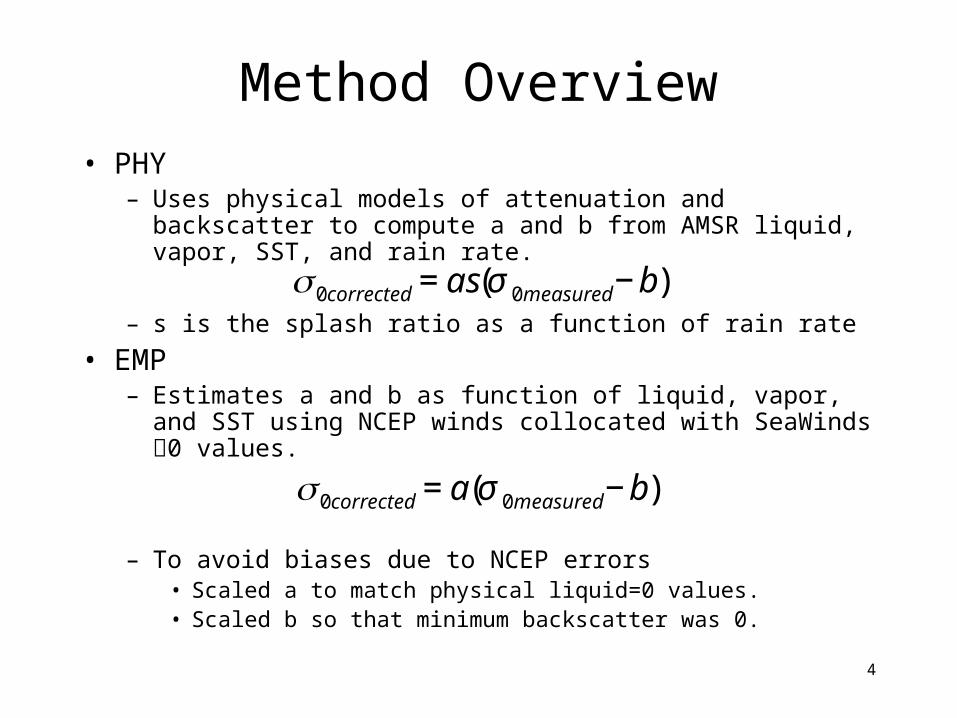
Method Overview• PHY
– Uses physical models of attenuation and backscatter to compute a and b from AMSR liquid, vapor, SST, and rain rate.
– s is the splash ratio as a function of rain rate
• EMP– Estimates a and b as function of liquid, vapor, and SST
using NCEP winds collocated with SeaWinds 0 values.
– To avoid biases due to NCEP errors• Scaled a to match physical liquid=0 values.• Scaled b so that minimum backscatter was 0.
€
σ 0corrected = as(σ 0measured −b)
€
σ 0corrected = a(σ 0measured −b)
5
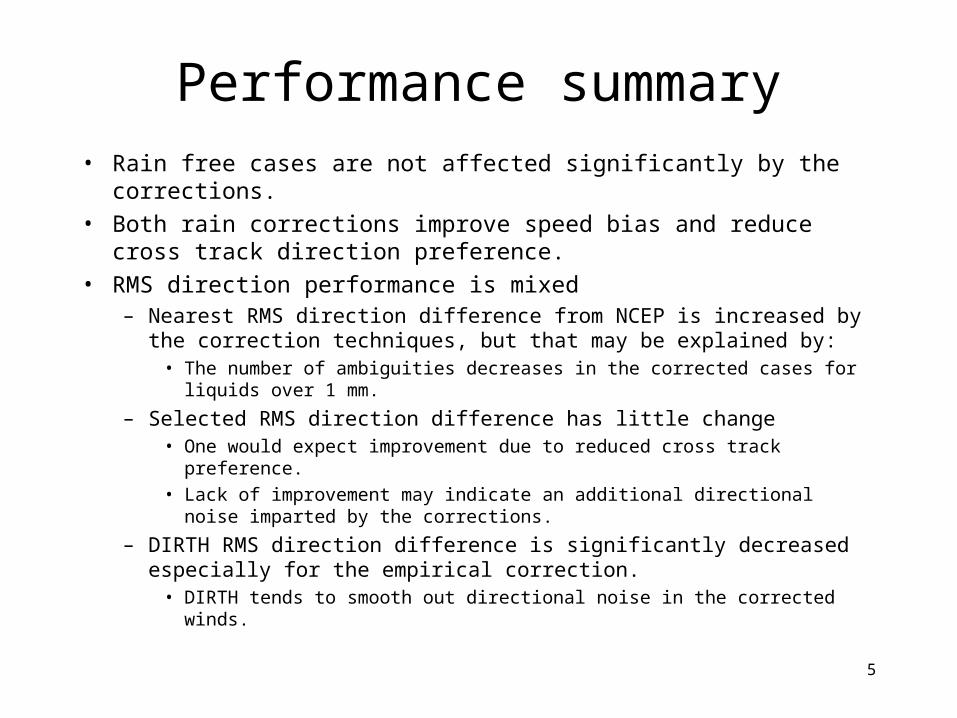
Performance summary• Rain free cases are not affected significantly by the corrections.• Both rain corrections improve speed bias and reduce cross
track direction preference.• RMS direction performance is mixed
– Nearest RMS direction difference from NCEP is increased by the correction techniques, but that may be explained by:
• The number of ambiguities decreases in the corrected cases for liquids over 1 mm.
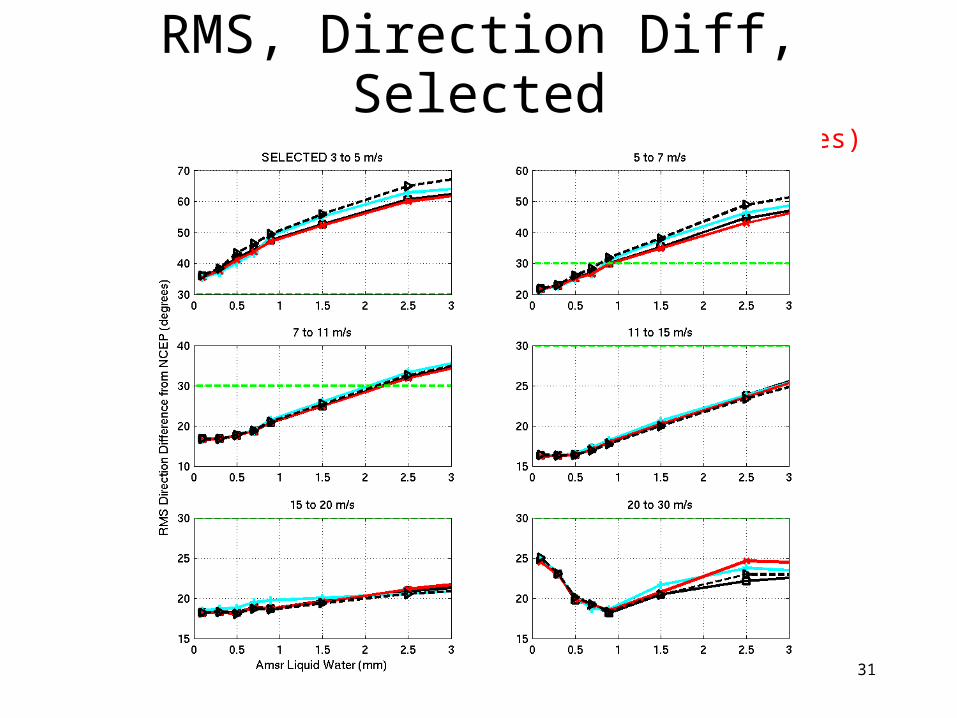
– Selected RMS direction difference has little change• One would expect improvement due to reduced cross track preference.• Lack of improvement may indicate an additional directional noise
imparted by the corrections.
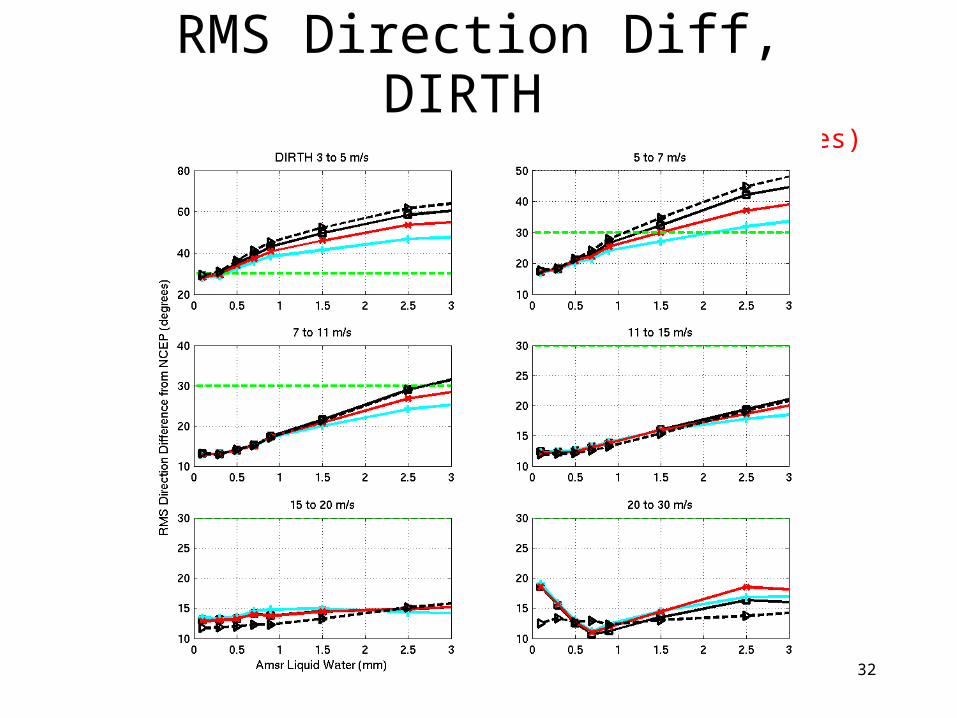
– DIRTH RMS direction difference is significantly decreased especially for the empirical correction.
• DIRTH tends to smooth out directional noise in the corrected winds.
6
Performance summary (cont)
• RMS speed performance – RMS speed differences (not shown) decrease due
to speed bias improvement– Speed variance increases; especially for the
empirical case.
7
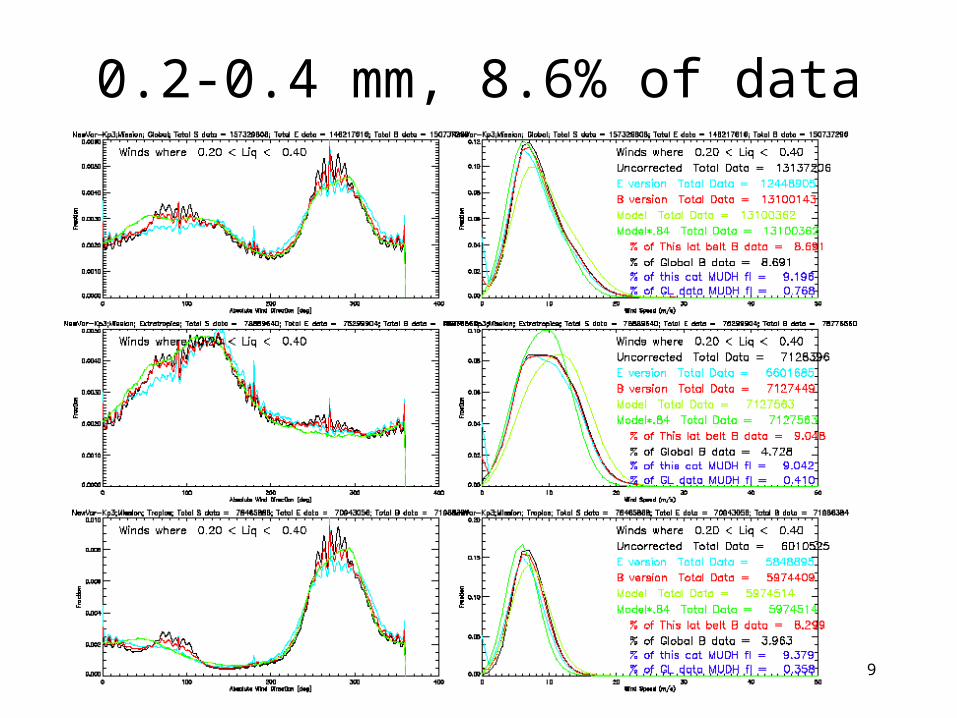
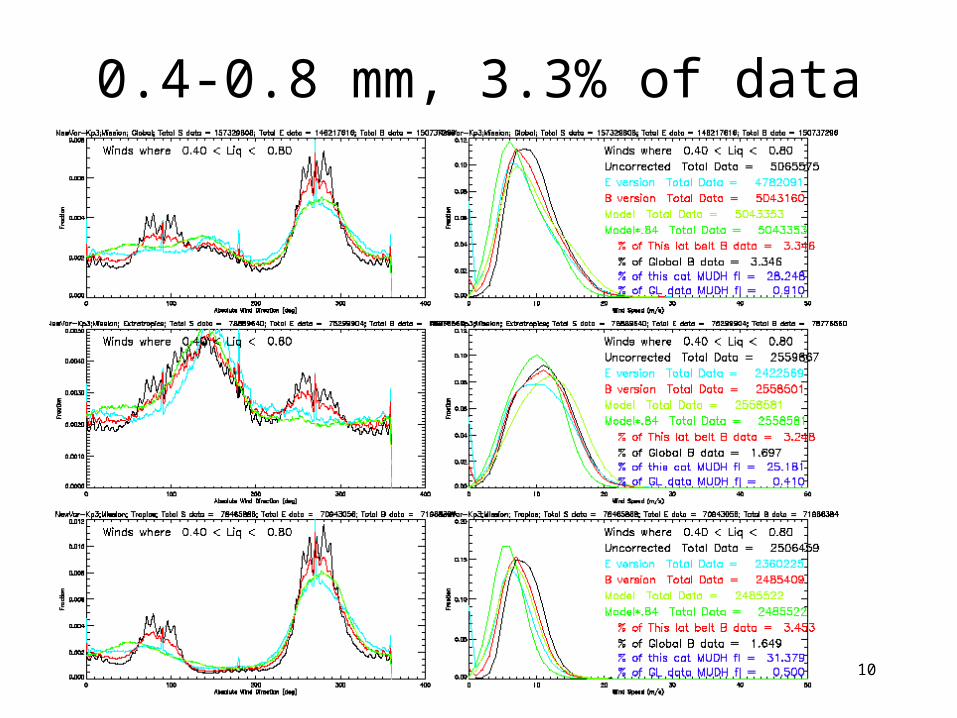
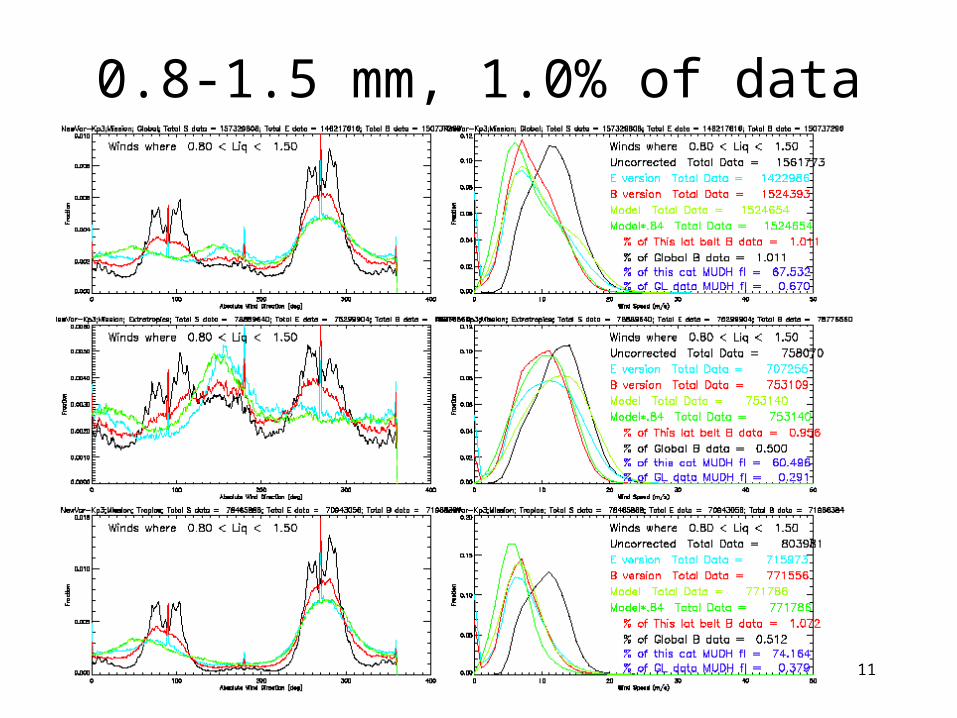
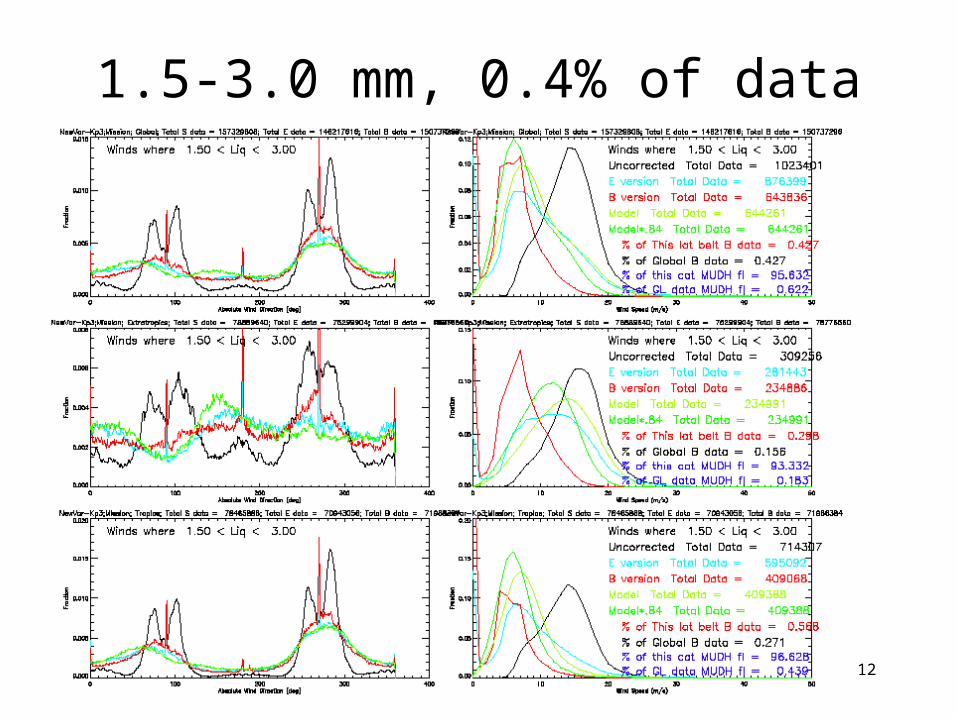
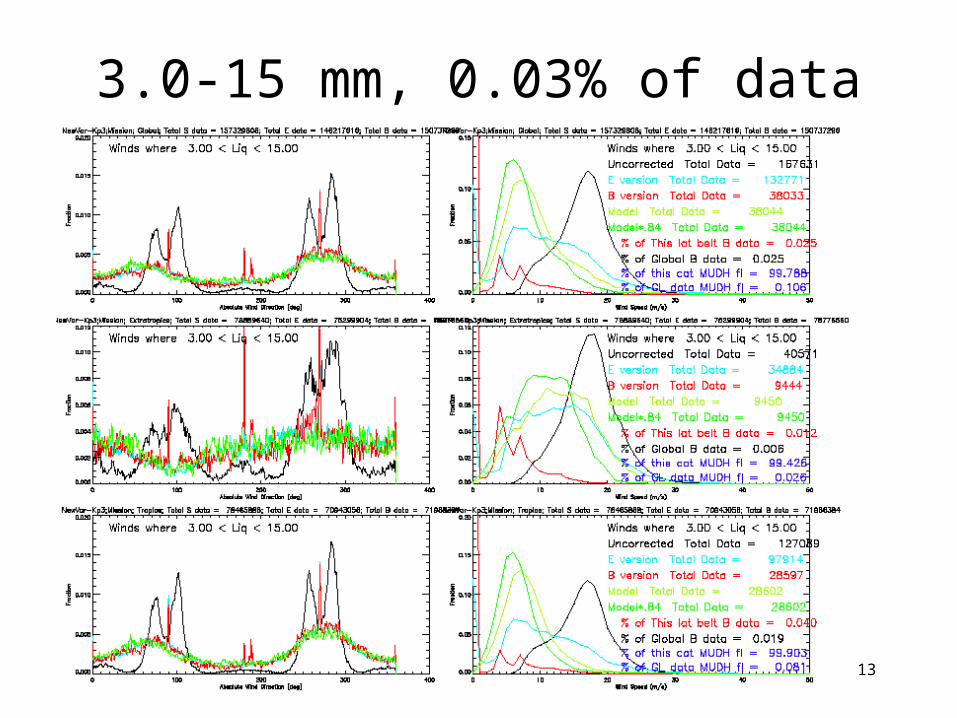
1-D Direction and Speed Histograms
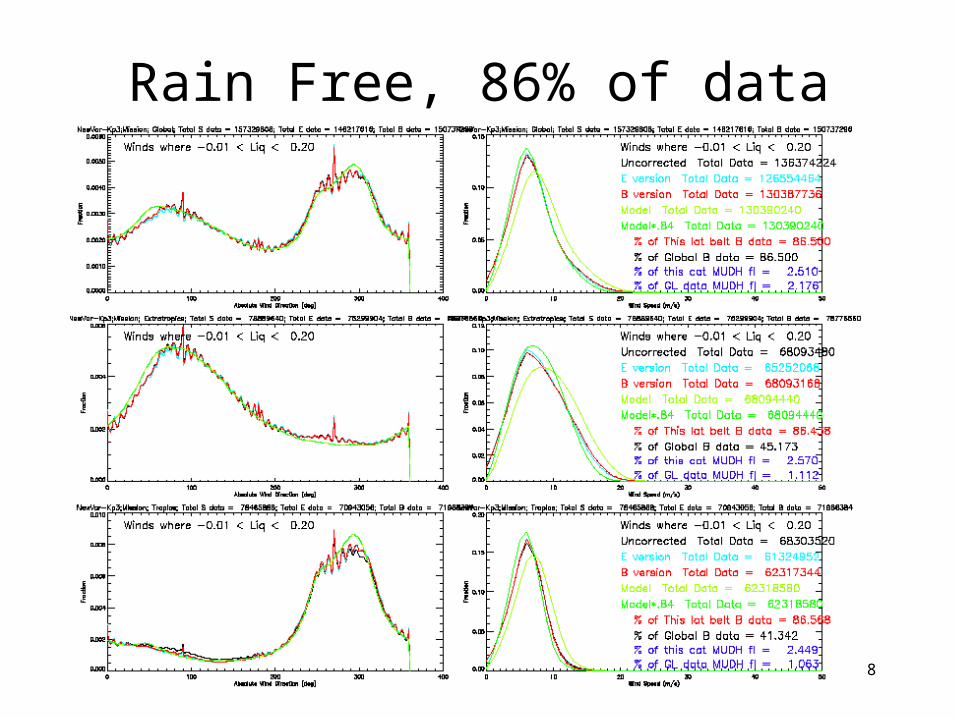
• Plot format– NCEP Histograms were plotted together with the DIRTH
vector histograms for each correction method.– Direction and Speed Histograms were computed for varying:
• Correction Strategy (line color)
• Geographic region (plot in slide)
• Liquid Range (slide)
– Percentage of Data in each liquid range is noted.
• Observations– Corrections tend to match model direction histograms better– Corrections tend to follow model wind speed trends by
geographic region– DIRTH creates cardinal direction spikes (investigating …)
8
Rain Free, 86% of data
9
0.2-0.4 mm, 8.6% of data
10
0.4-0.8 mm, 3.3% of data
11
0.8-1.5 mm, 1.0% of data
12
1.5-3.0 mm, 0.4% of data
13
3.0-15 mm, 0.03% of data
14
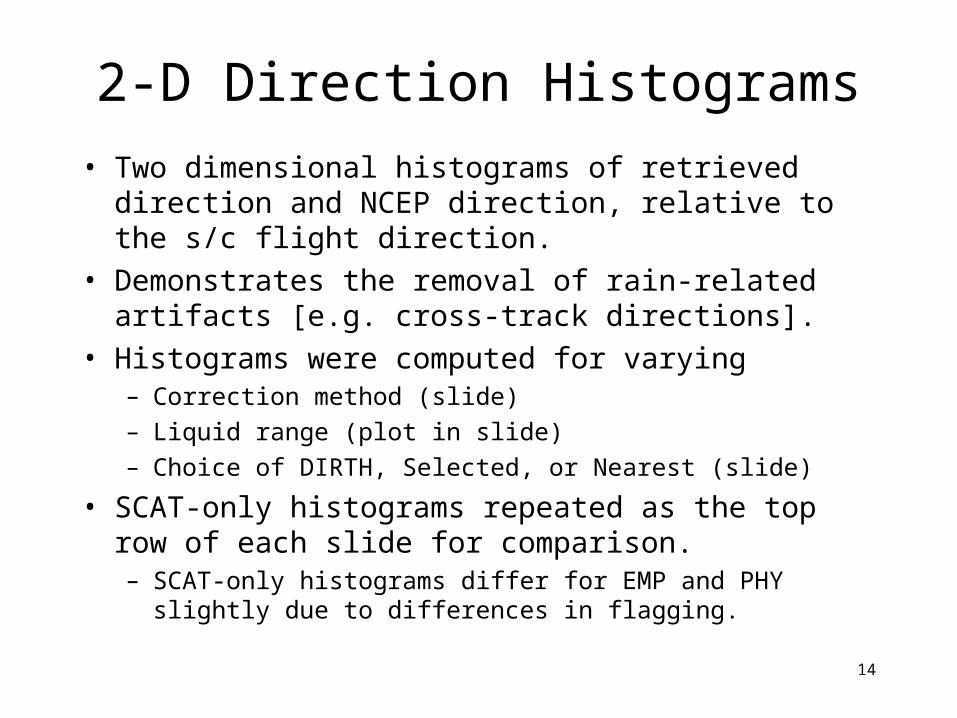
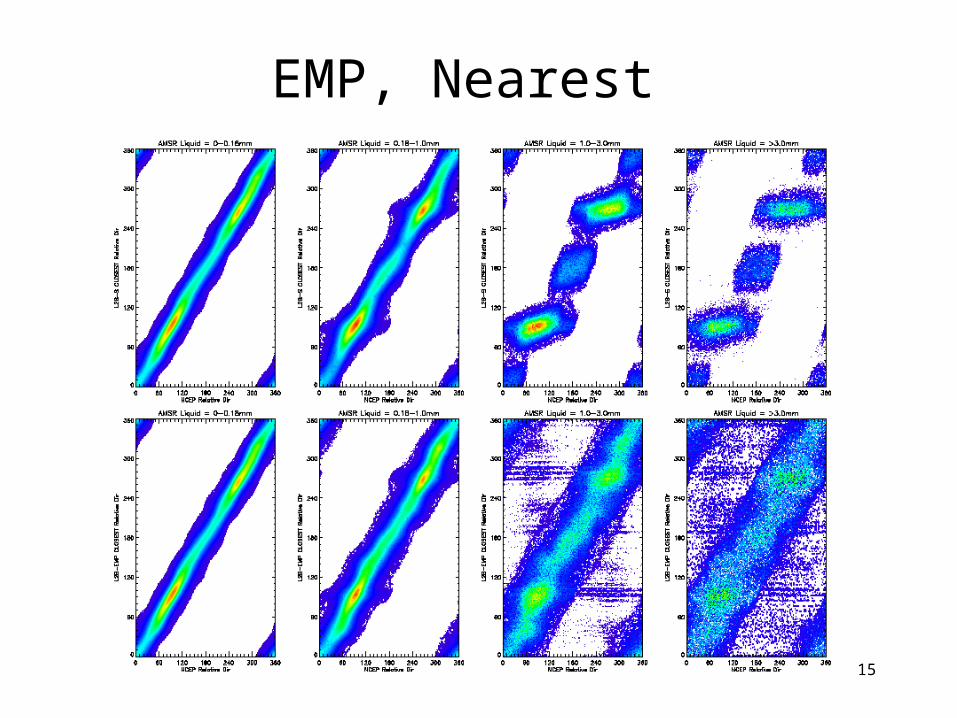
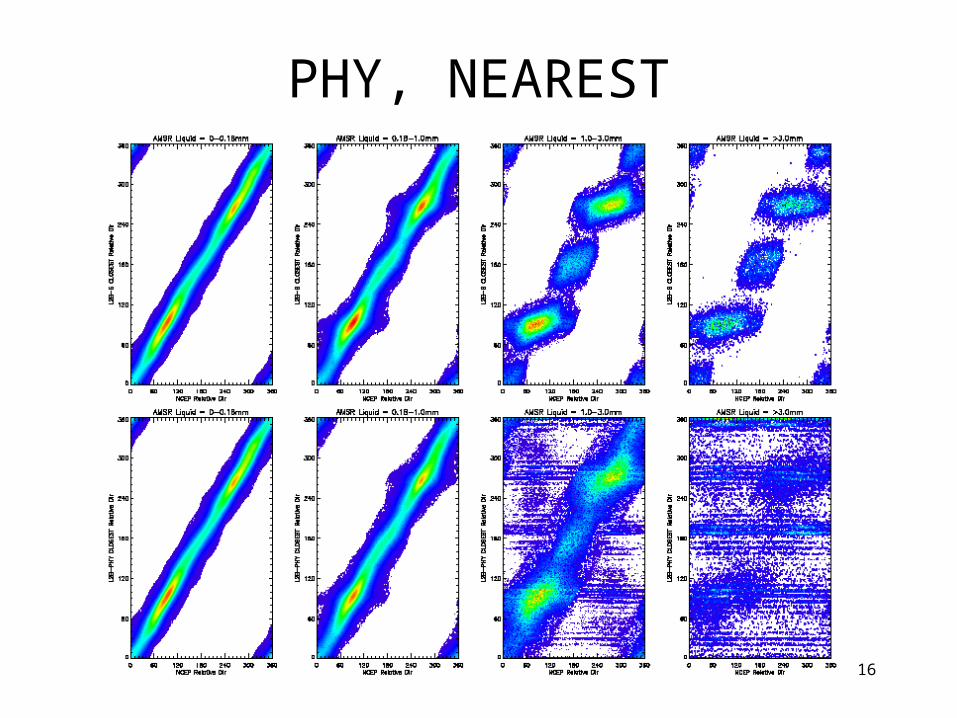
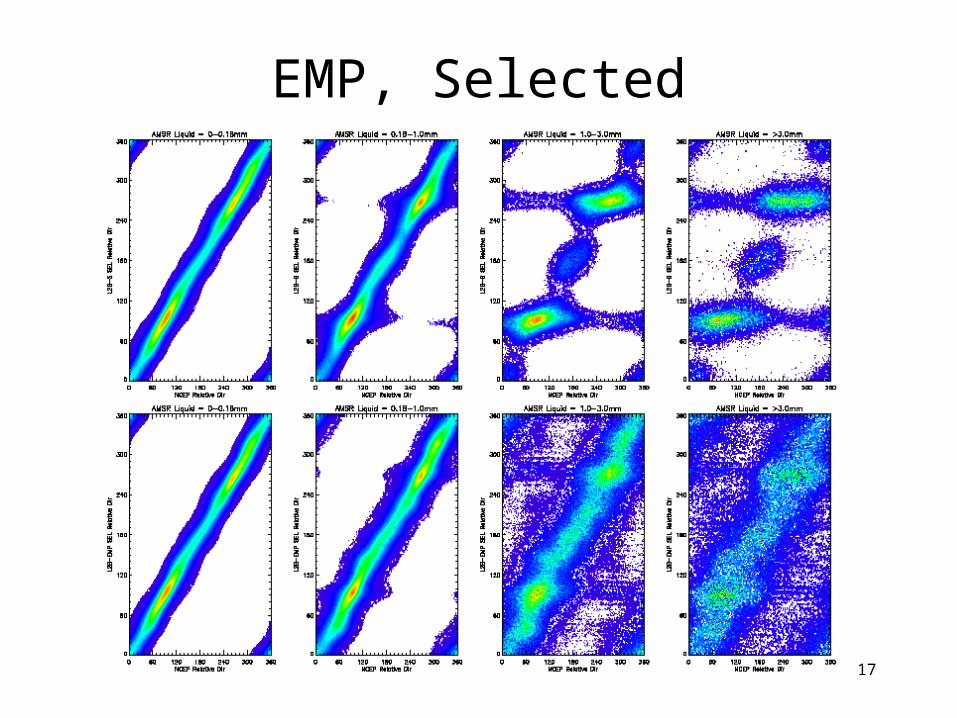
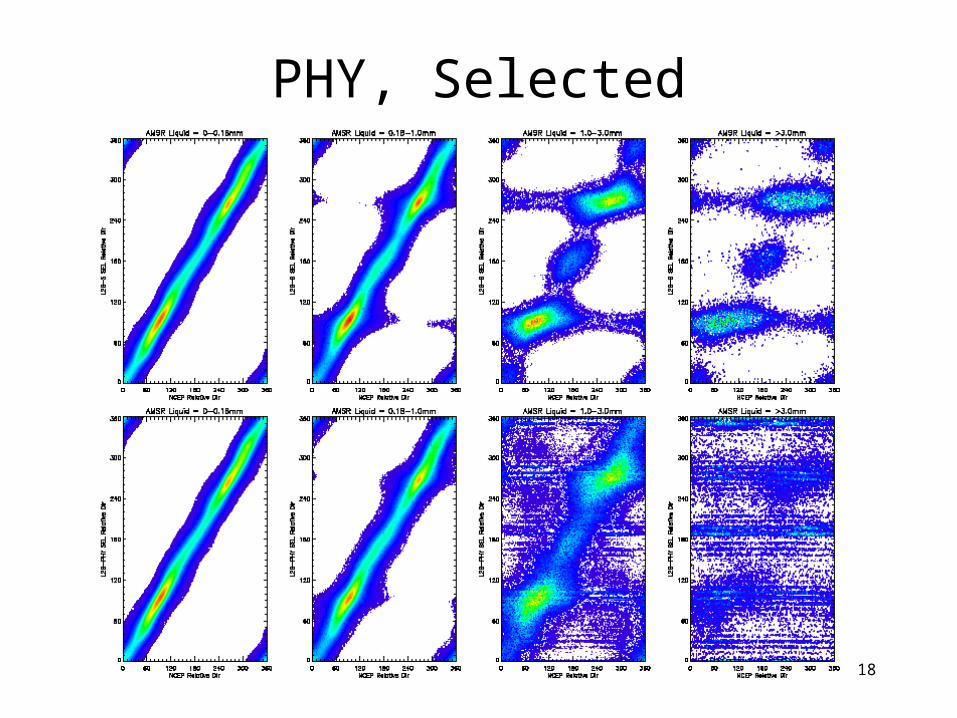
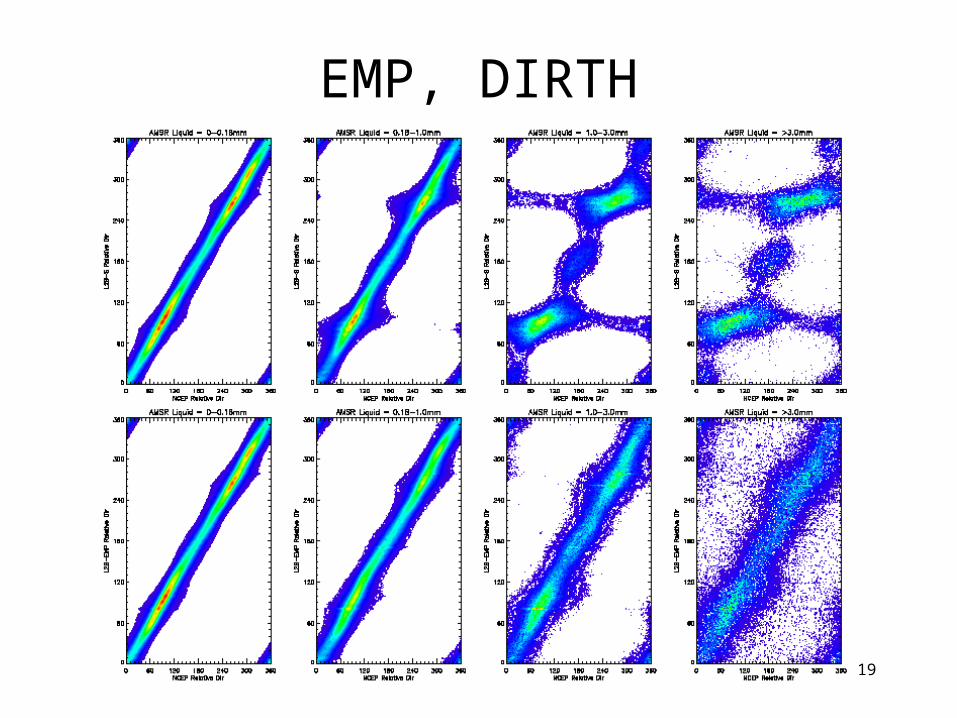
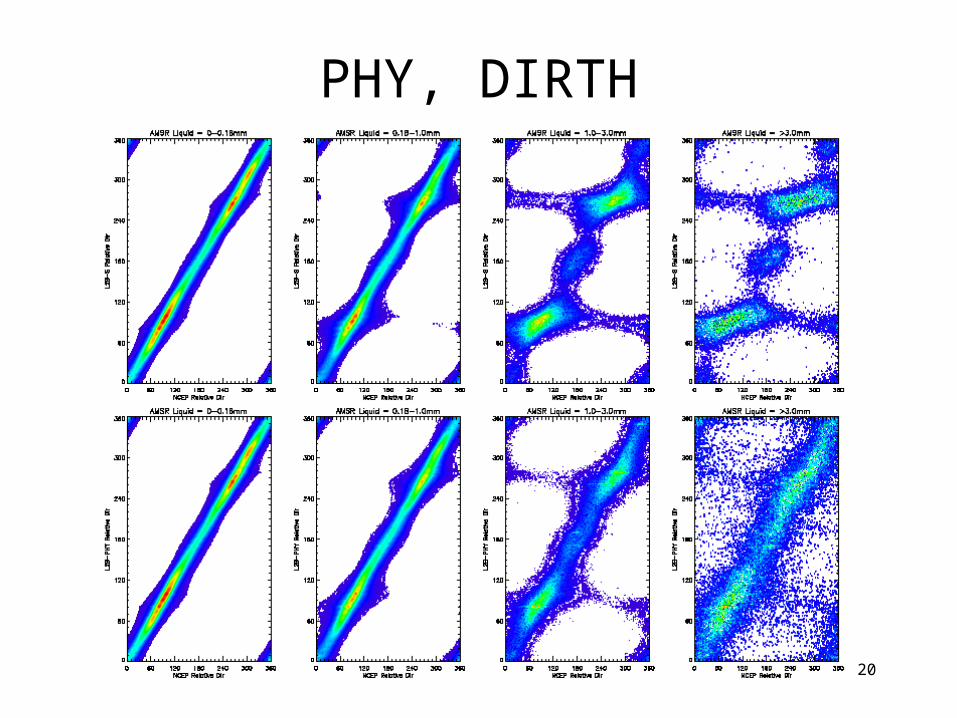
2-D Direction Histograms
• Two dimensional histograms of retrieved direction and NCEP direction, relative to the s/c flight direction.
• Demonstrates the removal of rain-related artifacts [e.g. cross-track directions].
• Histograms were computed for varying– Correction method (slide)– Liquid range (plot in slide)– Choice of DIRTH, Selected, or Nearest (slide)
• SCAT-only histograms repeated as the top row of each slide for comparison.– SCAT-only histograms differ for EMP and PHY slightly due
to differences in flagging.
15
EMP, Nearest
16
PHY, NEAREST
17
EMP, Selected
18
PHY, Selected
19
EMP, DIRTH
20
PHY, DIRTH
21
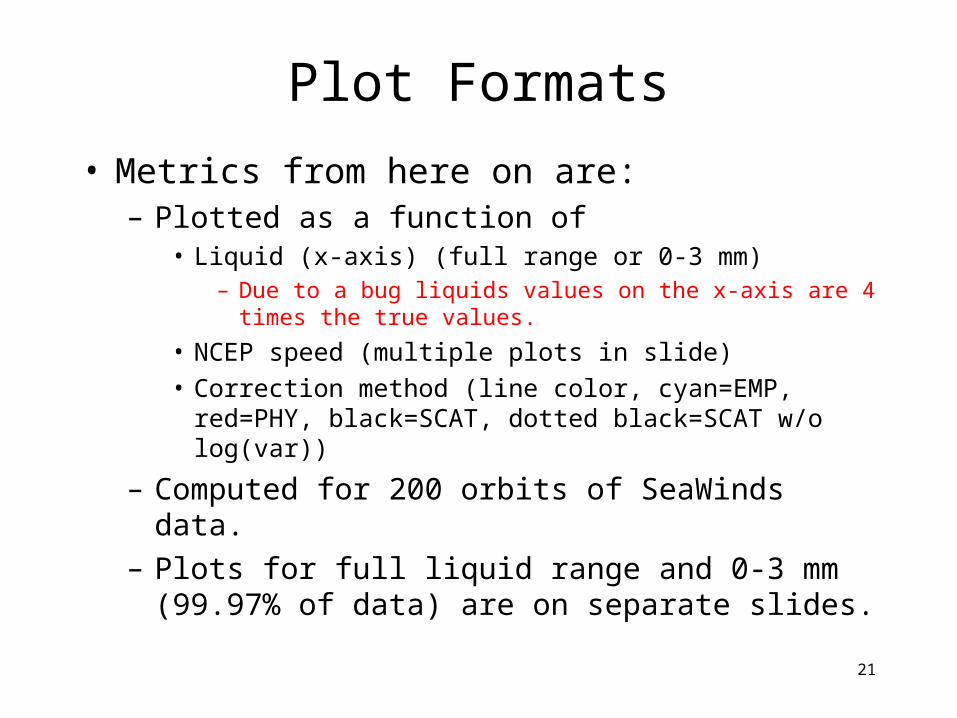
Plot Formats
• Metrics from here on are:– Plotted as a function of
• Liquid (x-axis) (full range or 0-3 mm)– Due to a bug liquids values on the x-axis are 4 times the
true values.
• NCEP speed (multiple plots in slide)• Correction method (line color, cyan=EMP, red=PHY,
black=SCAT, dotted black=SCAT w/o log(var))
– Computed for 200 orbits of SeaWinds data.– Plots for full liquid range and 0-3 mm (99.97% of
data) are on separate slides.
22
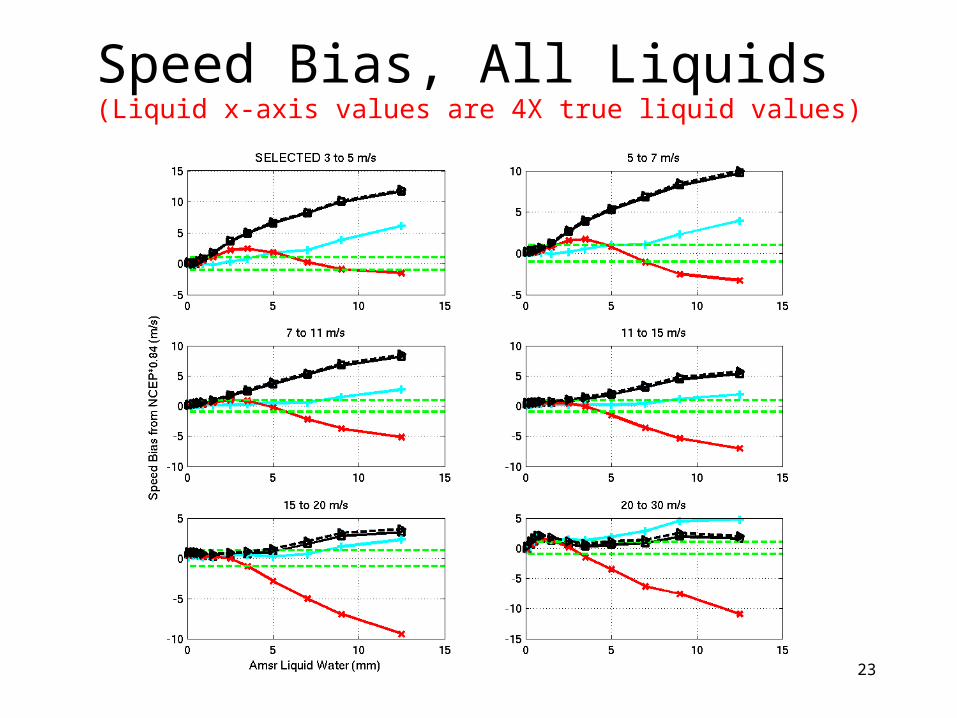
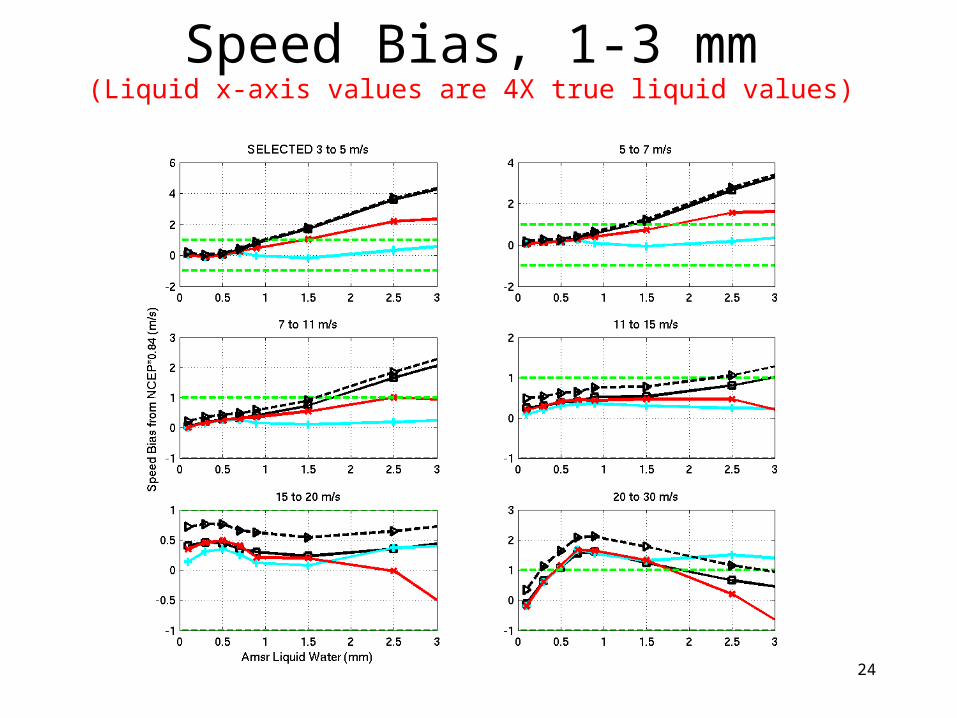
Speed Biases
• Metric Definition– Selected speed - NCEP speed
• Performance Summary– Nearest and DIRTH speed biases (not shown) are
similar.– Significant improvement for all but highest wind
speeds.– Even heavy rain cases show improvement.– Correction imparts little or no change for rain free
data.– Slight change in rain free biases with addition of
log(var).
23
Speed Bias, All Liquids (Liquid x-axis values are 4X true liquid values)
24
Speed Bias, 1-3 mm(Liquid x-axis values are 4X true liquid values)
25
Cross Track Direction Bias
• Metric Definition– The average amount closer to the cross swath than NCEP in
degrees.• Angle between NCEP and cross swath minus the angle
between selected and cross swath.
• A positive value indicates the cross track direction is preferentially retrieved.
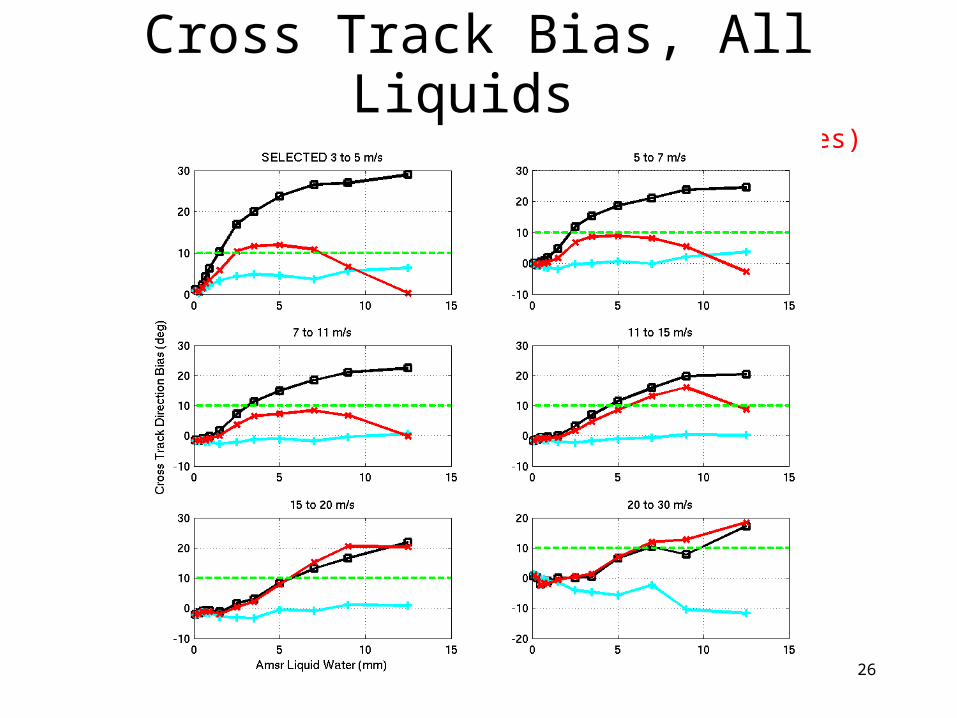
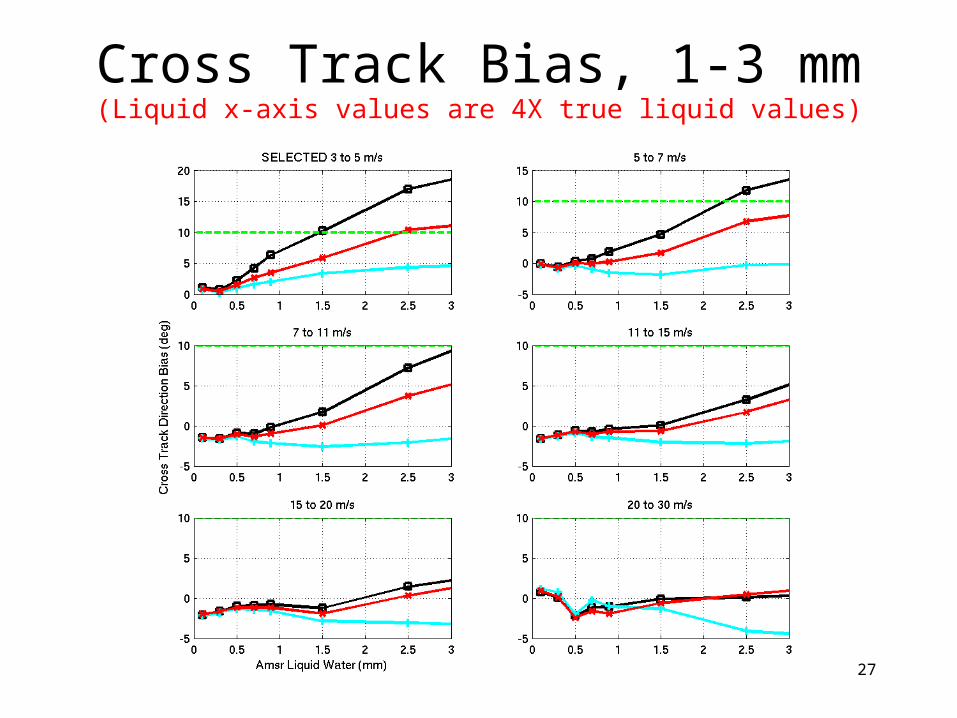
• Performance Summary– Corrections reduce rain induced preference for cross swath
direction.– Nearest and DIRTH performance is similar to Selected.– Full liquid range and 0-3 mm plots are shown.
26
Cross Track Bias, All Liquids (Liquid x-axis values are 4X true liquid values)
27
Cross Track Bias, 1-3 mm(Liquid x-axis values are 4X true liquid values)
28
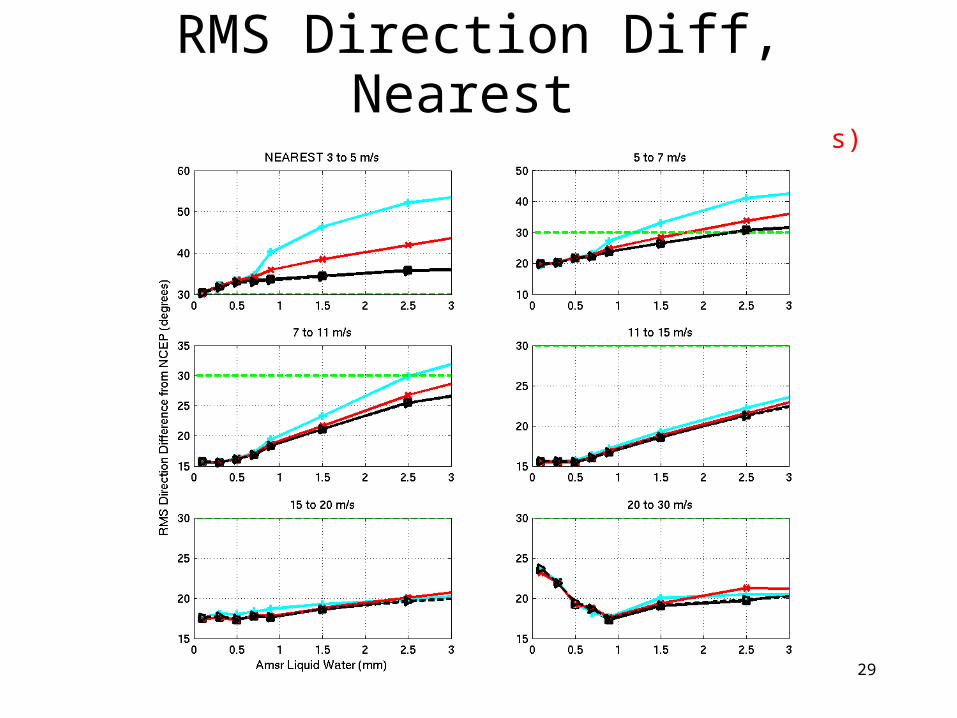
RMS Direction Difference
• Nearest, Selected, and DIRTH stats are plotted.• Performance Summary
– Correction increases Nearest RMS direction difference in rain.
• Number of ambiguities are reduced.
• Correction noise is added.
– Selected direction difference - no change• Correction noise competes with removal of cross track
preference.
– DIRTH direction difference - improvement with rain correction
• Best case DIRTH spatially smooths correction noise.
• Worst case DIRTH smooths directional features in rain.
29
RMS Direction Diff, Nearest (Liquid x-axis values are 4X true liquid values)
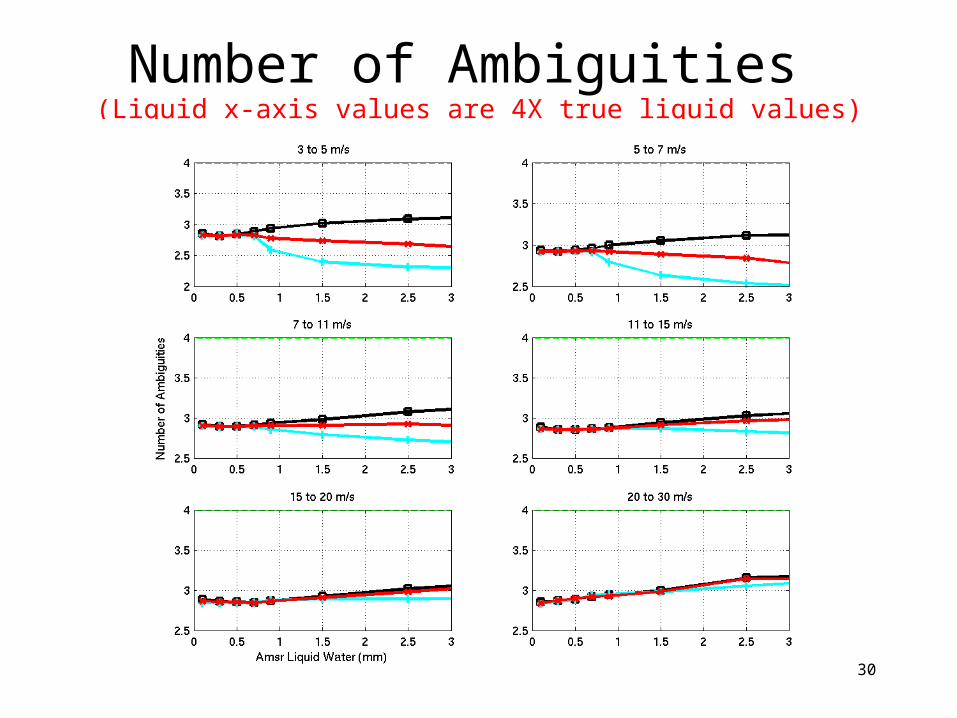
30
Number of Ambiguities (Liquid x-axis values are 4X true liquid values)
31
RMS, Direction Diff, Selected(Liquid x-axis values are 4X true liquid values)
32
RMS Direction Diff, DIRTH (Liquid x-axis values are 4X true liquid values)
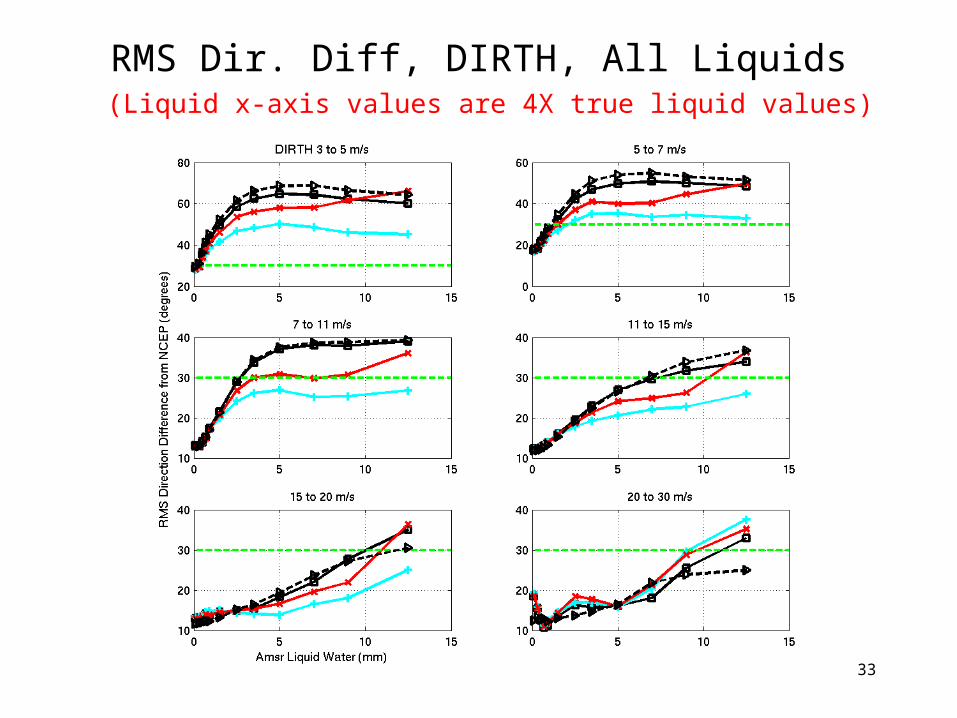
33
RMS Dir. Diff, DIRTH, All Liquids (Liquid x-axis values are 4X true liquid values)
34
Discussion
• What further validation is needed?• What can change analysis tell us?• Should change analysis look at:
– DIRTH solution performance?– Cross Track Direction Bias?
• What can we compare with besides NCEP? Buoys?