Embed Size (px)
Citation preview

Seattle Park and Recreation
Trails Program
2010 Trail Maps
TABLE OF CONTENTS
INTRODUCTION....………………...........1 SCOPE OF WORK...................................2 METHODOLOGY.....................................3 GIS................................................................5 SPATIAL ANALYSIS..............................7 SUMMARY................................................11
Appendix A: Parks with Trails…….12 Appendix B: Trail Maps: Encroachments………………………….13 Appendix C: Example Maps………...14
Acknowledgments:
The Trails Inventory was a cooperation
between Puget Sound GIS and Seattle Parks
and Recreation Trails Program.
Seattle Parks and Recreation Staff
Mark Mead – Urban Forester
SPR Trails Program Staff:
Chukundi Salibury – Trails Coordinator
Jacobo Jimenez – Maintenance Lead
Consutant Team:
Puget Sound GIS Staff:
Jesse Alton – GIS Specialist
Jesse Alton- Data Entry

INTRODUCTION
In 2005 the City of Seattle’s Parks and
Recreations’ Trails Program began the
development of a Geographical Informational
System (GIS) for its trails system. The project was
intended to create an accurate assessment of
Seattle’s existing and known soft surface trials
system. This included starting an inventory of
current trail conditions, developing a trails
database, surveying every linear foot of trail, and
a method for data collection. Data was evaluated
on surface conditions, surface types, and canopy
types, and trail widths and collected in the field
using GPS data collectors. Information collected
could then be managed, visualized, analyzed, and
archived with GIS mapping software and entered
into a workable database. Over sixty parks were
surveyed, detailing 100 miles of trails, in 2008.
1

SCOPE OF WORK
In 2010 Puget Sound GIS visited 67 Seattle City Parks and
surveyed over 115 miles of trail. The overall goal was to
track, maintain, and update the existing GIS trail inventory
within the City of Seattle parks system. Our objective was to
evaluate Seattle Parks and Recreations’ existing GIS
database. Through this process we would develop the 2010
Citywide Trails Layer. This layer would include new feature
attributes and create new trail maps for SPR parks.
Advances in GPS technology allowed us to correct outdated
data and provide accurate location information. These changes to site characteristics could be
edited in the field and updated into the GIS. Once uploaded into the GIS the trails layer could
be double checked for inaccuracies and database errors. Once all the correction are finalized in
a variety of trail maps displaying various attributes would be designed and uploaded into the
SPR server.
This effort will help SPR by providing baseline data on existing site conditions and to create site
specific maps the will be used for a variety of uses, including being made available to the public.
Our intent was an effort to indentify parks under the Trails Program Maintenance Plan and
established a trails inventory based on soft surfaces. We realize that several park with trails
were not included (i.e. East Duwamish Green Belt, Burke Gilman, Green Lake). These parks that
have elements not under our maintenance plan were not surveyed. We anticipate documenting
these parks in the future, so that our inventory will include parks with hard surfaced trails and
maintenance trails.
2

Methodology
The methodology used to map the inventory remained the same. However, the
inventory tracked in the field first required correcting GPS coordinates for trails
surveyed in 2008. This adjustment was necessary to achieve sub-meter
(decimeter (10 cm / 4 inch) accuracy for each trail segment). Existing segments
had previously been collected using an automatic process. GPS coordinates were
gathered in time
rather than distance.
This made it difficult
to recognize
anomalies when in the
field. Collecting trails
data with distance
provided reliable accuracy for each trail segment corrected. These trail segments
can be identified with numbers representing each segment. The trail segment
numbers are also attached to specific SPR Property Management Area numbers.
The combined ID number can help identify trails within any city park (Table 1).
Once a Trial Identification Number (Trail-ID) is reestablished, attribute features
can be changed in the field (Table 2).
3

Table 1 shows the trail attributes and the features associated. These features are also known as
domains and can be edited in the field for each Trial ID segment.
Table 2 shows how the attributes are organized when managed in the GIS database.
Table 2
4
Trail ID Property Management Area Trail Identification Number
Trails Condition Condition Types Good Worn Eroded Overgrown
Trail Width Average Width of Trail
Trail Surface Type Surface Types/Trail Structures Gravel Soil Boardwalk Concrete Paved Grass Stairs
Grade Type Grade Types Flat Gradual Moderate Steep
Grade Percentage Grade percentage from 0%-10% slope
Canopy Type Canopy Types Closed High Low Open
Trail Length Length of Trail in Linier Feet
PMA Name Park Name
Table 1
Geographical Informational Systems (GIS)
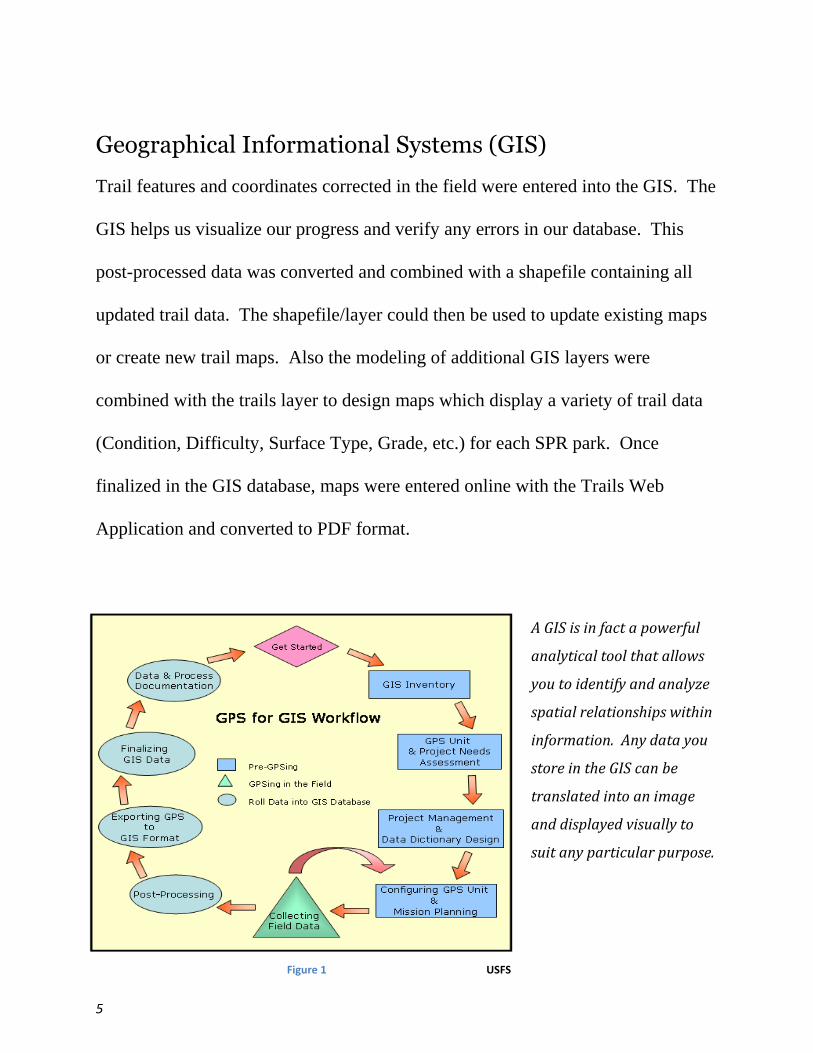
Trail features and coordinates corrected in the field were entered into the GIS. The
GIS helps us visualize our progress and verify any errors in our database. This
post-processed data was converted and combined with a shapefile containing all
updated trail data. The shapefile/layer could then be used to update existing maps
or create new trail maps. Also the modeling of additional GIS layers were
combined with the trails layer to design maps which display a variety of trail data
(Condition, Difficulty, Surface Type, Grade, etc.) for each SPR park. Once
finalized in the GIS database, maps were entered online with the Trails Web
Application and converted to PDF format.
A GIS is in fact a powerful
analytical tool that allows
you to identify and analyze
spatial relationships within
information. Any data you
store in the GIS can be
translated into an image
and displayed visually to
suit any particular purpose.
5
Figure 1 USFS

Modeling GIS and Map Design:

Spatial Analysis
Spatial Analysis is a GIS tool we used to report on current site conditions and
progress. From the information collected we were able to evaluate our
assessment of SPR’s Trails System. The following figures represent an
analysis of information collected. We also determined the total number of
miles for each feature within each attribute. We then were able to compare
site characteristic from 2008 (Figures 2-5).
7
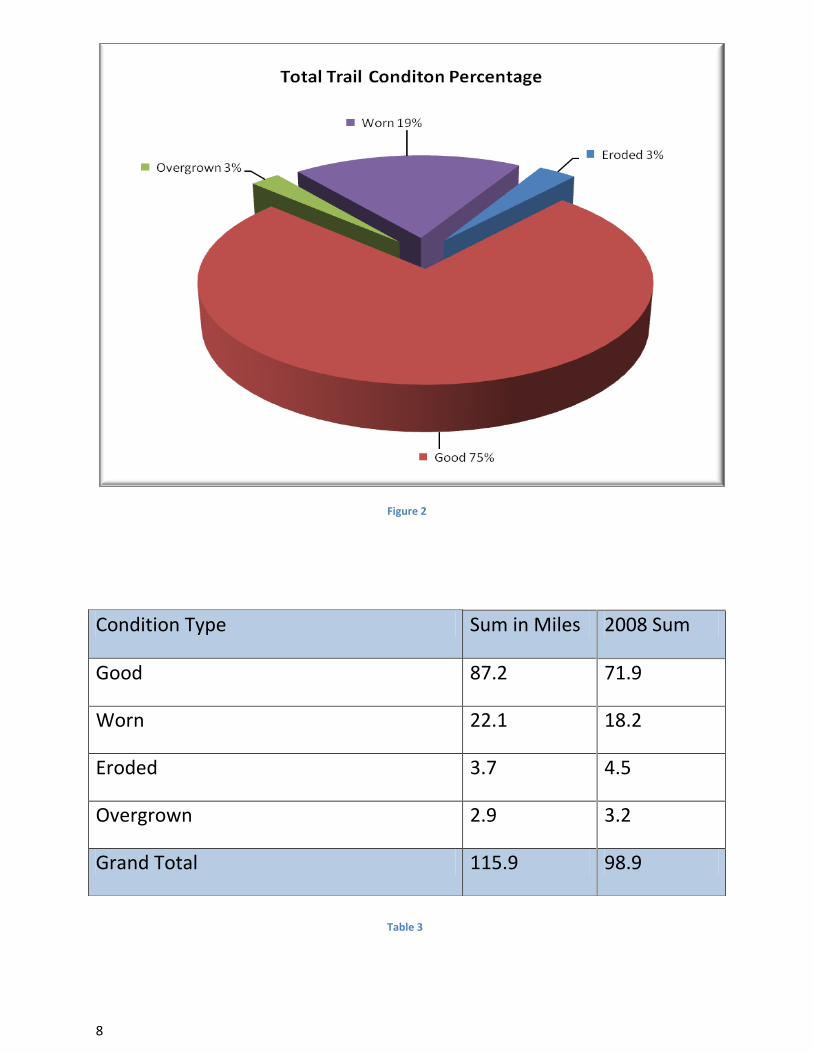
Figure 2
8
Condition Type Sum in Miles 2008 Sum
Good 87.2 71.9
Worn 22.1 18.2
Eroded 3.7 4.5
Overgrown 2.9 3.2
Grand Total 115.9 98.9
Table 3
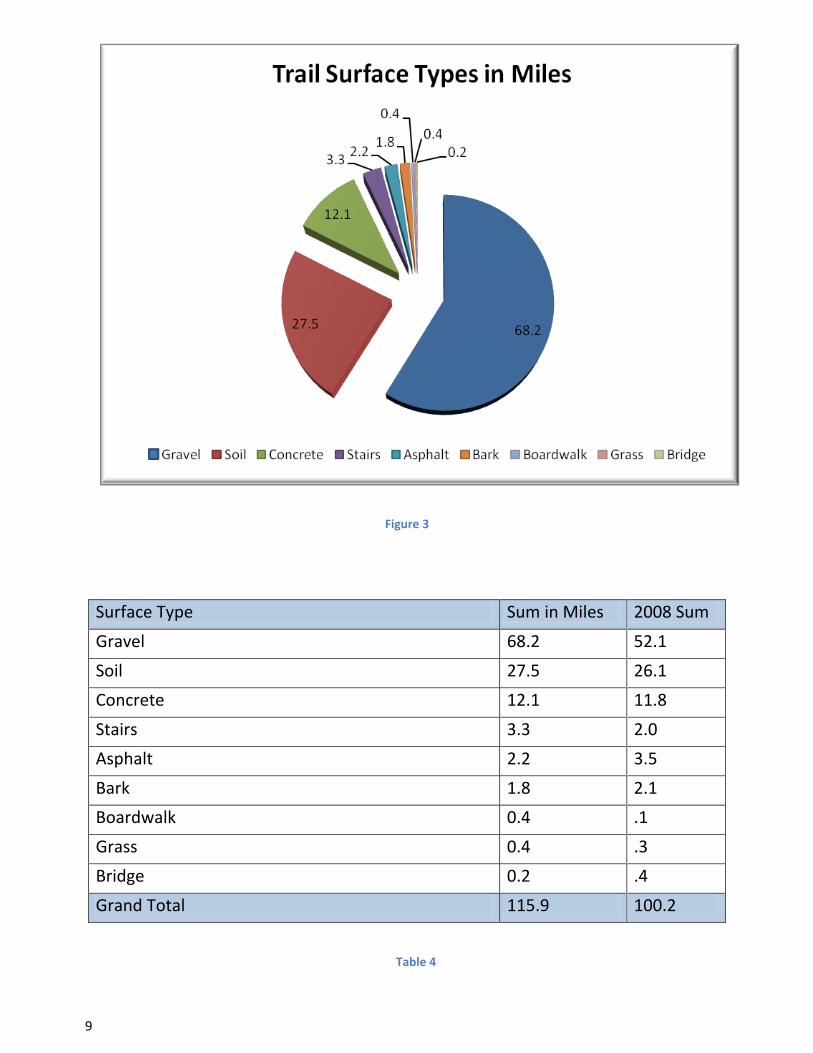
Figure 3
Table 4
9
Surface Type Sum in Miles 2008 Sum
Gravel 68.2 52.1
Soil 27.5 26.1
Concrete 12.1 11.8
Stairs 3.3 2.0
Asphalt 2.2 3.5
Bark 1.8 2.1
Boardwalk 0.4 .1
Grass 0.4 .3
Bridge 0.2 .4
Grand Total 115.9 100.2
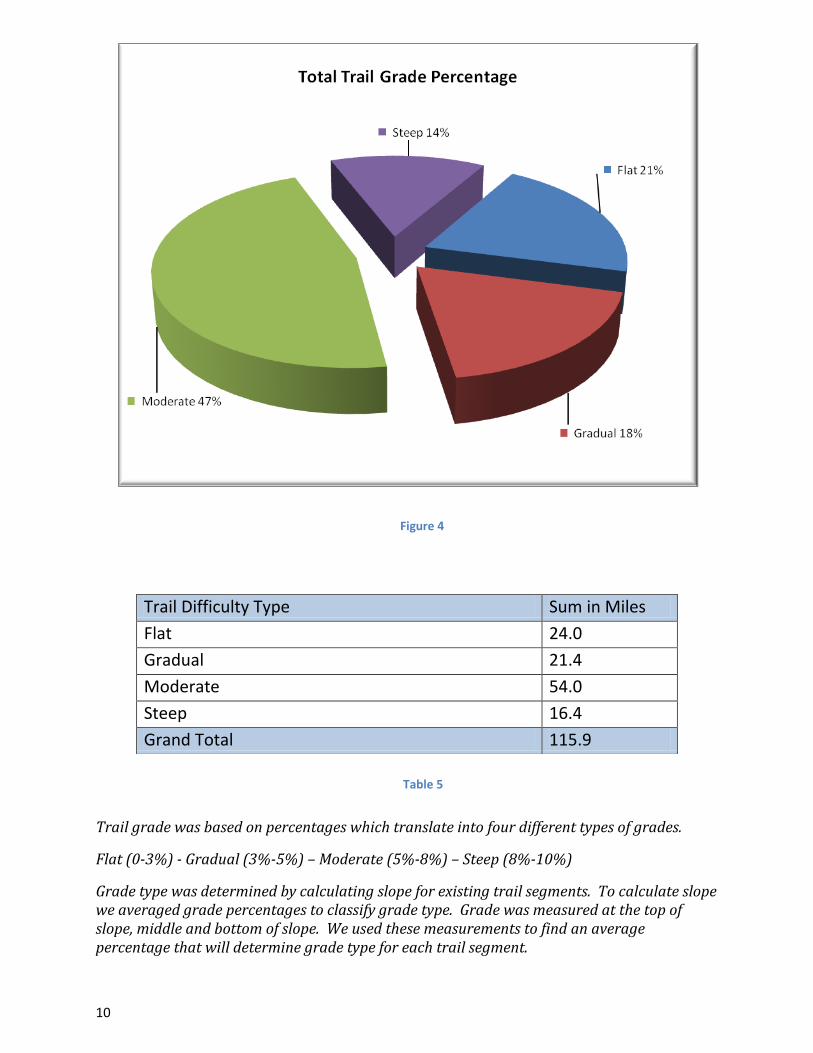
Figure 4
Trail grade was based on percentages which translate into four different types of grades.
Flat (0-3%) - Gradual (3%-5%) – Moderate (5%-8%) – Steep (8%-10%)
Grade type was determined by calculating slope for existing trail segments. To calculate slope we averaged grade percentages to classify grade type. Grade was measured at the top of slope, middle and bottom of slope. We used these measurements to find an average percentage that will determine grade type for each trail segment.
10
Trail Difficulty Type Sum in Miles
Flat 24.0
Gradual 21.4
Moderate 54.0
Steep 16.4
Grand Total 115.9
Table 5

Figure 5
Table 6
11
Type/Condition Eroded Good Overgrown Worn Sum in Miles
Asphalt 0.00 1.72 0.00 0.51 2.23
Bark 0.00 1.54 0.02 0.19 1.75
Boardwalk 0.00 0.35 0.00 0.02 0.37
Bridge 0.00 0.15 0.00 0.04 0.20
Concrete 0.00 10.48 0.46 1.16 12.11
Grass 0.04 0.07 0.12 0.13 0.36
Gravel 0.55 57.13 0.51 9.97 68.16
Soil 3.10 13.37 1.80 9.20 27.46
Stairs 0.03 2.37 0.02 0.85 3.27
Grand Total 3.72 87.19 2.92 22.07 115.90

Summary:
Until now, there has never been a finalized citywide assessment of the
SPR trails system. The 2010 trail inventory accomplished more than an
evaluation; it provided spatial solutions to geographic relationships.
The SPR trails geo-database creates a visual tool that allows
management to analyze and visualize trail system data and as technology
advances, we continue to discover ways to apply GIS to help make
strategic and tactical planning and management decisions.
Google Maps
12
Appendix A: List of Parks with Trails
Bhy Kracke Park Longfellow Creek GS: South Boren Park Madrona Park Camp Long Martha Washington Park Carkeek Park Matthews Beach Park Cedar Park Meadowbrook Playfield Cheasty GS: Cheasty Blvd Me-Kwa-Mooks Park Colman Park Mount Baker Park Cowen Park North East Queen Anne Greenbelt Dearborn Park Northacres Park Discovery Park Pigeon Point Dr. Jose Rizal Park Pritchard Island Beach Duwamish Head Greenbelt Puget Park
Fauntleroy Park Ravenna Park Foster Island Riverview Playfield NA Frink Park Roxhill Park Genesee Park and Playfield Schmitz Preserve Park Golden Garden Park Seola Beach GreenBelt Hitt's Hill Park Seward Park Interlaken Park Solstice Park Jackson Park Soundway (SDOT) Jefferson Park St. Marks Greenbelt Kinnear Park SW Queen Anne Greenbelt KIWANIS MEMORIAL PRESERVE PARK Thornton Creek Park #2 Lake People Park (Xacua'bs) Thorton Creek Park #6 Lakeridge Park Volunteer Park
Lakeview Park Warren G. Magnuson Park Lawton Park Washington Park And Arboretum Leschi Park West Duwamish GS: Othello St. Licton Springs Park West Duwamish GS: Puget Park Lincoln Park West Duwamish GS: Riverview Llandover Woods Greenspace Westcrest Park Longfellow Creek GS: Central Woodland Park Longfellow Creek GS: North
13

Appendix B: Trail Maps : Boundary Encroachments.
14
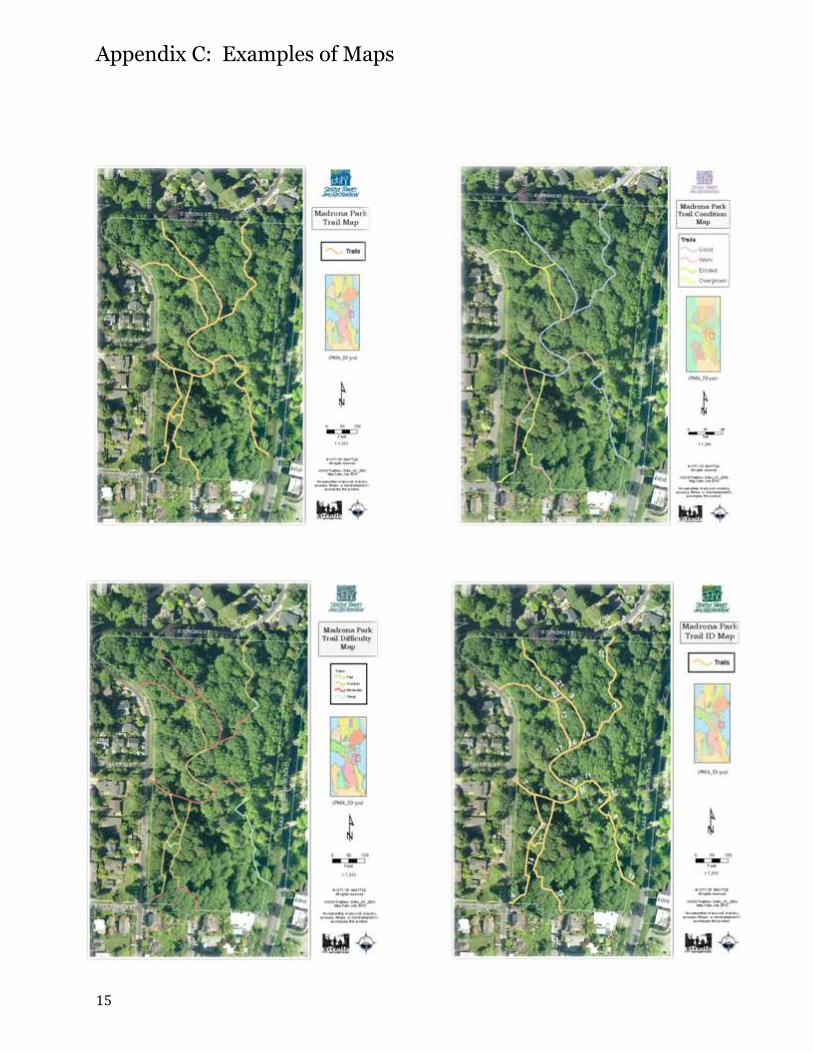
Appendix C: Examples of Maps
15