Embed Size (px)
Citation preview

www.helcom.fi > Baltic Sea trends > Indicators © HELCOM 1
HELCOM core indicator report July 2018
Seasonal succession of dominating phytoplankton groups
Key Message This indicator and its threshold values are yet to be commonly agreed in HELCOM.
The indictor is included as a test indicator for the purposes of the 'State of the Baltic Sea' report, and the results are to be considered as intermediate.
A provisional status evaluation has been done for specific assessment units over the period 2011–2016 to test the application of this indicator (Key message figure 1). The threshold values, based on defined reference periods, assess acceptable deviations from seasonal growth curves of dominating phytoplankton groups. The indictor value is based on the number of data points which fall within the acceptable deviation range, as set for each monthly phase in the reference growth curve, and expressed as the percentage to the total number of observations. Strong deviations from the reference growth curves indicate impairment in the environmental status.
Key message figure 1. Provisional status assessment results based evaluation of the indicator ‘Seasonal succession of dominating phytoplankton groups’. The assessment is carried out using Scale 3 HELCOM assessment units (defined in the HELCOM Monitoring and Assessment Strategy Annex 4). Click here to access interactive maps at the HELCOM Map and Data Service: Seasonal succession of dominating phytoplankton.

www.helcom.fi > Baltic Sea trends > Indicators © HELCOM 2
The proportion of observations with acceptable deviations in monthly biomass indicating normal seasonal succession of phytoplankton, was preliminarily set at ≥0.67 for the tested areas. To develop basin-specific threshold values, all data were analysed to detect periods with lower total biomass and lesser year-to-year fluctuations. The analysis for 12 assessment units resulted in threshold values varying from 0.58 to 0.74 (Thresholds and Status evaluation table 2).
Where applied, the confidence in this indicator assessment is moderate or high. This indicator should be applicable in all coastal and open sea waters around the Baltic Sea. To account for spatial differences in phytoplankton community composition and environmental gradients, further development and agreement related to appropriate threshold value setting is required.
Relevance of the core indicator
Phytoplankton are the key primary producers in marine ecosystems. The phytoplankton community is comprised of several functionally diverse groups that dominate at different times of the year. Changes in the presence of specific phytoplankton group or the timing of when it dominates and becomes abundant may influence ecosystem function. The consequent altered timing of food and carbon availability for other higher trophic levels (e.g. zooplankton) can have wider food web impacts and the sedimentation of detritus (e.g. dead phytoplankton) can influence the microbial food web and ecosystem balance (e.g. heterotrophy-autotrophy) and the physicochemical state of the ecosystem (e.g. oxygen concentration).
A deviation from the normal seasonal cycle (such as a too high or too low biomass, or absence of some dominating phytoplankton group(s)) is indicative of an impairment of environmental status. Phytoplankton species composition changes if the amount of nutrients or the ratios of important nutrients (e.g. nitrogen and phosphorus) change, and eutrophication has resulted in more intense and frequent phytoplankton blooms in the summer.
Policy relevance of the core indicator
BSAP Segment and Objectives MSFD Descriptors and Criteria Primary link • Thriving and balanced communities of
plants and animals D4 - Food webs
D4C1 The diversity (species composition and their relative abundance) of the trophic guild is not adversely affected due to anthropogenic pressures.
Secondary link • Natural Distribution and occurrence of plans and animals
D5 - Eutrophication
D5C3 The number, spatial extent and duration of harmful algal bloom events are not at levels that indicate adverse effects of nutrient enrichment.
Other relevant legislation:
Cite this indicator

www.helcom.fi > Baltic Sea trends > Indicators © HELCOM 3
HELCOM (2018). Seasonal succession of functional phytoplankton groups. HELCOM core indicator report. Online. [Date Viewed], [Web link].
ISSN: 2343-2543
Download full indicator report
Seasonal succession of dominating phytoplankton groups HELCOM core indicator 2018 (pdf)

www.helcom.fi > Baltic Sea trends > Indicators © HELCOM 4
Results and Confidence This indicator and its threshold values are yet to be commonly agreed in HELCOM.
The indictor is included as a test indicator for the purposes of the 'State of the Baltic Sea' report, and the results are to be considered as intermediate.
The results of preliminary evaluation are presented for the Bay of Mecklenburg, Arkona, Bornholm, Eastern Gotland and Northern Baltic Proper basins and the Gulf of Riga. The following coastal water units are included – Swedish part of the Northern Baltic Proper, Estonian part of the Gulf of Finland, Estonian and Latvian parts of the Gulf of Riga and Lithunian part of the Eastern Gotland Basin. Data are also provided for the Gdansk Basin Polish coastal waters and German coastal waters, but not yet assessed due to undefined reference period or too short time series, respectively. Finland has announced that reference data for setting threshold values are missing and this indicator cannot be used in Finnish coastal waters.
The results of preliminary evaluation are summarized in Results table 1. The reference period is defined separately for each sea area and depends on the availability of data. Time-series usually start from the beginning of the 1990s, while disturbances in the environment were evident already in the 1960s (Andersen et al., 2015). To start evaluating environmental status and to create reference growth curves, regular data set of at least 10 years with monthly sampling is needed to comprise all natural variability. These are the reasons why tentative reference periods in some units extend until recent years and partly overlap with assessment periods. The test period includes six years (2011−2016). An example of reference growth curves and indicator values within the given assessment period is represented in Results figure 1.
Results table 1. Test results for the period 2011–2016 from different assessment units of the Baltic Sea. Indicator value lies between 0 and 1 and is the proportion of data points within the frame of seasonal reference growth curves and acceptable deviations. Data point is the average of all observations in a month of certain year. For overall assessment, indicator values of individual dominant groups are averaged.
Area Dominant group
No. of obs./ data
points (2011-2016)
No. of data
points within
acc. range
Indica-tor
value
Refe-rence perio
d
No. of obs./ data
points (ref.
period)
No. of data
points within
acc. range
Thres-hold value
Evalu-ation (green – achie-ved, red – failed)
Bay of Mecklen-burg (open sea and coastal areas combined)
All groups
Cyanobacteria
Dinoflagellates
Diatoms
M. rubrum
152/53
41
35
29
37
0.67
0.77
0.66
0.55
0.70
2006-2015
222/74
65
52
40
52
0.71
0.88
0.70
0.54
0.70
Arkona Basin
All groups
Cyanobacteria
260/63
40
0.63
0.63
2005-2014
336/96
73
0.70
0.76

www.helcom.fi > Baltic Sea trends > Indicators © HELCOM 5
Dinoflagellates
Diatoms
M. rubrum
41
37
40
0.65
0.59
0.63
61
66
62
0.64
0.69
0.70
Bornholm Basin
All groups
Cyanobacteria
Dinoflagellates
Diatoms
M. rubrum
179/63
39
39
30
39
0.58
0.62
0.62
0.48
0.62
2005-2014
182/88
55
49
46
54
0.60
0.63
0.56
0.52
0.68
Gdansk Basin
All groups
Cyanobacteria
Dinoflagellates
Diatoms
M. rubrum
80/34
20
21
20
19
0.59
0.59
0.62
0.59
0.56
1995-2000; 2010-2015
136/62
34
40
36
35
0.58
0.55
0.65
0.58
0.56
Eastern Gotland Basin
All groups
Cyanobacteria
Dinoflagellates
Diatoms
M. rubrum
155/61
39
43
38
45
0.68
0.64
0.70
0.62
0.74
2005-2014
183/80
61
59
56
60
0.74
0.76
0.74
0.70
0.75
Eastern Gotland Basin Lithuanian Coastal Waters
All groups
Cyanobacteria
Dinoflagellates
Diatoms
M. rubrum
167/40
29
27
20
26
0.65
0.73
0.68
0.50
0.65
2006-2015
251/56
42
37
26
27
0.64
0.75
0.66
0.46
0.61
Gulf of Riga
All groups
Cyanobacteria
Dinoflagellates
Diatoms
M. rubrum
207/40
23
32
19
28
0.64
0.58
0.80
0.48
0.70
2000-2005; 2009-2015
370/83
341/76
55
58
58
53
0.69
0.66
0.70
0.70
0.70
Gulf of Riga Estonian Coastal Waters
All groups
Cyanobacteria
Dinoflagellates
Diatoms
M. rubrum
219/42
22
31
28
18
0.59
0.52
0.74
0.67
0.43
1997-2010
482/91
57
70
64
52
0.67
0.63
0.77
0.70
0.57
Gulf of Riga Latvian
All groups
Cyanobacteria
146/27
13
0.61
0.48
1999-2002;
290/75
43
0.61
0.57

www.helcom.fi > Baltic Sea trends > Indicators © HELCOM 6
Coastal Waters
Dinoflagellates
Diatoms
M. rubrum
22
16
15
0.81
0.59
0.56
2008-2015
215/54
51
47
31
0.68
0.63
0.57
Northern Baltic Proper
All groups
Cyanobacteria
Dinoflagellates
Diatoms
M. rubrum
186/66
49
38
37
43
0.63
0.74
0.58
0.56
0.65
1997-2011
368/168
121
124
99
117
0.69
0.72
0.74
0.59
0.70
Northern Baltic Proper Swedish Coastal Waters
All groups
Cyanobacteria
Dinoflagellates
Diatoms
M. rubrum
141/72
54
48
50
39
0.66
0.75
0.67
0.69
0.54
1997-2012
363/189
146
138
137
100
0.69
0.77
0.73
0.72
0.53
Gulf of Finland Estonian Coastal Waters (western part)
All groups
Cyanobacteria
Dinoflagellates
Diatoms
M. rubrum
202/43
25
21
24
11
0.47
0.58
0.49
0.56
0.26
1993-2004
239/76
172/57
53
48
53
33
0.65
0.70
0.63
0.70
0.58
Gulf of Finland Estonian Coastal Waters (eastern part)
All groups
Cyanobacteria
Dinoflagellates
Diatoms
M. rubrum
200/41
27
21
28
22
0.60
0.66
0.51
0.68
0.54
2001-2015
424/107
65
63
82
56
0.62
0.61
0.59
0.77
0.52

www.helcom.fi > Baltic Sea trends > Indicators © HELCOM 7
Results figure 1. Reference growth curves with monthly averaged normalized biomass values (Zmonth), acceptable deviations (Zmonth±0.5) and data points from the test period (2012–2016) in the Eastern Gotland Basin.
Confidence of the indicator status evaluation
Spatio-temporal coverage differs between the assessment units. For most of the test areas, the confidence of indicator status is moderate to high according to temporal and moderate according to spatial resolution. Confidence level depends on the length of the time-series and regularity of phytoplankton sampling during the growth period. Once the reference growth curves have been established, some compromises in the frequency of sampling and total number of samples used in the assessment are possible. The indicator value is the proportion of biomass values fitting into the reference growth envelope (region of acceptable deviation) and the values for individual months are independent. It means that if some data points for some months during the assessment period are missing, the evaluation of status is still feasible.
On the other hand, methodological confidence of monitoring data used for this indicator is rather high since all laboratories providing data follow the same guidelines. The quality of data is substantially improved after implementing a standardised species list with fixed size-classes and biovolumes (Olenina et al., 2006).
-1.5
-0.5
0.5
1.5
2.5
1 2 3 4 5 6 7 8 9 10 11
z-sc
ore
month
Cyanobacteria, Eastern Gotland Basinzmonth
Zmonth+0.5SDZmonth-0.5SD2012
2013
2014
2015
2016
-2
-1
0
1
2
1 2 3 4 5 6 7 8 9 10 11
z-sc
ore
month
Dinophyceae, Eastern Gotland Basinzmonth
Zmonth+0.5SDZmonth-0.5SD2012
2013
2014
2015
2016
-2
-1
0
1
2
1 2 3 4 5 6 7 8 9 10 11
z-sc
ore
month
Diatomophyceae, Eastern Gotland Basin
-2
-1
0
1
2
1 2 3 4 5 6 7 8 9 10 11
z-sc
ore
month
Mesodinium rubrum, Eastern Gotland Basin

www.helcom.fi > Baltic Sea trends > Indicators © HELCOM 8
Thresholds and Status evaluation This indicator and its threshold values are yet to be commonly agreed in HELCOM.
The indictor is included as a test indicator for the purposes of the 'State of the Baltic Sea' report, and the results are to be considered as intermediate.
The concept for evaluating good environmental status using the succession of dominant groups in the phytoplankton community is structured around a reference status succession and the acceptable deviation from that pattern. The indicator evaluates the coincidence of seasonal succession of dominating phytoplankton groups over an assessment period (commonly 5−6 years) using regionally established reference seasonal growth curves and wet weight biomass data. The indictor result value is based on the number of data points falling within the acceptable deviation range set for each monthly point of the reference growth curve and expressed as the percentage to the total number of data points. This result value is then compared to regionally relevant threshold values established to represent acceptable levels of variation. Strong deviations from the reference growth curves will result in failure to meet the thresholds set for acceptable variation, indicating impairment of the environmental status and a failure to meet good status (Thresholds figure 1).
Thresholds figure 1. Good status is achieved when the indicator result (number of data points that fall within the established acceptable variation range) is above the regionally defined threshold value.
The specific regional threshold values used in this test indicator are presented in Thresholds table 1. The threshold values are still preliminary and subjects of possible change for the next assessment period. The final evaluation is based on the average score of single dominant groups. This indicator may also be used as background data for the development of a modified lifeform approach in the monitoring and environmental assessments in the HELCOM area. Lifeform approach has been considered to be taken into use in the MSFD assessments by OSPAR (Tett et al. 2008, Gowen et al. 2011).

www.helcom.fi > Baltic Sea trends > Indicators © HELCOM 9
Thresholds table 1. Reference periods and threshold values (percentage of data points falling within the acceptable deviation range set for each monthly point) for selected assessment units in the Baltic Sea area.
Assessment unit Reference period Threshold value
Bay of Mecklenburg* 2006-2015 0.71
Arkona Basin 2005-2014 0.70
Bornholm Basin 2002-2011 0.60
Gdansk Basin 1995-2000, 2010-2015 0.58
Eastern Gotland Basin 2005-2014 0.74
Gulf of Riga 2000-2005, 2009-2015 0.69
Northern Baltic Proper (NBP) 1997-2011 0.69
NBP Swedish coastal waters 1997-2012 0.69
Gulf of Finland Estonian coastal waters (western part)
1993-2004 0.65
Gulf of Finland Estonian coastal waters (eastern part)
2001-2015 0.62
Gulf of Riga Estonian coastal waters 1997-2010 0.67
Gulf of Riga Latvian coastal waters 1999-2002, 2008-2015 0.61
Eastern Gotland Basin Lithuanian coastal waters 2006-2015 0.64
*data sets from coastal and open sea waters combined.
Background information on deriving the threshold values
The term ‘Good status’ has, however, to be taken with care as the first eutrophication affected changes in ecosystems emerged already in the mid-1950s in the Baltic Sea (Andersen et al., 2015). In the few basins, regular phytoplankton datasets date back to the mid-1980s only, mostly the observations start from the 1990s. This means that most areas of the Baltic Sea have been heavily influenced by anthropogenic pressures prior to the initiation of regular monitoring and it may thus be difficult to determine the reference conditions for the succession based on pristine environmental conditions. Further analysis with data from mostly offshore areas seemed to indicate that in several cases, the deviations from the long-term mean reference growth curves have become less frequent during the last decade than in the 1990s and the early 2000s. This may infer an improvement in the current environmental status.
Due to the lack of confirmed high status waterbodies or historical datasets, the reference seasonal growth curves have been set through observations made after the 1980s and the threshold between good and not-good status is based on expert judgement. To define unit-specific reference conditions, the periods of

www.helcom.fi > Baltic Sea trends > Indicators © HELCOM 10
stability in long-time biomass data were ascertained. This approach was tested in two ways: 1) by calculating 5-year moving averages of standard deviations in yearly total biomass values (Thresholds figure 2), and 2)by using a multiplicative decomposition model, where the values are seasonally adjusted and trends can be seen more clearly (Thresholds figure 3). The two methods resulted in partly different periods of stability, which may be used as reference periods in the evaluation of environmental status. Analysis with datasets from other sea areas will be continued.
The threshold values based on calculations with data points representing reference periods varied from 0.58 (Gdansk Basin) to 0.74 (Eastern Gotland Basin). The average value for open sea areas was 0.67 and 0.65 for coastal waters. Offshore communities might have more coherent responses across the sea than coastal communities that tend to be more isolated and may therefore show little coherence within and among regions (Griffiths et al., 2015). This also means that phytoplankton community structure and timely performance of dominant groups are more predictable in the areas with stable hydrological conditions (e.g. no major freshwater discharges and turbulent mixing). Further work is required for the testing and expansion of suitable values to cover more assessment units within the Baltic Sea.
Thresholds figure 2. Selection of reference period by calculting 5-years moving averages of standard deviations in yearly total biomass (µg l-1) values. The period with lowest variability is indicated between red bars. Test data are based on the Northern Baltic Proper.
300
400
500
600
700
800
900
1990
1991
1992
1993
1994
1995
1996
1997
1998
1999
2000
2001
2002
2003
2004
2005
2006
2007
2008
2009
2010
2011
2012
2013
2014
2015
2016
Biom
ass,
µg
l-1
Northern Baltic Proper

www.helcom.fi > Baltic Sea trends > Indicators © HELCOM 11
Thresholds figure 3. Selection of reference period by decomposition of multiplicative time series. Observed − raw fluctuations in total biomass; seasonal – seasonality effect; random – irregular component in dataset. Trend shows seasonally adjusted periods of stability (within red bars, possible extension of the period is marked with green bar), where the fluctuations are smoothed. This example is based on the data collected from the Northern Baltic Proper.

www.helcom.fi > Baltic Sea trends > Indicators © HELCOM 12
Assessment Protocol This indicator and its threshold values are yet to be commonly agreed in HELCOM.
The indictor is included as a test indicator for the purposes of the 'State of the Baltic Sea' report, and the results are to be considered as intermediate.
Calculations and data requirements
The data required for this indicator are attained by quantitative phytoplankton analysis (cf. HELCOM 2014). The input data required is wet weight biomasses of major functional or dominating phytoplankton groups over a sampling year. Sampling frequency should be at least once per month. The selection of groups may differ between sub-basins or assessment units of the Baltic Sea, and expert judgement based on long-term monitoring data is required to identify the correct and most suitable candidate groups. In all test areas cyanobacteria, auto- and mixo-trophic dinoflagellates, diatoms and the autotrophic ciliate Mesodinium rubrum were selected. In the Eastern Gotland Basin Lithuanian Coastal Waters green algae were included in the analysis as an extra component. As chlorophytes are important in coastal waters of low salinity and their biovolume is also one of the metrics of the German WFD phytoplankton index PPIcw, the use of chlorophytes should be investigated for potential inclusion in assessment purpose (Sagert et al., 2008).
The process of establishing phytoplankton group reference growth curves for marine water bodies was originally described by Devlin et al. (2007). Type- or site-specific seasonal growth curves can be designed for each dominating phytoplankton group:
1) Skewed data is accounted for by the transformation of phytoplankton biomass (x) on a natural log scale (ln x+1);
2) Overall and monthly means and standard deviations are calculated for each functional group over a reference period;
3) Monthly Z scores are calculated as follows:
𝐙𝐙 𝒎𝒎𝒎𝒎𝒎𝒎𝒎𝒎𝒎𝒎 =(𝐌𝐌𝐌𝐌𝐌𝐌𝐌𝐌𝐌𝐌𝐌𝐌𝐌𝐌 𝐦𝐦𝐦𝐦𝐦𝐦𝐌𝐌 − 𝐎𝐎𝐎𝐎𝐦𝐦𝐎𝐎𝐦𝐦𝐌𝐌𝐌𝐌 𝐦𝐦𝐦𝐦𝐦𝐦𝐌𝐌)𝒓𝒓𝒓𝒓𝒓𝒓𝒓𝒓𝒓𝒓𝒓𝒓𝒎𝒎𝒓𝒓𝒓𝒓 𝒑𝒑𝒓𝒓𝒓𝒓𝒑𝒑𝒎𝒎𝒑𝒑
𝐎𝐎𝐎𝐎𝐦𝐦𝐎𝐎𝐦𝐦𝐌𝐌𝐌𝐌 𝐬𝐬𝐌𝐌𝐦𝐦𝐌𝐌𝐬𝐬𝐦𝐦𝐎𝐎𝐬𝐬 𝐬𝐬𝐦𝐦𝐎𝐎𝐝𝐝𝐦𝐦𝐌𝐌𝐝𝐝𝐌𝐌𝐌𝐌𝒓𝒓𝒓𝒓𝒓𝒓𝒓𝒓𝒓𝒓𝒓𝒓𝒎𝒎𝒓𝒓𝒓𝒓 𝒑𝒑𝒓𝒓𝒓𝒓𝒑𝒑𝒎𝒎𝒑𝒑
A positive z-score implies that the observed type and site specific growth curve for a certain month is greater than the mean. And this in turn indicates that the phytoplankton group has grown more in that month than average. A negative score indicates that the observation is less than the mean and the phytoplankton group is missing or constitutes only minor part of biomass in the whole community.
4) Acceptable deviations for monthly means (reference envelopes) are calculated (zmonth±0.5).
The indicator value is calculated:
𝐙𝐙 𝒔𝒔𝒓𝒓𝒎𝒎𝒓𝒓𝒓𝒓 =𝐌𝐌𝐌𝐌𝐌𝐌𝐌𝐌𝐌𝐌𝐌𝐌𝐌𝐌 𝐦𝐦𝐦𝐦𝐦𝐦𝐌𝐌𝒚𝒚𝒓𝒓𝒚𝒚𝒓𝒓 − 𝐎𝐎𝐎𝐎𝐦𝐦𝐎𝐎𝐦𝐦𝐌𝐌𝐌𝐌 𝐦𝐦𝐦𝐦𝐦𝐦𝐌𝐌𝒓𝒓𝒓𝒓𝒓𝒓𝒓𝒓𝒓𝒓𝒓𝒓𝒎𝒎𝒓𝒓𝒓𝒓 𝒑𝒑𝒓𝒓𝒓𝒓𝒑𝒑𝒎𝒎𝒑𝒑
𝐎𝐎𝐎𝐎𝐦𝐦𝐎𝐎𝐦𝐦𝐌𝐌𝐌𝐌 𝐬𝐬𝐌𝐌𝐦𝐦𝐌𝐌𝐬𝐬𝐦𝐦𝐎𝐎𝐬𝐬 𝐬𝐬𝐦𝐦𝐎𝐎𝐝𝐝𝐦𝐦𝐌𝐌𝐝𝐝𝐌𝐌𝐌𝐌𝒓𝒓𝒓𝒓𝒓𝒓𝒓𝒓𝒓𝒓𝒓𝒓𝒎𝒎𝒓𝒓𝒓𝒓 𝒑𝒑𝒓𝒓𝒓𝒓𝒑𝒑𝒎𝒎𝒑𝒑

www.helcom.fi > Baltic Sea trends > Indicators © HELCOM 13
The indicator value is based on the number of data points from the test area which fall within the acceptable deviation range that has been set for each monthly point of the reference growth curve. Percentage-based thresholds are established for each dominating group to determine index values for the assessment of the ecological status:
𝐈𝐈𝐌𝐌𝐬𝐬𝐦𝐦𝐈𝐈 𝐎𝐎𝐦𝐦𝐌𝐌𝐯𝐯𝐦𝐦 𝒚𝒚𝒔𝒔𝒔𝒔𝒓𝒓𝒔𝒔𝒔𝒔𝒎𝒎𝒓𝒓𝒎𝒎𝒎𝒎 𝒑𝒑𝒓𝒓𝒓𝒓𝒑𝒑𝒎𝒎𝒑𝒑 =No. of data points within the reference envelope
𝐎𝐎𝐎𝐎𝐦𝐦𝐎𝐎𝐦𝐦𝐌𝐌𝐌𝐌 𝐌𝐌𝐌𝐌.𝐌𝐌𝐨𝐨 𝐬𝐬𝐦𝐦𝐌𝐌𝐦𝐦 𝐩𝐩𝐌𝐌𝐝𝐝𝐌𝐌𝐌𝐌𝐬𝐬
An R-script has been developed for calculating the indicator; however it has not yet been operationalised.
Assessment units
Currently this indicator is tested in a selection of assessment units. The indicator has the potential to be applied for the entire Baltic Sea, though clear definition of the phytoplankton groups in each assessment unit is required. The set of dominating phytoplankton groups can vary between different sub-basins, for example cyanobacteria do not generally occur among the dominant groups in high salinity areas.
The underlying characteristics vital to the function of this indicator differ between areas of the Baltic Sea due to seasonal and environmental factors, thus derivation of assessment unit specific reference conditions and threshold values is critical. The indicator values may also differ between the coastal and open sea zone within the same sub-basin. Further testing of the indicator will determine the most appropriate assessment scale and currently the aim is to use known characteristics of individual waterbodies to assess status on the largest possible scale.
Tentatively, HELCOM assessment unit Level 3, dividing the Baltic Sea into 17 sub-basins and further into coastal areas is used for testing this indicator.
Data for the open sea units are aggregated from three to eight stations with most regular monitoring covering the whole vegetation period. The number of stations in coastal water units ranges from one (Northern Baltic Proper Swedish Coastal Waters) to eight (Gulf of Riga Latvian Coastal Waters). Due to different hydrological conditions, mainly salinity (5–7 vs. 3–5 PSU), Estonian coastal sea area in the Gulf of Finland is divided into two separate assessment units (western and eastern part). Most of selected stations belong to the current monitoring programs.
The assessment units are defined in the HELCOM Monitoring and Assessment Strategy Annex 4.
www.helcom.fi > Baltic Sea trends > Indicators © HELCOM 14
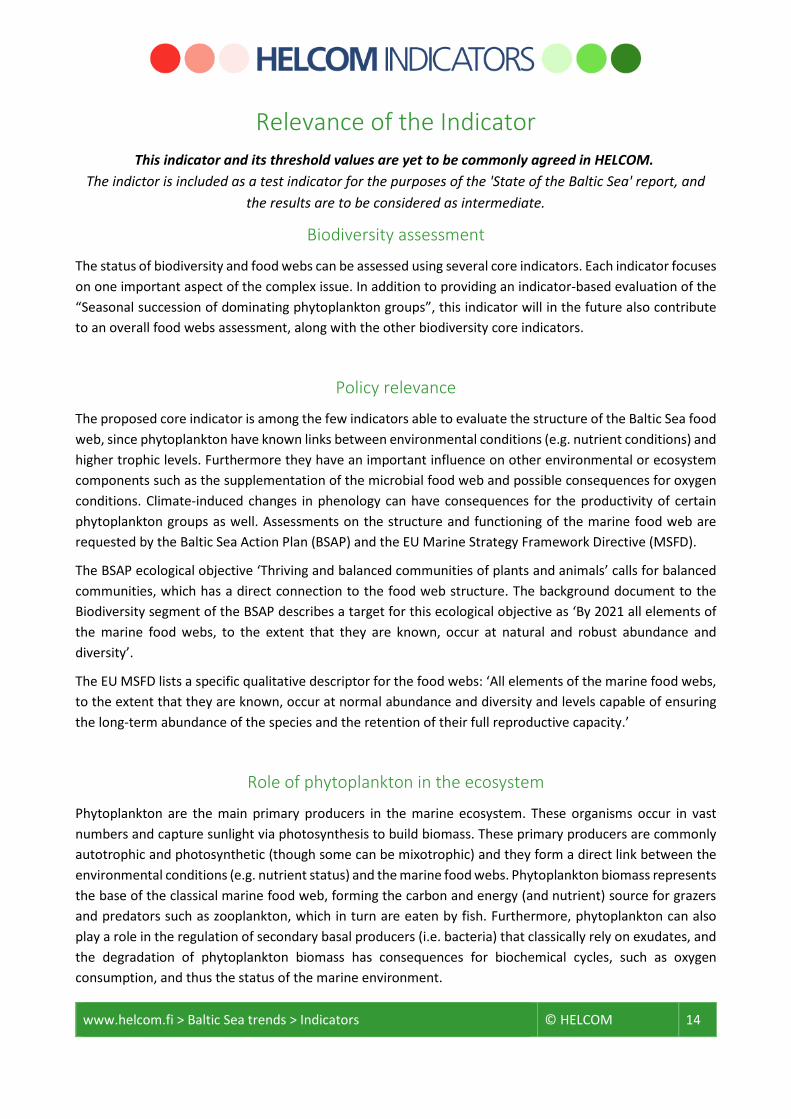
Relevance of the Indicator This indicator and its threshold values are yet to be commonly agreed in HELCOM.
The indictor is included as a test indicator for the purposes of the 'State of the Baltic Sea' report, and the results are to be considered as intermediate.
Biodiversity assessment
The status of biodiversity and food webs can be assessed using several core indicators. Each indicator focuses on one important aspect of the complex issue. In addition to providing an indicator-based evaluation of the “Seasonal succession of dominating phytoplankton groups”, this indicator will in the future also contribute to an overall food webs assessment, along with the other biodiversity core indicators.
Policy relevance
The proposed core indicator is among the few indicators able to evaluate the structure of the Baltic Sea food web, since phytoplankton have known links between environmental conditions (e.g. nutrient conditions) and higher trophic levels. Furthermore they have an important influence on other environmental or ecosystem components such as the supplementation of the microbial food web and possible consequences for oxygen conditions. Climate-induced changes in phenology can have consequences for the productivity of certain phytoplankton groups as well. Assessments on the structure and functioning of the marine food web are requested by the Baltic Sea Action Plan (BSAP) and the EU Marine Strategy Framework Directive (MSFD).
The BSAP ecological objective ‘Thriving and balanced communities of plants and animals’ calls for balanced communities, which has a direct connection to the food web structure. The background document to the Biodiversity segment of the BSAP describes a target for this ecological objective as ‘By 2021 all elements of the marine food webs, to the extent that they are known, occur at natural and robust abundance and diversity’.
The EU MSFD lists a specific qualitative descriptor for the food webs: ‘All elements of the marine food webs, to the extent that they are known, occur at normal abundance and diversity and levels capable of ensuring the long-term abundance of the species and the retention of their full reproductive capacity.’
Role of phytoplankton in the ecosystem
Phytoplankton are the main primary producers in the marine ecosystem. These organisms occur in vast numbers and capture sunlight via photosynthesis to build biomass. These primary producers are commonly autotrophic and photosynthetic (though some can be mixotrophic) and they form a direct link between the environmental conditions (e.g. nutrient status) and the marine food webs. Phytoplankton biomass represents the base of the classical marine food web, forming the carbon and energy (and nutrient) source for grazers and predators such as zooplankton, which in turn are eaten by fish. Furthermore, phytoplankton can also play a role in the regulation of secondary basal producers (i.e. bacteria) that classically rely on exudates, and the degradation of phytoplankton biomass has consequences for biochemical cycles, such as oxygen consumption, and thus the status of the marine environment.

www.helcom.fi > Baltic Sea trends > Indicators © HELCOM 15
In aquatic ecosystems, a hierarchical response across trophic levels is commonly observed. That is to say that, higher trophic levels may show a more delayed response or a weaker response to eutrophication than lower ones. Measurements of biomass (rather than abundance) were used to develop this indicator, since they can readily be translated into understanding biogeochemical cycles, they link to eutrophication, and are considered to give a more accurate depiction of the phytoplankton community. The succession of phytoplankton has a rather regular pattern and the initial event like spring bloom may also influence the formation of summer communities. Firstly, the dominance of either diatoms or dinoflagellates in the spring period determines the rate of sinking organic matter and subsequent oxygen consumption in bottom sediments. The diatoms settle out quickly and may cause oxygen depletion, which may in turn launch the release of phosphorus from sediments. This favours those phytoplankton which benefits from excessive P, especially diazotrophic (nitrogen fixing) cyanobacteria that bloom (e. g. Eilola et al., 2009).
The succession of dominant groups can provide an index that represents a healthy planktonic system, with a natural succession of dominant functional groups throughout the seasonal cycle. Deviations from the normal seasonal cycle, such as a too high or too low biomass, absence or appearance of some dominating groups at unusual time periods of the year, may indicate impairment in environmental status.
Human pressures linked to the indicator
General MSFD Annex III, Table 2a
Strong link “the most important anthropogenic threat
to phytoplankton is eutrophication” Input of nutrients — diffuse sources, point sources, atmospheric deposition.
Input of organic matter — diffuse sources and point sources.
Weak link Biological disturbance
(introduction of non-native species)
The shift in the plankton community is most probably due to complex interactions between warming (climate change impacts), eutrophication and increased top-down pressures due to overexploitation of resources, and the resulting trophic cascades. Eutrophication is commonly noted as being the major driver behind current impacts on the phytoplankton community. A shift in functional groups may affect ecosystem function in terms of the carbon available to higher trophic levels or settling to the sediments. The examination of seasonality shows the broad temporal variability of phytoplankton populations. Succession of dominant groups can potentially provide an index that represents a healthy planktonic system, with a natural progression of dominant functional groups throughout the seasonal cycle. Alterations in the seasonal cycle may be related to nutrient enrichment. Expert judgement must be used when alterations in the seasonal cycle, and their causes, are interpreted.

www.helcom.fi > Baltic Sea trends > Indicators © HELCOM 16
Monitoring Requirements This indicator and its threshold values are yet to be commonly agreed in HELCOM.
The indictor is included as a test indicator for the purposes of the 'State of the Baltic Sea' report, and the results are to be considered as intermediate.
Monitoring methodology
HELCOM common monitoring of the phytoplankton community, the methods for sampling, sample analysis and calculation of carbon biomass are described in general terms in the HELCOM Monitoring Manual (http://www.helcom.fi/action-areas/monitoring-and-assessment/manuals-and-guidelines/phytoplankton-guidelines).
For time-series calculations, it is important to have as regular datasets as possible. At least monthly sampling during the growth period is needed to design reference growth curves. If sampling dates or numbers of samples are very irregularly distributed, monthly means have to be calculated before further analysis. If historical datasets are not available, time-series data should be collected during at least 10 years to include natural interannual variability. The data must represent the upper mixed layer. FerryBox data can be additionally used assuming that that the sampling depth (usually 4−5 m) represents the upper surface layer as the ship creates turbulence when moving.
Current monitoring
Current monitoring is not formalised for this indicator. The indicator is currently being tested using data collated for the described test assessment units. Sufficiently frequent sampling is seldom available through monitoring programs (see also Heiskanen et al., 2016). Moreover, the open sea monitoring activities of many countries have been reduced during the last years. This is in some areas (Gulf of Finland, Northern Baltic Proper) compensated by increasing activities of sampling by FerryBox systems. A more detailed scheme of stations and sampling times of recent monitoring activities can be provided.
This test indicator is operational as:
• National monitoring programs for getting the samples are established. • Samples are taken and processed according to guidelines (HELCOM monitoring manual). • Data are delivered by experts belonging to the HELCOM Phytoplankton Expert Group (PEG) and are
therefore of high quality. • The data are regularly reported and stored in national and international databases (e.g. ICES).
Description of optimal monitoring
The interval of sampling should be regular and the frequency at least once a month during the growth period. In some areas, especially offshore, it can be supported also by FerryBox sampling. For time being, microscopic analysis is part of Ferrybox sampling only in Estonian monitoring program. The time-scale for data sets should

www.helcom.fi > Baltic Sea trends > Indicators © HELCOM 17
be at least 10 years to create type- or site-specific reference growth curves. Some recommendations for spatial resolution have been given recently (Jaanus et al., 2017) and this will be an important consideration when defining the appropriate scale of assessment units monitored.

www.helcom.fi > Baltic Sea trends > Indicators © HELCOM 18
Data and updating This indicator and its threshold values are yet to be commonly agreed in HELCOM.
The indictor is included as a test indicator for the purposes of the 'State of the Baltic Sea' report, and the results are to be considered as intermediate.
Access and use
The data and resulting data products (tables, figures and maps) available on the indicator web page can be used freely given that the source is cited. The indicator should be cited as following:
HELCOM (2018) Seasonal succession of dominating phytoplankton groups. HELCOM core indicator report. Online. [Date Viewed], [Web link].
ISSN 2343-2543
Metadata
Result: Seasonal succession of dominating phytoplankton groups
Data: Seasonal succession of dominating phytoplankton groups
The methods of collection, counting and identification should be unified between all laboratories sharing the same assessment area. Data has been collected directly from the persons responsible for phytoplankton monitoring, no common database was currently used. Currently the HELCOM COMBINE database hosted by ICES does not contain biomass values of dominating groups and is thus unsuitable.
The indicator can be updated either annually or for specific periods (e.g. for certain 6-year assessment periods) to detect reliable trends in seasonal dynamics on dominant phytoplankton groups.

www.helcom.fi > Baltic Sea trends > Indicators © HELCOM 19
Contributors and references This indicator and its threshold values are yet to be commonly agreed in HELCOM.
The indictor is included as a test indicator for the purposes of the 'State of the Baltic Sea' report, and the results are to be considered as intermediate.
Contributors
Andres Jaanus 1, Helena Höglander2, Marie Johansen3, Iveta Jurgensone 4, Janina Kownacka 5, Irina Olenina6, Mario von Weber7, Norbert Wasmund8
1) Estonian Marine Institute, University of Tartu, Estonia 2) Department of Ecology, Environment and Plant Sciences, Stockholm University, Sweden 3) Swedish Meteorological and Hydrological Institute, Gothenburg, Sweden 4) Latvian Institute of Aquatic Ecology, Riga, Latvia 5) National Marine Fisheries Research Institute, Gdynia, Poland 6) Department of Marine Research, Environmental Protection Agency, Lithuania 7) Landesamt für Umwelt, Naturschutz und Geologie (LUNG), Mecklenburg, Germany 8) Leibniz Institute for Baltic Sea Research, Warnemünde, Germany
Archive
This version of the HELCOM core indicator report was published in July 2018:
Seasonal succession of dominating phytoplankton groups HELCOM core indicator 2018 (pdf)
No previous versions of this indicator are currently available.
References
Andersen, J. H., Carstensen, J., Conley, D. J., Dromph, C., Fleming-Lehtinen, V., Gustafsson, B. G., Josefson, A. B., Norkko, A., Villnäs, A. & Murray, C. 2015. Long-term temporal and spatial trends in eutrophication status of the Baltic Sea. Biological Reviews. doi:10.1111/brv.12221
Devlin, M., Best, M., Coates, D., Bresnan, E., O’Boyle, S., Park, R., Silke, J., Cusack, C. & Skeats, J. 2007. Establishing boundary classes for the classification of UK marine waters using phytoplankton communities. Marine Pollution Bulletin 55: 91–103.
HELCOM, 2014. Manual for Marine Monitoring in the COMBINE Programme of HELCOM. Part C, Programme for monitoring of eutrophication and its effects. Annex C-6, Guidelines concerning phytoplankton species composition, abundance and biomass; pp. 285–300. Last updated: 17.1.2014. Available at http://helcom.fi/action-areas/monitoring-and-assessment/manuals-and-guidelines/combine-manual
Jaanus A., Andersson, A., Olenina, I., Toming, K. and Kaljurand, K. 2011. Changes in phytoplankton communities along a north-south gradient in the Baltic Sea between 1990 and 2008. Boreal Environment Research 16 (Suppl. A), 191-208.

www.helcom.fi > Baltic Sea trends > Indicators © HELCOM 20
Jaanus A., I. Kuprijanov, S. Lehtinen, K. Kaljurand and A. Enke, 2017. Optimization of phytoplankton monitoring in the Baltic Sea. Journal of Marine Systems 171, 65-72.
Olenina, I., Hajdu, S., Edler, L., Andersson, A., Wasmund, N., Busch, S., Göbel, J., Gromisz, S., Huseby, S., Huttunen, M., Jaanus, A., Kokkonen, P., Ledaine, I. and Niemkiewicz, E. 2006. Biovolumes and size-classes of phytoplankton in the Baltic Sea. HELCOM Balt.Sea Environ. Proc. 106, 144 pp.
Additional relevant publications
Eilola, K., H. E. Markus Meier & E. Almroth, 2009. On the dynamics of oxygen, phosphorus and cyanobacteria in the Baltic Sea: A model study. Journal of Marine Systems 75: 163–184.
Gowen, R. J., McQuatters-Gollop, A:, Tett, P., Best, M., Bresnan, E., Castellani, C. Cook, K., Forster, R. Scherer, C. and A. Mckinney, 2011. The Development of UK Pelagic (Plankton) Indicators and Targets for the MSFD. A Report of a workshop held at AFBI, Belfast 2-3rd June 2011.
Griffiths, J. R., Hajdu, S., Downing, A. S., Hjerne, O., Larsson, U., Winder, M., 2015. Phytoplankton community interactions and environmental sensitivity in coastal and offshore habitats. Oikos, doi: 10.1111/oik.02405
Heiskanen, A.-S.,Berg, T.,Uusitalo, L.,Teixeira, H.,Bruhn, A., Krause-Jensen, D., Lynam, C.P., Rossberg, A.G., Korpinen, S., Uyarra, M. C. & and Borja, A. (2016). Biodiversity in Marine Ecosystems — European Developments toward Robust Assessments. Frontiers in Marine Science 3:184. doi: 10.3389/fmars.2016.00184.
Irigoien, X., J. Huisman & R. P. Harris, 2004. Global biodiversity patterns of marine phytoplankton and zooplankton. Nature 429: 863–867.
Padisák, J., É. Hajnal, L. Naselli-Flores, M. T. Dokulil, P. Nõges & T. Zohary, 2010. Convergence and divergence in organization of phytoplankton communities under various regimes of physical and biological control. Hydrobiologia 639: 205–220.
Sagert, S., Selig, U. and H. Schubert, 2008. Phytoplanktonindikatoren zur ökologischen Klassifizierung der deutschen Küstengewässer der Ostsee. Rostock. Meeresbiolog. Beitr. 20: 45–69. Tett, P., Carreira, C., Mills, D.K., van Leeuwen, S., Foden, J., Bresnan, E. and Gowen, R.J. (2008). Use of a
Phytoplankton Community Index to assess the health of coastal waters. ICES Journal of Marine Science 161: 1475-1482.
HELCOM core indicator report,
ISSN 2343-2543