Embed Size (px)
Citation preview

Boreal environment research 17: 72–84 © 2012issn 1239-6095 (print) issn 1797-2469 (online) helsinki 28 February 2012
seasonal changes in canopy leaf area index and moDis vegetation products for a boreal forest site in central Finland
miina rautiainen1,*, Janne heiskanen1 and lauri Korhonen2
1) Department of Forest Sciences, P.O. Box 27, FI-00014 University of Helsinki, Finland (corresponding author’s e-mail: [email protected])
2) School of Forest Sciences, P.O. Box 111, University of Eastern Finland, FI-80101 Joensuu, Finland
Received 1 Dec. 2010, final version received 26 May 2011, accepted 26 May 2011
rautiainen, m., heiskanen, J. & Korhonen, l. 2012: seasonal changes in canopy leaf area index and moDis vegetation products for a boreal forest site in central Finland. Boreal Env. Res. 17: 72–84.
Seasonal change in leaf area index (LAI) is highly important in remote sensing of land surface phenology because LAI is a main driving factor of forest reflectance. We present a time series of in situ measurements of boreal forest LAI expanding throughout the growing period from budburst to senescence. We measured the LAI of 20 stands at approximately two-week intervals between mid-May and mid-September in 2009 in southern Finland using hemispherical photography. We compared our field reference data with landscape-level MODIS surface reflectance trajectories, vegetation indices and LAI products. Our results showed that the timing of maximum LAI varies in different forest types. In general, the MODIS-based vegetation indices followed the general trend of spring–summer canopy LAI well. The MODIS LAI product, on the other hand, portrayed well the spring build-up of canopy-level foliage of broadleaved stands but began to decrease earlier in the fall than the ground reference LAI.
Introduction
Land surface phenology is defined as the sea-sonal variation in vegetated land surfaces observed by remote sensing instruments (Friedl et al. 2006, Morisette et al. 2009). To be able to detect phenological phases from remote sensing data sets, phenological variation must be char-acterized by changes in the optical properties of vegetation elements or by changes in structural properties of canopies (e.g., increase in leaf area or canopy closure) that are measurable in the spatial and spectral resolution of satellite images (e.g., Kobayashi et al. 2007, Rautiainen et al. 2009). Only medium to coarse resolution satel-lite images can provide phenological monitor-
ing with global coverage and regularly repeated observations (Cleland et al. 2007, White et al. 2009). Therefore, many traditional phenological variables, such as budburst, flowering, or ripen-ing of berries and fruits, that have only a small effect on canopy reflectance, cannot be readily interpreted from optical satellite images.
Seasonal change in green biomass or leaf area index (LAI) is highly important in remote sensing of land surface phenology because LAI is the main driving factor of forest reflect-ance recorded by space-borne satellite sensors. Hence, LAI offers a quantitative measure with a physical interpretation for monitoring pheno-logical phases from satellite images. LAI is also measurable in the field. A recent intercomparison
Editor in charge of this article: Jaana Bäck

Boreal env. res. vol. 17 • Seasonality of LAI 73
showed that a general problem in the valida-tion of global-scale LAI products is the lack of ground reference data on the seasonal variability of different land surface types (Garrigues et al. 2008), because LAI measurements are typically carried out at the peak of the growing season (e.g. Morisette et al. 2006). Furthermore, infor-mation on both the temporal build-up and senes-cence of foliage are needed for various climate and land surface modeling purposes.
Ganguly et al. (2010) identified high latitude ecosystems as a key biome requiring further investigations in the interpretation of satellite image based phenology metrics and development of operational land cover dynamics (phenology) products. The reasons for this are versatile: in the boreal region, the seasonal monitoring of vegeta-tion using optical satellite images is hindered by a persistent cloud cover, low solar zenith angles as well as the complex structure of coniferous canopies that is difficult to take into account in remote sensing algorithms. Topical problems in remote sensing of seasonal vegetation dynamics of boreal forests are related to defining the onset and end of the growing season, upscaling ground measurements to sensor resolution in heterogene-ous landscapes and eliminating the spectral noise resulting from the presence of late-spring snow.
Previously, seasonal changes in boreal forest LAI have been assessed in the BOREAS project where LAI was measured three times during the growing season in Canadian Jack pine and Black spruce forests (Chen 1996), and in the GEWEX experiment in eastern Siberia where LAI of larch forests was measured four times (Kobayashi et al. 2007). In this case study, we present seasonal in situ measurements of Finnish boreal forest LAI expanding throughout the whole growing period from budburst to early senescence at two-week intervals and representing typical spe-cies composition and a wide range of stand structures. We compare our field reference data with landscape-level MODIS surface reflectance trajectories, spectral vegetation indices and LAI products. In other words, we investigate whether changes in LAI based on field measurements are visible in concurrent coarse resolution satellite images, and if a landscape-level analysis of the phenological cycle of a boreal forest area is fea-sible based on such data sets. Finally, we briefly
discuss potential sources of error in predicting the timing of phenological phases of a boreal forest area using coarse resolution satellite data and hemispherical images.
Material and methods
Study site
Our study site, Hyytiälä, is located in southern Finland (61°50´N, 24°17´E) and belongs to the southern boreal zone. The annual mean tem-perature is 3 °C and precipitation is 700 mm. Dominant tree species are Norway spruce (Picea abies), Scots pine (Pinus sylvestris) and birches (Betula pubescens, Betula pendula). Understory vegetation at the study site is composed of two layers: an upper understory layer (low dwarf shrubs, graminoids, herbaceous species) and a ground layer (mosses, lichens).
The growing season typically begins in early May and senescence occurs in late September. According to the traditional phenological obser-vations (www.metla.fi/metinfo/fenologia/index-en.htm), in 2009 in the region around our study site, the first birch leaves emerged on 13–17 May, reached their maximum size on 10–16 June and turned yellow between 26 September and 3 October. The height growth of Scots pine, on the other hand, began on 8–15 May and was com-pleted by 10–17 July.
In 2009, we selected 20 stands from the Hyytiälä forest area (7 ¥ 7 km) for seasonal LAI measurements (Table 1). The stands represented different age classes (stand age: 25–100 years) and species compositions (Norway spruce, Scots pine, silver and downy birches) that are typi-cal to the southern boreal forest zone. A regular stand inventory was carried out in all the plots to provide background information on the stand structure.
LAI measurements
We estimated LAI, the hemisurface green leaf area per unit area of ground, using hemispherical photography at approximately two-week inter-vals starting from mid-May (day of year, DOY

74 Rautiainen et al. • Boreal env. res. vol. 17
134) and ending in mid-September (DOY 254). Hemispherical images were obtained during standard overcast sky conditions at any time of the day or during clear sky conditions in early morning or late evening (i.e. when the solar elevation angle was smaller than 16°).
We took hemispherical images at twelve points in each stand and applied the sampling scheme recommended by the VALERI (Valida-tion of Land European Remote Sensing Instru-ments, URL: http://www.avignon.inra.fr/valeri) network: a cross with measurement points placed at 4-m intervals on a south–north transect (6 points) and on a west–east transect (6 points). The measurement points were permanently marked with wooden sticks, i.e. the hemispheri-cal images were acquired from the exact same locations throughout the growing season.
The camera used to take the hemispherical images was a Nikon Coolpix 8800 equipped with a FC-E9 fisheye converter. The camera was mounted on a tripod and rotated so that its base was always directed towards the north. The camera was leveled using a bubble level placed on the lens cover. Measurement height (distance
from the ground to the lens) was approximately 1.3 m in forests and 0.5 m in seedling stands. Images were stored in an uncompressed raw image format at the resolution of the CCD sensor (3280 ¥ 2454 pixels). No corrections for possible projection errors of the fisheye converter were applied, i.e. the projection was assumed to be equidistant. We set the aperture of the camera manually while exposure time was determined automatically. The exposure was decreased by one stop to account for the camera’s tendency to overexposure in dense forests (i.e., forests with a high LAI) (Zhang et al. 2005). The exposure time ranged from 1/20 seconds to 8 seconds, depending on the light conditions and the time of the day.
The image data were analyzed using scripts implemented by us in the MATLAB® program-ming environment (MathWorks Inc. 2010). The hemispherical images were thresholded using an edge-detection based algorithm developed by Nobis and Hunziker (2005). This algorithm selects the threshold that maximizes the bright-ness difference between the pixels on the crown and sky sides of the edges, and therefore pro-
Table 1. stand variables of the study stands in hyytiälä.
stand iD Dominant species mean tree height (m) Basal area (m2 ha–1) site type
Broadleaved stands e1 Birch 19.1 11 mesic F1 Birch 13.8 14 mesic U16 Birch 14.0 21 mesic U17 Birch 11.7 27 herb-rich h5 Birch 14.1 21 herb-rich h3 Birch 14.9 11 herb-richconiferous stands a1 scots pine 17.5 25 herb-rich a5 scots pine 18.6 24 mesic D3 scots pine 17.8 21 sub-xeric e7 norway spruce 13.3 32 mesic U26 norway spruce 16.8 25 mesic U27 norway spruce 15.2 21 mesicmixed stands D4 norway spruce 16.5 28 mesic e6 norway spruce 10.2 22 mesic e5 Birch 23.1 27 mesic i2 Birch 11.9 20 herb-rich U19 scots pine 22.9 42 mesic U18 scots pine 16.5 26 sub-xericseedling stands G1 Birch 2.2 1 mesic i4 Birch 2.4 4 mesic

Boreal env. res. vol. 17 • Seasonality of LAI 75
duces consistently similar gap fractions even in different light conditions. However, as one threshold value was used for the entire image, the background sky had to be evenly lit to ensure good performance of the algorithm. After the thresholding, the gap fractions were calculated for concentric rings 0–15°, …, 45–60° as the proportion of sky (white) pixels within each ring.
Finally, LAI was computed from the gap frac-tions for a solid angle extending 60° from zenith using the standard method behind the LAI-2000 Plant Canopy Analyzer (LAI-2000 PCA, Welles and Norman 1991) limited to the uppermost four rings (Li-Cor Inc., Nebraska, USA). We noticed that a smoother time series of LAI was obtained by limiting the analyzed section of the hemispherical images to ±60° from nadir instead of applying ±75° from nadir as done by the com-monly used LAI-2000 PCA instrument (LI-COR, Inc.). An explanation for this could be the use of a single threshold value for the entire image. When the entire image area is evaluated by the thresholding algorithm, the final threshold is an average, and the gap fractions may be biased near the zenith (brightest background) and near the horizon (dim background). The effect of the first ring (0°–15°) on the final LAI is small, but errors in the fifth ring (60°–75°) gap fraction have a considerable influence.
Each image was checked for possible prob-lems (e.g. fuzziness, uneven cloud cover) in order to ensure a good discrimination between the sky and tree crowns while preserving the fine structure of the canopy. A few images were excluded from the analyses due to low quality.
We abbreviate effective canopy LAI obtained through this process as LAIeff. It is called an effective leaf area index (and not a ‘true’ leaf area index) because it does not account for the clumping of foliage.
Satellite data
In the remote sensing part of the study, our aim was to investigate whether changes in LAI based on field measurements are visible in concurrent coarse resolution satellite images. We examined mean values and standard deviations of three Moderate Resolution Imaging Spectroradiom-eter (MODIS, Collection 5) data products for our study area: surface reflectances, vegetation indices (Table 2) and LAI. The data enabled a landscape-level analysis (7 ¥ 7 km) of the phe-nological cycle of a boreal forest area.
First, we examined a time series of MODIS surface reflectance products (MOD09A1, 8-Day composite) which provide estimates of the sur-face spectral reflectances for each reflective MODIS band as it would have been measured at ground level without atmospheric scattering or absorption (i.e. reflectances are corrected for the effects of atmospheric gases and aerosols) (Vermote et al. 1997). The product contains the best possible observation for an 8-day period based on high observation coverage, low view angle, absence of clouds or cloud shadow, and aerosol loading. The spatial resolution of the data is 500 m. Next, we looked at the MODIS veg-etation indices (MOD13Q1, 16-day composite) that include the normalized difference vegetation index (NDVI, based on red and NIR bands) and the enhanced vegetation index (EVI, based on red, NIR and blue bands), and have a spatial reso-lution of 250-m (Huete et al. 2002). In addition, we examined the reduced simple ratio (RSR, based on the red, NIR and SWIR MODIS sur-face reflectances) using similar SWIR band mini-mum and maximum values for the entire growing period. The equations of the vegetation indices are provided in Table 2. Finally, we evaluated against our in situ data the MODIS LAI product
Table 2. spectral vegetation indices (svi’s) applied in this study. [BlUe = surface reflectance factor for moDis band 459–479 nm; reD = surface reflectance factor for moDis band 620–670 nm; nir = surface reflectance factor for moDis band 841–876 nm, and sWir= surface reflectance factor for moDis band 1628–1652 nm.]
vegetation index abbreviation and equation
normalized difference vegetation index nDvi = (nir – reD)/(nir + reD)enhanced vegetation index evi = 2.5[(nir – reD)/(nir + 6reD – 7.5BlUe + 1)]reduced simple ratio rsr = (nir/reD)[(sWirmax – sWir)/(sWirmax – sWirmin)]

76 Rautiainen et al. • Boreal env. res. vol. 17
0
5
10
15
20
25
30
35
90 120 150 180 210 240 270DOY
Sno
w d
epth
(cm
)
0
200
400
600
800
1000
1200
1400
Degree days
(MOD15A2, 8-day composite) which is retrieved from atmospherically corrected bidirectional reflectance factors in the red and NIR channels using a radiative transfer model for vegetation media (Knyazikhin et al. 1998, Yang et al. 2006). The spatial resolution of the data is 1 km.
We screened the quality flags of the products and used only values classified as “best possible results” for land pixels, e.g. for the LAI product we used only main algorithm retrievals without cloud contamination. This reduced the number of observations in the time series but guaranteed better quality data. Another challenge was that direct comparison of in situ LAIeff measure-ments and MODIS data is not possible due to the large difference in spatial scale. Therefore, we upscaled our in situ LAI measurements to a landscape-level LAI estimate using the Finnish CORINE Land Cover 2006 database (CLC2006, 2006). According to the land cover data, our study area is composed of the following forest classes: 2.1% broadleaved forests, 58.4% conif-erous forests, 16.6% mixed forests and 22.9% open areas, seedling stands and clear cuts. First, we classified our stands into groups which cor-respond to the CORINE Land Cover groups (i.e. six broadleaved, six coniferous, six mixed and two seedling stands shown in Table 1). Next, we computed average LAIeff time series for each group. Finally, we calculated a mean landscape-level LAIeff from the averaged in situ measure-ments by weighting each of the time series repre-senting the four forest classes according to their coverage in our 7 ¥ 7-km study area. According to the MODIS land cover classification scheme (Friedl et al. 2010) the study area is classified
mostly as evergreen needleleaf forest (89% of study area).
Results and discussion
Snow melted in the Hyytiälä forests on approxi-mately 25 April 2009 (DOY 115), and the ther-mal growing season (i.e. the date preceded by five consecutive days with daily mean tempera-ture above +5 °C) began on 30 April (DOY 120) (Fig. 1). This was followed by a rapid unfolding and expansion of leaves which occurred between DOY 140 and 150 in broadleaved, mixed and seedling stands (Fig. 2). Throughout the field campaign, fluctuations of 10%–15% in LAIeff were observed in the coniferous stands, espe-cially in the densest stand (Fig. 2B, LAIeff > 3.5). Differences were observed in the timing of maximum LAIeff in the different forest types: in broadleaved and mixed stands maximal leaf area was reached by mid-July (DOY 194), whereas in coniferous and seedling stands foliage growth marginally continued until late August (DOY 238) (Fig. 3). However, one should note that the measurement height was lower in the seedling stands, and the LAIeff estimate also includes understory vegetation growing between the seedlings.
The first measurements (DOY 134–139, Fig. 2) in the broadleaved (deciduous) stands correspond to woody area index (WAI) since no leaves had emerged yet. Thus, based on the measurements, we can estimate a midsummer mean WAI/LAI for the birch stands by taking the ratio of the first measurements and maximum
Fig. 1. Degree days (solid line) and snow depth in forest (dashed line) at the hyytiälä study site as a function of day of year (DoY) in 2009. measure-ments were made at the smear flux tower in the center of the study area.

Boreal env. res. vol. 17 • Seasonality of LAI 77
LAIeff measurements for each stand. Computed this way, the mean WAI/LAI ratio for birch stands is 0.35 ± 0.16 SD. However, we did not apply this woody area correction to the LAIeff estimates, since similar estimates of WAI were not available for the coniferous and mixed stands and because this correction method does not take into account (marginal) height growth of trees during the summer.
Using hemispherical digital photography to measure LAI contains inherently several prob-lems, which have been reviewed by, for example, Jonckheere et al. (2004). Specific issues related to measuring a long time series of canopy LAIeff using the hemispherical images include careful considerations of exposure, weather conditions and image processing methods. Therefore, ensur-ing consistent quality of an image acquisition
and processing chain over a long period is chal-lenging. The irregular fluctuations in our LAIeff time series (Fig. 2) are likely due to measure-ment uncertainty since sudden changes in the canopy structure (e.g. annual needle cycle) are not expected to be very large. Another problem is separating the role of increase in woody and foliage materials in the hemispherical images: especially in young stands, tree height growth (which is a phenological phenomenon itself) may contribute to the decrease in canopy gap frac-tions (i.e. increase in LAIeff) during the summer. Finally, changes in coniferous shoot structure (i.e. changes in needle-to-shoot area ratio, Chen 1996) during the summer may result in biased quantifi-cation of changes in canopy LAI.
According to ground-based observations of the national phenology network (www.metla.fi/
0
1
2
3
4
5
120 150 180 210 240 270DOY
LAI e
ff
E1 F1 U16 U17 H5 H3
0
1
2
3
4
5
120 150 180 210 240 270DOY
LAI e
ff
A1 A5 D3 E7 U26 U27
0
1
2
3
4
5
120 150 180 210 240 270DOY
LAI e
ff
D4 E5 E6 U19 I2 U18
0
1
2
3
4
5
120 150 180 210 240 270DOY
LAI e
ff
G1 I4
A B
C D
Fig. 2. the seasonal course of effective leaf area index (laieff) measured in hyytiälä in 2009 as a function of day of year (DoY). (A) six deciduous stands, (B) six coniferous stands, (C) six mixed coniferous-deciduous stands, and (D) two seedling stands. the symbols indicate different stands.

78 Rautiainen et al. • Boreal env. res. vol. 17
metinfo/fenologia/index-en.htm), in 2009 birches reached full leaf size already in mid-June and con-tinued their height growth until August whereas our in situ LAIeff (which may, on the other hand, also include contributions from height growth) continued to increase approximately from 5% to 8% from mid-June to mid-July (Fig. 3A). This may indicate problems for the use of traditional phenological observations as the validation data for seasonal detection algorithms in remote sens-ing. In other words, well-known phenological variables (e.g. emerging of leaves, flowering, ripening of berries) cannot be readily interpreted from satellite images since remote sensing is based on the interpretation of scattered electro-magnetic radiation, and these variables are not the main driving factors of forest reflectance. Another problematic period is early senescence in late August and early September: indirect opti-cal devices for measuring LAIeff (such as the LAI-
2000 PCA or hemispherical photography) do not detect the loss of green leaf area since the leaves are still attached to the trees even though they have begun to turn yellow. In this case, the use of phenological webcams (Richardson et al. 2007) or continuously monitoring PAR or transmittance sensors placed in the study area would provide valuable ancillary data for interpreting the LAIeff time series and matching it with satellite reflect-ance data. Finally, this also raises a question con-cerning the applicability of LAI as a descriptor of the length of the growing season (or seasonal changes in primary productivity) in boreal for-ests. In deciduous and mixed forests, the begin-ning of the growing season can efficiently be determined through observations of LAI, but in pure coniferous forests, the seasonal course of LAIeff is not dynamic enough to characterize the start of growing season in the spring. Therefore, other indicators, such as remotely sensed changes
0
0.2
0.4
0.6
0.8
1
120 150 180 210 240 270DOY
LAI e
ff/M
ax L
AI e
ff LA
I eff/
Max
LA
I eff
LAI e
ff/M
ax L
AI e
ff LA
I eff/
Max
LA
I eff
0
0.2
0.4
0.6
0.8
1
120 150 180 210 240 270DOY
0
0.2
0.4
0.6
0.8
1
120 150 180 210 240 270DOY
0
0.2
0.4
0.6
0.8
1
120 150 180 210 240 270DOY
A B
C D
Fig. 3. the relative laieff (i.e. laieff at a given DoY divided by the seasonal maximum laieff) obtained from in situ measurements. (A) deciduous stands, (B) coniferous stands, (C) mixed coniferous-deciduous stands, and (D) seedling stands. the error bars show standard deviations. note that relative laieff does not reach one in A–C because the curves show mean values for all stands. i.e. the maximal laieff values were not reached on the same date in all the stands.

Boreal env. res. vol. 17 • Seasonality of LAI 79
in the spectral properties of the vegetation, may have potential in determining growing season length (or seasonal changes in photosynthetic efficiency) also in coniferous forests.
As the first part of detecting seasonal changes in remote sensing data we compared landscape-level LAIeff with MODIS surface reflectances (Fig. 4). Mean surface reflectances in the green (545–565 nm) and SWIR (1628–1652 nm) bands first increased as canopy LAIeff increased during May, then dropped slightly during the stable phase of canopy LAIeff in July (DOY 177–233) and finally increased in August when canopy LAIeff began to gradually decrease. On the other hand, surface reflectances in the red band (620–670 nm) decreased as LAIeff of the canopies increased, and vice versa. Both visible bands displayed a short peak in surface reflectances in early September (DOY 249). The results clearly indicate that LAIeff is not the only factor deter-
mining the seasonal course of forest reflectance. For example, the peak-like changes in MODIS surface reflectances (with the exception of the NIR band) during early June and early Septem-ber could possibly be linked to the rapid ongo-ing changes in either understory or leaf optical properties. However, the standard deviations of the surface reflectances are relatively large, hence making definite conclusions about the reflectance peaks is not possible. Finally, as already noted, the NIR band (841–876 nm) followed both the buildup and decline in canopy foliage relatively tightly. This is logical since NIR reflectance in boreal forests should be mainly driven by canopy structure (e.g., Rautiainen and Stenberg 2005).
Next, we looked at the seasonal trajectories of three spectral vegetation indices (Fig. 5). Previ-ously, based on data obtained during 1986–2006, NDVI-defined trends for onset, end and length of the growing season were noted as reliable in
0
1
2
3
120 150 180 210 240 270
DOY
Land
scap
e LA
I
0
0.01
0.02
0.03
0.04
0.05
RE
D reflectance factor
LAIRED
0
1
2
3
120 150 180 210 240 270DOY
Land
scap
e LA
I
0
0.05
0.10
0.15
0.20
0.25
0.30
NIR
reflectance factor
LAINIR
0
1
2
3
120 150 180 210 240 270
DOY
Land
scap
e LA
I
0
0.01
0.02
0.03
0.04
0.05
0.06
GR
EE
N reflectance factor LAI
GREEN
A B
C
0
1
2
3
120 150 180 210 240 270DOY
Land
scap
e LA
I
0
0.03
0.06
0.09
0.12
0.15
0.18
SW
IR reflectance factor
LAISWIR
D
Fig. 4. landscape-level lai (7 ¥ 7 km) upscaled from in situ measurements and moDis surface reflectances as a function of day of year (DoY). (A) lai and green reflectance (band 4, 545–565 nm), (B) lai and red reflectance (band 1, 620–670 nm), (C) lai and nir reflectance (band 2, 841–876 nm), and (D) lai and sWir reflectance (band 6, 1628–1652 nm).

80 Rautiainen et al. • Boreal env. res. vol. 17
the majority of Fennoscandia due to the high correlations in spring and rather low bias in fall (Karlsen et al. 2009). In our study area, NDVI captured the spring and summer development of canopy LAIeff well. However, it did not react to the decrease in LAI in September and would thus have overestimated the length of the grow-ing period. EVI, on the other hand, followed the general trend of LAIeff well, but exhibited a small peak (unrelated to changes in canopy LAIeff) during early senescence in mid-August. The poor performance of NDVI and EVI in detecting the fall transition may be due to the differences in the greening and yellowing cycle of the understory and overstory which also causes difficulties in applying simple vegetation index techniques to detect the start of season from satellite images (Doktor et al. 2009). The third vegetation index, RSR, captured the timing of both the spring and fall transitions well, but did not depict the stable LAIeff phase during July. Even though none of the vegetation indices performed superiorly over the others in our single-year analysis, RSR followed
the leaf build-up and senescence transitions of boreal forest canopy layers notably well. In the future, if landscape-level imaging spectroscopy data becomes routinely available, applying also narrow-band vegetation indices (e.g. the photo-chemical reflectance index (PRI); Garbulsky et al. 2011) may enable determining the length of the growing period in boreal forests more accurately.
Next, we compared our landscape-level LAI estimates with the MODIS LAI product (Fig. 6). The MODIS LAI portrayed well the spring time build-up of canopy-level foliage in broadleaved and seedling stands (Fig. 6A and D). However, the MODIS LAI values started to decrease a week earlier than field reference LAI. This may be either an artifact due to cloud contamination or temporal spacing of the measurements, or an actual observation due to some birch leaves turn-ing yellow already in August even though the majority turned yellow during September. This would mean that the red surface reflectances used by the MODIS LAI retrieval algorithm started to increase but the leaves still contributed
0
0.2
0.4
0.6
0.8
1
0
1
2
3
90 120 150 180 210 240 270
ND
VI
Land
scap
e LA
I
DOY
LAI
NDVI
0
0.1
0.2
0.3
0.4
0.5
0
1
2
3
90 120 150 180 210 240 270
EV
I
Land
scap
e LA
I
DOY
LAI EVI
0
4
8
12
16
0
1
2
3
90 120 150 180 210 240 270
RS
R
Land
scap
e LA
I
DOY
LAI RSR
A B
C
Fig. 5. landscape-level lai (7 ¥ 7 km) up-scaled from in situ measurements and vegetation indices as a function of day of year (DoY). (A) lai and nDvi (moD13Q1), (B) lai and evi (moD13Q1), (C) lai and rsr (computed from moD09a1).
Boreal env. res. vol. 17 • Seasonality of LAI 81
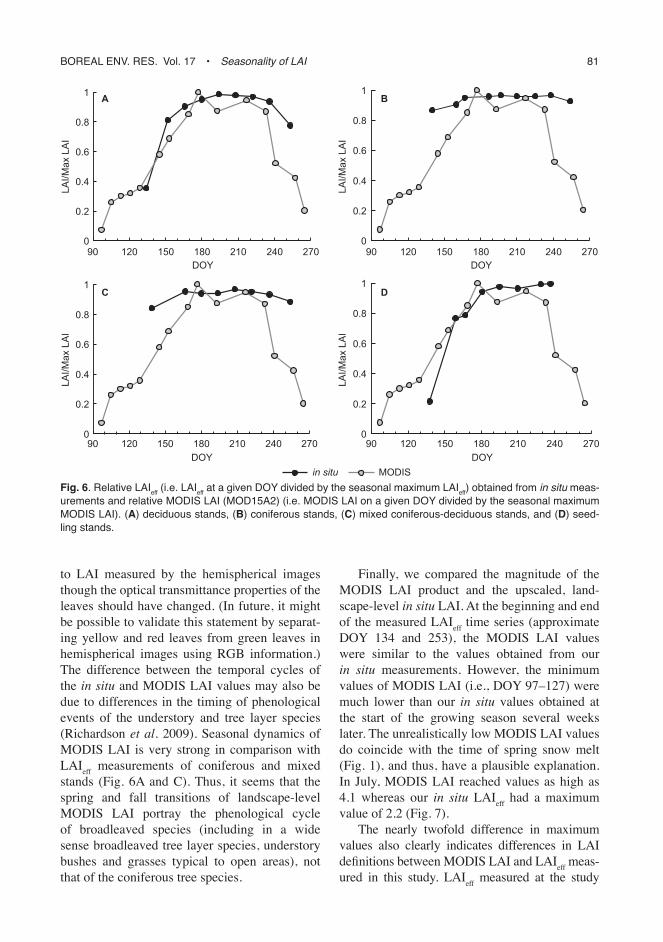
to LAI measured by the hemispherical images though the optical transmittance properties of the leaves should have changed. (In future, it might be possible to validate this statement by separat-ing yellow and red leaves from green leaves in hemispherical images using RGB information.) The difference between the temporal cycles of the in situ and MODIS LAI values may also be due to differences in the timing of phenological events of the understory and tree layer species (Richardson et al. 2009). Seasonal dynamics of MODIS LAI is very strong in comparison with LAIeff measurements of coniferous and mixed stands (Fig. 6A and C). Thus, it seems that the spring and fall transitions of landscape-level MODIS LAI portray the phenological cycle of broadleaved species (including in a wide sense broadleaved tree layer species, understory bushes and grasses typical to open areas), not that of the coniferous tree species.
Finally, we compared the magnitude of the MODIS LAI product and the upscaled, land-scape-level in situ LAI. At the beginning and end of the measured LAIeff time series (approximate DOY 134 and 253), the MODIS LAI values were similar to the values obtained from our in situ measurements. However, the minimum values of MODIS LAI (i.e., DOY 97–127) were much lower than our in situ values obtained at the start of the growing season several weeks later. The unrealistically low MODIS LAI values do coincide with the time of spring snow melt (Fig. 1), and thus, have a plausible explanation. In July, MODIS LAI reached values as high as 4.1 whereas our in situ LAIeff had a maximum value of 2.2 (Fig. 7).
The nearly twofold difference in maximum values also clearly indicates differences in LAI definitions between MODIS LAI and LAIeff meas-ured in this study. LAIeff measured at the study
0
0.2
0.4
0.6
0.8
1
90 120 150 180 210 240 270DOY
LAI/M
ax L
AI
0
0.2
0.4
0.6
0.8
1
90 120 150 180 210 240 270DOY
LAI/M
ax L
AI
0
0.2
0.4
0.6
0.8
1
90 120 150 180 210 240 270DOY
LAI/M
ax L
AI
0
0.2
0.4
0.6
0.8
1
90 120 150 180 210 240 270DOY
LAI/M
ax L
AI
in situ MODIS
A B
C D
Fig. 6. relative laieff (i.e. laieff at a given DoY divided by the seasonal maximum laieff) obtained from in situ meas-urements and relative moDis lai (moD15a2) (i.e. moDis lai on a given DoY divided by the seasonal maximum moDis lai). (A) deciduous stands, (B) coniferous stands, (C) mixed coniferous-deciduous stands, and (D) seed-ling stands.

82 Rautiainen et al. • Boreal env. res. vol. 17
sites did not account for clumping of foliage (i.e. spatial correlation of foliage at shoot and crown levels) whereas in MODIS LAI, clumping is accounted for to some extent. Compensating in situ LAIeff for various levels of clumping would increase the LAI estimates in coniferous stands (Chen 1996). As shoot-level clumping may also change throughout the summer due to the matu-ration or hardening of new shoots, using a fixed value (i.e. same value for the whole growing period) to correct for it would not lead to a new interpretation of the results. Nevertheless, for the study area, the minimum MODIS LAI values are rather small considering the large coverage of coniferous forests with relatively small sea-sonal changes in LAI. Thus, difference in mag-nitude between MODIS LAI and in situ LAIeff cannot be explained by clumping alone. This agrees well with previous MODIS LAI validation studies in evergreen coniferous sites (Yang et al. 2006, Garrigues et al. 2008). Another source of difference in the LAI definitions is that MODIS LAI includes both overstory and understory LAIs. Even though understory vegetation may fortify the seasonal dynamics of forest reflectance trajec-tories obtained from satellite images, it is difficult to measure LAI of a boreal forest understory plot repeatedly with non-destructive sampling meth-ods. For example, measurement of boreal-forest understory LAI with common indirect measure-ment techniques (e.g. LAI-2000 Plant Canopy Analyzer or hemispherical digital photography) is not possible due to the tight structure and low height of the understory. The understory layer in a well-drained boreal forest in Finland is composed of two layers: an upper understory layer (low dwarf shrubs, graminoids, herbaceous species) and a ground layer (mosses, lichens). As bare soil is rarely visible, downward-looking hemispherical photos cannot be used to determine understory LAIeff. We suggest that the noteworthy seasonality of boreal forest understory could, in the future, be included in phenological monitoring through changes in its reflectance properties (e.g. NDVI or other vegetation indices) throughout the growing season using algorithms developed for the extrac-tion of understory reflectance from multiangular satellite data (Pisek et al. 2010).
Upscaling in situ LAIeff measurements to the level of satellite vegetation products inher-
ently contains many potential sources of error. A central question is the representativeness of sampled ground plots — how well they describe the spatial heterogeneity of the landscape, and in the case of forests, do they represent in right proportions the different age and management classes of the various forest types. For example, in this study, twenty stands cannot cover the wide range of structures present in a 7 ¥ 7-km landscape. On the other hand, repeatedly per-forming optical LAI measurements (which are weather dependent) for more than twenty stands at a fairly dense temporal interval would require a large research team and exceptional sky condi-tions. Thus, the number of study stands under intensive LAI monitoring will always remain smaller than could be regarded as the necessary number of stands to cover all the forest types in a landscape. Using high resolution satellite images as an intermediate step to upscale to the level of MODIS products (e.g. Wang et al. 2004, Morisette et al. 2006) is a possible solution to improve landscape-level LAI estimates. How-ever, in such an upscaling approach, it would be preferable to have a time series of high resolu-tion satellite images, which, on the other hand, is challenging for a study site located in the boreal region due to the frequent presence of clouds.
Conclusions
Our results showed that the timing of maximum
Fig. 7. comparison of mean landscape-level lai up-scaled from in situ measurements and mean moDis lai (moD15a2) as a function of day of year (DoY).
0
1
2
3
4
5
90 120 150 180 210 240 270DOY
Land
scap
e LA
I
in situMODIS

Boreal env. res. vol. 17 • Seasonality of LAI 83
LAIeff varies in different boreal forest types: in broadleaved and mixed stands maximal leaf area was reached by mid-July whereas in conifer-ous and seedling stands foliage growth margin-ally continued until late August. This unsyn-chronized timing of phenophases in fragmented and heterogeneous forest landscapes (typical to northern Europe) is a challenge for interpret-ing satellite observed land surface phenologies and for spatial upscaling of in situ LAIeff time series. MODIS-based spectral vegetation indices followed the general trend of spring–summer canopy LAI well, but only RSR captured the timing of both the spring and fall transitions. The MODIS LAI product portrayed well the spring time canopy-level foliage build-up of broad-leaved and seedling stands but began to decrease earlier in the fall than the field reference values. Future studies should focus on (1) understanding the driving factors of boreal forest reflectances during autumn senescence, (2) quantifying the role and timing of the phenological (reflectance) cycles of the most abundant boreal understory species, and (3) developing a better method for detecting the start and end of growing period in conifer-dominated areas.
Acknowledgements: We thank Eeva Bruun (Department of Forest Sciences, University of Helsinki) for field work, Petri Keronen (Department of Physical Sciences, University of Helsinki) for providing the meteorological data for our study site, and Pauline Stenberg and Matti Mõttus for scientific collaboration during the field campaign. This study was funded by Emil Aaltonen Foundation, University of Helsinki Research Funds, Academy of Finland, and Finnish Graduate School in Forest Sciences.
References
Brown L., Chen J.M., Leblanc S.G. & Cihlar J. 2000. A shortwave infrared modification to the simple ratio for LAI retrieval in boreal forests: an image and model analysis. Remote Sensing of Environment 71: 16–25.
Chen J. 1996. Optically-based methods for measuring sea-sonal variation of leaf area index in boreal conifer stands. Agricultural and Forest Meteorology 80: 135–163.
CLC2006 Finland 2006. Finnish Corine 2006-project: final technical report. Finnish Environment Institute, Hel-sinki.
Cleland E., Chuine I., Menzel A., Mooney H. & Schwartz M. 2007. Shifting plant phenology in response to global change. Trends in Ecology and Evolution 22: 357–365.
Eklundh L., Hall K., Eriksson H., Ardö J. & Pilesjö P. 2003. Investigating the use of Landsat thematic mapper data for estimation of forest leaf area index in south-ern Sweden. Canadian Journal of Remote Sensing 29: 349–362.
Friedl M., Henebry G., Reed B., Huete A., White M., Morisette J., Nemani R., Zhang X. & Myneni R. 2006. Land surface phenology NASA white paper. Available at http://landportal.gsfc.nasa.gov/Documents/ESDR/Phe-nology_Friedl_whitepaper.pdf.
Friedl M., Sulla-Menashe D., Tan B., Schneider A., Ram-ankutty N., Sibley A. & Huang X. 2010. MODIS Col-lection 5 global land cover: algorithm refinements and characterization of new datasets. Remote Sensing of Environment 114: 168–182.
Ganguly S., Friedl M., Tan B., Zhang X. & Verma M. 2010. Land surface phenology from MODIS: characterization of the Collection 5 global land cover dynamics product. Remote Sensing of Environment 114: 1805–1816.
Garbulsky M., Peñuelas J., Gamon J., Inoue Y. & Filella Y. 2011. The photochemical reflectance index (PRI) and the remote sensing of leaf, canopy and ecosystem radiation use efficiencies: a review and meta-analysis. Remote Sensing of Environment 115: 281–297.
Garrigues S., Laxaze R., Baret F., Morisette J., Weiss M., Nickeson J., Fernandes R., Plummer S., Shabanov N., Myneni R., Knyazikhin Y. & Yang W. 2008. Validation and intercomparison of global leaf area index products derived from remote sensing data. Journal of Geophysi-cal Research 113, G02028, doi:10.1029/2007JG000635.
Huete A., Didan K., Miura T., Rodriguez E.P. Gao, X. & Fer-reira L.G. 2002. Overview of the radiometric and bio-physical performance of the MODIS vegetation indices. Remote Sensing of Environment 83: 195–213.
Jonckheere I., Fleck S., Nackaerts K., Muys B., Coppin P., Weiss M. & Baret F. 2004. Review of methods for in situ LAI determination. Part I: Theories, sensors and hemi-spherical photography. Agricultural and Forest Meteor-ology 121: 19–35.
Karlsen S.-R., Hogda K., Wielgolaski F., Tolvanen A., Tomervik H., Poikolainen J. & Kubin E. 2009. Growing-season trends in Fennoscandia 1986–2006 determined from satellite and phenology data. Climate Research 39: 275–286.
Knyazikhin Y., Martonchik J., Myneni R., Diner D. & Run-ning S. 1998. Synergistic algorithm for estimating veg-etation canopy leaf area index and fraction of absorbed photosynthetically active radiation from MODIS and MISR data. Journal of Geophysical Research D103: 32257–32276.
Kobayashi H., Suzuki R. & Kobayashi S. 2007. Reflectance seasonality and its relation to the canopy leaf area index in an eastern Siberian larch forest: multi-satellite data and radiative transfer analysis. Remote Sensing of Envi-ronment 106: 238–252.
Mathworks Inc. 2010. MATLAB — The language of techni-cal computing. Available at http://www.mathworks.com/products/matlab/.
Morisette J., Privette J., Baret F., Myneni R., Nickeson J., Garrigues S., Shabanov N., Fernandes R., Leblanc S.,

84 Rautiainen et al. • Boreal env. res. vol. 17
Kalacska M., Sanchez-Azofeifa G., Chubey M., Rivard B., Stenberg P., Rautiainen M., Voipio P., Manninen T., Pilant D., Lewis T., Iiames T., Colombo R., Meroni M., Busetto L., Cohen B., Turner D., Warner E. & Petersen G. 2006. Validation of global moderate resolution LAI Products: a framework proposed within the CEOS Land Product Validation subgroup. IEEE Transactions on Geoscience and Remote Sensing 44: 1804–1817.
Morisette J., Richardson A., Knapp A., Fisher J., Graham E., Abatzoglou J., Wilson B., Breshears D., Hanebry G., Hanes J. & Liang L. 2009. Tracking the rhythm of the seasons in the face of global change: phenological research in the 21st century. Frontiers in Ecology and Environment 7: 253–260.
Nobis M. & Hunziker U. 2005. Automatic thresholding for hemispherical canopy-photographs based on edge detect-ing. Agricultural and Forest Meteorology 128: 243–250.
Pisek J., Chen J., Miller J., Freemantle J., Peltoniemi J. & Simic A. 2010. Mapping forest background in a boreal region using multiangle Compact Airborne Spectro-graphic Imager data. IEEE Transactions on Geoscience and Remote Sensing 48: 499–510.
Rautiainen M., Nilson T. & Lükk T. 2009. Seasonal reflect-ance trends of hemiboreal birch forests. Remote Sensing of Environment 113: 805–815.
Rautiainen M. & Stenberg P. 2005. Application of photon recollision probability in simulating coniferous canopy reflectance. Remote Sensing of Environment 96: 98–107.
Richardson A., Jenkins J., Braswell B., Hollinger D., Ollinger S. & Smith M.-L. 2007. Use of digital webcam images to track spring green-up in a deciduous broadleaf forest. Oecologia 152: 323–334.
Richardson A. & O’Keefe J. 2009. Phenological differences between understory and overstory: a case study using the long-term Harvard Forest records. In: Noormets A. (ed.), Phenology of ecosystem processes, Springer Science +
Business Media, pp. 87–117.Vermote E.F., El Saleous N.Z., Justice C.O., Kaufman Y.J.,
Privette J., Remer L., Roger J.C. & Tanré D. 1997. Atmospheric correction of visible to middle infrared EOS-MODIS data over land surface, background, opera-tional algorithm and validation. Journal of Geophysical Research 102(D14): 17131–17141.
Wang Y., Woodcock C.E., Buermann W., Stenberg P., Voipio P., Smolander H., Häme T., Tian Y., Hu J., Knyazikhin Y. & Myneni R.B. 2004. Evaluation of the MODIS LAI algorithm at a coniferous forest site in Finland. Remote Sensing of Environment 91: 114–127.
Welles J. & Norman J. 1991. Instrument for indirect meas-urement of canopy architecture. Agronomy Journal 83: 818–825.
White M., Beurs K., Didan K., Inouyes D., Richardson A., Jensen O., O’Keefe J., Zhnag G., Nemani R., van Lee-weun W., Brown J., Wit A., Schaepman M., Lin X., Det-tinger M., Bailey A., Kimball J., Schwartz M., Baldocchi D., Lee J. & Lauenroth W. 2009. Intercomparison, inter-pretation, and assessment of spring phenology in North America estimated from remote sensing for 1986–2006. Global Change Biology 15: 2335–2359.
Yang W., Shabanov N., Huang D., Wang W., Dickinson R., Nemani R., Knyazikhin Y. & Myneni R. 2006. Analysis of leaf area index products from combination of MODIS Terra and Aqua data. Remote Sensing of Environment 104: 297–312.
Zhang Y., Chen J.M. & Miller J.R. 2005. Determining digital hemispherical photograph exposure for leaf area index estimation. Agricultural and Forest Meteorology 133: 166–181.
Zhang X., Friedl M., Schaaf C., Strahler A., Hodges J., Gao F., Reed B. & Huete A. 2003. Monitoring vegetation phenology using MODIS. Remote Sensing of Environ-ment 84: 471–475.