Embed Size (px)
Citation preview

6.2. Sea level variability and trends in the Canary Current Large Marine Ecosystem
The report Oceanographic and biological features in the Canary Current Large Marine Ecosystem and its
separate parts are available on‐line at: http://www.unesco.org/new/en/ioc/ts115.
The bibliography of the entire publication is listed in alphabetical order on pages 351‐379. The bibliography
cited in this particular article was extracted from the full bibliography and is listed in alphabetical order at
the end of this offprint, in unnumbered pages.
ABSTRACT
This article describes different aspects of sea level variability for the Canary Current Large Marine
Ecosystem (CCLME) based on previous publications and existing data from both tide gauges (mainly from
the Canary Islands, due to the lack of information in the African coastline) and satellite altimeter. An
increase of the rate of mean sea level rise since the 1990s is found from tide gauge data, which is coherent
with global studies. The uncertainty of these trends is addressed by comparison with nearby altimetry data,
revealing a general high correlation but a significant difference in the trend. The latter should be further
explored and complemented with monitoring the vertical land movement at the tide gauges in the future.
Analysis of the spatial variations of sea level variability and trends in the CCLME is performed from
altimetry data: confirmation is found of the main oceanographic features in the region as well as larger
trends of mean sea level since 1992 in the southern part of the domain.
Keywords: Sea level rise ∙ Trends ∙ Regional variability ∙ Spatial patterns ∙ Canary Current Large Marine
Ecosystem ∙ Northwest Africa
For bibliographic purposes, this article should be cited as:
Pérez‐Gómez, B., Álvarez‐Fanjul, E., Marcos, M., Puyol, B.
and García, M. J. 2015. Sea level variability and trends in
the Canary Current Large Marine Ecosystem. In:
Oceanographic and biological features in the Canary
Current Large Marine Ecosystem. Valdés, L. and
Déniz‐González, I. (eds). IOC‐UNESCO, Paris. IOC
Technical Series, No. 115, pp. 309‐320. URI:
http://hdl.handle.net/1834/9197.
The publication should be cited as follows:
Valdés, L. and Déniz‐González, I. (eds). 2015.
Oceanographic and biological features in the Canary
Current Large Marine Ecosystem. IOC‐UNESCO, Paris. IOC
Technical Series, No. 115: 383 pp. URI:
http://hdl.handle.net/1834/9135.
(IOC/2015/TS/115Rev./6.2)

IOC TECHNICAL SERIES, No. 115, pp. 309‐320. URI: http://hdl.handle.net/1834/9197. 2015
309
SEA LEVEL VARIABILITY AND TRENDS IN THE CANARY CURRENT
LARGE MARINE ECOSYSTEM
Begoña PÉREZ‐GÓMEZ1, Enrique ÁLVAREZ‐FANJUL1, Marta MARCOS2, Bernat PUYOL3 and María Jesús
GARCÍA4
1 Puertos del Estado. Spain
2 Instituto Mediterráneo de Estudios Avanzados. Spain
3 Instituto Geográfico Nacional. Spain
4 Instituto Español de Oceanografía. Spain
6.2.1. INTRODUCTION
Sea level rise is one of the most alarming consequences of global warming and a threat to coastal
settlements in several parts of the world. Caused by thermal expansion of the water and by the melting of
glaciers and ice sheets, global sea level rise has accelerated from 1.2‐1.5 mm yr‐1 during last century
(Church and White, 2011; Church et al., 2013; Hay et al., 2015) to a present day rate of 3.2 mm yr‐1 for the
last 20 years (Merrifield et al., 2009). Regional and local deviations from these global values are, however,
known to be important and probably the most relevant information for practical issues. Long‐term mean
sea level changes are derived from the around 120 coastal tide gauges in the world with more than 80
years of data (Holgate et al., 2013). Unfortunately these are not evenly distributed and there is a lack of
reliable long time series in several parts of the world, such as the African coastline. This problem can be
partly overcome thanks to data recovery efforts (e.g. Marcos et al., 2011; Wöppelmann et al., 2014; Talke
et al., 2014) and sea level hindcasts carried out with numerical models with realistic forcing (e.g. OCCAM:
Coward et al., 2005; SODA: Carton and Giese, 2008). On the other hand the amount of sea level data
increased significantly during the last two decades thanks to the densification of the tide gauge networks
(including instrumental, maintenance protocols and quality processing improvements) and to the advent of
satellite altimetry. It must be noted also that vertical land movements may affect coastal sea level
observations and should be considered for any sea level study based on tide gauges. Continuous Global
Positioning System (CGPS) measurements are able to monitor their vertical motion; however, they are not
yet available at all the coastal stations and, if so, their time length is often too short.
Superimposed to the long‐term trends in mean sea level, decadal and interannual variability related to
changes of the oceanographic and meteorological forcing are also present. Understanding these changes is
critical for a precise knowledge of the causes of observed decadal to multidecadal variations and trends in
mean sea level, and their spatial patterns will provide insight into their local influence and/or their
propagation.
This article describes these basic aspects of sea level variability for the Canary Current Large Marine
Ecosystem region (hereafter CCLME), based on previous publications and existing data from both tide
gauges and satellite altimeter. In addition to the temporal and spatial variations of mean sea levels, the
evolution of extreme events and the observed relation between altimetry (open waters) and tide gauge
data (relative coastal sea level) will be addressed. Two analyses are presented: the first one corresponds to
the entire long period for which tide gauge observations are available in the region, starting at the

Pérez‐Gómez, B., Álvarez‐Fanjul, E., Marcos, M., Puyol, B. and García, M. J. Sea level variability and trends in the CCLME
310
beginning of the 20th century; the second, more detailed thanks to the larger availability of measurements,
corresponds with the so‐called altimetric period (1992 onwards). During this second time span, altimetry
data and new tide gauges from the Puertos del Estado (PdE) REDMAR network are also available, increasing
our capability of diagnoses. In addition an uncertainty analysis is carried out by comparing the
measurements from the two independent data sources available for this second period.
6.2.2. DATA SOURCES AND METHODS
6.2.2.1. Data sources
The results presented in this article will be based on tide gauge and altimetry data, as there are no
regionalized hindcasts of sea level that cover the CCLME region.
The tide gauges are listed in Table 6.2.1, together with their location, period of operation and institution to
which they belong. Note that tide gauges are often located at the same harbour, although with different
time spans.
Table 6.2.1. Tide gauge stations employed in this article (also displayed in Figure 6.2.4). IEO: Spanish
Institute of Oceanography, PdE: Puertos del Estado, IGN: Spanish National Geographic Institute, UHSLC:
University of Hawaii Sea Level Center, IH: Instituto Hidrográfico (Portugal). Those with longest historical
records are shaded in grey (from IEO and IGN mainly). New tide gauges from PdE since 1992 (REDMAR
network) shaded in blue. White background: stations where trends are not presented: REDMAR stations
with shorter records and Dakar and Porto Grande, the only stations from other countries in the CCLME with
monthly means found in the PSMSL.
Station Latitude Longitude Institution Country Data availability
Bonanza 36.800°N 6.333°W PdE Spain 1992‐2013
Cádiz 36.540°N 6.286°W IEO Spain 1900‐2013
Tarifa 36.009°N 5.603°W IEO Spain 1943‐2012
La Palma I 28.672°N 17.768°W IEO Spain 1949‐2013
El Hierro 27.780°N 17.900°W PdE Spain 2004‐2013
La Gomera 28.088°N 17.108°W PdE Spain 2006‐2013
Tenerife I 28.483°N 16.233°W IGN Spain 1927‐2012
Tenerife II 28.483°N 16.233°W PdE Spain 1992‐2013
Las Palmas I 28.147°N 15.407°W IEO Spain 1950‐2013
Las Palmas II 28.150°N 15.330°W PdE Spain 1992‐2013
Fuerteventura 28.500°N 13.850°W PdE Spain 2004‐2013
Arrecife I 28.950°N 13.567°W IEO Spain 1949‐2012
Arrecife II 28.900°N 13.530°W PdE Spain 2008‐2013
Dakar 14.683°N 17.417°W UHSLC Senegal 1992‐2012
Porto Grande 16.883°N 25.000°W IH Cape Verde 1990‐1995

IOC TECHNICAL SERIES, No. 115, pp. 309‐320. URI: http://hdl.handle.net/1834/9197. 2015
311
According to the records of the Permanent Service of Mean Sea Level (PSMSL:
http://www.psmsl.org/data/obtaining/map.html, accessed on 15 January 2015), there are monthly values
available also for Dakar (Senegal) and Porto Grande (Cape Verde), but in both cases the time series is very
short and with important gaps. Unfortunately there is a lack of long time series of sea level data along the
African coast.
Another relevant source of information is the altimeter, restricted to the last two decades, but providing
spatial coverage of sea level variability in open waters. Use will be made, in particular, of Aviso Mean Sea
Level Anomaly (MSLA) maps, a multi‐mission product based on the combination of up to four different
satellite altimeters at a given time (Topex‐Poseidon, Jason‐1, Jason‐2, Envisat and GFO) that consists of sea
surface heights computed with respect to a seven year mean in a 1/3⁰ resolution grid (AVISO‐CLS, 2014).
6.2.2.2. Methodology
Mean sea level analysis will be based on monthly mean sea levels from tide gauges and altimetry. Monthly
mean sea levels from the Spanish networks (REDMAR, IEO, IGN) are routinely computed following
international recommendations, and distributed through their web sites and/or the PSMSL. The REDMAR
time series are the result of a recent new quality control designed to generate a unique product at each
harbour based on the old (acoustic) and the new (radar) tide gauges, after the upgrade of the whole
REDMAR network since 2007 (Pérez‐Gómez et al., 2014). For Tenerife I (IGN) and Cádiz (IEO) new historical
time series were constructed and analysed in detail by Marcos et al. (2011) and Marcos et al. (2013)
respectively, providing the longest records in the CCLME. We summarize here the main conclusions of
these relevant data archaeology publications, unique for this region and an important contribution to the
global coastal sea level data set during the 20th century.
The Aviso MSLA gridded product has all the environmental and instrumental corrections applied, including
the inverse barometer and higher frequency meteorological effects. This includes the DAC (Dynamic
Atmospheric Correction) produced by CLS Space Oceanography Division using the Mog2D model from
Legos, and distributed by Aviso, with support from CNES: http://www.aviso.altimetry.fr/ (accessed on 15
January 2015). The DAC correction was used as provided by Aviso, in a global grid of 1/4⁰ and added to the
MSLA maps for direct tide gauge and altimeter comparisons. The altimetry data consist of weekly values
that have been averaged to monthly means.
The results and discussion will be separated into two periods: a) long‐term mean sea level changes,
including the 20th century, mostly based on Tenerife and Cádiz above mentioned works and; b) 1992‐2013
period (last two decades, also called the altimetry‐period), when more information from the REDMAR
network and the altimetry missions will allow a better understanding of recent observations and their
spatial patterns for the region. Results for the latter are a particularization of Pérez‐Gómez (2014) for the
area of interest. In spite of the short time series in this case, these data may be crucial to confirm the
mentioned recent sea level rise acceleration and its magnitude in the CCLME region. Also based on the
REDMAR network, the seasonal cycle, mean sea level anomalies and the evolution of extremes for this
latter period (based on the analysis of the percentile time series following the methodology employed by
Woodworth and Blackman, 2004) will be shown.
Finally, the relation between tide gauges and altimetry will also be presented for the REDMAR stations.
Taking into account that tide gauges are not corrected for meteorological effects, the DAC correction was

Pérez‐Gómez, B., Álvarez‐Fanjul, E., Marcos, M., Puyol, B. and García, M. J. Sea level variability and trends in the CCLME
312
added to MSLA altimetry maps. Correlations, root mean square errors and trends of the difference
between tide gauges and altimetry series will therefore be presented. This comparison will serve to analyse
the uncertainties on the results derived from two very different data sets.
6.2.3. RESULTS AND DISCUSSION
6.2.3.1. Long‐term trends from tide gauges
One of the main problems for assessment of sea level changes for the last century is the limited number of
consistent long time series. Tide gauges are in operation since the end of 19th century, with changing
technologies, locations inside the harbours, datum references, etc. Recovery of these historical data is a
challenging and important task for present‐day climate related sea level research. Observed trends for the
longest records in the CCLME region are compiled in Table 6.2.2 (a), their value depending strongly on the
time period. For Cádiz and Tenerife, as already mentioned, a detailed study after historical data recovery
was performed in recent years. Details can be consulted in Marcos et al. (2011) and Marcos et al. (2013),
respectively. In the latter work, Tenerife I data, from 2000 onwards, are actually from Tenerife II. Historical
records of the IEO stations in Tarifa, Las Palmas, Arrecife and Santa Cruz de la Palma were first recovered
and analysed by Fenoglio‐Marc and Tel (2010), although datum connection between the periods 1949‐1976
and 1996‐2013 at Santa Cruz de la Palma, and between 1949‐1990 and 1991‐2014 at Las Palmas, remain
uncertain due to data gaps and changes of location. The IEO has revisited these trends for the present work
with the last years of data.
Recently recovered long term tide gauge data at Cádiz (Marcos et al., 2011) reveal that the rate of sea level
rise was 1.0 0.2 mm yr‐1 during the 20th century, a value lower than the accepted globally averaged sea
level rise. The observed sea level trend in Tenerife I is higher with a value of 2.09 0.04 mm yr‐1 (Marcos et
al., 2013) for the period 1927‐2012. These trends are not affected, according to these publications, by land
movements so they would reflect absolute sea level rise. However, as they are computed for different
periods they are not directly comparable (the trend value obtained for the period 1927‐2000 in Tenerife I is
1.9 ± 0.1 mm yr‐1). Other values in Table 6.2.2 yield to other interesting facts: sea level trend in Cádiz since
1960 (based on the data of the most modern IEO tide gauge, installed that year) becomes significantly
larger: 3.77 0.64 mm yr‐1 (IEO, without GPS correction, 3.80 0.35 mm yr‐1, as published by SONEL
(http://www.sonel.org/‐Sea‐level‐trends‐.html, accessed on 20 January 2015, with GPS correction); the
differences on the GPS velocities of the station reported by the two sources of information do not account
for this significant increase of the trend. It must be noted that Marcos et al. (2011) found some problems
with this tide gauge at the beginning of the record though, that could contaminate the final trend.
The other stations with long time series in Table 6.2.2 started their operation in the 1940’s (IEO stations):
Tarifa I, La Palma I, Las Palmas I and Arrecife I. We computed the relative sea level trends for these time
series finding significantly low values (below 1 mm yr‐1) at all of them.
Although with no detailed knowledge of the local land vertical movements at all the stations, we do have
estimations of the contribution of the Glacial Isostatic Adjustment (GIA) to these movements, from model
estimates such as the ICE‐5G Peltier model (Peltier, 2004). This model indicates that the land would be
ascending due to GIA at the Gulf of Cádiz (‐0.19 mm yr‐1at Bonanza, for example) and sinking in most of the
Canary Islands (0.09 mm yr‐1, 0.05 mm yr‐1 and ‐0.01 mm yr‐1 at El Hierro, Las Palmas and Fuerteventura,
respectively). This contribution is nevertheless one to two orders of magnitude lower than the observed

IOC TECHNICAL SERIES, No. 115, pp. 309‐320. URI: http://hdl.handle.net/1834/9197. 2015
313
trends in mean sea level, having therefore no influence on the conclusions. Nevertheless other local
movements could be present. SONEL reports a vertical land motion at Las Palmas (IEO CGPS station) of
‐1.56 0.34 mm yr‐1 (Santamaría‐Gómez et al., 2012), and the IGN reports a subsidence of ‐0.60 0.2 mm yr‐1 at Tarifa since 2010 (M. Valdés, IGN, personal communication). There is no CGPS information
available for La Palma or Arrecife.
It is interesting to point out the range of variability of the trends from long‐term time series available in the
region. Assuming no errors in the tide gauge measurements, such dispersion is mostly related to the
different time periods for which the trends are computed and secondly to the likely different vertical land
motions at the tide gauges.
Table 6.2.2. Observed trends and standard error (seasonal cycle removed) for a): the longest time series in
the region based on IEO and IGN tide gauges. Grey shaded those trends obtained from recent historical
data recovery, detailed quality control and analysis, in the publications shown in column 4; b): trends from
IEO and PdE tide gauges for the altimetry period (≈20 years).
Station Sea level trend
(mm yr‐1) Data period
Source of data/computed by:
a) Long term:
Cádiz 3.77 ± 0.18 1960‐2013 IEO/IEO
Cádiz 1.02 ± 0.21 1900‐2000 IEO‐IGN/Marcos et al. (2011)
Tarifa I 0.93 ± 0.11 1943‐2013 IEO/IEO
La Palma I 0.33 ± 0.09 1950‐2013 IEO/IEO
Tenerife I 2.09 ± 0.04 1927‐2012 IGN/Marcos et al. (2013)
Las Palmas I 0.94 ± 0.11 1949‐2013 IEO/IEO
Arrecife I 0.47 ± 0.10 1949‐2012 IEO/IEO
b) Altimetry period (since 1992):
Bonanza 5.10 ± 0.70 1992‐2013 PdE/PdE
Cádiz 1.18 ± 0.69 1992‐2013 IEO/IEO
Tarifa I 5.13 ± 0.42 1992‐2013 IEO/IEO
La Palma I 1.22 ± 0.52 1997‐2013 IEO/IEO
Tenerife II 5.10 ± 0.37 1992‐2013 PdE/PdE
Las Palmas I 4.15 ± 0.30 1991‐2013 IEO/IEO
Las Palmas II 4.90 ± 0.36 1992‐2013 PdE/PdE
Arrecife I 1.10 ± 0.43 1992‐2012 IEO/IEO
Pérez‐Gómez, B., Álvarez‐Fanjul, E., Marcos, M., Puyol, B. and García, M. J. Sea level variability and trends in the CCLME
314
6.2.3.2. Variability and trends for the altimetry period (1992‐2013)
Analysis of tide gauge data:
Relative sea level trends from tide gauges since 1992 are presented in Table 6.2.2 (b), where all tide gauge
data sources were included. The time series of Tenerife I for this period is not available at the PSMSL.
There are large differences between stations, some of them relatively close. These could be due to
undetected measurement errors at some stations, local movement or/and mesoscale activity.
According to these data, remarkable large trends are obtained for the altimetry period, in agreement with
other works in different regions (e.g. Merrifield et al., 2009). These trends exceed the ones during the
larger period with the exception of Cádiz, where the trend in the shorter period is similar or even smaller
than the trends in the long term section of Table 6.2.2. One reason for this discrepancy in Cádiz tide gauge
could be its anomalous operation in the period 1961‐1975, explained in Marcos et al. (2011), who suggests
a datum shift of about 10 cm during this period.
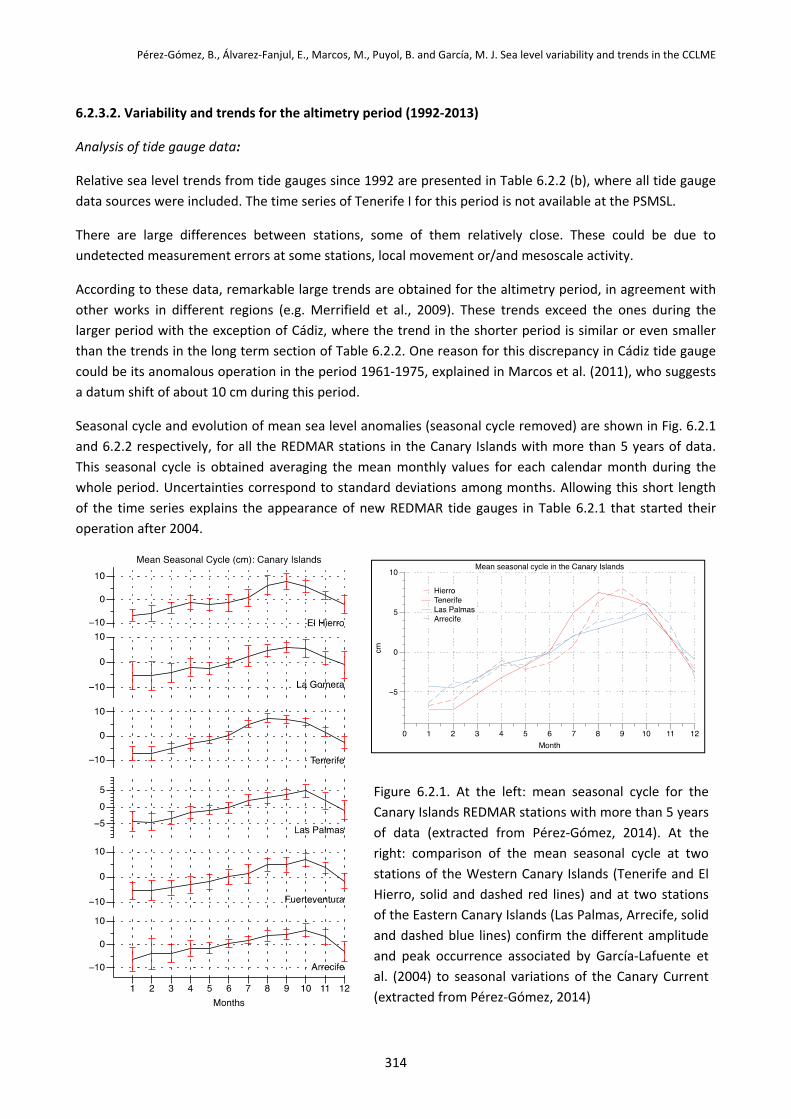
Seasonal cycle and evolution of mean sea level anomalies (seasonal cycle removed) are shown in Fig. 6.2.1
and 6.2.2 respectively, for all the REDMAR stations in the Canary Islands with more than 5 years of data.
This seasonal cycle is obtained averaging the mean monthly values for each calendar month during the
whole period. Uncertainties correspond to standard deviations among months. Allowing this short length
of the time series explains the appearance of new REDMAR tide gauges in Table 6.2.1 that started their
operation after 2004.
Figure 6.2.1. At the left: mean seasonal cycle for the
Canary Islands REDMAR stations with more than 5 years
of data (extracted from Pérez‐Gómez, 2014). At the
right: comparison of the mean seasonal cycle at two
stations of the Western Canary Islands (Tenerife and El
Hierro, solid and dashed red lines) and at two stations
of the Eastern Canary Islands (Las Palmas, Arrecife, solid
and dashed blue lines) confirm the different amplitude
and peak occurrence associated by García‐Lafuente et
al. (2004) to seasonal variations of the Canary Current
(extracted from Pérez‐Gómez, 2014)
IOC TECHNICAL SERIES, No. 115, pp. 309‐320. URI: http://hdl.handle.net/1834/9197. 2015
315
The seasonal cycle, mainly composed of annual and semiannual cycles related to cycles in the
meteorological forcing, heat content and circulation patterns, presents large spatial correlation. According
to García‐Lafuente et al. (2004) the semiannual signal is mainly caused by the meteorological forcing while
the annual cycle would be mainly explained by the steric (seasonal heating/cooling) effect.
Most of the stations along the Spanish coast (including the ones in the Gulf of Cádiz) present their
maximum sea levels in October and November, while this peak happens in September or even August in
Tenerife. The annual cycle is dominant, with mean values in the Canary Islands ranging from 6.6 cm in
Tenerife to 4.5 cm in Las Palmas (Pérez‐Gómez, 2014). The amplitude is slightly larger in the Gulf of Cádiz.
According to Pugh (1987), the phase of the annual cycle increases toward the north in the Northern
Hemisphere, as it is confirmed by the tide gauge data along the coast. However, an interesting spatial
difference is evident within the Canary Islands (Figure 6.2.1, right): the amplitude of the seasonal cycle is
lower in Las Palmas and Arrecife stations (eastern islands) than in Tenerife and El Hierro (western islands)
while the peak occurs also later (October) in the former. García‐Lafuente et al. (2004) consider this
difference related to the seasonal variations in the Canary Current (Navarro‐Pérez and Barton, 2001), which
gets closer to the African coast in summer and further offshore in winter. The lower mean sea levels occur
on the other hand in January and February for all the tide gauges employed here within the CCLME.
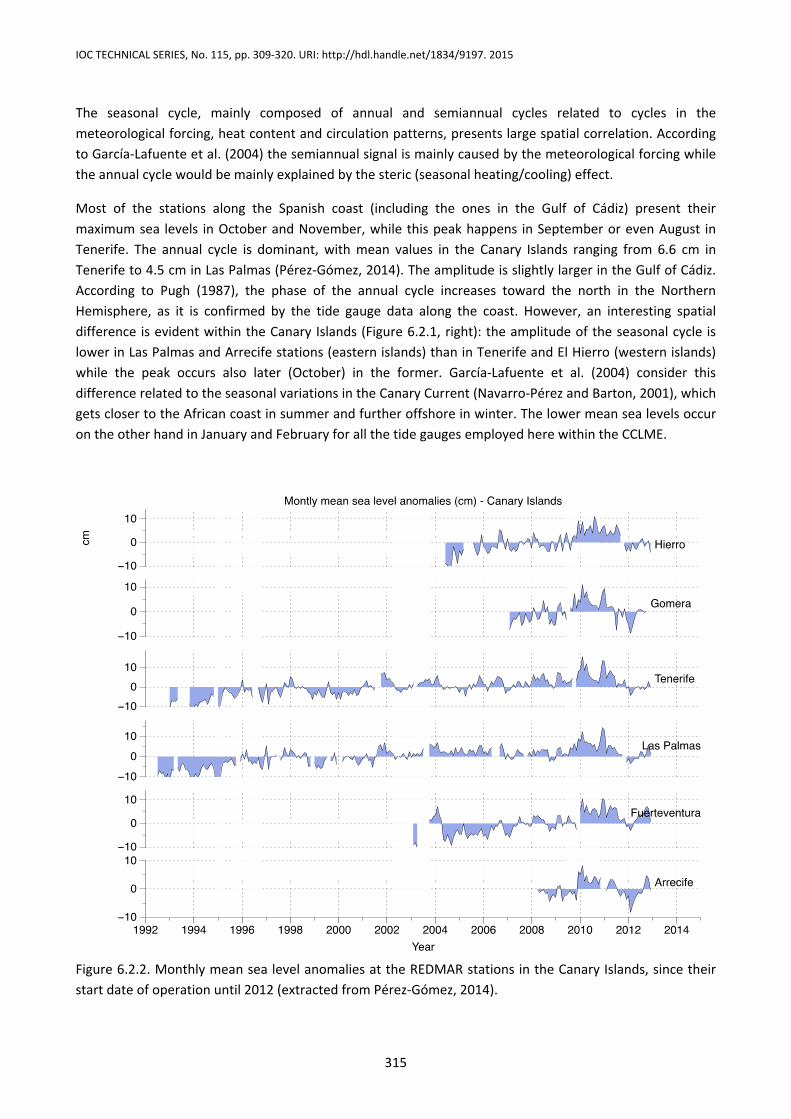
Figure 6.2.2. Monthly mean sea level anomalies at the REDMAR stations in the Canary Islands, since their
start date of operation until 2012 (extracted from Pérez‐Gómez, 2014).

Pérez‐Gómez, B., Álvarez‐Fanjul, E., Marcos, M., Puyol, B. and García, M. J. Sea level variability and trends in the CCLME
316
Interannual variations related to sporadic meteorological and oceanographic events become clear if we
remove the seasonal cycle from the monthly means (Figure 6.2.2). This interannual variability is in great
part related to the North Atlantic Oscillation (NAO), with a clear negative correlation, along the Atlantic
coast of Europe (Woolf et al., 2003; Wakelin et al., 2003). This relation is also apparent still in the Canary
Islands, especially since 2002. In fact, the negative value of the NAO Index (not shown) in 2010 coincides
with the peak of positive sea level that year at all the stations while the positive NAO Index in 2012 would
be in agreement with the lower mean sea levels the same year. Finally Figure 6.2.2 shows again a clear
increase of positive sea level events since 2002.
Figure 6.2.3. At the left: evolution of the 1%, 50% and 99% percentiles (from hourly values) for the REDMAR
stations of Bonanza (blue), Las Palmas (red) and Tenerife (green), including their trends and standard error
in mm yr‐1 (1992‐2013). At the right: evolution of 1% and 99% annual percentiles reduced to tide and
median (after harmonic analysis of each year of data). Bonanza larger variability reflects also the impact of
Guadalquivir river discharge.
The evolution of the hourly sea levels annual percentiles ‐ 99% (highs), 50% (median, close to mean sea
level) and 1% (lows) ‐ are displayed in Figure 6.2.3 (left) for the stations of Bonanza, Tenerife and Las
Palmas (the REDMAR stations covering a longer period, 1992‐2013, trends in mm yr‐1). The evolution of the
lowest and highest levels (1% and 99% percentile levels, respectively) reveals a larger positive trend in the
lower extremes in comparison to the mean sea level trend (50% percentile) and in comparison to the
higher extremes, with an even smaller trend. This is observed both at the Gulf of Cádiz and the Canary
Islands (although most evident in other harbours from the REDMAR network, further north, as described in
Pérez‐Gómez, 2014). This differential trend is still present when the time series are reduced to the median
values and, if confirmed in the coming years, would reflect a different origin for the trend of mean sea level
and that of extremes. The values for Bonanza could be affected for both instrumentation problems and the

IOC TECHNICAL SERIES, No. 115, pp. 309‐320. URI: http://hdl.handle.net/1834/9197. 2015
317
changes observed in the tide in the Guadalquivir River, something that should be confirmed in the future.
This difference is on the other hand larger in Las Palmas than in Tenerife. Figure 6.2.3 (right) shows the 99%
and 1% percentile series minus those obtained from tidal analysis of each year of data, as in Woodworth
and Blackman (2004), i.e. percentiles reduced to tide and median. These reveal the larger variability of non‐
tidal sea level at Bonanza, as compared to the Canary Islands, where the tidal signal is clearly dominant,
and practically negligible trends, what would be in agreement with the statement of Woodworth and
Blackman (2004) for other regions of the world: that the observed increase in extremes for the last decades
could be an artefact of short‐term trends in the extremes of the tide.
Analysis of altimetry data and comparison with tide gauges:
Since 1992 sea level variability and trends are also available in open waters from altimetry observations, as
can be seen in Figure 6.2.4, which displays the standard deviation (a measure of the energy or range of
variability) and the linear trends derived from monthly means of sea level anomaly from Aviso multi‐
mission gridded product. In contrast to tide gauges, these are absolute sea level trends. It is important to
remark that the atmospheric component has been corrected from this product, by means of the mentioned
DAC correction.
Figure 6.2.4. a) Standard deviation (cm) and b) Trends (cm yr‐1) of sea level anomaly (Aviso multi‐mission
products, 1/3⁰ x 1/3⁰, period 1992‐2013). Black stars: position of the tide gauges in the CCLME.

Pérez‐Gómez, B., Álvarez‐Fanjul, E., Marcos, M., Puyol, B. and García, M. J. Sea level variability and trends in the CCLME
318
Figure 6.2.4 (a) reveals, first, two strong signals of mean sea level (MSL) variability in the margins of the
region of interest (in the African coast around 11°N and at the northwest corner of the domain, in the
middle of the Atlantic). These signals correspond to the mesoscale activity present in the Atlantic,
especially north and west off the study domain. Maps covering the whole Atlantic (not included) show this
kind of variability around the Gulf Stream and extending over the North Atlantic and Azores current area. In
fact, these patterns are the southern more expression of this variability. It is also worth noting a relative
increase of energy in mean sea level anomaly at the South of the Canary Islands, extending horizontally
from the coast to the open waters, likely related to the mesoscale gyres caused by the interaction of the
Canary Current with the islands. A third feature is related to the coastal band of increased energy between
the Equator and 22°N, which is probably associated to the along‐shore wind effects that generate trapped
Kelvin waves travelling northwards (Calafat et al., 2012; Marcos et al., 2013). North of 22°N most of the
MSL variability is reduced. Another area of relative increased variability appears in front of the coast south
of 22°N (Cape Blanc) without reaching the Cape Verde Islands, possibly related also to the along‐shore wind
effects.
The spatial variation of sea level trends (Figure 6.2.4‐b) shows a general increase of the trend in the domain
from North to South, with values between 1.0 mm yr‐1 and 4.5 mm yr‐1 (apart from the strong signal in the
northwest corner of the domain, out of the CCLME). There is no zonal pattern, however, being the values in
open waters not very different from the ones at the coast, especially at the latitude of the Canary Islands
and to the north, as stated by Marcos et al. (2013). These spatial patterns show the fingerprint in sea level
of the mesoscale activity in the region. The southward increase in the trend is in agreement with a greater
contribution to sea level rise since 1990 from the tropical and southern oceans (Merrifield et al., 2009).
Table 6.2.3. Main statistical parameters from the comparison between REDMAR tide gauge and altimeter
monthly means, for their common period 1992‐2013 (seasonal cycle removed). NVal: number of data
(months), Bias (cm): mean difference, RMSE (cm): root mean square error, Rmax (cm): maximum (positive)
difference, Rmin (cm): minimum (negative) difference, a0, a1: origin and slope of the altimeter vs. tide
gauge linear regression, R: correlation coefficient.
Station NVal Bias RMSE Rmax Rmin a0 a1 R
Bonanza 252 0.04 3.98 11.09 ‐16.79 0.02 0.53 0.90 Tenerife II 252 0.22 2.08 7.2 ‐4.64 0.15 0.67 0.91 Las Palmas II 252 ‐0.02 2.27 7.34 ‐5.9 ‐0.01 0.61 0.88
Comparison of tide gauge and altimetry in the vicinity of each station is made to explore the impact of the
intrinsic potential differences: local movements of the tide gauges, effect of complex local circulation
patterns, etc. (Vinogradov and Ponte, 2011). It will help to assess the uncertainty of the observed sea level
trends and to determine the relation of coastal and open ocean sea level signals. To allow the direct
comparison of tide gauge and nearby altimeter monthly mean sea levels at the REDMAR stations, the DAC
component was added to the MSLA as in Pérez‐Gómez (2014). Examples of this comparison, including tide
gauge and altimeter trends for the same time period, are presented here for those stations within the
CCLME (Figure 6.2.5). The main statistical parameters of this comparison, performed with the average of
the altimeter points within a box of 0.5° around the tide gauge, and after removal of the seasonal cycle, are
shown in Table 6.2.3.

IOC TECHNICAL SERIES, No. 115, pp. 309‐320. URI: http://hdl.handle.net/1834/9197. 2015
319
Correlations and RMSE (root mean square error) are larger than 0.88 and smaller than 2.27 cm in the
Canary Islands stations. The RMSE is larger however in Bonanza (3.98 cm). Figure 6.2.5 (extracted from
Pérez‐Gómez, 2014), on the other hand, reveals a significantly larger trend at the three tide gauges with
respect to the trends in the altimeter. This could be due to local unknown movements, as already
mentioned. However, if we correct Las Palmas time series of the CGPS derived vertical movement (‐1.56 0.34 mm yr‐1), this difference is still present. Tide gauges show also in general a larger variability of the
mean sea levels.
Figure 6.2.5. Monthly means from tide gauges (red) and nearby altimeter data (black) for the period 1992‐
2011 (extracted from Pérez‐Gómez, 2014).

Pérez‐Gómez, B., Álvarez‐Fanjul, E., Marcos, M., Puyol, B. and García, M. J. Sea level variability and trends in the CCLME
320
6.2.4. CONCLUSIONS AND RECOMMENDATIONS
A review of published works on long‐term mean sea level trends in the CCLME has been combined with
new estimates from the longer time series available from tide gauges in the region. There is an evident lack
of historical sea level data during the 20th century, of course, but also for the last decades, in the African
coastline, so the study is based mainly on Spanish tide gauges. The main difficulty for a direct comparison
of the different local trends is the data period employed in each study, as well as the absence of knowledge
of local land movements at the stations, needed also for comparing tide gauge observations to altimetry.
We know the nowadays value of this vertical movement at Las Palmas and Tarifa stations. Tenerife,
according to Marcos et al. (2013), is considered to be a stable site and Cádiz present negligible values
(SONEL and Marcos et al., 2011). As the influence of local movements at the rest of the stations considered
is still unknown, its determination should be achieved in the future, by installing new CGPS stations close to
the tide gauges.
In spite of these difficulties, a comparison of recent trends (last two decades) to the longer‐term ones,
reveal an increase of the rate of mean sea level rise since the 1990’s, coherent with previous publications
on global sea level rise (Merrifield et al., 2009; Church et al., 2013). The uncertainty of these trends is
addressed by comparison with altimetry data, revealing a general high correlation but a significant
difference in the trend that should be further explored in the coming years.
Tide gauge data are also used for a review of interannual and seasonal variations in the region and their
relation to oceanographic and meteorological forcing such as the variations of the Canary Current and the
NAO; on the other hand, analysis of the extreme percentiles for the last 20 years at these stations reveal
positive trends in low sea levels larger than the ones found for mean and high sea levels, but the origin of
this discrepancy is so far unknown.
Finally, altimetry data constitute the main source of information for analysis of the spatial variations of sea
level variability and trends in the CCLME. Apart from the confirmation of the main oceanographic features
in the region, these data reveal larger trends of mean sea level since 1992 in the southern part of the
domain, what would be coherent with the increased rates in the tropical regions reported by Merrifield et
al. (2009).
Installation and long‐term operation of tide gauges and CGPS stations in all the countries of the CCLME
region is the main recommendation from this article, for an adequate assessment of long‐term sea level
variations. In the meantime, implementation of regionalized hindcasts by means of numerical models
would provide a better insight on the real causes of observed sea level variations.
Acknowledgements
The altimeter products (MSLA and DAC correction) were produced by Ssalto/Duacs and distributed by Aviso
(http://www.aviso.altimetry.fr/duacs/, accessed on 15 January 2015, with support from the Centre
National d’Etudes Spatiales (CNES). Monthly means from tide gauges in Dakar and Porto Grande have been
downloaded from the Permanent Service for Mean Sea level
(http://www.psmsl.org/data/obtaining/map.html, accessed on 15 January 2015) and GPS derived trends
for local land movement in Las Palmas was obtained from SONEL (http://www.sonel.org/‐Sea‐level‐trends‐
.html, accessed on 20 January 2015). Finally the authors would like to thank Javier Soto Navarro (Puertos
del Estado) for providing the final altimetry data plots.
IOC TECHNICAL SERIES, No. 115, pp. 309‐320. URI: http://hdl.handle.net/1834/9197. 2015
BIBLIOGRAPHY
Aviso‐CLS. 2014. User Handbook Ssalto/ Duacs: M(SLA) and M(ADT) Near‐Real Time and Delayed‐Time Products, SALP‐MU‐P‐EA‐21065‐CLS. Edition 4.2, November 2014.
Calafat, F. M., Chambers, D. P. and Tsimplis, M. N. 2012. Mechanisms of decadal sea level variability in the eastern North Atlantic and the Mediterranean Sea. Journal of Geophysical Research, Vol. 117, C09022.
Carton, J. A. and Giese, B. 2008. A Reanalysis of Ocean Climate Using Simple Ocean Data Assimilation (SODA). Monthly Weather Review, Vol. 136, pp. 2999‐3017.
Church, J. A. and White, N. J. 2011. Sea level rise from the late 19th to the early 21st century. Surveys in Geophysics, Vol. 32, pp. 585–602.
Church, J. A. et al. 2013. Sea Level Change. In: Climate Change 2013: The Physical Science Basis. Contribution of Working Group I to the Fifth Assessment Report of the Intergovernmental Panel on Climate Change. Stocker, T. F. et al. (eds). Cambridge University Press, Cambridge, United Kingdom and New York, NY, USA.
Coward, A. C. and de Cuevas, B. A. 2005. The OCCAM 66 level model: model description, physics, initial conditions and external forcing. Southampton Oceanography Centre Internal Document, 99. Southampton Oceanography Centre, Southampton, UK: 83 pp.
Fenoglio‐Marc, L. and Tel, E. 2010. Coastal and global sea level change. Journal of Geodynamics, Vol. 49, pp. 151–160.
García‐Lafuente, J., del Río, J., Alvarez‐Fanjul, E., Gomis, D. and Delgado, J. 2004. Some aspects of the seasonal sea level variations around Spain. Journal of Geophysical Research, Vol. 109 (C9), C09008.
Hay, C., Morrow, E., Kopp, R. E. and Mitrovica, X. 2015. Probabilistic reanalysis of twentieth‐century sea‐level rise. Nature, Vol. 0 (1). LETTER. doi:10.1038/nature14093.
Holgate, S. et al. 2013. New data systems and products at the permanent service for mean sea level. Journal of Coastal Research, Vol. 29, pp. 493‐504.
Marcos, M., Puyol, B., Wöppelmann, G., Herrero, E. and García‐Fernández, M. J. 2011. The long sea level record at Cadiz (southern Spain) from 1880 to 2009. Journal of Geophysical Research: Oceans, Vol. 116, C12003. doi:10.1029/2011JC007558.
Marcos, M., Puyol, B., Calafat, F. M. and Wöppelmann, G. 2013. Sea level changes at Tenerife Island (NE Tropical Atlantic) since 1927. Journal of Geophysical Research: Oceans, Vol. 118, pp. 4899‐4910. doi:10.1002/jgrc.20377.
Merrifield, M. A., Merrifield, S. T. and Mitchum, G. T. 2009. An anomalous recent acceleration of global sea level rise. Journal of Climate, Vol. 22 (21), pp. 5772–5781.
Navarro‐Pérez, E. and Barton, E. D. 2001. Seasonal and interannual variability of the Canary Current. Scientia Marina, Vol. 65 (S1), pp. 205– 213.
Peltier, W. 2004. Global glacial isostasy and the surface of the ice‐age Earth: The ICE‐5G(VM2) model and GRACE. Annual Review of Earth and Planetary Sciences, Vol. 32, pp. 111–149.
Pérez‐Gómez, B. 2014. Design and implementation of an operational sea level monitoring and forecasting system for the Spanish coast. PhD Thesis, Cantabria University, Santander, Spain: 242 pp.
Pérez‐Gómez, B., Payo, A., López, D., Woodworth, P. L. and Álvarez‐Fanjul, E. 2014. Overlapping sea level time series measured using different technologies: an example from the REDMAR Spanish network. Natural Hazards and Earth System Science, Vol. 14 (3), pp. 589–610. doi:10.5194/nhess‐14‐589‐2014.
Pugh, D. T. 1987. Tides, Surges, and Mean Sea‐Level. John Wiley & Sons Ltd.: 472 pp.
Santamaría‐Gómez, A., Gravelle, M., Collilieux, X., Guichard, M., Míguez, B. M., Tiphaneau, P. and Wöppelmann, G. 2012. Mitigating the effects of vertical land motion in tide gauge records using a state‐of‐the‐art GPS velocity field. Global and Planetary Change, S. 98‐99, pp. 6–17.
Talke, S. A., Orton, P. and Jay, D. A. 2014. Increasing storm tides in New York Harbor, 1844–2013. Geophysical Research Letters, Vol. 41, pp. 3149–3155. doi:10.1002/2014GL059574.
Vinogradov, S. V. and Ponte, R. M. 2011. Low‐frequency variability in coastal sea level from tide gauges and altimetry. Journal of Geophysical Research: Oceans, Vol. 116, C07006.
Wakelin, S. L., Woodworth, P., Flather, R. and Williams, J. 2003. Sea level dependence on the NAO over the NW European Continental Shelf. Geophysical Research Letters, Vol. 30 (7), pp. 1403.
Woodworth, P. L. and Blackman, D. L. 2004. Evidence for systematic changes in extreme high waters since the mid‐1970s. Journal of Climate, pp. 1190–1197.
Woolf, D. K., Shaw, A. G. P. and Tsimplis, M. N. 2003. The influence of the North Atlantic Oscillation on sea‐level variability in the North Atlantic region. Journal of Atmospheric & Ocean Science, Vol. 9 (4), pp. 145–167.
Wöppelmann, G., Marcos, M., Coulomb, A., Martín‐Míguez, B., Bonnetain, P., Boucher, C., Gravelle, M., Simon, B. and Tiphaneau, P. 2014. Rescue of the historical sea level record of Marseille (France) from 1885 to 1988 and its extension back to 1849–1851. Journal of Geodesy, Vol. 88, pp. 869‐885.