Embed Size (px)
Citation preview

www.pwc.com/globalgoals
SDG 9: Industry, innovation and infrastructure Build resilient infrastructure, promote inclusive and sustainable industrialisation and foster innovation
With 193 governments coming together to agree a common framework to tackle 17 major world issues by 2030, business engagement to achieve them is seen as critical. So how do you understand the implications of the SDGs and prioritise them? How do you quantify and minimise the potential risks, and explore the opportunities?
This is an extract from PwC’s Navigating the SDGs: a business guide to engaging with the UN Global Goals 2016 on SDG 9 Industry, innovation and infrastructure. For more on the other 16 SDGs, go to www.pwc.com/globalgoals

SDG 9: Industry, innovation and infrastructure2
What’s the global challenge?
• Physical infrastructure has far-reaching and long-lasting effects on the economy, environment and quality of life. Investments in public services such as energy, transport, ICT infrastructure, waste and water are also among the largest and longest-term capital investments that society makes. This means, in order to build a sustainable and resilient future, it is crucial to get infrastructure right from the outset.
• Many infrastructure systems are aged and in need of replacing or updating, in order to prevent the inefficiencies and problems of reliability which can mount up. Early and smart investment can save maintenance, inefficiency costs and natural resources and ensure a better system in which business can thrive.
• Climate change often creates additional capacity needs for and/or poses risks to critical physical infrastructure, making the need for resilient systems more urgent than ever. Risks include increasingly frequent and more severe events such as floods, tsunamis and heat waves. Designing for climate resilience from the outset can reduce the future costs of climate-proofing.
• It is estimated that the global shortfall on necessary basic infrastructure investments needs is $1 trillion.1 Globally, about 2.6 billion people cannot access a reliable electricity source, with another 2.6 billion without basic sanitation access. 1.5 billion do not have access to reliable phone services, and over 4 billion are without the internet.2,3
• Innovation is a key driver of business growth, with gains from innovation not only profitable but also likely to create significant social value. Research and development (R&D) investment, when integrated into business models, can produce significant growth. This may be through updating existing technologies, or through breakthroughs which open up new markets.4
• Disruptive technologies, which grow fast and reduce in cost, such as solar photovoltaics, electric cars, smart phones and wireless communications can be drivers of rapid shifts in the markets, and lay the foundations for more sustainable societies.

Why does it matter for business? And what can business do?
Adequate and resilient infrastructure underpins future economic growth, and is the means by which people access the resources they need for a high quality of life. While infrastructure has often been seen as the responsibility of governments, intensifying pressures such as population growth and climate impacts mean there are growing opportunities for business to apply its resources and expertise in this space.
Effective and accessible public transport and roadways are important operational factors driving efficiency in supply chains and distribution networks. Public private partnerships are becoming increasingly important, with private companies in the infrastructure and finance sectors supporting government to deliver improved transport systems that enhance the environment for communities and business.
Businesses are beneficiaries of reliable and sustainable local municipal services, such as waste collection and water services. Conversely, where services are inefficient this can be a cost to business and wider economic growth.
Do you have a programme in place to upgrade your own transport and/or building infrastructure, or built in to your supply chain (due to your commissioning of work) to ensure it is resource efficient, resilient and sustainable?
If you operate or source from a developing nation, could you invest in transport improvements that would deliver direct business benefits to you, as well as supporting the broader economic development of your host community?
If appropriate for your sector, can your business contribute to improving local municipal services? This may be through strategic or in-kind support, or via financial investments. Or are there opportunities for you to get involved in infrastructure public private partnerships, and have you explored the potential grants, tax breaks or other incentives that might be available?
Disruptive technologies pose risks and opportunities for business. Agile, innovative companies that successfully harness disruptive technologies can reap huge rewards: some have successfully transformed whole sectors – think of Skype and long distance calls or Uber and taxis.5
ICT is an area of infrastructure in which businesses may be underperforming. Infrequent systems updates are often a source of inefficiency, and may reduce competitiveness in an increasingly digital marketplace.
Do you know how disruptive technologies and innovative business models are impacting your market? Do you consider your vulnerability to your assets becoming “stranded assets” as part of your risk analysis and strategy reviews? Stranded assets are assets that lose their economic value well ahead of their expected useful life, typically as a result of changes in legislation, regulation, market drivers, societal norms or major environmental risks.
Are you making the most of the potential for digital to transform both what you do, and how you do it? Do you need to invest more in this area to sustain and grow your business?
Technological innovation and research and development (R&D) are high-value economic activities. Growing these areas in developing countries can help boost the economy and build the capacity of higher skilled and more educated workforce.
If you operate in developing nations, are you actively seeking to build your in-country technological and R&D capacity? Could this give you better insight into meeting your customers’ needs in those markets?
Could you add value by fostering innovation in your supply chain, perhaps by sourcing from developing countries in order to promote R&D?
Small scale industrial and other enterprises are a fundamental part of the economic fabric in developing countries, and they play a crucial role in furthering growth, innovation and prosperity. Yet, they are strongly restricted in accessing the capital they need to grow and expand, with nearly half of SMEs in developing countries rating access to finance as a major constraint.6
Are your developing country suppliers constrained by lack of access to capital? Are there creative ways you could help them access credit or other financial services?
You could also think about:
Ways that you could help improve access to ICT and the internet in developing countries, either via your business activities or through community engagement.
Whether your business has a Chief Information Officer at Board level. This is someone responsible for ICT and critical information resources. They have a key role in innovation and the long term quality, reliability and resilience of your business: their voice needs to be heard at the highest level.
Infrastructure investment – which can make a reliable return in the long-term, with stable and predictable cash flows, at the same time as helping drive economic growth in developing nations. Are there ways that your business may be able to take advantage of investing in infrastructure, perhaps with regard to staff pensions?
SDG 9: Industry, innovation and infrastructure3

SDG 9: Industry, innovation and infrastructure4
Key links to other SDGs:
Goal 6 – Clean water and sanitation: physical infrastructure is a necessary precursor to effective water and sanitation. The challenge which infrastructure has to meet is more pronounced in remote, water-pressured or very densely populated areas.
Goal 7 – Affordable and clean energy: access to energy is as much an issue of infrastructure as it is production; grids and other infrastructure facilitate the distribution of produced energy.
Goal 11 – Sustainable cities and communities: well-designed and efficient infrastructure is integral to the functioning of cities and urban areas.
Goal 13 – Climate action: climate impacts (such as extreme weather events) place physical infrastructure at risk of damage and destruction, and mean that some infrastructure may no longer be fit for purpose (e.g. hospitals not equipped to maintain a suitable room temperature during heat waves). Planning and building of infrastructure should therefore include climate resilience as a priority.
The lie of the land – exploring the distance to cover to achieveTarget 9.4: By 2030, upgrade infrastructure and retrofit industries to make them sustainable, with increased resource-use efficiency and greater adoption of clean and environmentally sound technologies and industrial processes, with all countries taking action in accordance with their respective capabilities
No data
Good performance
Poor performance
There are eight targets for this SDG. The first is to “Develop quality, reliable, sustainable and resilient infrastructure, including regional and trans-border infrastructure, to support economic development and human well-being, with a focus on affordable and equitable access for all”. We’ve illustrated target 9.4 in the heat map – “By 2030, upgrade infrastructure and retrofit industries to make them sustainable, with increased resource-use efficiency and greater adoption of clean and environmentally sound technologies and industrial processes, with all countries taking action in accordance with their respective capabilities”. For details on the remaining targets, please see ‘Global Goals and targets’ on page 6.
Targetsin f cus
Case Study
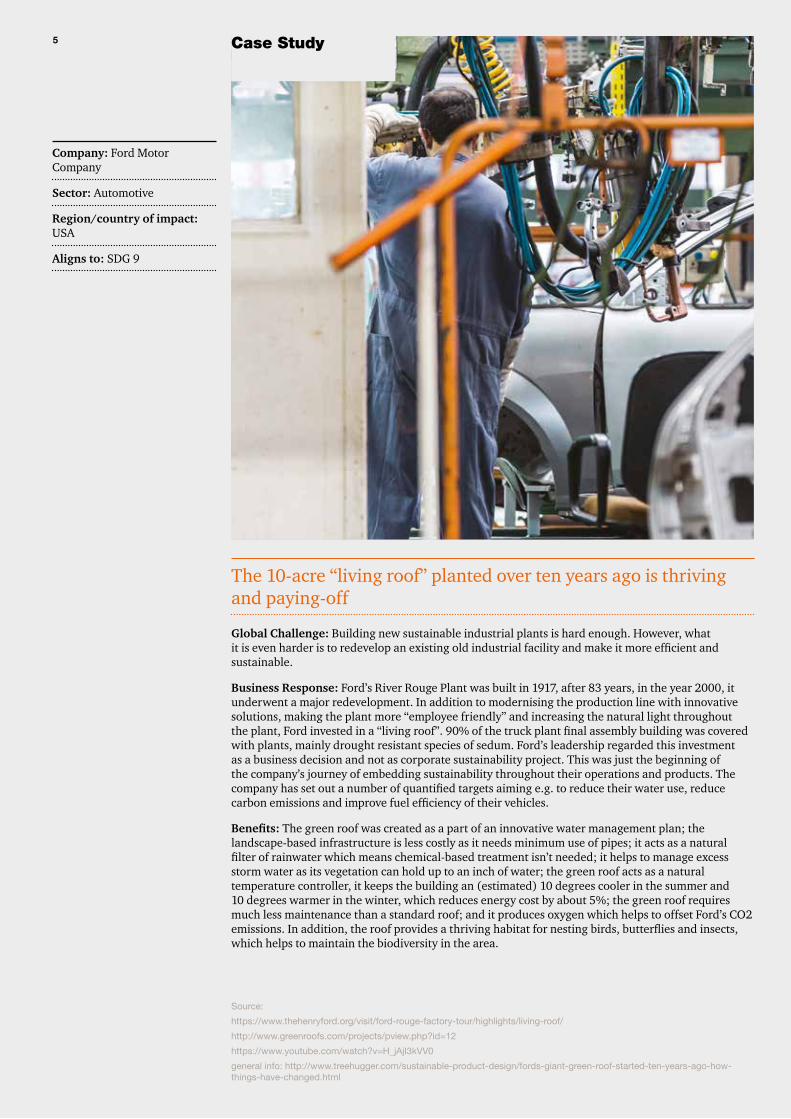
The 10-acre “living roof” planted over ten years ago is thriving and paying-off
Global Challenge: Building new sustainable industrial plants is hard enough. However, what it is even harder is to redevelop an existing old industrial facility and make it more efficient and sustainable.
Business Response: Ford’s River Rouge Plant was built in 1917, after 83 years, in the year 2000, it underwent a major redevelopment. In addition to modernising the production line with innovative solutions, making the plant more “employee friendly” and increasing the natural light throughout the plant, Ford invested in a “living roof”. 90% of the truck plant final assembly building was covered with plants, mainly drought resistant species of sedum. Ford’s leadership regarded this investment as a business decision and not as corporate sustainability project. This was just the beginning of the company’s journey of embedding sustainability throughout their operations and products. The company has set out a number of quantified targets aiming e.g. to reduce their water use, reduce carbon emissions and improve fuel efficiency of their vehicles.
Benefits: The green roof was created as a part of an innovative water management plan; the landscape-based infrastructure is less costly as it needs minimum use of pipes; it acts as a natural filter of rainwater which means chemical-based treatment isn’t needed; it helps to manage excess storm water as its vegetation can hold up to an inch of water; the green roof acts as a natural temperature controller, it keeps the building an (estimated) 10 degrees cooler in the summer and 10 degrees warmer in the winter, which reduces energy cost by about 5%; the green roof requires much less maintenance than a standard roof; and it produces oxygen which helps to offset Ford’s CO2 emissions. In addition, the roof provides a thriving habitat for nesting birds, butterflies and insects, which helps to maintain the biodiversity in the area.
Company: Ford Motor Company
Sector: Automotive
Region/country of impact: USA
Aligns to: SDG 9
Source:
https://www.thehenryford.org/visit/ford-rouge-factory-tour/highlights/living-roof/
http://www.greenroofs.com/projects/pview.php?id=12
https://www.youtube.com/watch?v=H_jAjI3kVV0
general info: http://www.treehugger.com/sustainable-product-design/fords-giant-green-roof-started-ten-years-ago-how-things-have-changed.html
5
SDG 9: Industry, innovation and infrastructure6
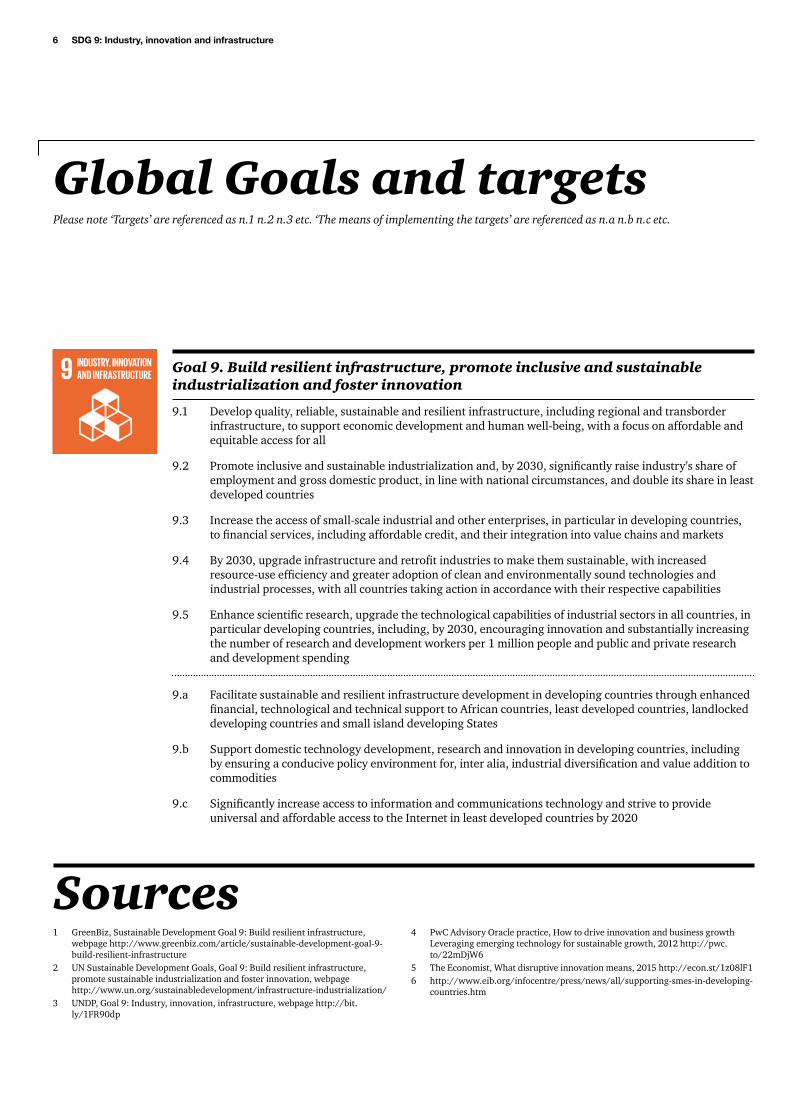
Global Goals and targetsPlease note ‘Targets’ are referenced as n.1 n.2 n.3 etc. ‘The means of implementing the targets’ are referenced as n.a n.b n.c etc.
Goal 9. Build resilient infrastructure, promote inclusive and sustainable industrialization and foster innovation
9.1 Develop quality, reliable, sustainable and resilient infrastructure, including regional and transborder infrastructure, to support economic development and human well-being, with a focus on affordable and equitable access for all
9.2 Promote inclusive and sustainable industrialization and, by 2030, significantly raise industry’s share of employment and gross domestic product, in line with national circumstances, and double its share in least developed countries
9.3 Increase the access of small-scale industrial and other enterprises, in particular in developing countries, to financial services, including affordable credit, and their integration into value chains and markets
9.4 By 2030, upgrade infrastructure and retrofit industries to make them sustainable, with increased resource-use efficiency and greater adoption of clean and environmentally sound technologies and industrial processes, with all countries taking action in accordance with their respective capabilities
9.5 Enhance scientific research, upgrade the technological capabilities of industrial sectors in all countries, in particular developing countries, including, by 2030, encouraging innovation and substantially increasing the number of research and development workers per 1 million people and public and private research and development spending
9.a Facilitate sustainable and resilient infrastructure development in developing countries through enhanced financial, technological and technical support to African countries, least developed countries, landlocked developing countries and small island developing States
9.b Support domestic technology development, research and innovation in developing countries, including by ensuring a conducive policy environment for, inter alia, industrial diversification and value addition to commodities
9.c Significantly increase access to information and communications technology and strive to provide universal and affordable access to the Internet in least developed countries by 2020
1 GreenBiz, Sustainable Development Goal 9: Build resilient infrastructure, webpage http://www.greenbiz.com/article/sustainable-development-goal-9-build-resilient-infrastructure
2 UN Sustainable Development Goals, Goal 9: Build resilient infrastructure, promote sustainable industrialization and foster innovation, webpage http://www.un.org/sustainabledevelopment/infrastructure-industrialization/
3 UNDP, Goal 9: Industry, innovation, infrastructure, webpage http://bit.ly/1FR90dp
4 PwC Advisory Oracle practice, How to drive innovation and business growth Leveraging emerging technology for sustainable growth, 2012 http://pwc.to/22mDjW6
5 The Economist, What disruptive innovation means, 2015 http://econ.st/1z08lF1 6 http://www.eib.org/infocentre/press/news/all/supporting-smes-in-developing-
countries.htm
Sources

SDG 9: Industry, innovation and infrastructure7
R&D expenditures (% GDP)
Country Value/Rating Korea, Rep. 4 ● Israel 3.9 ● Finland 3.5 ● Japan 3.4 ● Sweden 3.4 ● Denmark 3 ● Germany 2.9 ● Switzerland 2.9 ● Austria 2.8 ● Slovenia 2.8 ● USA 2.8 ● Iceland 2.6 ● Australia 2.4 ● France 2.3 ● Belgium 2.2 ● Estonia 2.2 ● Netherlands 2.2 ● Singapore 2.1 ● China 2 ● Czech Republic
1.9 ●
Canada 1.7 ● Ireland 1.7 ● Norway 1.7 ● UK 1.7 ● Portugal 1.5 ● Luxemb. 1.4 ● Hungary 1.3 ● Italy 1.3 ● New Zealand
1.3 ●
Spain 1.3 ● Brazil 1.2 ● Malaysia 1.1 ● Russia 1.1 ● Tunisia 1.1 ● Kenya 1 ● Serbia 1 ● Lithuania 0.9 ● Poland 0.9 ● Turkey 0.9 ● Croatia 0.8 ● India 0.8 ● Malta 0.8 ● Slovakia 0.8 ●
Country Value/Rating South Africa 0.8 ● Belarus 0.7 ● Greece 0.7 ● Iran 0.7 ● Latvia 0.7 ● Mali 0.7 ● Morocco 0.7 ● Ukraine 0.7 ● Argentina 0.6 ● Bulgaria 0.6 ● Gabon 0.6 ● Uganda 0.6 ● Botswana 0.5 ● Senegal 0.5 ● Tanzania 0.5 ● Costa Rica 0.5 ● Cyprus 0.5 ● Mozamb. 0.5 ● Romania 0.5 ● UAE 0.5 ● Chile 0.4 ● Egypt 0.4 ● Ghana 0.4 ● Jordan 0.4 ● Mauritius 0.4 ● Mexico 0.4 ● Moldova 0.4 ● Montenegro 0.4 ● Uruguay 0.4 ● Armenia 0.3 ● Mongolia 0.3 ● Nepal 0.3 ● Pakistan 0.3 ● Thailand 0.3 ● Togo 0.3 ● Zambia 0.3 ● Albania 0.2 ● Azerbaijan 0.2 ● Bolivia 0.2 ● Burkina Faso
0.2 ●
Colombia 0.2 ● Ecuador 0.2 ● Ethiopia 0.2 ● Georgia 0.2 ●
Country Value/Rating Kazakhstan 0.2 ● Kyrgyzstan 0.2 ● Macedonia 0.2 ● Nigeria 0.2 ● Panama 0.2 ● Sri Lanka 0.2 ● Algeria 0.1 ● Burundi 0.1 ● Cabo Verde 0.1 ● Congo, Dem. Rep.
0.1 ●
Gambia 0.1 ● Indonesia 0.1 ● Kuwait 0.1 ● Madagascar 0.1 ● Namibia 0.1 ● Oman 0.1 ● Paraguay 0.1 ● Philippines 0.1 ● Saudi Arabia 0.1 ● Tajikistan 0.1 ● Afghanistan 0* ● Bangladesh 0* ● Benin 0* ● Bosnia and Herzegovina
0* ●
Cambodia 0* ● CAR 0* ● Chad 0* ● El Salvador 0* ● Guatemala 0* ● Guinea 0* ● Haiti 0* ●
Country Value/Rating Iraq 0* ● Lesotho 0* ● Liberia 0* ● Malawi 0* ● Myanmar 0* ● Niger 0* ● Rwanda 0* ● Sierra Leone 0* ● Trinidad and Tobago
0* ●
Zimbabwe 0* ● Angola n/a ● Bhutan n/a ● Cameroon n/a ● Congo, Rep. n/a ● Cote d'Ivoire n/a ● Dominican Republic
n/a ●
Guyana n/a ● Honduras n/a ● Jamaica n/a ● Lao PDR n/a ● Lebanon n/a ● Mauritania n/a ● Nicaragua n/a ● Peru n/a ● Qatar n/a ● Sudan n/a ● Suriname n/a ● Swaziland n/a ● Venezuela n/a ● Vietnam n/a ● Yemen n/a ●
Source : UNESCO (2016). Years : 2005-2012. Detailed metadata and quantitative thresholds used for each indicator are available online at www.sdgindex.org. Data refer to the most recent year available during the period specified. * Assumed to be 0% (see Annex 1 for details)
SDG INDEX AND DASHBOARD - GLOBAL REPORT 34 SDG INDICATOR PROFILES
How well are countries performing against the indicators that sit behind the SDG goals and targets?
SDG 9 Indicator Profile: R&D expenditures (NB. this table is from the SDG Index & Dashboards - Global Report)
SDG 9: Industry, innovation and infrastructure8
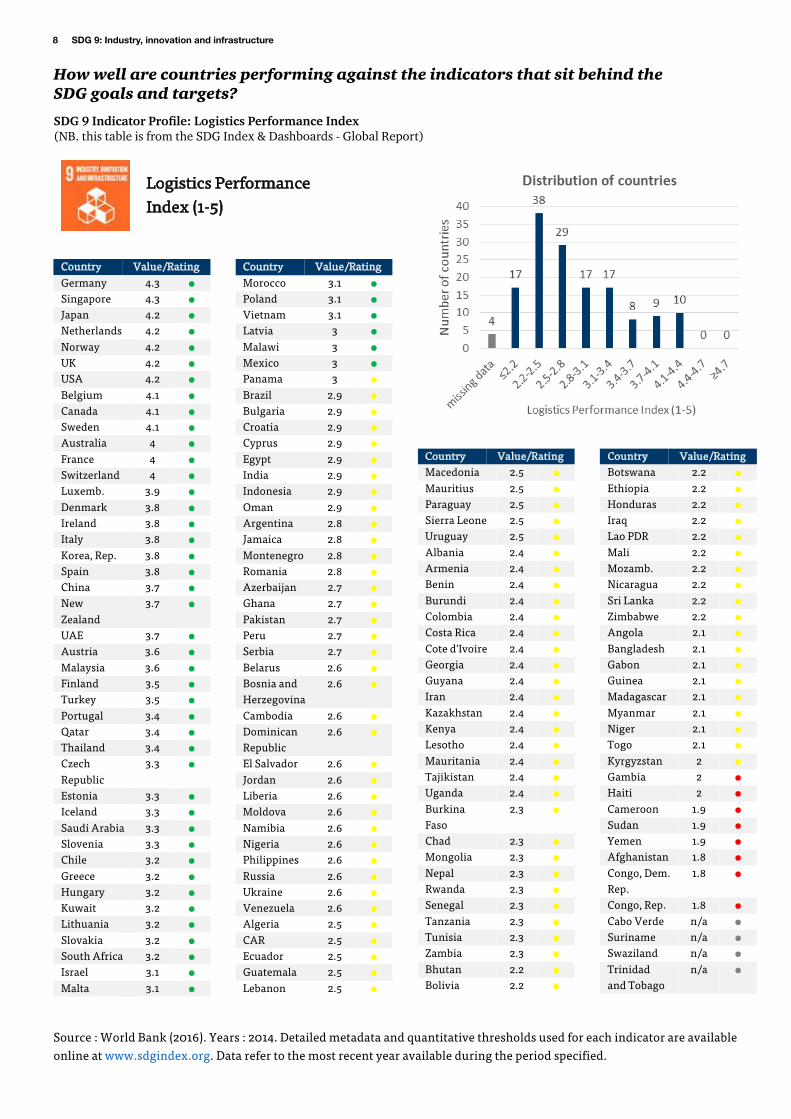
Logistics Performance Index (1-5)
Country Value/Rating Germany 4.3 ● Singapore 4.3 ● Japan 4.2 ● Netherlands 4.2 ● Norway 4.2 ● UK 4.2 ● USA 4.2 ● Belgium 4.1 ● Canada 4.1 ● Sweden 4.1 ● Australia 4 ● France 4 ● Switzerland 4 ● Luxemb. 3.9 ● Denmark 3.8 ● Ireland 3.8 ● Italy 3.8 ● Korea, Rep. 3.8 ● Spain 3.8 ● China 3.7 ● New Zealand
3.7 ●
UAE 3.7 ● Austria 3.6 ● Malaysia 3.6 ● Finland 3.5 ● Turkey 3.5 ● Portugal 3.4 ● Qatar 3.4 ● Thailand 3.4 ● Czech Republic
3.3 ●
Estonia 3.3 ● Iceland 3.3 ● Saudi Arabia 3.3 ● Slovenia 3.3 ● Chile 3.2 ● Greece 3.2 ● Hungary 3.2 ● Kuwait 3.2 ● Lithuania 3.2 ● Slovakia 3.2 ● South Africa 3.2 ● Israel 3.1 ● Malta 3.1 ●
Country Value/Rating Morocco 3.1 ● Poland 3.1 ● Vietnam 3.1 ● Latvia 3 ● Malawi 3 ● Mexico 3 ● Panama 3 ● Brazil 2.9 ● Bulgaria 2.9 ● Croatia 2.9 ● Cyprus 2.9 ● Egypt 2.9 ● India 2.9 ● Indonesia 2.9 ● Oman 2.9 ● Argentina 2.8 ● Jamaica 2.8 ● Montenegro 2.8 ● Romania 2.8 ● Azerbaijan 2.7 ● Ghana 2.7 ● Pakistan 2.7 ● Peru 2.7 ● Serbia 2.7 ● Belarus 2.6 ● Bosnia and Herzegovina
2.6 ●
Cambodia 2.6 ● Dominican Republic
2.6 ●
El Salvador 2.6 ● Jordan 2.6 ● Liberia 2.6 ● Moldova 2.6 ● Namibia 2.6 ● Nigeria 2.6 ● Philippines 2.6 ● Russia 2.6 ● Ukraine 2.6 ● Venezuela 2.6 ● Algeria 2.5 ● CAR 2.5 ● Ecuador 2.5 ● Guatemala 2.5 ● Lebanon 2.5 ●
Country Value/Rating Macedonia 2.5 ● Mauritius 2.5 ● Paraguay 2.5 ● Sierra Leone 2.5 ● Uruguay 2.5 ● Albania 2.4 ● Armenia 2.4 ● Benin 2.4 ● Burundi 2.4 ● Colombia 2.4 ● Costa Rica 2.4 ● Cote d'Ivoire 2.4 ● Georgia 2.4 ● Guyana 2.4 ● Iran 2.4 ● Kazakhstan 2.4 ● Kenya 2.4 ● Lesotho 2.4 ● Mauritania 2.4 ● Tajikistan 2.4 ● Uganda 2.4 ● Burkina Faso
2.3 ●
Chad 2.3 ● Mongolia 2.3 ● Nepal 2.3 ● Rwanda 2.3 ● Senegal 2.3 ● Tanzania 2.3 ● Tunisia 2.3 ● Zambia 2.3 ● Bhutan 2.2 ● Bolivia 2.2 ●
Country Value/Rating Botswana 2.2 ● Ethiopia 2.2 ● Honduras 2.2 ● Iraq 2.2 ● Lao PDR 2.2 ● Mali 2.2 ● Mozamb. 2.2 ● Nicaragua 2.2 ● Sri Lanka 2.2 ● Zimbabwe 2.2 ● Angola 2.1 ● Bangladesh 2.1 ● Gabon 2.1 ● Guinea 2.1 ● Madagascar 2.1 ● Myanmar 2.1 ● Niger 2.1 ● Togo 2.1 ● Kyrgyzstan 2 ● Gambia 2 ● Haiti 2 ● Cameroon 1.9 ● Sudan 1.9 ● Yemen 1.9 ● Afghanistan 1.8 ● Congo, Dem. Rep.
1.8 ●
Congo, Rep. 1.8 ● Cabo Verde n/a ● Suriname n/a ● Swaziland n/a ● Trinidad and Tobago
n/a ●
Source : World Bank (2016). Years : 2014. Detailed metadata and quantitative thresholds used for each indicator are available online at www.sdgindex.org. Data refer to the most recent year available during the period specified.
SDG INDEX AND DASHBOARD - GLOBAL REPORT 35 SDG INDICATOR PROFILES
How well are countries performing against the indicators that sit behind the SDG goals and targets?
SDG 9 Indicator Profile: Logistics Performance Index (NB. this table is from the SDG Index & Dashboards - Global Report)
SDG 9: Industry, innovation and infrastructure9
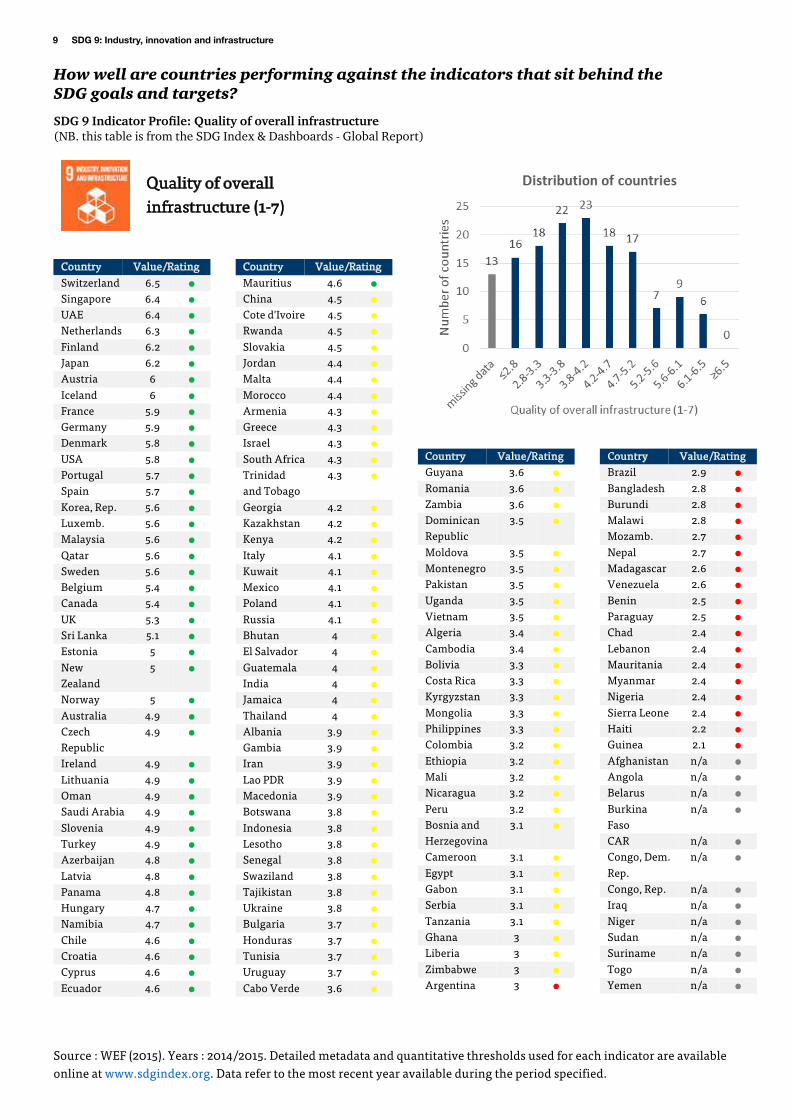
Quality of overall infrastructure (1-7)
Country Value/Rating Switzerland 6.5 ● Singapore 6.4 ● UAE 6.4 ● Netherlands 6.3 ● Finland 6.2 ● Japan 6.2 ● Austria 6 ● Iceland 6 ● France 5.9 ● Germany 5.9 ● Denmark 5.8 ● USA 5.8 ● Portugal 5.7 ● Spain 5.7 ● Korea, Rep. 5.6 ● Luxemb. 5.6 ● Malaysia 5.6 ● Qatar 5.6 ● Sweden 5.6 ● Belgium 5.4 ● Canada 5.4 ● UK 5.3 ● Sri Lanka 5.1 ● Estonia 5 ● New Zealand
5 ●
Norway 5 ● Australia 4.9 ● Czech Republic
4.9 ●
Ireland 4.9 ● Lithuania 4.9 ● Oman 4.9 ● Saudi Arabia 4.9 ● Slovenia 4.9 ● Turkey 4.9 ● Azerbaijan 4.8 ● Latvia 4.8 ● Panama 4.8 ● Hungary 4.7 ● Namibia 4.7 ● Chile 4.6 ● Croatia 4.6 ● Cyprus 4.6 ● Ecuador 4.6 ●
Country Value/Rating Mauritius 4.6 ● China 4.5 ● Cote d'Ivoire 4.5 ● Rwanda 4.5 ● Slovakia 4.5 ● Jordan 4.4 ● Malta 4.4 ● Morocco 4.4 ● Armenia 4.3 ● Greece 4.3 ● Israel 4.3 ● South Africa 4.3 ● Trinidad and Tobago
4.3 ●
Georgia 4.2 ● Kazakhstan 4.2 ● Kenya 4.2 ● Italy 4.1 ● Kuwait 4.1 ● Mexico 4.1 ● Poland 4.1 ● Russia 4.1 ● Bhutan 4 ● El Salvador 4 ● Guatemala 4 ● India 4 ● Jamaica 4 ● Thailand 4 ● Albania 3.9 ● Gambia 3.9 ● Iran 3.9 ● Lao PDR 3.9 ● Macedonia 3.9 ● Botswana 3.8 ● Indonesia 3.8 ● Lesotho 3.8 ● Senegal 3.8 ● Swaziland 3.8 ● Tajikistan 3.8 ● Ukraine 3.8 ● Bulgaria 3.7 ● Honduras 3.7 ● Tunisia 3.7 ● Uruguay 3.7 ● Cabo Verde 3.6 ●
Country Value/Rating Guyana 3.6 ● Romania 3.6 ● Zambia 3.6 ● Dominican Republic
3.5 ●
Moldova 3.5 ● Montenegro 3.5 ● Pakistan 3.5 ● Uganda 3.5 ● Vietnam 3.5 ● Algeria 3.4 ● Cambodia 3.4 ● Bolivia 3.3 ● Costa Rica 3.3 ● Kyrgyzstan 3.3 ● Mongolia 3.3 ● Philippines 3.3 ● Colombia 3.2 ● Ethiopia 3.2 ● Mali 3.2 ● Nicaragua 3.2 ● Peru 3.2 ● Bosnia and Herzegovina
3.1 ●
Cameroon 3.1 ● Egypt 3.1 ● Gabon 3.1 ● Serbia 3.1 ● Tanzania 3.1 ● Ghana 3 ● Liberia 3 ● Zimbabwe 3 ● Argentina 3 ●
Country Value/Rating Brazil 2.9 ● Bangladesh 2.8 ● Burundi 2.8 ● Malawi 2.8 ● Mozamb. 2.7 ● Nepal 2.7 ● Madagascar 2.6 ● Venezuela 2.6 ● Benin 2.5 ● Paraguay 2.5 ● Chad 2.4 ● Lebanon 2.4 ● Mauritania 2.4 ● Myanmar 2.4 ● Nigeria 2.4 ● Sierra Leone 2.4 ● Haiti 2.2 ● Guinea 2.1 ● Afghanistan n/a ● Angola n/a ● Belarus n/a ● Burkina Faso
n/a ●
CAR n/a ● Congo, Dem. Rep.
n/a ●
Congo, Rep. n/a ● Iraq n/a ● Niger n/a ● Sudan n/a ● Suriname n/a ● Togo n/a ● Yemen n/a ●
Source : WEF (2015). Years : 2014/2015. Detailed metadata and quantitative thresholds used for each indicator are available online at www.sdgindex.org. Data refer to the most recent year available during the period specified.
SDG INDEX AND DASHBOARD - GLOBAL REPORT 36 SDG INDICATOR PROFILES
How well are countries performing against the indicators that sit behind the SDG goals and targets?
SDG 9 Indicator Profile: Quality of overall infrastructure (NB. this table is from the SDG Index & Dashboards - Global Report)

SDG 9: Industry, innovation and infrastructure10
Mobile broadband subscriptions (per 100)
Country Value/Rating Singapore 149.3 ● Finland 123.5 ● Japan 120.5 ● Australia 110.5 ● Sweden 108.7 ● Korea, Rep. 105.3 ● Denmark 103.8 ● USA 98 ● UAE 89 ● UK 87.2 ● Norway 86.7 ● Saudi Arabia 85.1 ● New Zealand
81.3 ●
Luxemb. 80.5 ● Estonia 77.4 ● Qatar 76.8 ● Iceland 74.7 ● Botswana 74.1 ● Costa Rica 72.7 ● Oman 67.3 ● Ireland 67.2 ● Spain 66.8 ● Croatia 65.3 ● Austria 64.3 ● Switzerland 63.4 ● Netherlands 62.3 ● Latvia 62.1 ● Italy 61.4 ● Russia 60.1 ● South Africa 58.5 ● Bulgaria 58.1 ● Kazakhstan 57.2 ● France 56.9 ● Malta 56.8 ● Poland 54.9 ● Serbia 53.7 ● Israel 53 ● Czech Republic
52.3 ●
Thailand 52.3 ● Brazil 51.5 ● Slovakia 50.1 ● Canada 50 ● Lithuania 48.2 ●
Country Value/Rating Moldova 47.2 ● Belgium 46 ● Uruguay 45.5 ● Germany 44.7 ● Azerbaijan 43.9 ● Cabo Verde 42.6 ● Lebanon 41.8 ● Slovenia 41.8 ● Venezuela 40.9 ● Ghana 39.9 ● Macedonia 38 ● Zimbabwe 37.8 ● Romania 37.6 ● Portugal 36.7 ● Greece 36.1 ● Chile 35.6 ● Namibia 34.2 ● Turkey 32.3 ● Argentina 32.1 ● Cyprus 32.1 ● Egypt 31.1 ● Armenia 31 ● Tunisia 30.9 ● Jamaica 30.8 ● Mauritius 28.7 ● Albania 28.2 ● Hungary 26.3 ● Dominican Republic
25.4 ●
Panama 25.2 ● Colombia 25 ● Indonesia 24.2 ● Montenegro 23.1 ● China 21.4 ● Kyrgyzstan 19.1 ● Trinidad and Tobago
18.9 ●
Vietnam 18.8 ● Mongolia 18.2 ● Georgia 16.4 ● Jordan 16.1 ● Bhutan 15.6 ● Morocco 15 ● Senegal 14.1 ● Bolivia 13.9 ●
Country Value/Rating Mexico 13.5 ● Suriname 13.1 ● Malaysia 12.5 ● Angola 12.2 ● Honduras 11.7 ● Nepal 10.9 ● Nigeria 10.1 ● Cambodia 9.6 ● Burkina Faso
9 ●
Ecuador 8.3 ● Sri Lanka 7.8 ● Lesotho 7.4 ● Uganda 7.4 ● El Salvador 6 ● Kuwait 5.9 ● Rwanda 5.8 ● Mauritania 5.4 ● Ukraine 5.4 ● Guatemala 4.9 ● Paraguay 4.9 ● Ethiopia 4.8 ● Malawi 3.9 ● India 3.2 ● Madagascar 3.1 ● Kenya 3 ● Peru 2.9 ● Tanzania 2.7 ● Lao PDR 2.5 ● Bangladesh 1.9 ● Mali 1.8 ● Mozamb. 1.8 ● Nicaragua 1.3 ●
Country Value/Rating Gambia 1.2 ● Iran 1.2 ● Myanmar 1 ● Swaziland 0.7 ● Zambia 0.7 ● Tajikistan 0.6 ● Pakistan 0.5 ● Yemen 0.2 ● Algeria 0 ● Burundi 0 ● Cameroon 0 ● Chad 0 ● Cote d'Ivoire 0 ● Gabon 0 ● Guinea 0 ● Guyana 0 ● Haiti 0 ● Philippines 0 ● Afghanistan n/a ● Belarus n/a ● Benin n/a ● Bosnia and Herzegovina
n/a ●
CAR n/a ● Congo, Dem. Rep.
n/a ●
Congo, Rep. n/a ● Iraq n/a ● Liberia n/a ● Niger n/a ● Sierra Leone n/a ● Sudan n/a ● Togo n/a ●
Source : ITU (2015). Years : 2012-2015. Detailed metadata and quantitative thresholds used for each indicator are available online at www.sdgindex.org. Data refer to the most recent year available during the period specified.
SDG INDEX AND DASHBOARD - GLOBAL REPORT 37 SDG INDICATOR PROFILES
How well are countries performing against the indicators that sit behind the SDG goals and targets?
SDG 9 Indicator Profile: Mobile broadband subscriptions (NB. this table is from the SDG Index & Dashboards - Global Report)

SDG 9: Industry, innovation and infrastructure11
Internet use (%)
Country Value/Rating Iceland 98.2 ● Norway 96.3 ● Denmark 96 ● Luxemb. 94.7 ● Netherlands 93.2 ● Sweden 92.5 ● Finland 92.4 ● UK 91.6 ● Qatar 91.5 ● Japan 90.6 ● UAE 90.4 ● USA 87.4 ● Canada 87.1 ● Switzerland 87 ● Germany 86.2 ● New Zealand
85.5 ●
Belgium 85 ● Australia 84.6 ● Korea, Rep. 84.3 ● Estonia 84.2 ● France 83.8 ● Singapore 82 ● Austria 81 ● Slovakia 80 ● Czech Republic
79.7 ●
Ireland 79.7 ● Kuwait 78.7 ● Spain 76.2 ● Hungary 76.1 ● Latvia 75.8 ● Lebanon 74.7 ● Malta 73.2 ● Chile 72.4 ● Lithuania 72.1 ● Slovenia 71.6 ● Israel 71.5 ● Russia 70.5 ● Oman 70.2 ● Cyprus 69.3 ● Croatia 68.6 ● Macedonia 68.1 ● Malaysia 67.5 ● Poland 66.6 ●
Country Value/Rating Trinidad and Tobago
65.1 ●
Argentina 64.7 ● Portugal 64.6 ● Saudi Arabia 63.7 ● Greece 63.2 ● Italy 62 ● Uruguay 61.5 ● Azerbaijan 61 ● Montenegro 61 ● Bosnia and Herzegovina
60.8 ●
Albania 60.1 ● Belarus 59 ● Brazil 57.6 ● Venezuela 57 ● Morocco 56.8 ● Bulgaria 55.5 ● Kazakhstan 54.9 ● Romania 54.1 ● Serbia 53.5 ● Colombia 52.6 ● Turkey 51 ● Dominican Republic
49.6 ●
Costa Rica 49.4 ● China 49.3 ● South Africa 49 ● Georgia 48.9 ● Vietnam 48.3 ● Moldova 46.6 ● Armenia 46.3 ● Tunisia 46.2 ● Panama 44.9 ● Mexico 44.4 ● Jordan 44 ● Kenya 43.4 ● Ukraine 43.4 ● Ecuador 43 ● Paraguay 43 ● Nigeria 42.7 ● Mauritius 41.4 ● Jamaica 40.5 ● Cabo Verde 40.3 ● Peru 40.2 ●
Country Value/Rating Suriname 40.1 ● Philippines 39.7 ● Iran 39.4 ● Bolivia 39 ● Guyana 37.4 ● Thailand 34.9 ● Bhutan 34.4 ● Egypt 31.7 ● El Salvador 29.7 ● Kyrgyzstan 28.3 ● Swaziland 27.1 ● Mongolia 27 ● Sri Lanka 25.8 ● Sudan 24.6 ● Guatemala 23.4 ● Yemen 22.6 ● Angola 21.3 ● Zimbabwe 19.9 ● Honduras 19.1 ● Ghana 18.9 ● Botswana 18.5 ● Algeria 18.1 ● India 18 ● Senegal 17.7 ● Uganda 17.7 ● Nicaragua 17.6 ● Tajikistan 17.5 ● Zambia 17.3 ● Indonesia 17.1 ● Gambia 15.6 ● Nepal 15.4 ● Namibia 14.8 ● Cote d'Ivoire 14.6 ●
Country Value/Rating Lao PDR 14.3 ● Pakistan 13.8 ● Haiti 11.4 ● Iraq 11.3 ● Cameroon 11 ● Lesotho 11 ● Mauritania 10.7 ● Rwanda 10.6 ● Gabon 9.8 ● Bangladesh 9.6 ● Burkina Faso
9.4 ●
Cambodia 9 ● Mali 7 ● Afghanistan 6.4 ● Mozamb. 5.9 ● Malawi 5.8 ● Togo 5.7 ● Liberia 5.4 ● Benin 5.3 ● Tanzania 4.9 ● CAR 4 ● Madagascar 3.7 ● Congo, Dem. Rep.
3 ●
Ethiopia 2.9 ● Chad 2.5 ● Myanmar 2.1 ● Sierra Leone 2.1 ● Niger 2 ● Guinea 1.7 ● Burundi 1.4 ● Congo, Rep. n/a ●
Source : ITU (2015). Years : 2014. Detailed metadata and quantitative thresholds used for each indicator are available online at www.sdgindex.org. Data refer to the most recent year available during the period specified.
SDG INDEX AND DASHBOARD - GLOBAL REPORT 38 SDG INDICATOR PROFILES
Source: Sachs, J., Schmidt-Traub, G., Kroll, C., Durand-Delacre, D. and Teksoz, K. (2016): An SDG Index and Dashboards – Global Report. New York: Bertelsmann Stiftung and Sustainable Development Solutions Network (SDSN). All indicators are based on published data. Each data point is coloured as “green”, “yellow” or “red”, indicating whether the country is close or at SDG achievement (green), is in a “caution lane” (yellow), or is seriously far from achievement as of 2015 (red), on that indicator. Thresholds are based on the authors’ analysis and expert assessments. For more detail, see www.sdgindex.org
How well are countries performing against the indicators that sit behind the SDG goals and targets?
SDG 9 Indicator Profile: Internet use (NB. this table is from the SDG Index & Dashboards - Global Report)

pwc.com/globalgoals At PwC, our purpose is to build trust in society and solve important problems. We’re a network of firms in 157 countries with more than 208,000 people who are committed to delivering quality in assurance, advisory and tax services. Find out more and tell us what matters to you by visiting us at www.pwc.com.
This publication has been prepared for general guidance on matters of interest only, and does not constitute professional advice. You should not act upon the information contained in this publication without obtaining specific professional advice. No representation or warranty (express or implied) is given as to the accuracy or completeness of the information contained in this publication, and, to the extent permitted by law, PwC does not accept or assume any liability, responsibility or duty of care for any consequences of you or anyone else acting, or refraining to act, in reliance on the information contained in this publication or for any decision based on it.
© 2016 PwC. All rights reserved. PwC refers to the PwC network and/or one or more of its member firms, each of which is a separate legal entity. Please see www.pwc.com/structure for further details.