Embed Size (px)
Citation preview

Screening and diagnostic tests.
Sensitivity and specificity.
Gabriela Czanner PhD CStat
Department of Biostatistics
Department of Eye and Vision Science
2 October 2013
MERSEY POSTGRADUATE TRAINING PROGRAMME
Workshop Series: Basic Statistics for Eye Researchers and Clinicians
Workshop 6

What is a screening test or
diagnostic test study?
• It compares a new method of measurement to a true gold
standard method of measurement
• Tests are used to classify individuals into one of two or
more disease categories.
• Tests can be based on clinical observations, psychological
questionaires or laboratory techniques.
• Types of questions on next slide…

Type of questions
• Laboratory techniques
• In people living in a highly endemic malarious area of Northern
Ghana, how useful is microscopy in determining Plasmodium
falciparum infection?
• Psychological assessment
• In a clinical outpatient population how effective is the Hospital
Anxiety and Depression (HAD) scale for diagnosing clinical anxiety?
• Clinical observations
• In diabetes mellitus patients, how useful are examinations of retinal
images in predicting risk of diabetic retinopathy?
• Or how useful is Amsler grid test for detecting neovascular AMD?

Screening and diagnostic test (1)
• A screening test is a test for a particular disease given to
individuals who are asymptomatic (no symptoms).
• Can be defined as the application of a test to detect
unsuspected disease in people without symptoms.
• Generally screening tests are cheap – the aim of the test is
to try and identify all individuals who might have the
disease – individuals identified with a possible disease are
then given more specific tests to accurately identify the
disease.
Screening and diagnostic test (2)
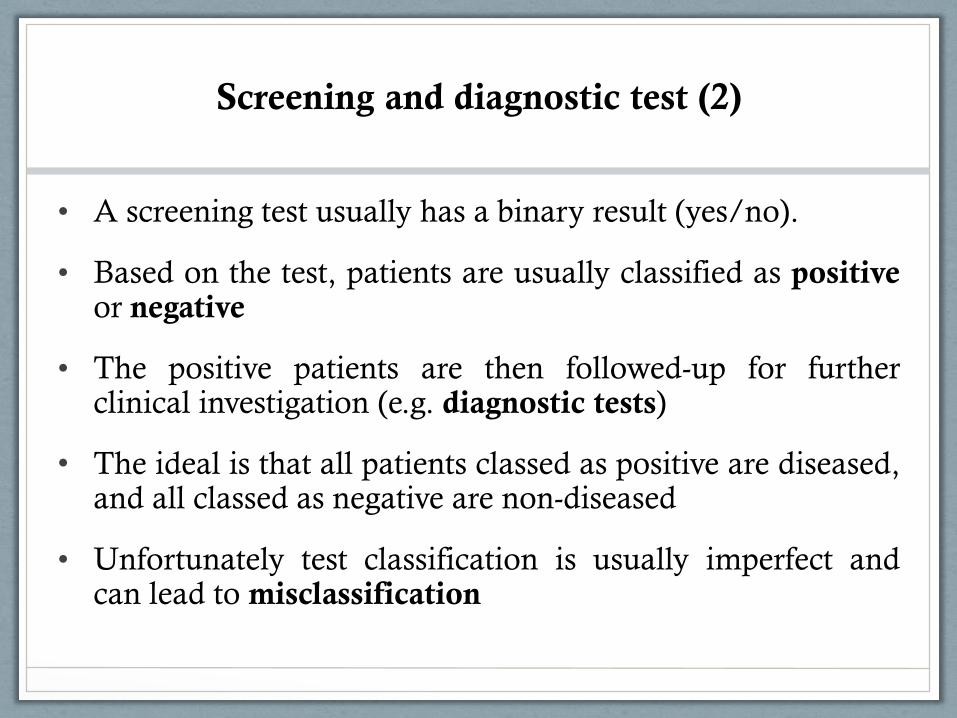
• A screening test usually has a binary result (yes/no).
• Based on the test, patients are usually classified as positive or negative
• The positive patients are then followed-up for further clinical investigation (e.g. diagnostic tests)
• The ideal is that all patients classed as positive are diseased, and all classed as negative are non-diseased
• Unfortunately test classification is usually imperfect and can lead to misclassification

How do we evaluate
the screening or diagnostic test?
Idea:
Give a group of people (with and without the disease)
both tests (the candidate test and the “gold standard”)
test and then cross-classify the results and report the
diagnostic characteristics of the test.
Note: This is not a hypothesis testing situation. But, it is about how
well does the test identify patients with a disease; AND how well does the test identify patients without a disease?
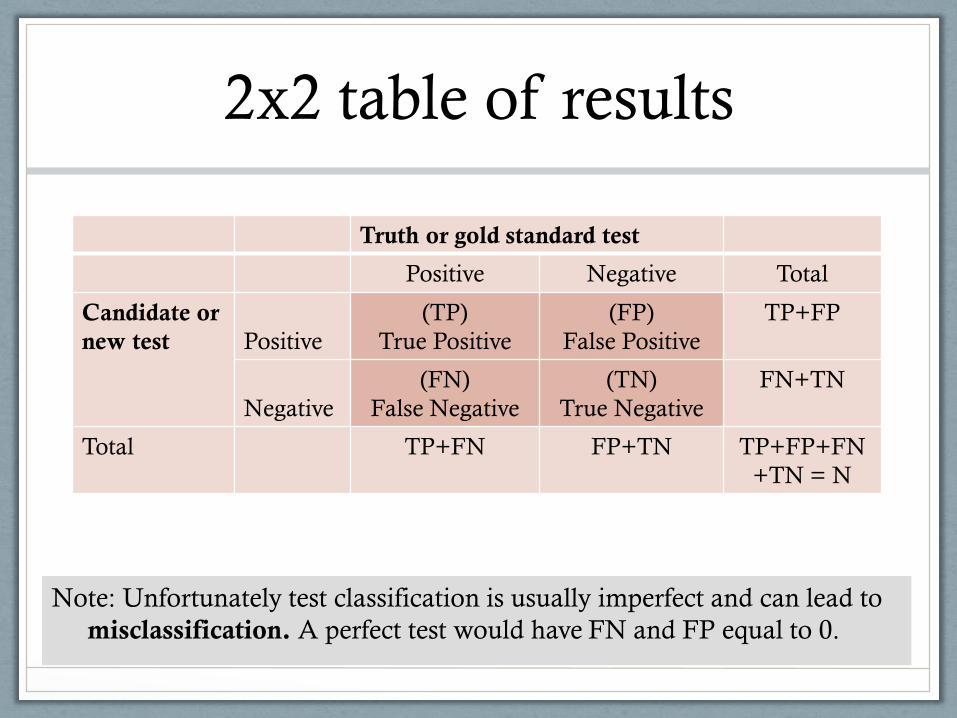
2x2 table of results
Truth or gold standard test
Positive Negative Total
Candidate or
new test
Positive
(TP)
True Positive
(FP)
False Positive
TP+FP
Negative
(FN)
False Negative
(TN)
True Negative
FN+TN
Total TP+FN FP+TN TP+FP+FN
+TN = N
Note: Unfortunately test classification is usually imperfect and can lead to
misclassification. A perfect test would have FN and FP equal to 0.

Characteristics
of a diagnostic or screening test
• Sensitivity 𝑇𝑃
𝑇𝑃+𝐹𝑁∗ 100%
• Specificity 𝑇𝑁
𝐹𝑃+𝑇𝑁∗ 100%
• Positive predictive value (PPV) 𝑇𝑃
𝑇𝑃+𝐹𝑃∗ 100%
• Negative predictive value (NPV) 𝑇𝑁
𝐹𝑁+𝑇𝑁∗ 100%
• Prevalence of disease 𝑇𝑃+𝐹𝑁
𝑁∗ 100%

Sensitivity and specificity
• Sensitivity of a test TP / (TP + FN) Test accuracy (or probability of correct classification) among patients
with disease. This is the probability that a diseased person will produce a positive test
result, and thus be correctly identified by the test. • Specificity of a test TN / (TN + FP) Test accuracy (or probability of correct classification) among patients
without disease. This is the probability that a non- diseased person will produce a
negative test result, and thus be correctly identified by the test.

Positive and negative predictive values
• Positive Predictive Value (PPV). Proportion of persons with abnormal test results who are abnormal i.e. diseased.
If a person tests positive, what is the probability that s/he has the
condition?
• Negative Predictive Value (NPV). Proportion of persons with normal test results who are normal i.e. not diseased.
If a person tests negative, what is the probability that s/he does not have
the condition?
Note: PPV and NPV give more informative from the patient or physician
perspective. PPV and NPV are special applications of Bayes Theorem.

Example
Source: The AMD DOC Study, Do et al. Ophthalmology, Vol 119, No 4, 2012
Goal: Validation of time domain optical coherence tomography (OCT) in detecting
conversion to neovascular age-related macular degeneration (nAMD) in eyes at high
risk for choroidal neovascularization, compared with detection using fluorescein
angiography (FA) as the gold standard. Number of study eyes=87.
Gold standard test: FA
Positive Negative Total
Candidate or
new test:
OCT
Positive
TP =6
True Positive
FP=21
False Positive
TP+FP=27
Negative
FN=9
False Negative
TN=51
True Negative
FN+TN=60
Total TP+FN=15 FP+TN=72 TP+FP+FN+
TN = N = 87
How well does OCT predict nAMD?

Example continued
Sensitivity = 𝑇𝑃
𝑇𝑃+𝐹𝑁∗ 100%=
6
15∗ 100% = 40%
= % with nAMD correctly diagnosed by OCT
Specificity = 𝑇𝑁
𝐹𝑃+𝑇𝑁∗ 100%=
51
72∗ 100% = 71%
PPV= 𝑇𝑃
𝑇𝑃+𝐹𝑃∗ 100% =
6
27∗ 100% = 22%
= % of those diagnosed by OCT as having nAMD that actually have
nAMD
NPV=𝑇𝑁
𝐹𝑁+𝑇𝑁∗ 100% =
51
60∗ 100% = 85%

• It depends on its purpose. A cheap mass screening test should be sensitive (few cases missed). A test designed to confirm the presence of disease should be specific (few cases wrongly diagnosed).
• Note that sensitivity and specificity are two distinct properties. Where classification is based on an cut point along a continuum, there is a tradeoff between the two.
Is it more important that a test be sensitive or
specific?

Prevalence of disease
• Sensitivity shows the ability of the new method (e.g. OCT)
to correctly identify positive (abnormal) cases.
• Specificity shows ability of the new method (e.g. OCT) to
correctly identify negative cases.
• If the OCT method is used in a different population then
the same sensitivity and specificity are anticipated,
assuming the gold standard method is perfect.
Hence, sensitivity and specificity do not depend on the true
prevalence of disease.

Prevalence continued
• Predictive values depend on the proportions in the population who are diagnosed / not diagnosed by the new method.
• Predictive values are affected by the true prevalence of abnormality.
• It is important therefore to evaluate a diagnostic test on patients with the same prevalence as those for whom the test will be used in the future.
Predictive values do depend on the true prevalence of disease.

Further comments about
screening and diagnostics tests • For sample size calculations and confidence intervals for sensitivity and
specificity see e.g. Buderer “Incorporating prevalence of disease into the sample size calculation for sensitivity and specificity”. Academic emergency medicine, Vol 3, No 9, 1996.
• For a new test based on continuous measurements (like measuring thickness in micrometers) the choice of optimal cut-off point is important, as this affects both sensitivity and specificity. This can be investigated via ROC curves.
• Likelihood ratios can also be reported. Do not add new information but offer different way of presenting same data and hence can bring new insights into interpretation.
Note: A “gold standard” test is a test that is known (or, at worst, believed) to be 100%
accurate – it gives the “right” answer. If there is no “gold standard”, there may be a very
accurate but slightly imperfect “best” method – this is usually referred to as the “reference
standard” – the assumption will be that this “reference standard” is the best available but it
is not infallible – and, of course, the degree and nature of the infallibility will be unknown
(because there is no “gold standard” against which to measure its infallibility).

Upcoming courses organized by Department of
Biostatistics at University of Liverpool
A series of workshops in November – need to register fast !
Full information
• http://www.liv.ac.uk/translational-medicine/ departmentsandgroups/biostatistics/coursesandworkshops/
Workshops include
• Statistical issues in the design and analysis of research projects, 18-22 Nov 2013
• Design and analysis of laboratory based studies, 25 Nov 2013
• Validity and reliability of diagnostic tests and other methods of measurement, 3 June 2014
• And many more…
Resources for diagnostic tests
Books
• Practical statistics for medical research by Douglas G. Altman
• Medical Statistics from Scratch by David Bowers
Papers • Buderer. Incorporating prevalence of disease into the sample size calculation for sensitivity
and specificity. Academic emergency medicine, Vol 3, No 9, 1996. • Jaeschke, Guyatt, Sackett. User’s Guides to the Medical Literature. How to use an article
about a diagnostic test. Are the resutls of the study valid? JAMA 1994
• Bossuyt, Reitsma, Bruns, Gatsonis, Glasziou, Irwig, Lijmer, Moher, Rennie, and Henrica de Vet, Toward complete and accurate reporting of studies of diagnostic accuracy: The STARD initiative. Clinical Chemistry, 49:1, 1-6, 2003.
• Lijmer, Mol, Heisterkamp, Bonsel, Prins, van der Meulen, Bossuyt. Empirical evidence of design-related bias in studies of diagnostic tests. JAMA 1999
• Whiting, Rutjes, Reitsma, Bossuyt, Kleijnen. The development of QUADAS: a tool for the quality assessment of studies of diagnostic accuracy included in systematic reviews. BMC Medical Research Methodology

Resources for general statistics
Books
• Practical statistics for medical research by Douglas G. Altman
• Medical Statistics from Scratch by David Bowers
Journals’ with series on how to do statistics in clinical research
• American Journal of Ophthalmology has Series on Statistics
• British Medical Journal has series Statistics Notes
Manual for SPSS statistical software - with lots of worked-out examples
• Andy Field, Discovering statistics using SPSS
Workshops organized by Biostatistics Department, U of Liverpool
• http://www.liv.ac.uk/translational-medicine/
departmentsandgroups/biostatistics/coursesandworkshops/
Thank you for your attention
These slides and worksheet can be found on:
http://pcwww.liv.ac.uk/~czanner/
Planned future workshops:
• How to analyze data if they are not Normal? Nonparametric methods
• How to make sense of many measured characteristics? Multivariate stats methods
• Ideas are welcome!
Statistical Clinics for ophthalmic clinicians and researchers !
Run by appointment.
Email: [email protected]
Phone: +44-151-706-4019
Further information: http://pcwww.liv.ac.uk/~czanner/


![Screening and Diagnostic Test10[1]](https://img.dokumen.tips/doc/110x75/577dac8a1a28ab223f8dfd9d/screening-and-diagnostic-test101.jpg)