Embed Size (px)
Citation preview

City of New York OFFICE OF THE COMPTROLLER
Scott M. Stringer COMPTROLLER
MANAGEMENT AUDIT Marjorie Landa Deputy Comptroller for Audit
Audit Report on the Performance of New York City Express Buses Operated by the Metropolitan Transportation Authority
MH13-118A April 22, 2015 http://comptroller.nyc.gov


TABLE OF CONTENTS EXECUTIVE SUMMARY ............................................................................ 1
Audit Findings and Conclusion .................................................................................... 1
Audit Recommendations .............................................................................................. 2
Agency Response ........................................................................................................ 2
AUDIT REPORT ......................................................................................... 3
Background ................................................................................................................. 3
Objective ...................................................................................................................... 3
Scope and Methodology Statement ............................................................................. 3
Discussion of Audit Results with MTA ......................................................................... 4
FINDINGS AND RECOMMENDATIONS .................................................... 5
On-Time Performance ................................................................................................. 5
Sampled Express Buses Were On Time Less Than 70 Percent of the Time ........... 5
MTA Does Not Publicly Report Performance Indicators for Express Buses ............. 9
Recommendations ................................................................................................. 10
MTA Lacks Updated Standardized Procedures for the Weekly Checking of Wheelchair Lifts ......................................................................................................... 10
Recommendations ................................................................................................. 11
MTA Has Recently Upgraded Its Customer Complaint Tracking System .................. 11
Recommendation ................................................................................................... 13
DETAILED SCOPE AND METHODOLOGY ............................................. 14
APPENDIX I ............................................................................................. 16
APPENDIX II ............................................................................................ 17
APPENDIX III ........................................................................................... 18
APPENDIX IV ........................................................................................... 19
ADDENDUM

THE CITY OF NEW YORK OFFICE OF THE COMPTROLLER
MANAGEMENT AUDIT
Audit Report on the Performance of New York City Express Buses
Operated by the Metropolitan Transportation Authority MH13-118A
EXECUTIVE SUMMARY
This audit determined whether the Metropolitan Transportation Authority (MTA) adequately monitored the performance of its express buses with respect to on-time performance, wheelchair lift functionality, and customer satisfaction.
The MTA was created in 1965 as a public-benefit corporation chartered by the New York State Legislature. New York City Transit (NYCT), one of the several agencies that comprise the MTA, operates and maintains the City’s subways and some of the bus service lines (local and express). The MTA Bus Company (MTA Bus), another agency that is part of the MTA, was created to assume the operations of seven privately operated bus companies that ran both local and express bus lines under agreements with the City’s Department of Transportation. MTA Bus and NYCT are each responsible for the operation and maintenance of their own local and express bus fleets.
Based on data obtained from the MTA, MTA Bus and NYCT operated a fleet of 509 and 508 express buses, respectively, as of January 5, 2014, with annual ridership of 9,023,396 and 11,544,719, respectively, for Calendar Year 2013.
Audit Findings and Conclusion The MTA does not have on-time performance targets for the percentages of buses that it expects should be on time. However, it does have criteria by which it measures timeliness for a scheduled pick-up. Our field observations found that 31 percent of sampled express buses were not on time, based on the MTA’s criteria for timeliness. Additionally, the MTA does not publicly report progress towards meeting its targets for reliable express bus service. The MTA has developed two bus performance indicators—percent of bus trips completed and mean distance between failures—to measure how well it is attaining its goal of service reliability. When reporting bus performance, however, it combines the results for express buses with those of the much larger population of local buses. Consequently, the riding public has no means of assessing express bus service performance.
In May 2014, the MTA completed its implementation of a computer program called Bus Trek, which uses GPS-generated data to track the location of its local and express buses in real-time. With Bus Trek, the MTA now contends that it has the ability to track the on-time performance for express buses on a regular or consistent basis. The agency, however, has still not developed on-time performance targets for express bus service.
Office of New York City Comptroller Scott M. Stringer MH13-118A 1

The audit also found that the MTA has not developed a standard methodology for conducting routine checks of wheelchair lifts on express buses, increasing the risk that deficient inspections may occur and personnel will not identify and correct problems with lifts in a timely manner.
Subsequent to the initiation of this audit, the MTA overhauled its tracking of customer complaints to enable it to better evaluate customer satisfaction with its express bus service. In April 2014, the MTA rolled out the Customer Relationship Management (CRM) system, which is designed to enable the MTA to track customer complaints more effectively. The MTA expects that the CRM system will allow the agency to better identify persistent service issues raised by customers and take steps to address them in a timelier manner.
Audit Recommendations Based on the audit, we make the following recommendations:
• The MTA should continue to utilize Bus Trek to modify and improve express bus schedules so that they are more reliable.
• The MTA should develop on-time performance and other performance targets for its express buses and publicly report progress toward meeting those targets.
• The MTA should update its cycling directive to include procedures for the wheelchair lift inspection of the express buses currently used in its fleets.
• The MTA should ensure that the updated cycling directive is communicated to all necessary officials and followed.
• The MTA should continue to utilize CRM in tracking express bus service complaints so that it can more effectively determine trends and patterns that need to be addressed.
Agency Response MTA officials agreed with four of the audit’s five recommendations. Officials did not indicate whether they agreed with our recommendation that the MTA develop performance targets for its express buses and publicly report progress toward meeting those targets.
Office of New York City Comptroller Scott M. Stringer MH13-118A 2

AUDIT REPORT
Background The MTA was created in 1965 as a public-benefit corporation chartered by the New York State Legislature. Its mission is to preserve and enhance the quality of life and economic health of New York City and the surrounding region through the cost-efficient provision of safe, on time, reliable, and clean transportation services.1 NYCT, one of the several agencies that comprise the MTA, operates and maintains the City’s subways and some of the bus service lines (local and express). MTA Bus, another agency that is part of the MTA, was created in September 2004 to assume the operations of seven privately operated bus companies that ran both local and express bus lines under agreements with the City’s Department of Transportation. MTA Bus and NYCT are each responsible for the operation and maintenance of their own local and express bus fleets.
The MTA’s Department of Buses (DOB) has jurisdictional responsibility for the MTA Bus and NYCT buses. DOB’s Regional Operations oversees depot operations, which include assigning bus operators to bus routes and ensuring that the buses dispatched for service are in good working order. DOB’s Road Operations, which is a part of Regional Operations, is responsible for the buses once they leave the depots and are on their scheduled runs.2 DOB’s Maintenance and Support Services (Maintenance) is responsible for bus maintenance and repairs.
Based on data obtained from the MTA, MTA Bus and NYCT operated a fleet of 509 and 508 express buses, respectively, as of January 5, 2014, with annual ridership of 9,023,396 and 11,544,719, respectively, for Calendar Year 2013. As of March 22, 2015, one-way fares for express bus rides increased to $6.50 from $6.00 and local bus rides were increased to $2.75 from $2.50. Single-ride tickets for local buses sold at vending machines increased from $2.75 to $3.00.
Objective To determine the adequacy of the MTA’s monitoring of the performance of its express buses with respect to on-time performance, wheelchair lift functionality, and customer satisfaction.
Scope and Methodology Statement We conducted this performance audit in accordance with generally accepted government auditing standards. Those standards require that we plan and perform the audit to obtain sufficient, appropriate evidence to provide a reasonable basis for our findings and conclusions based on our audit objective. We believe that the evidence obtained provides a reasonable basis for our findings and conclusions based on our audit objective. This audit was conducted in accordance with the audit responsibilities of the City Comptroller as set forth in Chapter 5, §93, of the New York City Charter.
1The MTA transportation network serves a 5,000-square-mile area fanning out from New York City through Long Island, southeastern New York State, and Connecticut. 2Regional Operations and Road Operations have one division in each borough except Queens, which has two (Queens North and Queens South).
Office of New York City Comptroller Scott M. Stringer MH13-118A 3

The original audit scope was January 1, 2012, to December 31, 2013. However, we expanded our scope to June 17, 2014, to conduct observations and walkthroughs of wheelchair lift inspections.
Please refer to the Detailed Scope and Methodology at the end of this report for the specific procedures and tests that we conducted.
Discussion of Audit Results with MTA The matters covered in this report were discussed with MTA officials during and at the conclusion of this audit. A preliminary draft report was sent to MTA officials on February 4, 2015, and was discussed at an exit conference held on March 3, 2015. On March 20, 2015, we submitted a draft report to MTA officials with a request for comments. We received a written response from MTA officials on April 9, 2015. In their response, MTA officials agreed with four of the audit’s five recommendations. Officials did not indicate whether they agreed with our recommendation that the MTA develop performance targets for its express buses and publicly report progress toward meeting those targets but state that “[t]he MTA is currently evaluating how best to measure express bus performance utilizing Bus Time data.” The full text of the MTA’s response is included as an addendum to this report.
Office of New York City Comptroller Scott M. Stringer MH13-118A 4

FINDINGS AND RECOMMENDATIONS
Although the MTA began tracking the on-time performance of express buses in May 2014, it still does not have on-time performance targets for the percentages of buses that it expects should be on time. However, it does have criteria by which it measures timeliness for a scheduled pick-up. Our field observations found that 31 percent of sampled express buses were not on time, based on the MTA’s criteria for timeliness.
Additionally, the MTA does not publicly report progress towards meeting its targets for reliable express bus service. The MTA has developed two bus performance indicators—percent of bus trips completed and mean distance between failures—to measure how well it is attaining its goal of service reliability. However, when reporting bus performance, it combines the results for express buses with those of the much larger population of local buses. Consequently, the riding public has no means of assessing express bus service performance.
The audit also found that the MTA has not developed a standard methodology for conducting routine checks of wheelchair lifts on express buses. As a result, there is an increased risk that deficient inspections may occur and personnel will not identify and correct problems with lifts in a timely manner.
Finally, the MTA implemented a new complaint management system during the course of the audit to help it assess customer satisfaction and address complaints. Prior to April 2014, the agency’s complaint tracking system did not allow management to categorize complaints to identify significant problem areas, which hindered management’s ability to address service problems in a timely manner. The MTA expects that the new system will address this deficiency.
These findings are discussed in more detail below.
On-Time Performance
Sampled Express Buses Were On Time Less Than 70 Percent of the Time
Based on our observations, we found that sampled express buses were on time only 69 percent of the time as measured against the MTA’s criteria for timeliness. The MTA considers an express bus on time if it departs no more than one minute before or five minutes after the posted scheduled time for that stop. MTA officials stated that the posted time for the last scheduled passenger pick-up point in the originating borough should be the relevant point in time from which to measure timeliness.3 However, to determine whether buses also began their routes on time, we used the first and last scheduled passenger pick-up points as the relevant points in time for on-time performance purposes.
During the period October 18, 2013, through December 5, 2013, we conducted 40 observations (encompassing 645 scheduled bus runs going to and departing from Manhattan) at the relevant points in time for the sampled express bus routes. We observed the following bus routes: BM1, X27, and X28, originating in Brooklyn; QM2, QM5, X63, and X68, originating in Queens; X1 and
3 For example, for buses traveling from Staten Island to Manhattan, the point in time from which timeliness would be measured is the last scheduled passenger pick-up point in Staten Island. For buses traveling from Manhattan to Staten Island, the last scheduled passenger pick-up point in Manhattan would be the point in time from which timeliness would be measured.
Office of New York City Comptroller Scott M. Stringer MH13-118A 5

X17, originating in Staten Island; and the BxM1, BxM7, and BxM9, originating in the Bronx.4 We found that the buses departed on time for 443 (68.7 percent) of the 645 observations. Table I presents a breakdown of the on-time performance of the sampled express buses during our observations.
Table I
On-Time Performance of Scheduled Express Buses Based on Observations Conducted
October through December 2013
Express Bus On-Time Performance
No. of Observations Percentage
On-Time Performance Percentage
On time 443 68.7% 68.7% Departed More than One Minute Prior to Scheduled Time 44 6.8%
31.3% Departed More than Five Minutes After Scheduled Time 136 21.1% No Bus Appeared* 22 3.4%
Total 645 100% 100% *The No Bus Appeared figure reflects the number of buses that were scheduled to arrive during our observation periods but were not observed by the auditors. These buses may have arrived after our observations ended.
A breakdown of the performance by borough found that the sampled express buses operating in the Bronx had the best on-time performance at 79.7 percent, followed by Queens at 67.9 percent, Brooklyn at 66.3 percent, and Staten Island at 64.1 percent. Table II presents a breakdown of the on-time performance by borough. (Appendix I shows the breakdown by sampled bus route.)
Table II
On-Time Performance of Scheduled Express Buses by Borough of Service
Origin*
Borough Total No. of Observations
Total On
Time % On Time
Not On Time
Morning Early
Departure
Morning Late
Departure
Afternoon Early
Departure
Afternoon Late
Departure
Never Arrived During
Observation
Total Not On
Time
% Not On
Time
Bronx 123 98 79.7% 2 0 0 21 2 25 20.3%
Queens 168 114 67.9% 2 24 5 17 6 54 32.1%
Brooklyn 187 124 66.3% 19 5 0 36 3 63 33.7%
Staten Island 167 107 64.1% 7 5 9 28 11 60 35.9%
Total 645 443 68.7% 30 34 14 102 22 202 31.3% *Buses depart in the morning from their home borough of origin and generally return from Manhattan to their home borough in the evening. Some buses may make several roundtrips from their borough of origin each day.
4 We conducted our observations during the morning rush hours (7:00 a.m. to 9:00 a.m.) for buses heading to Manhattan and the evening rush hours (4:30 p.m. to 6:30 p.m.) for buses leaving Manhattan.
Office of New York City Comptroller Scott M. Stringer MH13-118A 6

As Table II shows, the vast majority of late departures occurred in the afternoon, with Brooklyn ranking highest with 36 late departures. Queens had the highest number of late departures during the morning rush with 24 late departures. Brooklyn had the highest number of early departures, with 19 of the 30 buses leaving too early during the morning rush. (A more detailed table showing the time ranges for early and late departures appears in Appendix II.)
The inconvenience to passengers is perhaps greater when a bus departs early than when it departs late. This is because where a bus departs earlier than scheduled, passengers who arrive at a bus stop less than one minute prior to the scheduled bus departure time not only miss a bus that they expected to catch, but also then have to wait a longer period of time for the next scheduled bus to arrive. If the subsequent bus arrives late, the passenger’s wait time is even greater. For example, on October 29, 2013, we observed a bus with run number 703 (route X1 heading to Staten Island) scheduled to depart from Manhattan’s Broadway and Battery Place stop at 4:46 p.m. actually depart at 4:41 p.m., 5 minutes prior to the scheduled time. As a result, passengers who may have arrived at the stop at 4:44 p.m. would have had to wait 9 minutes to catch the next bus, which was scheduled to depart from the stop at 4:53 p.m., rather than 2 minutes for an on-time 4:46 p.m. bus. We also observed that the 4:53 p.m. bus did not actually depart until 5:08 p.m. (15 minutes late). Therefore, the actual wait time for those passengers who arrived on time for the prior bus would have been 24 minutes. Further, it is likely the bus that departed at 5:08 p.m. was more crowded than usual because it included passengers who missed the earlier bus as well as passengers who were waiting for the bus that should have arrived on time.
Thus, the on-time performance from the customer’s perspective is also an important indicator that we examined. An example of the impact of delayed buses on the on-time performance from the customer’s perspective is illustrated in Chart I below. As shown in the chart, the MTA scheduled buses A, B, and C to depart from a particular bus stop at 8:20 a.m., 8:40 a.m., and 9:00 a.m., respectively. Only one of the buses—bus C—departed on time (at 9:00 a.m.). However, customers who arrived at the bus stop at the scheduled departure times (as listed at the bus stop) would find that a bus departed at the scheduled time in two instances from their point of view—8:40 a.m. and 9:00 a.m. (Bus A departed from the stop at the time bus B was scheduled to depart, and both buses B and C departed at the scheduled time for bus C.)
Chart I
On-Time Performance (MTA’s Perspective) Versus On-Time Performance (Customer’s
Perspective) (an example)
Bus Bus’s scheduled departure time from a bus stop
Bus’s actual departure time
from the bus stop
Difference between scheduled and actual
departure times
Customer actual wait time at the bus stop
A 8:20 a.m. 8:40 a.m. 20 20 B 8:40 a.m. 9:00 a.m. 20 0 C 9:00 a.m. 9:00 a.m. 0 0
We performed an analysis of 644 departures and assessed the number of instances in which a bus departed from a bus stop at the scheduled departure time. Our review found that for 543 (84.3%) of our 644 assessments, one or more buses departed from a stop on time from the customer’s point of view (i.e., no more than 1 minute before or 5 minutes after the departing time
Office of New York City Comptroller Scott M. Stringer MH13-118A 7

recorded at the bus stop, regardless of whether it was the scheduled bus). For the remaining 101 assessments in which a bus did not depart at the scheduled time, the average length of time that customers had to wait after the scheduled departure time was 10 minutes, ranging from 6 minutes to 28 minutes. (Appendix III and Appendix IV contain further breakdowns of the on-time performance from the customer’s perspective.)
As indicated by our analysis of the on-time performance from the customer’s perspective, the percentage of on-time departures for sampled observations becomes higher when the analysis does not differentiate between the buses that were actually scheduled to depart at those times and those that were not. However, this percentage does not reflect the increased risk of overcrowding when buses do not follow their scheduled times. Bus overcrowding is a significant inconvenience on express buses, which travel longer distances on highways than local buses and which are not designed for standing customers. Late buses tend to have more crowding because, in addition to passengers who were at the stop at the scheduled departure times, they also pick up passengers who arrived after those scheduled times but before the late bus arrived. Conversely, the next scheduled bus may pick up fewer passengers than normal because some of the regular passengers caught the previous (late) bus. With fewer passengers, it is also more likely that the subsequent bus may even catch up to the prior bus, resulting in “bus bunching.”5
According to the MTA, traffic conditions are the greatest obstacle to express bus on-time performance. Officials attributed 88 percent of the bus delays and some of the early bus departures that we observed to traffic conditions. The MTA also cited heavy ridership, dispatcher re-routes, and late departures from depots as reasons for delays. MTA officials stated that they are continually working with the Department of Sanitation (DSNY), Department of Transportation (DOT), and Police Department (NYPD) to try to mitigate conditions that lead to bus delays. As an example, MTA officials stated that they coordinate with DSNY officials to have garbage pick-up times shifted to non-rush hour periods along major express bus routes in order to reduce street congestion.
However, the audit found that another significant obstacle to improving express bus timeliness is the fact that the MTA did not, until recently, track the on-time performance for express buses on a regular or consistent basis. Prior to May 2014, the MTA only conducted observations of buses on a rotational basis every one to two years to evaluate the bus schedules, address an issue with a particular route, or meet federally mandated requirements. Without regular and consistent data tracking the on-time performance of express buses over time, the MTA has been significantly hindered in identifying persistent timeliness issues and in gauging how well its remedies are working. The lack of data also restricted the MTA’s ability to develop more realistic time schedules, which exacerbates problems with on-time performance.
To help address this problem, the MTA has recently implemented Bus Trek, a computer program that uses GPS-generated data to track the location of its buses (both express and local) in real-time.6 MTA officials anticipate that this program will help its dispatchers and managers monitor the timeliness of express buses more effectively.
At an exit conference held with MTA officials after we provided them with a preliminary draft of our findings, they expressed concern that this audit report does not discuss the improvement in express bus service since the implementation of Bus Trek. Subsequent to the exit conference,
5 Chart I shows buses B and C both departing from the stop at 9:00 a.m., an example of “bus bunching.” 6 The implementation of Bus Trek began in January 2012 in Staten Island and was completed in May 2014 when it was implemented in Brooklyn and Queens. Bus Time, a customer-oriented counterpart to Bus Trek, was also fully implemented in May 2014. Using the same GPS generated data used by Bus Trek, Bus Time is a Smartphone application that provides passengers with real-time information about the location of local and express buses.
Office of New York City Comptroller Scott M. Stringer MH13-118A 8

the MTA provided us with its Performance Overview - All Boroughs summaries for October and November 2014, which contain the on-time performance results for its express buses during that period.7 At first glance, it appears that on-time performance has declined since we conducted our observations in October and November of the prior year. (The MTA reports that 63.1 percent of express buses were on time in October and November 2014 while our analysis of the on-time performance for the same months in 2013 found that 68.7 percent of the express buses we observed were on time.) However, the two figures are not comparable because 1) the MTA figure includes the entire population of express buses while our figure includes only a sample of express buses and 2) the MTA includes all scheduled passenger pick-up points in its calculation of on-time performance while we included only the first or last scheduled passenger pick-up points in our calculation. Consequently, based on the new data provided by the MTA, we are unable to ascertain whether timeliness has improved or deteriorated since Bus Trek’s implementation.
MTA officials also expressed concern that the audit does not discuss the implementation of Bus Trek in more detail. However, we note that the objective of this audit was to determine the adequacy of the MTA’s monitoring of the performance of its express buses, which is what is addressed in this audit report. While, as we note, the implementation of Bus Trek now appears to give the MTA the ability to track the on-time performance for express buses on a regular or consistent basis, the agency has still not developed on-time performance targets for express bus service and it does not publicly report progress towards meeting its targets for reliable express bus service. This latter issue is discussed in more detail below.
MTA Does Not Publicly Report Performance Indicators for Express Buses
The MTA has established performance indicators as they relate to its goal of providing on-time and reliable bus service to customers. However, the MTA does not publicly report on these performance indicators specifically for express buses.
The New York State Public Authorities Law (Article 9, Title 2, §2824-a) requires the MTA, as a public authority, to submit and publicly post on its website a description of its mission, the reasonable expectations of its stakeholders, and the measurements by which performance and goals will be evaluated. In addition, the statute requires the MTA to annually reexamine its mission statement and measurements and publish its performance results.
On its website, the MTA identifies the percentage of bus trips completed and mean distance between failures as performance indicators for its goal of providing on-time and reliable bus service to its customers.8 According to the MTA’s website, the percentage of bus trips completed is the percent of the total number of scheduled bus trips that were completed and the mean distance between failures is the average number of miles a bus travels between mechanical failures. Though the MTA has developed targets for these performance indicators and publicly posts its progress toward meeting those targets, the MTA does not separately report the results for its express buses from the results for its much larger population of local buses.9 Additionally, as stated earlier, the MTA has not established on-time performance targets for either its express or local buses. The MTA only uses on-time performance and wait time as performance indicators for its subway service.
7 We did not test the accuracy of the performance figures received from the MTA. 8 http://web.mta.info/mta/compliance/pdf/MTA_Mission_Statement.pdf 9 Express buses account for 1,017 (18 percent) of the MTA’s entire fleet of 5,714 buses.
Office of New York City Comptroller Scott M. Stringer MH13-118A 9

With the final implementation of Bus Trek in May 2014, the MTA anticipates that it will be able to track the timeliness of buses at their scheduled stops along their entire routes, not just the first and last scheduled stops. Once the data gathering and reporting capabilities of Bus Trek are fully developed, MTA officials expect the agency to be better able to effectively manage its bus schedules. In addition, MTA officials stated that the agency is in the process of developing on-time performance targets for its express buses.
Although the New York State Public Authorities Law does not require the MTA to maintain and publicly report performance goals and indicators specifically for its express bus service, the law does require that it annually reexamine its mission statement and measurements and publish its performance results.
In the absence of express bus performance targets, the MTA’s ability to gauge how well it is meeting its goal of providing on-time and reliable service to express bus customers is severely hampered.
Recommendations
1. The MTA should continue to utilize Bus Trek to modify and improve express bus schedules so that they are more reliable. MTA Response: “Agreed. The MTA will continue to utilize Bus Trek to modify and improve express bus schedules so that they are more reliable.”
2. The MTA should develop on-time performance and other performance targets for its express buses and publicly report progress toward meeting those targets. MTA Response: “The MTA is currently evaluating how best to measure express bus performance utilizing Bus Time data.” Auditor Comment: Once the MTA establishes performance targets for its express bus service, it is equally important that it publicly report the degree to which it is meeting those targets to increase accountability and transparency with its stakeholders.
MTA Lacks Updated Standardized Procedures for the Weekly Checking of Wheelchair Lifts The audit found that the MTA depots do not consistently conduct weekly examination (cycling) of wheelchair lifts on express buses and do not follow standardized inspection procedures. An MTA Directive, Cycling of Wheelchair Lifts at Depots (dated February 28, 1995) requires the weekly cycling of wheelchair lifts.10 Nevertheless, we found that some depots conducted the cycling on a bi-weekly basis. In fact, the general superintendent at one depot was apparently unaware of the timeframe stated in the directive and told us that there was no requirement to cycle the buses weekly.
In addition, the directive that mandates weekly cycling of wheelchair lifts was issued prior to the existence of the bus models currently in use and the inspection procedures presented in this directive do not apply to any of the bus models that are currently in use for express buses. As a result, the depots have each adopted their own procedures for conducting cycle inspections,
10 More thorough inspections of wheelchair lifts are conducted as part of the mandatory bus inspections done every 6,000 miles or 90 days, whichever comes first.
Office of New York City Comptroller Scott M. Stringer MH13-118A 10

along with their own standards for the qualifications and training of the cyclers who perform them. Significant inconsistencies exist among the depots. For example, at two depots, cyclers moved the seats while testing the lifts, while cyclers at the other two depots did not. At one of the two depots where the seats were moved, the cycler used weights to test the lifts, while at the other three depots the cyclers merely checked whether the lifts were operating. The absence of updated cycling procedures that set minimum standards for these inspections and a monitoring system to ensure that these procedures are consistently followed creates an increased risk that deficient inspections may occur and that wheelchair lifts with problems will not be identified or corrected in a timely manner.
During our observations of the wheelchair cycling process at four sampled depots, we found that cyclers identified problems with six of the forty wheelchair lifts they examined. All the buses that were found to have wheelchair lift problems were immediately referred to maintenance for repairs. However, during our observations of express buses in operation at the sampled bus stops, in the one instance where a passenger requested the use of the wheelchair lift, it failed to function properly, even after repeated attempts. The dispatcher on duty subsequently removed the bus from service and dispatched a replacement bus to complete the route.11
Recommendations
3. The MTA should update its cycling directive to include procedures for the wheelchair lift inspection of the express buses currently used in its fleets. MTA Response: “Agreed. Buses is preparing a directive which will delineate wheelchair lift and ramp cycling procedures for all type buses.”
4. The MTA should ensure that the updated directive is communicated to all necessary officials and followed. MTA Response: “Agreed. Buses will ensure that the updated cycling directive is communicated to all necessary officials and followed.”
MTA Has Recently Upgraded Its Customer Complaint Tracking System Subsequent to the initiation of this audit, the MTA overhauled its tracking of customer complaints to enable it to better evaluate customer satisfaction with its express bus service. MTA officials emphasized that customer complaints are an integral component of measuring customer satisfaction with its express bus service. They also acknowledged that express bus customers pay a premium for the service they get and tend to be more vocal about service issues. As a result, MTA officials stated that they monitor increases in complaints, which may signal a problem with service on a particular line or route.
The customer complaint system that was in place until April 2014 significantly limited the MTA’s ability to monitor and address complaints. Prior to that time, the MTA used a Microsoft Excel-based system to record bus-related customer complaints received via email, telephone, in-person walk-in visits, and letters. Data fields recorded the date, time, bus route, depot, complaint status, and a brief description of the incident and/or complaint. However, the system did not allow management to categorize complaints (e.g., by type of complaint or priority of the complaint) or
11 Since this incident occurred at the first scheduled stop on the route, the passengers had to wait only three minutes for the replacement bus to arrive.
Office of New York City Comptroller Scott M. Stringer MH13-118A 11

to generate reports to identify significant problem areas. As a result, management’s ability to effectively gauge customer dissatisfaction or address service problems in a timely manner was significantly hindered.
Beginning in April 2014, the MTA rolled out the CRM system, which is intended to enable it to track customer complaints more effectively. Initially used primarily for customer complaints received via email, the MTA has since expanded CRM to track complaints received via telephone, in-person visits, and letters. According to MTA officials, the CRM system automatically generates complaint reference numbers and can designate the MTA division (e.g., NYCT, MetroNorth) and service (e.g., subway, local bus, express bus) related to the complaint. In addition, the new system allows the complaint takers to designate a category for the complaints using a drop-down list of complaint-type keywords.
According to complaint totals obtained from the MTA using CRM, the MTA received 660 complaints related to express bus service during the period of May 1, 2014, through September 17, 2014.12 Table III provides the breakdown of the top ten express bus service complaints received by the MTA as recorded in CRM.
Table III
Top 10 Express Bus Customer Complaint Categories (5/1/14 to 9/17/14)
Top 10 Express Bus Complaints by Category
No. of Complaints Received Percent
1 Late/Delay 252 38.2%
2 Flagging/Failed to stop (bypassed stop/kept going) 87 13.2%
3 Failure to make scheduled stop 53 8.0% 4 Rude/Inappropriate language 45 6.8% 5 Reckless driving 38 5.8%
6 Closed door before customer could board 16 2.4%
7 Add more/Not enough (buses) 14 2.1% 8 Not helpful 11 1.7% 9 Early 10 1.5% 10 Overcrowding 9 1.4% All others 125 18.9% Total 660 100.0%
As shown in the table above, bus lateness was the number one complaint received, accounting for almost 40 percent of the complaints. Bypassing stops or failing to make scheduled stops accounted for another 21 percent of the complaints received by the MTA. The MTA expects that the CRM system will allow the agency to better identify persistent service issues raised by customers and take steps to address them in a timelier manner.
12 We did not test the accuracy of the complaint data received from the MTA.
Office of New York City Comptroller Scott M. Stringer MH13-118A 12
Recommendation
5. The MTA should continue to utilize CRM in tracking express bus service complaints so that it can more effectively determine trends and patterns that need to be addressed. MTA Response: “Agreed. The MTA will continue to utilize CRM to track express bus service complaints to effectively determine trends and patterns.”
Office of New York City Comptroller Scott M. Stringer MH13-118A 13
DETAILED SCOPE AND METHODOLOGY
We conducted this performance audit in accordance with generally accepted government auditing standards. Those standards require that we plan and perform the audit to obtain sufficient, appropriate evidence to provide a reasonable basis for our findings and conclusions based on our audit objective. We believe that the evidence obtained provides a reasonable basis for our findings and conclusions based on our audit objective. This audit was conducted in accordance with the audit responsibilities of the City Comptroller as set forth in Chapter 5, §93, of the New York City Charter.
The original audit scope was January 1, 2012, to December 31, 2013. However, we expanded our scope to June 17, 2014, to conduct observations and walkthroughs of wheelchair lift inspections.
To gain an understanding of the MTA and its responsibilities with respect to express bus service in NYC, we reviewed Article 5, Titles 9 and 11, and Article 9 of the New York State Public Authorities Law, MTA organization charts, and other relevant material obtained from the MTA and its website. We also met with various senior MTA officials, including the heads of the Operations Planning, Regional Operations, Strategic Planning, and Technical Services Engineering units, all under the Department of Buses.
To evaluate the adequacy of the MTA’s express bus service, we reviewed performance data reported on the MTA’s website and other data internally generated by the MTA that tracked the performance of its buses. We also requested copies of any performance indicator reports that were shared with senior management officials.
To evaluate the performance of the MTA’s express buses, we conducted field observations from October 18, 2013, to December 5, 2013. The audit team judgmentally selected 12 express bus routes, selecting those routes with the largest volume of bus runs. We performed 40 observations during the morning and afternoon rush hours at the relevant points in time (at the first and last posted scheduled stops in the borough from which the buses started their trip), encompassing 645 scheduled bus runs. MTA officials stated that the posted time for the last scheduled passenger pick-up point in the originating borough should be the relevant point in time by which to measure timeliness. However, to determine whether buses also began their routes on time, we used the first and last scheduled passenger pick-up points as the relevant points in time for on-time performance purposes.
During our observations, the auditors noted the following: 1) the bus’s arrival and departure times; 2) the bus and run number; 3) the number of passengers getting on and off the bus at the observed stop; 4) the appearance of the bus (e.g., cleanliness, working signs); 5) and whether there were passengers standing inside the bus. In addition, the auditors noted if the bus operator needed to use the wheelchair lift and if there were any problems during its operation.
After we completed these observations, we compared the data we obtained to that which the MTA maintained to determine whether its data was consistent with our observations. Specifically, we determined whether the buses the MTA scheduled and sent on runs for the selected routes were observed on their scheduled runs and whether they were on time. We calculated on-time performance using the MTA’s own standards for determining on-time performance (departures less than one minute before or five minutes after the posted scheduled time).
Office of New York City Comptroller Scott M. Stringer MH13-118A 14

Separately, we calculated how much longer a passenger had to wait to catch the next arriving bus because the scheduled bus departed too early. Because a customer may not be present to observe a bus that departed too early from its scheduled time, we calculated the length of time a customer would have to wait for the next bus to arrive had the customer arrived at the stop just as the first bus was leaving (before its scheduled time).
We also conducted an on-time performance analysis from the passengers’ perspective by determining the number of times that a bus arrived at a scheduled stop on time, regardless of whether the bus that arrived at the stop was the bus scheduled by the MTA to arrive at that time. We calculated on-time performance using the MTA’s own standards.
Throughout the audit, MTA officials provided us with an understanding of how Bus Trek and Bus Time operate and how they are using the two systems to improve the on-time performance and reliability of express bus service.
For the weekly cycling of wheelchair lifts, we reviewed the MTA Directive entitled Cycling of Wheelchair Lifts at Depots (dated February 28, 1995). We interviewed MTA personnel, including depot superintendents, cyclers, supervisors, and repair shop staff to get an understanding of the cycling process. At four judgmentally selected depots (one from each borough that maintains an express bus depot), we observed cyclers as they performed their examination of the wheelchair lifts.
We researched the MTA’s website to determine whether the performance indicators relating to the MTA’s goal of providing on-time and reliable service were publicly reported. We also interviewed MTA officials to identify the performance measures that the MTA maintains, the performance goals it has set for those measures, and whether those targets for the express bus service were met. We also surveyed 10 judgmentally selected cities across the United States (based on population size and geographic location) to determine whether they maintained performance goals for express bus service. The cities surveyed were: 1) Boston, MA; 2) Chicago, IL; 3) Columbus, OH; 4) Detroit, MI; 5) Houston, TX; 6) Indianapolis, IN; 7) Jacksonville, FL; 8) San Antonio, TX; 9) San Diego, CA; and 10) Los Angeles, CA.
To obtain an understanding of the process for tracking and following up on complaints related to express bus service, we held a walkthrough meeting with MTA officials responsible for addressing customer complaints. These officials were responsible for the new CRM complaint management system, which since April 2014 has been used to log, track, and manage all bus-related complaints. In addition, we obtained the dataset of complaints received by the MTA for Calendar Year 2013, which was maintained in a Microsoft Excel-based system. We also obtained the most numerous complaints by type of complaint related to express bus service that the MTA received during the period of May 1, 2014, through September 17, 2014. We did not test the accuracy of the complaint data obtained from the MTA.
Office of New York City Comptroller Scott M. Stringer MH13-118A 15

APPENDIX I On-Time Performance of Scheduled Express Buses
By Borough of Service Origin*
Borough Bus Route
Number of Buses
Scheduled by the MTA
Total On
Time** % On Time
Buses Scheduled by the MTA that Were Not On Time
Number of Buses Observed
Morning Rush Hours
Afternoon Rush Hours Total # of
Buses Observed Departing Early or
Late
No-Shows
Total # of Buses Not On Time***
% Not On Time
Early
D
epar
ture
Late
D
epar
ture
Early
D
epar
ture
Late
D
epar
ture
Bronx BxM1 23 23 14 60.9% - - 0 9 9 0 9 39.1% Bronx BxM7 66 64 52 78.8% 0 0 0 12 12 2 14 21.2% Bronx BxM9 34 34 32 94.1% 2 0 - - 2 0 2 5.9%
Bronx 123 121 98 79.7% 2 0 0 21 23 2 25 20.3% Brooklyn BM1 43 43 33 76.7% 0 3 0 7 10 0 10 23.3% Brooklyn X27 72 69 39 54.2% 14 0 0 16 30 3 33 45.8% Brooklyn X28 72 72 52 72.2% 5 2 0 13 20 0 20 27.8%
Brooklyn 187 184 124 66.3% 19 5 0 36 60 3 63 33.7% Queens QM2 61 59 40 65.6% 1 10 2 6 19 2 21 34.4% Queens QM5 71 68 51 71.8% 1 8 1 7 17 3 20 28.2% Queens X63 18 17 11 61.1% - - 2 4 6 1 7 38.9% Queens X68 18 18 12 66.7% 0 6 - - 6 0 6 33.3% Queens 168 162 114 67.9% 2 24 5 17 48 6 54 32.1%
Staten Island X1 94 88 58 61.7% 7 3 2 18 30 6 36 38.3% Staten Island X17 73 68 49 67.1% 0 2 7 10 19 5 24 32.9%
Staten Island 167 156 107 64.1% 7 5 9 28 49 11 60 35.9% Total 645 623 443 68.7% 30 34 14 102 180 22 202 31.3%
*Buses depart in the morning from their home borough of origin and generally return from Manhattan to their home borough in the evening. Some buses may make several roundtrips from their borough of origin each day. **We calculated the on-time performance using the MTA’s own standards (1 minute before and 5 minutes past the scheduled times). ***Scheduled buses that were “Early,” “Late,” and “No-shows” were all counted as “Not On Time.” Note: A dash (-) in the Morning and Afternoon/Early or Late Departure columns means that there were no observations performed during those times for the noted bus routes.
Office of New York City Comptroller Scott M. Stringer MH13-118A 16

APPENDIX II
Early and Late Departure Ranges (in Minutes) for Scheduled Express Buses (Not Including No-Shows)*
Rush Hours
Bus Stop
Num
ber o
f Sc
hedu
led
Buse
s Early and Late Departure Range (in Minutes)** No. of Buses Not On Time
Prior to or Past the MTA’s Scheduled Times Early Late Summary
Early 2-3
Early 4-7
Total Early 6-10 11-15 16-20 21-30 31-38 Total
Late
Total Early and Late
Early Percent
Late Percent
Total % Early or Late
Morning First 173 1 0 1 2 1 0 0 0 3 4 0.6% 1.7% 2.3% Last 190 21 8 29 23 6 2 0 0 31 60 15.3% 16.3% 31.6%
Evening First 135 5 2 7 6 5 3 2 0 16 23 5.2% 11.9% 17.0% Last 147 5 2 7 37 24 13 10 2 86 93 4.8% 58.5% 63.3%
Total 645 32 12 44 68 36 18 12 2 136 180 6.8% 21.1% 27.9% *This table does not include buses that did not arrive during our observations.
**We calculated the on-time performance using the MTA’s own standards (1 minute before and 5 minutes past the scheduled times).
Office of New York City Comptroller Scott M. Stringer MH13-118A 17

APPENDIX III
Analysis of On-Time Performance (from the Customer’s Perspective) for Express Buses Observed
Rush Hours
Bus Stop
Number of Buses
Observed to Determine the
Length of Time
Customers Had to Wait
Number of Buses that
Departed Within the MTA’s On-time Standard*
Instances in which Buses were Late in Departing from Bus Stops* Using the MTA’s Posted Schedules (in Minutes)
Number of Buses that Did Not Depart Within the MTA’s On-time Standard Broken Down by Time Intervals (in
Minutes)
Average Customer Wait
Time for Express Buses Later
Than 5 Minutes
Total Departures Not Within the MTA’s On-time
Standard
Percent of Departures That Were Not Within the MTA’s On-time Standard 6-10
Minutes Late
11-15 Minutes
Late
16-20 Minutes
Late
21-28 Minutes
Late
Morning First 173 163 7 0 1 2 13.20 10 5.8% Last 186 155 24 4 3 0 9.35 31 16.7%
Evening First 136 120 12 3 1 0 9.00 16 11.8% Last 149 105 26 10 4 4 10.95 44 29.5%
Total 644 543 69 17 9 6 10.38 101 15.7% Percent - 84.3% 10.7% 2.6% 1.4% 0.9% 15.7%
Departed late 11-28 minutes 32 (5.0%) *We used the MTA’s own on-time standard of no more than 1 minute before or 5 minutes past the departure times listed at the bus stops.
Office of New York City Comptroller Scott M. Stringer MH13-118A 18
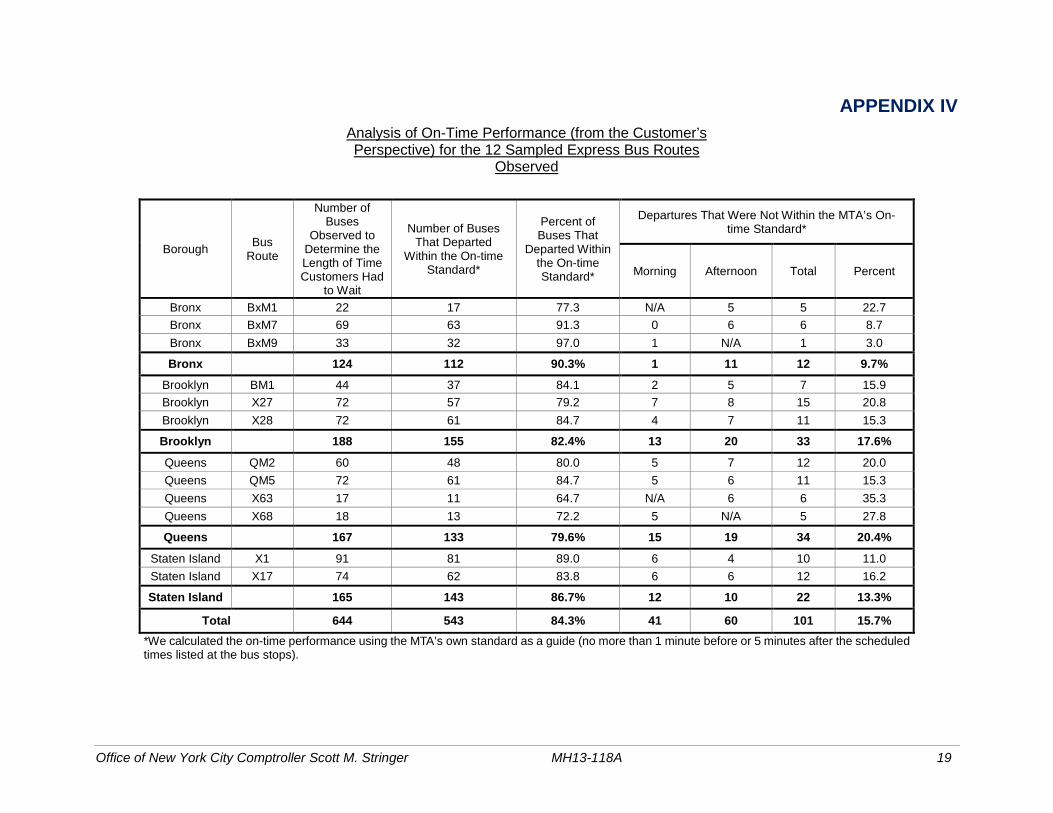
APPENDIX IV Analysis of On-Time Performance (from the Customer’s Perspective) for the 12 Sampled Express Bus Routes
Observed
Borough Bus Route
Number of Buses
Observed to Determine the Length of Time Customers Had
to Wait
Number of Buses That Departed
Within the On-time Standard*
Percent of Buses That
Departed Within the On-time Standard*
Departures That Were Not Within the MTA’s On-time Standard*
Morning Afternoon Total Percent
Bronx BxM1 22 17 77.3 N/A 5 5 22.7 Bronx BxM7 69 63 91.3 0 6 6 8.7 Bronx BxM9 33 32 97.0 1 N/A 1 3.0
Bronx 124 112 90.3% 1 11 12 9.7% Brooklyn BM1 44 37 84.1 2 5 7 15.9 Brooklyn X27 72 57 79.2 7 8 15 20.8 Brooklyn X28 72 61 84.7 4 7 11 15.3
Brooklyn 188 155 82.4% 13 20 33 17.6% Queens QM2 60 48 80.0 5 7 12 20.0 Queens QM5 72 61 84.7 5 6 11 15.3 Queens X63 17 11 64.7 N/A 6 6 35.3 Queens X68 18 13 72.2 5 N/A 5 27.8
Queens 167 133 79.6% 15 19 34 20.4% Staten Island X1 91 81 89.0 6 4 10 11.0 Staten Island X17 74 62 83.8 6 6 12 16.2
Staten Island 165 143 86.7% 12 10 22 13.3%
Total 644 543 84.3% 41 60 101 15.7% *We calculated the on-time performance using the MTA’s own standard as a guide (no more than 1 minute before or 5 minutes after the scheduled times listed at the bus stops).
Office of New York City Comptroller Scott M. Stringer MH13-118A 19

ADDENDUM Page 1 of 3

ADDENDUM Page 2 of 3

ADDENDUM Page 3 of 3