Embed Size (px)
Citation preview

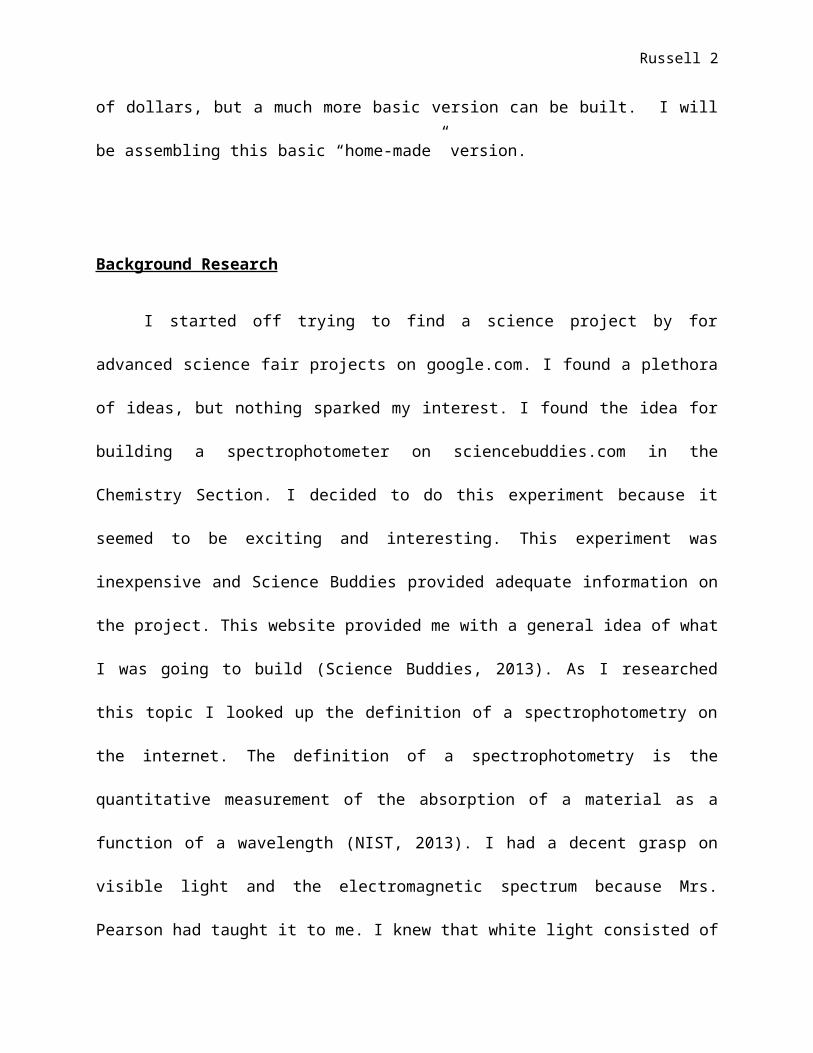
Homemade Spectrophotometer
Aaron Russell
10 February 2014
Introduction
Spectrophotometry is defined by nist.gov as “the quantitative measurement of the
absorption of a material as a function of a wavelength”. Spectrometric analysis makes use of
selected wavelengths of electromagnetic radiation for the qualitative or quantitative
determination of a sample analysis. There are quite a few uses of spectrophotometry. This
science actually allows scientists to identify a material’s identity or concentration without
having to touch it. Spectrophotometry can be used to identify gases and many other materials
as long as light is able to pass through the material. Spectrophotometry is used in the medical
field to determine the seriousness of heart attacks, and it can also be used to identify different
types of pigments in plants. A spectrometer can cost hundreds to thousands of dollars, but a
much more basic version can be built. I will be assembling this basic “home-made” version.
Background Research
I started off trying to find a science project by for advanced science fair projects on
google.com. I found a plethora of ideas, but nothing sparked my interest. I found the idea for
building a spectrophotometer on sciencebuddies.com in the Chemistry Section. I decided to do
Russell 2
this experiment because it seemed to be exciting and interesting. This experiment was
inexpensive and Science Buddies provided adequate information on the project. This website
provided me with a general idea of what I was going to build (Science Buddies, 2013). As I
researched this topic I looked up the definition of a spectrophotometry on the internet. The
definition of a spectrophotometry is the quantitative measurement of the absorption of a
material as a function of a wavelength (NIST, 2013). I had a decent grasp on visible light and the
electromagnetic spectrum because Mrs. Pearson had taught it to me. I knew that white light
consisted of all the colors of the rainbow. I found out that a spectrophotometer analyzed this
spectrum by measuring the intensity of light at different wavelengths. A wavelength is the
distance that a wave will travel in one cycle. (Science Buddies, 2013)
Variables
I only had two types of variables: independent and dependent. My independent variables were
the color of the solutions and the amount of dye in the solution. My dependent variables were
the spectra.
Hypothesis
My hypothesis is very simple. My hypothesis is: “A basic, inexpensive spectrometer can be
built.”
Materials
In order to start assembling the spectrophotometer, a couple of special items needed to
be purchased. I ordered a linear 500 mm/lines diffraction gratings slide on Amazon.com, a 5

Russell 3
mm white LED light (part #RL5-W5020) on superbrightleds.com, and 20 plastic cuvettes, 1 cm,
on ebay.com from the seller madlaboratory. All the other items are typical household items.
List of Materials:
Wood (Red Oak, ½” x 3” planks)
iPhone 4 (CMOS Camera)
Canon EOS Rebel T3i (DSLR Camera)
HP Computer (Windows Based)
Cuvettes – 1 cm Pathlength (Plastic)
Food Coloring (Red, Green, Blue)
LED light (diode, part #RL5-W5020)
Battery, CR2032 3V Coin
Darkened Room (For performing the experiments)
Soldering Iron - Weller 25 watt (SP23L) by Cooper Tools
Solder - Alphametals Resin Care (31604)
10 inch Miter saw (Craftsman)
Toggle switch
Fuse Holder (15 amp)

Russell 4
Crimp-on electrical connectors
16 gauge stranded electrical wire
Plastic clamps
Wood Screws
Paint (white and black)
Plywood (for the spectrometer base)
Assembling the Temporary Spectrophotometer
Two versions of the spectrophotometer were assembled. The first version was
temporary and only used for the testing of the purchased materials. The second version was
permanent and used for the final tests.
The temporary version consisted of the diffraction gratings slide, LED light, the CR2032
battery, a cuvette filled with clear distilled water, a book, electrical tape, scotch tape, and a cell
phone camera. The LED light has two prongs attached to it: a long one and a slightly shorter
one. The longer prong was touched to the positive side of the battery, and the shorter prong
touched the negative side. The electrical tape was used to provide a steady stream of light. This
light contraption was elevated with a book. The diffraction gratings slide was then setup around
30 cm away from the light and at an angle. This was to try to limit the amount of exposure
when taking pictures. The cuvette was then filled and images were taken with an iPhone 4.

Russell 5
This temporary version simply served as a baseline to determine the feasibility of the
experiment. After a few photos were taken with adequate results, I decided to proceed to build
a permanent version for final testing based upon on these results that I obtained from this
temporary setup. I learned that I was going to need to find a way to accurately place each of
the components on the base. I further realized that once the components were placed that I
needed to make other changes due to the camera selection. Because of this, I made each
component on a separate movable arrangement. The alignment of the components needed to
be finalized.
Assembling the Final Spectrophotometer
The final version of the spectrophotometer was built as components and then
assembled into the final test instrument. The components built were: a base, source, cuvette
holder, diffraction grating holder, a slit plate. The instrument was built as components to allow
for movement and placement of the individual components in order to achieve a functioning
spectrophotometer. Alignment of the components was critical. Many trials were conducted to
determine the best alignment.
The Base was built using plywood and red oak planks. The base is 23.75 inches deep x
30.5 inches wide x 4 inches tall. The base was painted black.
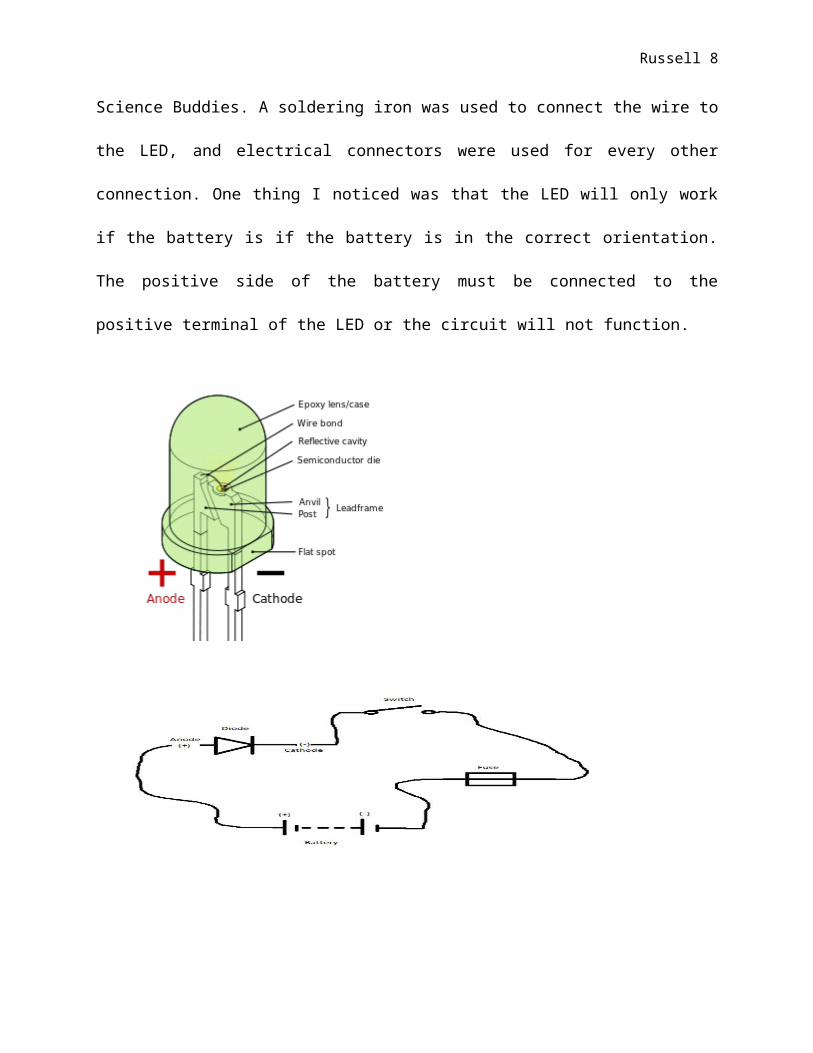
The Source was built using a LED light, a toggle switch, a battery, wire, and connectors.
An electrical schematic is shown below. (Electronics Club, 2013) LED stand for light emitting
diode. LEDs are quickly becoming a popular source of light and are replacing incandescent,
halogen, and compact fluorescent bulbs. (ACDC LED Lights, 2012) A toggle switch was installed

Russell 6
to allow easy turning on and off of the LED. The fuse was installed for safety purposes. The
battery is 3V. It was recommended by Science Buddies. A soldering iron was used to connect
the wire to the LED, and electrical connectors were used for every other connection. One thing I
noticed was that the LED will only work if the battery is if the battery is in the correct
orientation. The positive side of the battery must be connected to the positive terminal of the
LED or the circuit will not function.

Russell 7
The Cuvette Holder was built using red oak planks and a miter saw. The cuvette holder was
made in a manner so that each time a new cuvette was placed it would be in the same
orientation. This is important because the results could be affected by improper placement of
the cuvette. A picture is below.
The Diffraction Grating Holder was built using Red Oak planks and a miter saw. A picture is
below.
The Slit Plate was built using Red Oak planks and a miter saw. It was built in a manner that it
was able to be moved around so the light could be focused. A picture is shown below.
Russell 8
In general, the spectrophotometer begins with a light source (LED). The light is focused
into a beam by the tubing place over the LED bulb. This keeps any stray light from contacting
the camera. The light then passes through the cuvette. After the light exits the cuvette it
passes through the slit plate to further focus the light beam. The light then passes through the
diffraction grating to disperse the white light into its spectrum. This spectrum is then
photographed by the detector to produce an image.
The Spectrophotometer Software Program
The Scheeline-Kelly cell phone spectrophotometer, developed by Alexander Scheeline
and Kathleen Kelly, analyzes JPEG images from CMOS cameras which are very common in
modern cell phones and tablets. The software uses reference and sample spectra, chosen by
the user. The author took into consideration that no two identical frames could be taken and
created an algorithm to linearly interpolate the intensity detected in a sample’s wavelength
applicable to the wavelengths of the intensity detected with the sample
absent but with solvent present. He included this in the transmittance computations. (Cell
Phone Spectrophotometer, 2013)

Russell 9
This software has been used a total of three other times according to the author: “a
group of analysis students at the Faculty of Chemistry, Hanoi University of Science”, “a group of
high school teachers from Illinois”, and “26 high school students attending a summer outreach
program at Clark Atlanta University”. He states that the classroom dynamics were the same in
each of the reported cases. He also states that these cases did not involve controlled testing of
the students. (Cell Phone Spectrometer, 2013)
This software allows for a very inexpensive way to analyze samples. The author stated
that one of the objectives of this software was to provide an inexpensive way to teach students
the basics of spectrophotometry. (Cell Phone Spectrophotometer, 2013) I believe that this
software is a very useful tool. Below is a screenshot from the software showing the sample
scan on the left and the reference scan on the right. The resultant spectra is calculated and
displayed on the screen in a variety of formats chosen by the user.

Russell 10
Optical Density / Beer’s Law / Key Terms
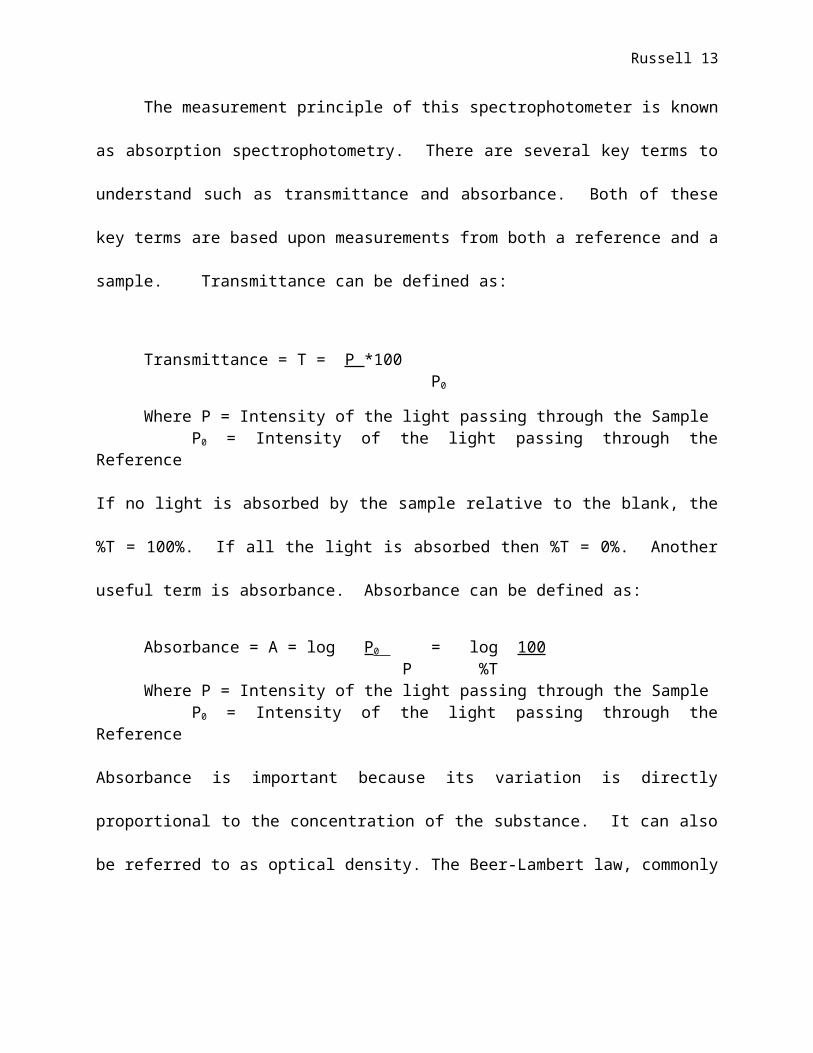
The measurement principle of this spectrophotometer is known as absorption
spectrophotometry. There are several key terms to understand such as transmittance and
absorbance. Both of these key terms are based upon measurements from both a reference and
a sample. Transmittance can be defined as:
Transmittance = T = P *100 P0
Where P = Intensity of the light passing through the SampleP0 = Intensity of the light passing through the Reference
If no light is absorbed by the sample relative to the blank, the %T = 100%. If all the light is
absorbed then %T = 0%. Another useful term is absorbance. Absorbance can be defined as:
Absorbance = A = log P0 = log 100 P %TWhere P = Intensity of the light passing through the Sample
P0 = Intensity of the light passing through the Reference
Absorbance is important because its variation is directly proportional to the concentration of
the substance. It can also be referred to as optical density. The Beer-Lambert law, commonly
known as Beer’s Law, is important in spectrometry. Beer’s Law is listed below:
A = a * b * C
Where a = Absorptivityb = particular wavelength and constantC = Concentration
(Manahan, 1986)
Russell 11
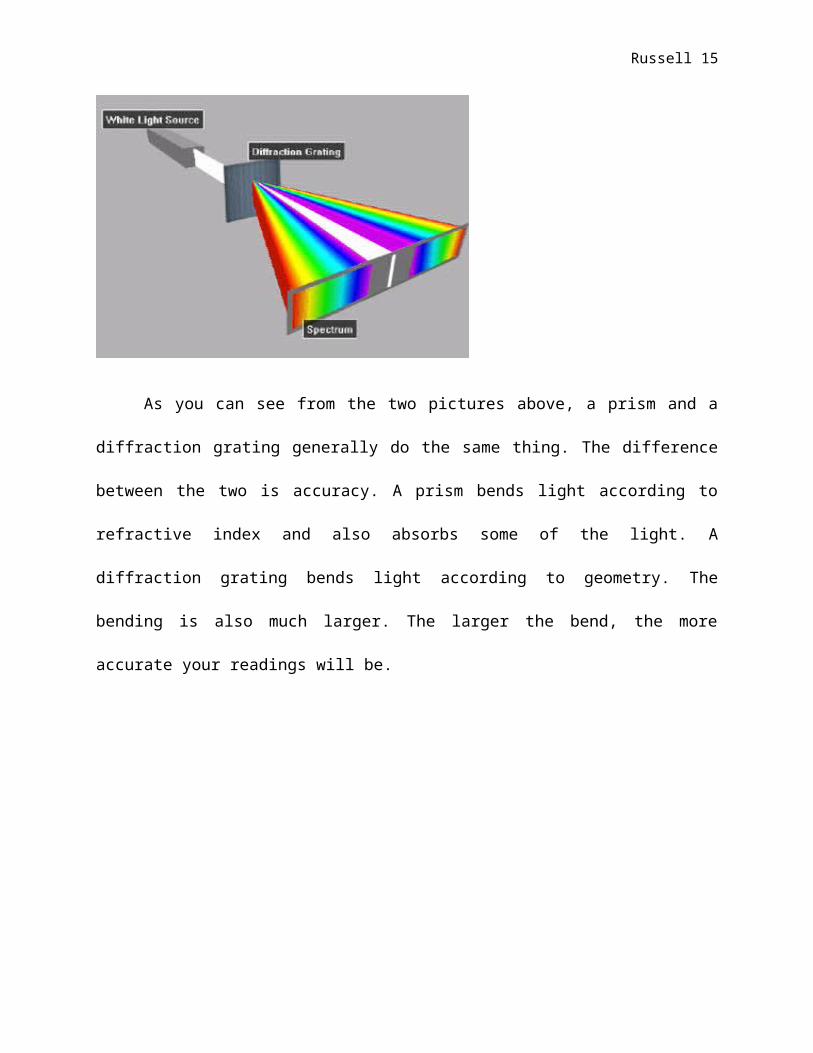
Diffraction Grating
A diffraction grating is a simple monochromator. It turns the incident polychromatic
(white light) into its monochromatic components. The diffraction grating is the most common
device for this purpose. A prism does the same thing; changes white light into its component
colored wavelength. (Manahan, 1986)
As you can see from the two pictures above, a prism and a diffraction grating generally
do the same thing. The difference between the two is accuracy. A prism bends light according

Russell 12
to refractive index and also absorbs some of the light. A diffraction grating bends light
according to geometry. The bending is also much larger. The larger the bend, the more accurate
your readings will be.
(Medway Optics LTD, 2006)
Procedures and Data
Test #1
The purpose of this test was to find out if the spectrometer and spectra analyzing
software would work properly. I started this test by taking four 1cm cuvettes and filling them up
with distilled water. I used distilled water to limit the amount of imperfections in the samples. I
left one sample with just clear, distilled water. This would be my reference. The other three
cuvettes were filled with two drops of different food color. These colors included red, green,
and blue. These would be my samples. I started off by testing my reference. The full spectrum
Russell 13
was shown. I attempted to use the iPhone 4 as a camera, but the quality of it was not sufficient
for accurate testing. I instead used a Canon EOS Rebel T3i. This camera still generates JPEG
images making the images applicable to the software. The Rebel provided a much better image
quality. Testing then resumed. A picture of the reference was then taken. Each sample was
tested the same as the reference. The red sample only showed red on the spectrum. The blue
sample only showed blue on the spectrum. The green sample only showed green on the
spectrum. These results tell me that the spectrometer and diffraction grating worked properly.
These images were placed into the spectra interpretation software. The software was very
difficult to use and did not provide accurate results. The graphs that were computed from the
software were saved. Conclusions were drawn from the results.
Reference
Blue Sample

Russell 14
Green Sample
Red Sample
Red Sample vs Reference
Russell 15
You can conclude from these results that the spectrometer and diffraction grating
worked well, but the spectra interpretation software was not very accurate. You could further
explore the possibilities of the software in a future test, but I do not believe that the program is
even functional. It is difficult to use and does not provide accurate results. This test does not
disprove my hypothesis.
Blue Sample vs Reference
Green Sample vs Reference

Russell 16
Test #2
The purpose of this test was to show how different intensities of a color can change the
intensity of a spectrum. I started off by taking another picture of the reference spectrum. This
was to ensure that this test would maintain the same state throughout. The reference again
showed the complete spectrum. I then took a large container and filled it with distilled water. I
added two drops of red food coloring to the container of distilled water. This diluted the
solution and made a very light red. I then filled my cuvette with this solution. A photo was taken
of the sample’s spectrum. The intensity of the sample’s spectrum was less than the intensity of
the reference’s spectrum. I then added two more drops of red food coloring to the cuvette
directly to make a normal red sample. A photo was also taken of this sample’s spectrum. I could
see a distinctive difference within the intensity of this spectrum compared to the reference’s
spectrum. Next I added even more red food coloring to the solution, which created a dark red
solution. The intensity of the spectrum decreased even further. The spectrum started to show
mainly red and was not very bright. I ended the experiment by adding a few more drops of red
food coloring which made the red extremely dark. The intensity decreased even more. This test
again proved that the spectrometer was quite functional. Pictures of the spectra are shown
below.

Russell 17
You can see from the images that the spectrometer proved to be functional once again.
The darker the color of the sample the less intense the spectrum became. The software was
unnecessary for this experiment. You could provide exact ratios of the amount of food coloring
compared to the amount of water in a future experiment, but this did not seem necessary for a
basic intensity test. This experiment did not disprove my hypothesis.
Reference Very Light Red
Normal Red Dark Red
Very Dark Red Extremely Dark Red

Russell 18
Conclusion
The spectrometer worked great. The reference scan showed the entire spectrum of
colors. The blue only showed blue. The green only showed green. The red showed only red.
The intensity of the spectra changed as the samples became darker. The diffraction grating did
its job effectively. However, the spectra interpretation software proved inaccurate. The graphs
were inaccurate. The software was abstruse and not easy to use. Since the hypothesis stated
that “a basic, inexpensive spectrometer can be built”, the hypothesis was not wrong. This
project was successful.

Russell 19
Works Cited
1. "Circuit Symbols." Electronics Club. N.p., n.d. 15 Dec. 2013.
<http://electronicsclub.info/circuitsymbols.htm>.
2. Manahan, Stanley E. Quantitative Chemical Analysis. Monterey, CA: Brooks/Cole Pub., 1986.
Print.
3. Scheeline, Alexander, and Kathleen Kelley. "Cell Phone Spectrophotometer." Cell Phone
Spectrometer. N.p., n.d. 15 Dec. 2013.
<http://scheeline.scs.illinois.edu/~asweb/CPS/>.
4. "See the Light by Making a Cell Phone Spectrophotometer." See the Light by Making a Cell
Phone Spectrophotometer. N.p., n.d. 15 Dec. 2013.
<http://www.sciencebuddies.org/science-fair-
projects/project_ideas/Chem_p100.shtml>.
5. "Spectrophotometry." NIST. N.p., 13 Nov. 2009. 15 Dec. 2013.
<http://www.nist.gov/pml/div685/grp03/spectrophotometry.cfm>.
6. Vodopich, Darrell, and Randy Moore. "The Importance of Spectrophotometry." Online
Learning Center. McGraw Hill, n.d. Web. 15 Dec. 2013. <http://highered.mcgraw-
hill.com/sites/0073031216/student_view0/exercise7/spectrophotometry_importance.
html>.
Russell 20