Embed Size (px)
Citation preview

SCHWARZBECK MESS - ELEKTRONIK An der Klinge 29 D-69250 Schönau Tel.: (+49)6228/1001 Fax.: (+49)6228/1003 E-mail: [email protected]
DESCRIPTION, DATA SHEET
20 MHz - 1050 MHz
Interference Measuring Receiver
FCVU 1534

Description, Data Sheet FCVU 1534 Page -2
Frequency range 20 MHz-1050 MHz Field-strength-measurement with antennas.
Measurement of interference power with clamps.
Measurement of conducted voltage with automotive L.I.S.N.s
Integrated Power attenuator for receiver protection.
Optional external Preamplifier for best sensitivity.
Optional high level tracking generator is ideal to measure filter attenuation and to drive power amplifiers.
Manual operation, semi-automatic operation with xy-recorder and PC-control via IEEE-488 using the Schwarzbeck software Messbase.
Fast 100% CISPR-Quasi-peak-measurement with VARISCAN.
For many decades, most of the interference measuring receivers were used in laboratories. They were operated manually using their front panel. This type of operation including front panel control will still be there in the future, but PC-control gives value added measurement because of increased speed and better documentation. The unique r. f. and analogue circuits of the FCVU 1534 give precise measurement with or without PC-control. The receiver comes complete for EMI-measurement, but can be equipped with useful options. Characteristics of the FCVU 1534 Unique R.F.-circuitry
Attenuator with coaxial relays uses resistive -attenuators with 1-dB- steps. Total resistive attenuation is 89 dB.
Switchable 10 dB High Power Attenu-ator for receiver protection.
7 selective preamplifiers with 28 tuned circuits for best large signal handling capability combined with low noise.
Build in 100 Hz Pulse standard similar to IGU 2912 for calibration. Error is compensated by a EPROM list.
Low noise, low distortion GaAs-MMIC preamplifier (Option) can be used directly at the antenna eliminating cable loss. The standard coaxial cable is used for remote power supply and remote control.
Integrated (optional) tracking generator with 120 dB V (1 V) / 50 for mea-surement of filter attenuation, site attenuation with antennas and drive of power amplifiers acc. to IEC 801. (External optional modulator)
High precision measurement
Meter with 2 large scales. Linear voltage scale with 1-dB-scaling
for the amplitude range -10 dB / 0 dB centre of meter / +6 dB
according to EN 55014 C.2.1. plus Logarithmic overview -25 dB / 0 dB centre of meter / +25 dB
12 Bit A/D-converter Easy to use
Functional areas of controls and displays.
Small size, moderate weight, rugged Aluminium cabinet
Low heat dissipation
Due to effective shielding no problems even when used in the shielding room.

Description, Data Sheet FCVU 1534 Page -3
Modes of operation
The FCVU 1534 covers the following modes:
Manual operation with manual frequen-cy tuning and reading the measurement from the meter.
Semi-automatic operation using an xy-recorder for the reading.
PC-controlled operation via IEEE-Bus with Schwarzbeck Software Messbase.
Manual operation
As no other this mode of operation gives direct access to the receiver without any collision with PC or software. Especially in the measuring field outside of a shielding room, broadcast signals can be identified using the demodulator/loudspeaker. Both AM and FM signals can be monitored. Reading can be seen clearly on the meter which gives perfect reading from narrow band signals down to single click.
The meter uses the classic 0 dB centre of meter scaling to measure safe without interpretation.
The linear scale gives true linear voltage reading avoiding problems with slow pulses.
For any interference signal from continuous distortion to single click 0 dB centre of instrument is free of overload problems. For overview a 50 dB logarithmic scaling can be used.
Semi-automatic operation
Spectrum can be recorded when the receiver is used in the scan mode together with an xy-recorder. The time consumption is reduced substantially, because VARISCAN adjusts scan speed to the signals ahead.
So the spectrum can be scanned directly in CISPR-Quasi-peak avoiding Peak-measurement. The xy-recorder can be used in manual tuning mode as well. The xy-recorder then follows the manual frequency tuning on the encoder. Doing so, it is very easy to stop on critical frequencies to find the maximum signal strength, which will be kept by the xy-recorder.
PC-controlled mode
Using a standard PC, a IEEE-card and the Schwarzbeck software Messbase together with the FCVU 1534 gives PC-controlled measurement. Modern PCs offer high speed and high capacity hard disks which improves considerably storage and documentation of measurement. Primary goal of development was safe measurement of the complete range of interference signals keeping the high standard of manual measurement. This means that there must be no trade off considering even slow pulses. The completely new approach using the fourth demodulator included in VARISCAN gives fast Quasi-peak-measurement without using the Peak detector, which shows a very different behaviour. VARISCAN analyses the signal ahead before it is really measured. Practical spectrum often shows amplitude jitter which could be subject to misinterpretations using the Peak detector to decide which signal has to be re-measured in CISPR or not. The second step towards safe measurement is controlling the receiver by the limits given in the standards. Basically AUTORANGE can catch any signal, but there are restrictions when slow pulses occur. The way out of the problem is to guide the receiver along the limits in such a way, that it is centred in the middle between noise and overload. Even antenna factors are included in this strategy.

Description, Data Sheet FCVU 1534 Page -4
SCHWARZBECK MESS - ELEKTRONIK An der Klinge 29 D-69250 Schönau Tel.: (+49)6228/1001 Fax.: (+49)6228/1003 E-mail: [email protected]
Messbase-Software for Emission-tests under MS-WINDOWS 95/98/NT/2000/XP
- Easy to learn and to use - Fast & Reliable with Variscan and Autorange - High security against overload using mask-guidance - User editable limits and antenna factors guarantee high flexibility - Interactive final measurements with automatic test report generation - Automatic creation and scan of frequency lists - Free scalable prints - User definable creation of test reports - Convenient graphic features and data transfer to other Windows applications - Marker with integrated final measurement capability - Subranges reduce measuring time and provide data reduction - Remote control for LISN or coaxial switching unit included - Additional IEEE 488-devices can be integrated on request - Attenuation measurements > 100 dB for site performance checks or insertion loss of filters - Comparison of two measured diagrams and up to 3 masks simultaneously - Accelerator keys for frequently used functions speed up operation - Click measurement with 10 samples per second - Context sensitive Online Help - Macros performing up to 32 time-consuming measurements - Find the Maximum Envelope out of a set of measurements
Hardware - Requirements: IBM-compatible PC with 80386 and math. Coprocessor 80387 or better, 4 MByte RAM, VGA-Graphics, min. 10 MByte free space on hard disk, 3.5" floppy disk drive, INES IEEE 488 16- bit interface card. PCMCIA-card also available for portable Computers.
The screen shots shown above were taken for Band A/B with the receiver FCKL 1528

Description, Data Sheet FCVU 1534 Page -5
FCVU 1534 Technical data
Detectors Peak PK Average AV CISPR Quasi-Peak QP CISPR-Average CAV CISPR-RMS CRMS Frequency range 20 MHz - 1050 MHz Frequency tuning with encoder wheel 10 kHz, 100 kHz, 1 MHz Display 6 digits LED Software Start- and Stop frequency random, random steps > 10 kHz, automatic scanning with graphic. Frequency error 1*10-5 +-10 kHz R.F-Input N-connector, 50 SWR <1,2 for attenuator >10 dB <2 for attenuator 0 dB Oscillator voltage on R.F. Input <30 dBpW for attenuator 0 dB, <20 dBpW for 10 dB power attenuator. R.F-amplifier frequency ranges
7 amplifiers with tracking band-filters at in- and output 1 20 MHz - 50 MHz 2 50 MHz - 100 MHz 3 100 MHz - 200 MHz 4 200 MHz - 400 MHz 5 400 MHz - 600 MHz 6 600 MHz - 800 MHz 7 800 MHz - 1050 MHz Calibration
Pulse standard for CISPR- Standard pulses 100 Hz Voltage nom. 30 dB V (100 Hz) Maximum Input level (w.o. ext. preamplifier.) R.F-attenuation 0 dB (D. C.- isolation) D.C. voltage 15 V Sine wave R.F. voltage 130 dB V (3,16 V) R.F.-attenuation 10 dB (D. C.-isolation) Spectrum pulse density 96 dB V/MHz (<0,5 ns) R.F.-attenuation 10 dB power attenuator D.C.-voltage 15 V Sine wave R.F.-voltage 137 dB V (1 W) Spurious, Large Signal Handling Capability Image frequency atten. >65 dB/typ. 90 dB I.F.-isolation >70 dB/typ. 90 dB Third order Intercept d3 standard setup >17 dBm
R.F.-feed through (1 dB error, w.o. receiver frequ.) 10 V/m
I.F.-frequencies 1. I.F. ranges 1-4 300 MHz 1. I.F. ranges 5-7 500 MHz 2. I.F. 82,72 MHz 3. I.F. 10,72 MHz 4. I.F. 2,03 MHz I.F.-Standard filter bandwidths acc. to CISPR 120 kHz (-6 dB) Noise indication Average (120 kHz) -5 dB V (typ. -7 dB V) Peak (120 kHz) typ. +1 dB V CISPR Quasipeak typ. -4 dB V Noise indication with ext. preamplifier Average (120 kHz) typ -11 dB V Peak (120 kHz) typ. -5 dB V CISPR Quasipeak typ. -10 dB V Pulse compression 1 dB at 30 dB V, 100 Hz CISPR Standard pulse Range for voltage measurement Lower limit for <1 dB noise error Average (120 kHz) -1 dB V Peak (120 kHz) +15 dB V CISPR Quasipeak Standard pulse 100 Hz <4 dB V with ext. preamplifier. Average (120 kHz) -7 dB V Peak (120 kHz) +8 dB V CISPR Quasipeak Standard pulse 100 Hz < -2 dB V Upper limit 137 dB V (3,16 V) with ext. preamplifier. 116 dB V sine wave. Spurious equiv. < - 3 dB V typ.: None Level indication Digital 3 digit LED display for reference level Analogue Meter with 0 dB centre of instrument. Voltage linear scale with dB scaling w.o. logarithmic converter. Logarithmic scale with -25 dB / 0 dB / +25 dB (low noise).

Description, Data Sheet FCVU 1534 Page -6
Recording with XY-recorder Y-axis within dynamic range of demodulator linear or logarithmic acc. to meter scale. X-axis via EPROM list and D/A-converter derived from receiver frequency Prefabricated measure- ment diagrams ready to use. Detectors Average, Peak, Quasipeak (CISPR)
Error analogue, digital < 1 dB (0 dB centre of meter, limit) Demodulation AM, FM
Inputs, outputs Analogue
Recorder outputs Y-axis, amplitude 0 dB centre of meter corresponds to 0,5 V linear logarithmic, Ri < 10 k X-axis, frequency, 30 MHz at 0 V, 1000 MHz at 1,000 V Pen Down Ri < 2 k Measuring outputs Active demodulator (Envelope of I.F.) 0 dB centre of meter corresponds to. 15 mV, Ri > 10 k Pulse weighted output see Y-axis xy-recorder I.F.-output optional Supply voltage for auxiliaries +12 V / 100 mA -12 V / 50 mA
Control and supply of optional external preamplifier build in 5 V /100 mA on centre of R.F.-input N-connector (fuse on rear panel) Digital IEEE-Bus connector 24 socket
Options
Tracking generator (optional, build in) Frequency range 30 MHz-1000 MHz Frequency steps Same as receiver Output voltage 120 dB V (1 V) / 50 Control Rotary switch on front, panel, software
Preamplifier (optional, separately) Frequency range 20 MHz-1050 MHz nom. Amplification 10 dB typ. Pulse compression 1 dB at 30 dB V CISPR- Standard pulse 100 Hz Connectors N-socket, N-pin Control Switching amplifier ON/OFF via coaxial cable from front panel switch or software Power supply Remote supply via coaxial cable. Dimension (w.o. connectors) 50 mm x 30 mm x 30 mm
Option 19" build in capability
General Nominal temperature range 0°C to 50°C Storage temperature range -20°C to +70°C Cooling Temperature controlled, low noise cooling fan EMI acc. to VDE 0876, 1a Shock, Vibration acc. to DIN IEC 68-2-27/29 Power supply 110,130,220,240 V +-10% 50 , 60 Hz 80 W 12V DC optional Cabinet B x H x T 447 mm x 180 mm x 460 mm approx. 17 kg Standard accessories Mains cable, Operation manual

Description, Data Sheet FCVU 1534 Page -7
Recommended accessories A) Measuring conducted voltage with manual or software control. with automotive L.I.S.N. up to 300 MHz NNBM 8126 b 50 / 4 x 25 A up to 300 MHz UNN 8122
B) Interference power Absorbing clamp 30 MHz-1000 MHz MDS 21 Absorbing clamp to 2 GHz MDS 22 C) Radiated field strength with antennas Biconic elements 30-300 MHz BBA 9106 Holder for above elements VHA 9103 Holder with balun 50/200 VHBA 9123 Holder with balun 50/200 extr. symm. VHBB 9124 Biconic antenna 200-100 MHz UBA 9116 Log. Per. Antennas VHF-UHF Log.-Per. Ant. 75 (50)-1500 MHz VULP 9118 E VHF-UHF Log.-Per. Ant. 95 (80)-1500 MHz VULP 9118 D VHF-UHF Log.-Per. Ant. 140-1100 MHz VULP 9118 C VHF-UHF Log.-Per. Ant. 170-1100 MHz VULP 9118 B VHF-UHF Log.-Per. Ant. 200-1100 MHz VULP 9118 A Log.-Per. Ant. 300-1000 MHz UHALP 9108 A Logbicon Super- Broad band-Combinations VULB 9160 VULB 9165
/2 Dipole antennas with telescopes
VHF-Dipole with Telescopes VHA 9103
UHF-Dipole with Telescopes UHA 9105
Precession-Dipoles
VHF Precision-Dipole 30 MHz-300 MHz VHAP
UHF Precision-Dipole 300 MHz-1000 MHz UHAP
Cable
Calibrated coaxial cable Length 10 m AK 9513
Mast
Complete mast, can be disassembled for, easy transportation, 4 m high AM 9104
Small antenna mast AM 9144
D) Others Transformers, Transducers, Modulators Symmetric/ Unsymmetric transformer 105 SYM 9223 Current converter 10 kHz-200 MHz SW 9602 Modulator UVM 7002 30 MHz-1 GHz for modulated R.F. acc. to IEC 801 Near field probes FS-SET 7100, magnetic, elektric, separator, power supply, Box.
FCKL 1528 is the corresponding EMI receiver for the frequency range 9 kHz-30 MHz It is especially designed for EMI-requirements in this frequency range. A build in power attenuator protects the receiver especially in combination with high power L.I.S.N.s.. The optional tracking generator delivers 1 V/50 . It can be used for filter measurement with extremely high dynamic range or to drive power amplifiers. The receivers are similar in manual and PC controlled operation. A multitude of L.I.S.N.s, probes, field strength adapters and other accessories makes this receiver a versatile tool for EMI- measurement.
This is only a part of our EMI-program. Please ask for more information. Equipment may be subject to modification without any notice. Specifications without tolerance should be considered as order of magnitude.

SCHWARZBECK MESS - ELEKTRONIK An der Klinge 29 D-69250 Schönau Tel.: (+49)6228/1001 Fax.: (+49)6228/1003 E-mail: [email protected]
Manual Operating Instructions
INTERFERENCE MEASURING
RECEIVER 20 MHz - 1050 MHz
FCVU 1534
Interference measuring receiver for front panel operation with or without xy - recorder
and for
PC-controlled operation via IEEE-bus with the SCHWARZBECK Messbase
Software.

Manual FCVU 1534 Page 1
FCVU 1534 Manual, Operation Instructions
Table of contents
Sections Title Page
1 Introduction, Description 1
2 Safety-Information, Warning, Mains Voltage Selector/Fuse 2
3 Controls (Front panel) 3,4 4 Displays and controls, description 5 4.1 Reading of interference voltage 5 4.2 Attenuator area 5 4.2.1 Attenuator display 6 4.2.2 10 dB-steps 6 4.2.3 1 dB-steps 6 4.3 Calibration (key) 6 4.4 Measurement / lin/log Y / Low noise / Low distortion 6 4.5 Frequency-area 7 4.5.1 Frequency display 7 4.5.2 Frequency rotary encoder 7 4.5.3 Frequency steps 7 4.5.4 Manual / automatic tuning 8 4.6 AF / Audio area 8 4.7 Detector area 8 4.7.1 Quasi-Peak Detector QP 8 4.7.2 Peak Detector PK 8 4.7.3 Average Detector AV 9 4.7.4 CISPR-Average CAV 9 4.7.4 CISPR-RMS CRMS 9 5 First steps 10 Appendix 6 Front panel operation, automatic scanning 11
7 Automatic scanning, recording with xy-recorder 12
8 Rear side (description, comments, warnings) 13
9 How to connect and adjust the xy-recorder 14
10 General information for practical measurement with receivers above 30 MHz 15-17
11 The external preamplifier 18
12 Tracking generator 19, 20
13 Meter (Indication Instrument) and meter reading 21-25
14 Basic Function 26, 27
15 Prefabricated diagrams for the xy-recorder 28, 29

Manual FCVU 1534 Page 1
1. Introduction, Description
The interference measuring receiver FCVU 1534 is a fundamental tool to measure in-terference voltage, interference field-strength, interference current, antenna voltages and so on with detectors according to quasi-peak, peak and average. In contrast to spectrum analysers or communication receivers with added " interference measurement" the FCVU 1534 was especially designed for the requirements of interference measurement.
It combines the advantages of classic analogue front panel operated receivers such as
Clarity and comprehensibility of the system Handiness Reliability Reading by meter or xy-recording
with the advantages of computer control by efficient and cheap PCs such as
Menu guided software High dynamic range using autorange Introduction of masks Introduction of antennas Value added graphics by lin/log-conversion and zoom Easy documentation.
In both operation modes the special requirements of interference measuring are covered. Measuring pulses as slow as single click is possible according to the standards. In addition Variscan permits the safe and time saving recording of any spectrum 100 % in the "slow" quasi-peak method by adjusting the scan speed to signals recognised in advance by i. f. analysis. The result is continuous quasi-peak recording without using the peak detector to decide.
A second thought was made to protect the receiver from dangerous overload when used with a L.I.S.N.. Some powerful devices under test are able to deliver high power to the receiver. Potential damage is avoided or restricted to relatively cheap components. For this reason a 10-watt-power attenuator with 10 dB attenuation can be switched into the signal path directly behind the r. f. connector. A remote controlled r. f. preamplifier can be connected directly to the antenna to improve sensitivity. The supply voltage comes via a standard coaxial cable from the FCVU 1534. No additional wiring is needed. Switching the amplifier on/off is made by front panel or software; potential overload can be detected easily.

Manual FCVU 1534 Page 2
2. SAFETY-INFORMATION, Mains Voltage Selector/Fuse
The receiver is operated with mains voltages from 110 V (100 V) to 240 V. Even if the receiver is open, no dangerous voltages can be touched because of the fact that the power supply is a separate box and only low voltages are used outside. Before opening the power supply disconnect mains! The power supply is a separate unit together with the rear side cooler. It is connected to the mains via a 3 wire cable with one wire as safety ground. The standard cable uses a yellow/green colour for safety ground.
This safety ground wire connects the receiver's metal cabinet with the safety ground of the mains. This means that German VDE standard "Schutzklasse 1" is fulfilled. In the power supply the safety ground wire is connected to the receiver's ground via a ferrite choke. This was made to avoid r. f. coupling because of multi grounding. The wire used for the choke has the necessary gauge for the current needed for the fuses to blow. The transformer was designed according to the rules of the German standard "Schutzklasse 2" for isolated appliances. Primary and secondary windings are located on separate parts of the coil former and therefore have a very good isolation and a very small cross capacitance. Both mains wires are protected by fuses, which can be changed only by using a tool. Mains connector, fuse holder and voltage switch are one unit. The wire from here go to the transformer via the on/off switch. The wires are double isolated and secured by an epoxy holder. The mains switch is also located in the power supply unit and driven by an isolated shaft coming from the front panel. In the receiver therefor there are no high voltages. The primary part of the power supply is tested for 4000 volts ac eff. 50/60 Hz. To comply with the regulations of most countries, the receiver was designed for the use with a safety ground connector. If for some reason a safety ground connection is not wanted, we recommend total isolation by an isolation transformer (100 VA).
If the mains plug of the standard cable has to be changed because of some different foreign standard, it is very important to connect the yellow/green safety ground to the safety ground of the mains. This connection has to be checked carefully! In the final system there is usually a second grounding via the L.I.S.N., which itself is grounded via the metal wall of the shielding room. Problems because of this second grounding will not occur because of the ground choke, which is introduced in the safety ground wire of the receiver. Measurement with L.I.S.N. is not so common in this frequency range, but please consider the following safety advice: Extreme care is necessary when connecting a L.I.S.N.: According to CISPR-(16)- and VDE(0876) they use high grounding capazitances. Using a NSLK (50 // 50 H + 5 ) this ground current can reach up to 0,6 A. Such a L.I.S.N. must therefor be grounded before connecting to mains. Grounding is possible either by connecting the ground clamps of the L.I.S.N. to the metal wall of the shielding room or by connecting the rear safety ground clamp with the mains ground. The NSLK-types use a fixed mains connector which makes a safety ground connection when plugging in. Double safety is given by the connection to the metal wall of the shielding room already made before. FI-switches which sense the current on the safety wire are not useful because of the ground current of the L.I.S.N. This would result in an instantaneous disconnection. An isolation transformer can be a solution if such problems occur. Only qualified personnel is authorised to connect a L.I.S.N.! Mains Voltage Selector/Fuse Holder
Disconnect mains cable before working on voltage selector/fuse holder!
The receiver uses a linear regulator power supply with a conventional transformer at the input to avoid any interference problem common with switching regulators. The voltage selector combined with the fuse holder at the rear panel (Page 13) has to be set to the local mains voltage. Different mains voltage leads to different supply current, so there are two different fuse-currents to choose. Remove the holder box with the yellow mains voltage field by pushing the lever. Insert the correct fuses. Insert the holder box in the correct orientation for the mains voltage.

Man
ual F
CVU
153
4 Pa
ge 3
3. F
CVU
153
4 C
ontr
ols
(
Fron
t pan
el)
The
front
pan
el is
div
ided
into
8 a
reas
, whi
ch u
nite
impo
rtant
con
trols
and
dis
play
s.
They
are
as
follo
ws:
(1
) Met
er
(4) M
eter
Rea
ding
(7) D
etec
tor
(2) A
ttenu
ator
(5) R
ecei
ving
Fre
quen
cy
(8) R
. f.-I
nput
(3
) Cal
ibra
tion
(6
) A. f
.-Aud
io
(9
) Mai
ns O
N

Man
ual F
CVU
153
4 Pa
ge 4
(1)
MET
ER-a
rea
(6)
AF-A
UD
IO-a
rea
R
eadi
ng o
f the
inte
rfere
nce
volta
ge (d
BV)
.
Volu
me
cont
rol b
y (6
.1).
U
pper
sca
le: L
og. r
ange
of m
ore
than
50
dB
R
otar
y sw
itch
(6.2
) sel
ects
aud
io d
emod
ulat
ion.
for a
n ov
ervi
ew (l
inea
r dB-
scal
ing)
.
Am
dem
odul
atio
n is
nor
m.
Lo
wer
sca
le: l
inea
r vol
tage
sca
ling,
FM
is u
sed
to id
entif
y FM
bro
adca
st tr
ansm
itter
s.
dB
-sca
le n
on li
near
.
(2)
ATTE
NU
ATO
R-a
rea
(7
) D
ETEC
TOR
-are
a
7-se
gmen
t-dis
play
3 d
igits
(2.1
) for
atte
nuat
ion
Left:
CIS
PR Q
uasi
-Pea
k Q
P
in d
BV
unde
r con
side
ratio
n of
r. f.
inpu
t
N
ext c
w:
Peak
PK
switc
h an
d i.
f. at
tenu
atio
n. R
otar
y En
code
r (2.
3)
N
ext c
w:
Aver
age
AV
chan
ges
atte
nuat
ion
in 1
dB
or 1
0 dB
ste
ps
N
ext c
w:
CIS
PR-A
vera
ge
CAV
as s
elec
ted
with
rota
ry s
witc
h (2
.2) .
R
ight
:
CIS
PR-R
MS
C
RM
S (3
) C
ALIB
RAT
ION
-are
a
(8)
R. F
.-IN
PUT
area
Push
the
key
for s
emi a
utom
atic
cal
ibra
tion
of
N
-r. f.
- con
nect
or (8
.1) (
50 o
hms
unsy
mm
etric
inpu
t)
the
ampl
ifica
tion.
Pus
h co
ntin
uous
ly to
see
from
ant
enna
, cla
mp
and
othe
r cou
plin
g de
vice
s.
en
d of
cal
ibra
tion
on th
e m
eter
.
The
inpu
t sw
itch
(8.2
) mat
ches
the
sour
ce to
the
inpu
t. (4
) M
ETER
REA
DIN
G-a
rea
Left:
Pr
otec
ted
inpu
t
Rot
ary
switc
h co
mbi
nes
both
Lin
/Log
-Y, L
in/L
og-X
An
inte
rnal
10d
B-po
wer
atte
nuat
or p
rote
cts
the
Lo
w N
oise
/ Lo
w D
isto
rtion
. Lef
t par
t for
Lin
X/Y
,
re
ceiv
er fr
om d
ange
rous
ove
rload
.
right
par
t for
Log
x/y
read
ing.
Cen
tre D
irect
inpu
t for
hig
hest
sen
sitiv
ity.
Fo
r con
tinuo
s si
gnal
s Lo
g, L
ow N
oise
pos
sibl
e.
Atte
ntio
n:
U
se L
in L
ow D
isto
rtion
for s
low
pul
ses.
Rec
eive
r may
be
dam
aged
by
over
load
!
Do
not c
onne
ct L
.I.S.
N. o
r pro
be in
this
pos
ition
! (5
) R
ECEI
VIN
G F
REQ
UEN
CY-
area
Rig
ht:
Posi
tion
for o
ptio
nal e
xter
nal r
. f. p
ream
plifi
er
Th
e di
spla
y (5
.1) s
how
s re
ceiv
ing
frequ
ency
with
6-d
igits
.
In th
is p
ositi
on,+
5 V
are
conn
ecte
d to
the
inne
r con
duct
or
Th
e m
ost i
mpo
rtant
dig
it is
1 G
Hz.
.
of th
e co
axia
l cab
le. A
fuse
on
the
rear
pan
el is
pro
vide
d
is 1
049.
9 M
Hz.
Whe
n th
ese
„bor
ders
“ are
cro
ssed
, the
as p
rote
ctio
n.
re
ceiv
er is
pre
sette
d to
the
appr
opria
te li
mits
.
The
dBV-
read
ing
(2.1
) inc
lude
s th
e fa
ctor
s fo
r the
pro
tect
ed in
put,
pr
eam
plifi
er a
nd if
atte
nuat
ion
(3).
Th
e fre
quen
cy is
tune
d by
the
rota
ry e
ncod
er (5
.2).
The
rota
ry s
witc
h (5
.3) c
hoos
es th
e fre
quen
cy s
teps
(9)
Mai
ns s
witc
h O
N
an
d lo
ck p
ositi
on.
Th
e re
ceiv
er c
an b
e or
dere
d w
ith b
uilt
in IE
EE-in
terf
ace.
If n
o bu
s
Rot
ary
switc
h (5
.4) c
hoos
es m
anua
l or s
can
oper
atio
n.
is
con
nect
ed, t
he in
terf
ace
switc
h on
the
back
of t
he re
ceiv
er m
ust b
e
Ed
ge p
ositi
ons
pres
et le
ft or
righ
t mar
gin
in th
e of
f pos
ition
. Thi
s is
the
case
if th
e re
d "e
ye"
is in
visi
ble.
(30
MH
z, 1
GH
z) fo
r the
xy-
reco
rder
.

Manual FCVU 1534 Page 5
4 FCVU 1534 Displays and controls, description 4.1 Reading of the interference voltage in dB V
Analogue reading of the inference voltage according to the detectors in dB over 1 V. With input switch (8.2) in the direct input position, attenuator at lowest attenuation and eter Reading in Low Distortion, there is the highest sensitivity of 10 dB V for centre of the meter. With (8.2) in the left Protected Input position, 0 dB centre of instrument is 20 dB V. If the external preamplifier is used ((8.2) in the right position), 0 dB centre of instrument is 0 dB V on the amplifier’s input. The upper meter scale reaches from -25 dB to +25 dB with good linear dB-scaling. This means a logarithmic voltage reading which is related to 0 dB in the centre of the scale. This logarithmic overview range is active if switch (4) is in one of its right hand positions. The overview range permits quasi-peak measurement, but there are limitations when very slow pulses occur and the reading is more than +10 dB on the meter. Because of the fact that the logarithmic scale goes down to -25 dB, there is a basic reading caused by noise for Low distortion (4). As this noise floor is very low, this is no restriction for practical measurement. The lower meter gives a linear voltage reading. Because of the logarithmic law between the dB-level and the voltage the density becomes higher and higher on the left side. Best measurement is in the range between -5 dB to + 6 dB. This linear voltage range is best choice for high precision measurements based on the comparison between the signal to measure and the calibration signal. The input signal is attenuated down to the level (2.2) and (2.3) of the internal calibration signal.
4.2 Attenuator area
4.2.1 Attenuator display (attenuation in dB V)
This 3 digit display shows the sum of the attenuation of the step attenuator (2.3), the high power 10 dB attenuator at the input (8.2) and the 20-dB i. f.-attenuator, which is active in the extreme left and right positions (Low Noise) of the switch (4). Also included is the 10 dB amplification of the external amplifier. This dB-number plus meter reading is the interference voltage in dB over 1 V according to the detector standards. In manual operation, antenna factors have to be considered separately by the user. In PC-controlled operation this job is done by the software.

Manual FCVU 1534 Page 6
4.2.2 10 dB steps of the input attenuator
With the 10 dB step attenuator the desired level range of the receiver is controlled. The dB number visible in (2.1) corresponds to the 0 dB marker in the centre of the meter scale and to the 0 dB horizontal centre line of the xy-recorder diagram. The left end of this line (diagram) touches a small rectangular area, in which this dB number has to be written. At the right end of the line the relative level has to be introduced. If the input switch (8.2) is in the position "Direct Input", the range of the 10 dB step attenuator is from 20 dB to 90 dB for Low Distortion. If the attenuator is in the 10 dB mode for steps, the 1 dB digit is presetted to „0“ and therefor the last 9 dBs are not available. With Protected Input and Low Noise, a maximum of 119 dB can be reached. Whenever there is no need for highest sensitivity, Protected Input should be used.
4.2.3 1 dB steps of the input attenuator
With the 1 dB step attenuator a measurement based on direct substitution is possible by comparing an interference voltage to the internal pulse calibration generator (3) and using the lower meter scale. In the right position of the rotary switch (2.2) the rotary encoder (2.3) increments or decrements the attenuator in 1 dB steps until the same meter reading (for example 0 dB centre in the lower lin y range) is reached. Using this method ultimate precision is obtained.
4.3 Calibration key
Initiates semi-automatic pulse calibration of the receiver's amplification. The pulse standard is programmed by us to track with a standard pulse generator. The correction table is written into an EPROM together with the correction for the amplification of the receiver. Internal calibration is always done with the quasi-peak detector, so it can always be checked on the meter. After switching on the receiver, there is always a priority calibration after 1 second. Before a measurement session and repeatedly during warm up a calibration should be made. During calibration the meter reading approaches 0 dB centre without reaching it completely. For special purposes continuous pressing of the calibration key can be useful. The most important case is the adjustment of the xy-recorder.
4.4 Meter reading
This rotary switch combines both lin/log y and Low noise / Low distortion in 4 positions. The positions with Low noise reduce internal noise by nearly 20 dB and therefor give a better reading in the left part of the meter (1), especially in the log y mode. On the other hand also the test signal is attenuated, which has to be compensated by reducing the input attenuator to get the same reading. This means that the receiver's input gets more voltage which could result in compression or overload. Narrow band signals and fast pulses can be measured in this way, but not slow pulses. The switch positions with log y give an overview range of 50 dB in dB-linear scaling with the upper scale. This kind of diagram is wide spread, especially with xy-recorders. Special care has to be taken if slow pulses are present. In this case choose Lin y/Low Dist. position of this switch, because it treats pulses right without any restriction. If an overview is desired and no slow pulses are present, the Log y/Low noise position is ideal. Choosing lin/log y also determines lin/log x (frequency). A linear frequency scaling looks like a disadvantage for lower frequencies. For special purposes you can expand it by higher amplification of the xy-recorder.
The above difficulties to match the receiver to an unknown spectrum in order to get a diagram is completely avoided in a PC controlled system. The FCVU 1534 together with the Schwarzbeck software Messbase is doing it "all by itself".

Manual FCVU 1534 Page 7
4.5 Frequency area 4.5.1 Frequency display
This display consists of 6 pieces 7-segment-digits. The most significant digit on the left is 1 GHz (1000 MHz), the lowest significant digit on the right is 10 kHz. 10 kHz as smallest step is more than sufficient in this frequency range for an EMI-receiver, compared to the standard bandwidth of 120 kHz (-6 dB). Using 10 kHz-steps, there are always 3 steps with practically the same measurement. Using 1 kHz-steps with 120 kHz bandwidth is both time consuming and useless, because of about 30 identical measurements. In many cases, automatic measurement is done with 50 kHz-steps to reduce measuring time. The standard frequency range from 30 MHz-1000 MHz is enhanced by the extended ranges 20 MHz-30 MHz and 1000 MHz-1050 MHz. These extended ranges should not be considered as measuring ranges, because they are not related to standards. Lower amplification and higher noise level may occur. Automatic calibration in this range could result in wrong measurement in the standard range. In this case, always recalibrate after returning into the standard frequency range in order to avoid problems. You will not notice a „border“ when you tune from the standard into the extended range. However, if you initiate the step which would give you 19,99 MHz or 1050 MHz resp., the receiver is presetted to the following edge of the standard frequency range, 999,99 MHz or 30 MHz. Avoiding fixed frequency limits, the time to tune a random frequency is reduced, because there are always two possible directions to do so. If you don’t want to leave the extended ranges, you should approach their limit carefully. The extended frequency ranges are only available in manual mode, but not with xy-recorder or PC-control. Calibration in the extended frequency ranges can lead to errors after returning to the standard frequency range. If you did calibrate in the extended frequency range, be sure to recalibrate in the standard frequency range.
4.5.2 Frequency encoder
The manual frequency tuning is made by rotating the frequency encoder. Turning c. w. increases, c. c. w. decreases frequency. The frequency steps are chosen by the rotary switch (5.3).
4.5.3 Frequency steps
Manual tuning is made with the frequency encoder. There are available 10 kHz, 100 kHz and 1 MHz steps. You can choose it with (5.3). At the right there is a Lock Position to avoid any frequency changes. The steps are equal for manual and scanning mode with xy-recorder. So please check if (5.3) is in the Lock position if there is no change at all. Using PC-control most of the front panel controls are disabled. For a very accurate measurement choose 10 kHz-steps. So you can be sure that the xy-recorder can record even a narrow band signal. 100 kHz steps are ideal for an overview. Narrow band signals are potentially indicated too low. 1 MHz steps are very useful to change frequency very rapidly

Manual FCVU 1534 Page 8
4.5.4 Rotary switch (5.4) to choose between manual tuning or automatic scanning with xy-recorder. In the Man position the frequency is tuned with the rotary encoder (5.3). In the Start position a clock generator substitutes the rotary encoder to tune the receiver frequency automatically from 30 MHz-999.99 MHz.
The scanning procedure always begins at 30 MHz or at the frequency tuned with Man before and goes to higher frequencies. The two edge positions preset the receiver to 30 MHz or 999.99 MHz. By that the xy-recorder can be matched very easily to the prefabricated measurement sheets at the end of this manual.
4.6 AF/AUDIO
This area contains both a. f. volume control (6.1) and demodulator switch (6.2) The a. f. volume control works just like in a radio receiver. In the norm position of the demodulation switch input signals are demodulated as if they were amplitude modulated. Pulse noise and calibration signal can be monitored well in this position. The f. m.-demodulator is needed to identify broadcast transmitters, especially when measuring outside shielding or unechoic rooms.
4.7 Selecting detectors, QP, PK, AV, CAV, CRMS
Select detectors according to the standard. Continuous sine wave signals give the same reading on all detectors. Changing signals and pulses give different readings.
4.7.1 CISPR Quasi-Peak QP
This detector has a pulse weighing characteristic which considers the annoyance. If single clicks or slow pulses are to be measured, choose lin y / low distortion of
switch 4. Highest precision is obtained, if both attenuators (2.2) and (2.3) are used to adjust the signal to the 0 dB marker of the linear (lower) scale. The precision is then better than required. The measurement reading can be done in the display (2.1) for 0 dB (centre) meter reading.
4.7.2 Peak PK
Centre position of switch (7) gives reading of the unvalued peak voltage. The Peak Detector has an extremely short charge time constant and is self-resetting. The measurement is the peak value, related to the bandwidth, based on the calibration f the effective value of a sine wave.

Manual FCVU 1534 Page 9
4.7.3 Average AV
In this position the average of the demodulated i. f. signal is measured. A time constant is used to give a constant reading for pulses with repetition frequencies >100 Hz. This Average Detector behaves like the classic Average detector which has been familiar to the EMC - communty for the last 50 years.
4.7.4 CISPR-Average CAV
Just like the classic AV, but with a critcally damped second order low pass filter with a time constant of 100 msec. The pulse weighing for fast pulses is the same, but the behaviour for slowly changing (narrow band) signals is completely different.
4.7.5 CISPR-RMS CRMS
This detector has a weighing function which considers the effects of disturbance to digitally modulated signals. Basically it uses a RMS - Detector with a specified corner frequency followed by critcally damped second order low pass filter with a time constant of 100 msec.

Manual FCVU 1534 Page 10
5. First steps
5.1 Front panel operation, manual tuning
Attention: Read safety informations page 2 very carefully. Before connecting receiver to mains, select mains voltage and fuse-current on the rear pannel voltage selector/fuse holder.
Attention: The receiver may have a built in IEEE-interface. Front panel operation is only possible if the rear switch is in the off-position. This switch is off if the "red eye" is invisible.
A) Set all switches to the position marked by the hand-symbol in the picture on this page. Set the a. f. volume in half position.
B) Switch on the receiver by pushing (9).
C) About 1 second after switching on a pulse is heard. The meter reading approaches centre 0 dB and then returns to the left end of the scale. This was the automatic priority calibration with 100 Hz pulses according to the frequency range 30 MHz-1000 MHz.
The receiver is now ready to use and frequency is tuned by rotating the encoder (5.2). The steps can be selected with (5.3). Use 10 kHz-steps to tune narrow band signals (sine wave) for maximum precision. 100 kHz-step can be used for quick search and 1 MHz-steps for frequency hopping. For overviews it is ideal to choose Log.-indication with Low Noise (4) and reading the upper meter scale (1). The frequency range specified in the standards is basically 30 MHz-1000 MHz, but the receiver covers the extended range from 20 MHz-1050 MHz. So you can be sure that there is no signal outside the frequency range which could drift inside by circuit tolerances or temperature. In order to make frequency tuning easy, there are no fixed limits. If there is an „underflow“ under 20 MHz or an „overflow“ over 1049.99 MHz, the „legal“ frequency limits 30 MHz and 999.99 MHz are presettet. Amplification in these „outside“ ranges may be lower and therefor calibration could be incorrect. Be sure to recalibrate the receiver after returning into the standard frequency range. The scanning procedure is limited to the standard frequency range of 30 MHz-999.99 MHz.

Manual FCVU 1534 Page 11
Appendix Pages 11-30
5.2 Front panel operation, automatic scanning A) The automatic scanning is useful for recording a spectrum or to get an overview. For these purposes it is more comfortable than the manual tuning. A look ahead i. f. analysis (VARISCAN) adapts scan speed to the spectrum ahead.
Highest scan speed is chosen for broad band spectrums and slowest scan speed for narrow band signals. VARISCAN is always active if automatic frequency scan is chosen.
B) Set steps to 10 kHz for best precision with narrow band signals or 100 kHz for overview. C) For overviews choose log. indication together with Low Noise (4). Use meter scale (1). D) Set rotary switch 5.4 to the start position. In the edge positions 30 MHz or 999.99 MHz will be presettet to adjust xy-recorder. E) The automatic scanning begins. You can switch scan/man whenever you want.

Manual FCVU 1534 Page 12
5.3 Automatic scanning and recording with xy-recorder
A) One advantage of this receiver is the easy recording of interference spectrums, for example with xy-recorders or storage oscilloscopes. Usually the xy-recorder will be used. A look ahead i.f. analysis (VARISCAN) adapts scan speed to the spectrum ahead. Highest scan speed is chosen for broad band spectrums and slowest scan speed for narrow band signals.
VARISCAN is always active if automatic frequency scan is chosen. A cable connects the xy-recorder to the rear side 25-pin sub-d-connector of the FCVU 1534. The xy-recorder receives the analogue voltages for frequency and interference voltage. There are 2 connectors for the frequency and 2 connectors for the y-amplitude. A DIN-connector is there for pen lift control.
B) The connectors of the cable are indicated. The black connectors belong to the sockets of the xy-recorder indicated with a minus-symbol. The x-socket (frequency) of the recorder belongs to the red connector, the y-connector (amplitude) belongs to the yellow (voltage, dB). The 3 pin DIN connector is responsible for pen up / pen down control. This DIN connector fits directly into xy-recorder delivered by our company. On the control panel of the xy-recorder both sensitivity switches are positioned to 0,1V/cm and the other switches to "Var." (=variable sensitivity). By toggling the rotary switch (5.4) between the 2 edge positions, the receiver toggles between 30 MHz and 999.99 MHz and the pen of the xy-recorder toggles between left and right edge. Now one of the prefabricated diagrams is positioned on the xy-recorder and electrostatically fixed (switch "chart "). Position the receiver with (5.4) to 30 MHz. The pen is adjusted by the x-zeroing control (hor. double arrow) to the 30 MHz frequency line. Set (5.4) to 999.99 MHz. The pen runs to the 999,999 MHz line. Adjust the pen to this line precisely by controlling the "Var."-control (=sensitivity). Adjustment of the dB scaling is similar. Without input signal (Low Noise position reduces base line noise) the "y" zero is adjusted to the bottom line of the diagram. With permanent calibration signal adjust "var."-control (=y - sensitivity) until the centre 0 dB(rel.)-line is reached. Without calibration signal for 30 MHz point A and for 999,999 MHz point C must be covered. When toggling, don't remain too long at Start position, otherwise scan procedure will begin.

Man
ual F
CVU
153
4 Pa
ge 1
3
6
Rea
r pan
el (D
escr
iptio
ns, c
omm
ents
, war
ning
s)
Sw
itch
for I
EEE
- Con
trol
ler
Red
"Eye
": P
C-C
ontr
olBl
ack:
Fro
nt p
anel
ope
ratio
n
IEEE
- C
onne
ctor
(Cen
tron
ix)
XY
- Re
cord
er, A
uxili
ary 1
Mai
ns v
olta
ge-
sele
ctor
1: S
hiel
ding
gro
und
14: +
12 V
(100
mA
)15
: - 1
2 V
(100
mA
)19
: Pen
Lift
Con
trol
.23
: x re
cord
. (Fr
equ.
)24
: y re
cord
.(Am
pl.)
25: S
igna
l gro
und
WA
RNIN
G:
Use
con
nect
ors
only
for
ope
ratio
n w
ith t
he
spec
ified
equ
ipm
ent,
not
hing
els
e!
PC c
ontr
olle
d op
erat
ion
only
tog
ethe
r w
ith t
he
For
man
ual f
ront
pan
el o
pera
tion
switc
h of
f in
terf
ace
with
the
sw
itch
on t
he r
ight
top
of
the
rear
pan
el!
WA
RNIN
G:
Use
rec
eive
r on
ly w
ith s
afet
y gr
ound
!If
the
lisn
is n
ot g
roun
ded
corr
ectly
, gro
und
curr
ents
may
flo
w v
ia t
he b
us c
able
to y
our
PC!
Schw
arzb
eck
mea
surin
g so
ftw
are!
Not
e2
Fuse
s
für 2
20 V
for 1
10 V
T 0,
5 B
T 1,
0 B
110V
/220
VN
- co
nnec
tor
R.F.
-Vol
tage
optio
nal
Trac
king
Gen
.
Fuse
for
ext
.R.
F.-P
ream
plifi
er
T 0,
16A
B
XY -
reco
rder
, aux
iliarie
s
IEEE
- 48
8 - C
ontro
ller,
conn
ecto
r
C
onne
cted
via
sta
ndar
d bu
s ca
ble
X
(Fre
quen
cy) L
in/L
og 0
V -
1 V
to
INES
- IE
EE -
card
bui
lt in
PC
.
Y
(Am
plitu
de) L
in
0 V
- 0,5
V -
10 V
Cen
tre o
f met
er 0
,5 V
Y
(Am
plitu
de) L
og 0
V -
0,5
V - 1
V
Cen
tre o
f met
er 0
,5 V
Pen
Lift:
Ope
n C
olle
ctor
in s
erie
s
w
ith 1
k -
resi
stor
to g
roun
d
for P
en D
own.

Manual FCVU 1534 Page 14
7 How to connect and adjust the xy - recorder
Horizontal: Frequ.Vertikal: dB
Y+ -
X+ -
Pen
32
1 Si
Spannungswähler
gelb schwarzyellow black
Y+ Y- rot -blackred blackX+ X-
Farben der Bananenstecker desSchreiberkabels für X und Y
Schreibstift-Steuerung Pen up/downKontaktschluß (1)/(3): Feder schreibtOffen: Schreibfeder hebt abContact Closed (1)/(3); Pen downContact open: Pen Lift3-pol. DIN-Stecker am Schreiberkabel3 Pin DIN Connector (Rec. Cable)
NETZ
0 1
Off Chart PenVAR
X
Nullp. X VAR Nullp. Y
Y
Verst. XAmplif. X
Verst. YAmplif. Y
(A) NETZSCHALTER Aus/Ein (B) Schalter Off/Chart/Pen, Off: Papier frei, Chart: Papier wird Stat. fixiert, Pen: Feder a. Papier
Off: Paper loose, Chart: Paper fixed, Pen: Pen down
Power/Mains Switch
(C) VAR.X: X-Verstärkung Amplification X (Control (frequ.)(D) Scalter VAR/CAL, Einstellen auf VAR. Sw.: Set to "VAR"(E) Drehschalter: 0,1V/cm Rotatable Sw.: Set to 0,1V/cm(F) Nullpunkt X (30 MHz) Zero X, set at 30 MHz(G) VAR, Y Y-Verst.(dB) Amplification Y Control (dB)(H) Schalter VAR/CAL, Einst. auf VAR. Sw.: Set to "VAR"(J) Drehschalter: 0,1V/cm Rotatable Sw.: Set to 0,1V/cm(K) Nullpunkt Y (kleinste Spg.) Zero Y, set to lowest dB line
Nullpunkt X (Regler F) auf 30 MHz (Punkt A, Schalter 5.4)Verstärkungsregler X (VAR. X Regler C auf 999.99 MHz (Punkt C, 5.4)Nullpunkt Y (Regler K) auf unterste Pegellinie justieren, wenn keinSignal und kein Rauschen vorhanden ist (ZF +20 dB)Kalibriertaste (3) dauernd drücken bei (5.4) 30 MHz. Wenn Instrumenten-zeiger auf 0dB, mit Regler (G) VAR. Y Schreibst. a. Pkt. B des Diagramms
(A) (B) (C) (D) (E) (F) (G) (H) (J) (K)
XY-Recorder Controls: Zero X (Control F) adjusted until pen is at the left-hand rim of therecording pattern 30 MHz Point A Switch 5.4.Amplification Control (X) (= VAR. X, Control C): adjust to right hand rim of recordingpattern with highest frequency (999.99 MHz, Point C Sw. 5.4). Readjust until C and A are ok.Zero Y (Control K) adjusted to lowest voltage (downmost) rim of the recording patternwith no signal and no noise on receiver (+20 dB I. F. Sw. 4). Press Calibrator Key (3)on receiver continuously with switch (5.4) on 30 MHz, until meter reading is0 dB center. Adjust pen to point B with VAR. Y control (G).
Colours of Banana Plugs ofRecorder Cable

Manual FCVU 1534 Page 15
10 General information for practical measurement with EMI-Receivers beyond 30 MHz 10.1 What is different to measurement of conducted voltage below 30 MHz? In most cases EMI-measurement begins with equipment for conducted voltage in the frequency range from 9 kHz-30 MHz. Using a L.I.S.N. as a coupling device, good results can be obtained, even without perfect shielding rooms. Using PC-control shows perfect measurement, because basically only the frequency has to be scanned and the amplitude has to be recorded. Even at manual measurement the problem is easy, considering that the L.I.S.N. takes the interference voltage and feeds it to the EMI-receiver. Transducer factors don't have to be considered. The situation is totally different beyond 30 MHz. A basic method is measurement with antennas. Just like the measurement with absorption-clamps they have to be considered as Transducers. While the clamp has only to be moved along the cable to find the maximum of power, things are more complicated considering antennas. Antenna height, polarisation, distance to the unit under test and rotary angle have to be considered for each frequency. Another problem is the measuring site. A free area is ideal because there are practically no echoes, but a large number of external signals have to be identified. Some broadcast bands are so overcrowded by strong signals that it is impossible to measure. The standard shielding room however is no solution to this problem, because the walls work as reflectors. An unechoic chamber is out of reach for most people, because of the very high cost. One more point is that measurement becomes more and more critical simply because frequencies are higher and wavelength shorter. This means that any changes in wiring and so on changes the reading. 10.2 Only PC-controlled measurement beyond 30 MHz? Obviously it's nearly impossible to make this "maximum seek" for each frequency, when measuring time is limited. In order to save time without sacrificing accuracy, some simplifications have to be made. Documentation is better with PC-controlled measurement, but manual operation in a free area measuring site eventually may give better results. Tuning manually, critical frequencies can be recognised and optimised by changing antenna height, polarisation and angle of unit under test. Listening to the loudspeaker gives easy identification of broadcast transmitters and a signature of signals coming from the unit under test. If the responsible engineer for the unit under test is present, he gets very interesting information about it. Later on in his laboratory, he can look for the signals identified using near field probes. Critical spots on PC-boards can be improved and the antenna measurement is made once again.
There is no substitute for knowledge, experience and intuition of the operating engineers. Using their senses, they can reduce data on a higher level than a software can do. Without human assistance, the PC in the EMI-field is a poor number cruncher. The effort to make software more and more sophisticated leads to surprising side effects. On the other hand, when this basic EMI-work is done, a large number of units can be tested very easily using pc-control.

Manual FCVU 1534 Page 16
10.3 Some basic considerations concerning antennas.
The unit under test radiates a electro-magnetic field. The EMI-receiver is carefully screened against fields and measures a voltage at the input connector. In order to measure field-strength it needs a converter to convert field-strength into voltage. The relation between field-strength (rushing into the antenna) and voltage (coming out of the antenna) is called antenna factor. Usually in the EMI-field voltage is given in dB V. It is related to 0 dB V=1 V. Because of the fact that dB-numbers are related to power, the voltage ratios are the square root of the power ratios. So for example 20 dB is a power ratio of 100:1 and a voltage ratio of 10:1. Considering that 0 dB V is 1 V, 20 dB V is a voltage of 10 V, 60 dB V is 1 mV and 120 dB V is 1 V. The same procedure is used for field-strength. 0 dB V/m is 1 V/m, 60 dB V/m is 1 mV/m and 120 dB V/m is 1 V/m.
10.3.1 How to handle antenna factor?
The dB antenna factor fits perfectly into this dB-world and can be simply added to the voltage in dB V measured by the EMI-receiver. Its unit is dB/m as a result of the division of voltage in dB V and field-strength in dB V/m. Both negative and positive antenna factors occur. High positive antenna factor means low, high negative antenna factor means high voltage at the receiver's input connector. Example: Receiver reading: 40 dB V Antenna factor: 20 dB V Field-strength: 60 dB V
Coaxial cable attenuation cannot be neglected at higher frequencies, it can be added to the antenna factor or considered separately. Usually antenna factor and cable attenuation vary with frequency. This is also true with broadband antennas. The numbers are given in the data sheets. In manual operation, only the critical amplitudes in dB V, which are near to the limit, are written in a table and the antenna factor (incl. cable attenuation) is added. The limit is also written in this table to compare. Example:
Frequency MHz Receiver Reading dB V Antenna factor dB/m Field-strength dB V/m Limit dB( V/m) ---------------------------------------------------------------------------------------------------------------------- 100 MHz 50 dB V 10 dB/m 60 dB V/m 70 dB V
Using PC-controlled measurement the calculations are done by software. 10.3.2 How to choose antennas?
There is a variety of antennas and it is not easy to choose. If we consider that receiver sensitivity in this frequency range is limited and that some limits are very low, a good antenna factor seems to be best choice. Example: Frequency: 1000 MHz Inherent noise of receiver: 0 dB V Antenna factor (incl. cable attenuation): 25 dB/m Limit: 35 dB V

Manual FCVU 1534 Page 17
A signal equal to the limit is 10 dB stronger than internal receiver noise, which is enough to measure. Smaller signal reading would be affected by noise. This example shows, that there are limits impossible to measure with some antennas.
Beside antenna factor other things like matching, frequency range, directional diagram, volume, power handling capability and cost are also important. All these things are subject to trade off and cannot be optimised together. So for different measuring problems different antennas are needed. If automatic measurement is used, only broadband antennas make sense. Standard is a biconical antenna for 30 MHz-300 MHz and a log-periodic antenna for 300 MHz-1000 MHz. Biconical antennas suffer less from environmental influence at lower frequencies due to their lower element current, the disadvantage is a high antenna factor. For highest accuracy pairs of precision dipoles are used. They are measured against each other to minimise errors. To avoid errors caused by mismatch, they use precision attenuators on the symmetric dipole side and on the unsymmetric coaxial connector side. It is obvious, that this attenuation is at the expense of antenna factor. The classic dipole antennas with telescopic elements have to be tuned to the operating frequency which is unacceptable for automatic measurement, but have good antenna factors and are low priced. More detailed information about antennas is given on request. 10.4 Absorbing Clamp (MDS) 10.4.1 Principle of Operation
Field-strength measurement in the free area or in unechoic chambers is time consuming and expensive. If we have equipment under test which is small compared to the wavelength, on which the measurement takes place, practically all radiated power is radiated by the mains cable, because it is the longest part of the system. If we think of a small drilling machine with a 3 m cable measured below 300 MHz ( <1m), this is certainly true. 10.4.2 Practical measurement:
The equipment under test is positioned at the end of an isolating table which is 6 m long. Its mains cable is enlarged to 6 m (if necessary) and put through the "tunnel" of the clamp which can be moved along the cable because of its wheels. The coaxial output of the clamp is connected to the input of the FCVU 1534 receiver. When the maximum on a frequency is found, the amplitude is recorded. The clamp has an attenuation of 17 dB. This means that the dB V-reading of the receiver is equal to the conducted power in (dBpW). So even in manual operation measurement is easy without further calculations. For highest accuracy the individual calibration data coming with the clamp can be used. For PC-controlled measurement the individual correction can be specified as transducer and the y-axis unit in dB(pW).

Manual FCVU 1534 Page 18
11 The external R. F. Preamplifier (optional)
can be mounted directly at the N-connector of the antenna. Because of this position both cable attenuation and front end attenuation in the EMI-receiver are eliminated. Depending on the situation, noise reduction up to 8 dB is possible. Signals otherwise lost in the noise can be measured. There is no need for special cables for power supply and remote control. The power supply voltage, which is also remote control voltage is connected to the inner conductor of the input connector in a special circuit in the FCVU. If +5 V supply voltage is switched on, the amplifier is switched into the signal path. If the voltage is off, the amplifier is bypassed and the antenna is connected directly to the receiver via the coaxial cable. Switching on the preamplifier is done by rotating the input switch to the "External Preamplifier" position, if the fuse 0,16 A T on the rear panel is inserted. This fuse is not inserted when the receiver is delivered. It should be inserted only when measurement with the amplifier is really made. The reason is that other equipment connected to receiver could be damaged by the +5 V voltage. If no fuse is inserted, no danger is present. Burning out of the fuse should normally be avoided, because it doesn't mean a 100% protection for other equipment. The amplifier is very useful to measure weak narrow band signals, but it has to be considered that any broadband preamplification increases intermodulation. The amplifier has excellent large signal specifications, but only a 25 MHz high pass filter as frequency selection. So care must be taken with pulse spectrum and strong signals from broadcast transmitters in a free area. Problems rise with the number and strength of signals. For this reason the amplifier should be only swichted on when really needed. It is good practice to check ON/OFF for a difference in reading of approx. 10 dB. If a signal rises 20 dB or 30 dB with the amplifier intermodulation is the reason.

Manual FCVU 1534 Page 19
12 Optional Tracking Generator
12.1 What does it?
The optional tracking generator produces a signal on a frequency which is equal to the receiver frequency. Transmitter and receiver come together as a transceiver. Being on the same frequency all the time makes tuning and measuring very easy and fast.
12.2 How does it work?
The receiver's frequency range is covered by 7 VCOs which are part of a PLL. Receiver PLL and tracking generator PLL are controlled in such a way that both frequencies are identical. A combination of a receiver and a transmitter in one box with tracking frequencies is known as "transceiver. Final amplification gives a strong (1V/50 ) signal.
12.3 What is it good for?
Tracking generator and interference measuring receiver together are a powerful instrument to measure attenuation. This is due to the sensitivity, the dynamic range and attenuator precision of the receiver. If as in this case the output voltage of the tracking generator is high (1 V/50 ), in theory attenuation of more than 130 dB can be measured. In the real life such an attenuation has to be measured not very often and measurement is critical because of the decoupling needed. On the other hand, the high dynamic range available can be used to put in fixed attenuators to improve matching, which improves precision. 12.4 Which are the most important tasks? 12.4.1 Filter measurement
While a part of the interference is already suppressed on the PC-board where it’s produced, usually additional filtering is needed in the power supply lines. This filter prevents conducted interference to spread via the mains cable. Filter attenuation is most often given by the manufacturer’s data sheet, but it is very helpful to check it in the assembly. This can be done by connecting receiver and tracking generator to the filter’s input and output. The level difference is the filter attenuation on these frequencies. 12.4.2 Site attenuation between transmitting and receiving antenna.
The attenuation between 2 antennas in a free field area can be calculated, but especially in non perfect areas differences occur. They can be recorded, when transmitting and receiving antenna are connected to the tracking generator and the receiver. It is now possible to record attenuation versus frequency and check the differences to the calculations. In the same way the effectiveness of shielding and shielding rooms can be measured. 12.4.3 How to calculate the attenuation?
Attenuation [dB] = Transmitting Level [dB V] - Receiving Level [dB V] - Additional Attenuation [dB] The transmitting level of the tracking generator is 120 dB V. The receiving level is measured as usual. Additional attenuation can be 10 dB fixed attenuators on the output of the tracking generator and on the input of the receiver. Also antenna factors and other transducer factors and attenuation have to be considered. Measuring Mains Filters it is especially important to use 10 dB fixed attenuators directly on input and output.

Manual FCVU 1534 Page 20
The reason is that these filters which are usually measured in a 50 -system are in no means matched to 50 . In contrast to filters for communication systems, they are only optimised for attenuation, nothing else. The attenutors reduce the negative effect of mismatch in the measuring system. 12.5 Where is the r. f. output of the tracking generator?
On the right side of the rear panel near the top of the power supply cooler the BNC-connector for the tracking generator is located. 12.6 Where is the switch on/off?
In manual (front panel) operation, the tracking generator is switched on/off with the Demodulator rotary switch (6.2). The on-position is indicated by a flashing LED. The tracking generator must only be switched on when it is really needed. EMI-measurement in this mode is potentially erratic. Using software control the tracking generator is switched on/off in the Settings-Receiver menu. Software control is very simple and precise because of autoranging. By that the whole dynamic range is covered. Also in the software mode switch on the generator only when its needed and never during interference measurement. 12.7 Important! 12.7.1 Switch on the tracking generator only when its really needed. Switch it off whenever possible. Any unterminated piece of cable can spoil the laboratory with radiated high frequency. This leads to misreadings when measuring signals. 12.7.2 Use a fixed attenuator on the BNC-connector. It is useful to work in the low noise mode to extent the meter dynamic. 12.7.3 The reduction of output voltage usually is no problem because of the basic high level. The attenuator works as a protection in every day work. Isolation between input and output of the test setup is critical. Any feed through (leakage, by pass) will affect the measurement. 12.7.4 The tracking generator covers the frequency range 30 MHz-999.99 MHz only. It may work down to 23 MHz, but not above 999,99 MHz. 12.7.5 In front panel mode, VARISCAN is autoamtically off, because it consumes time though not needed here. Switch VARISCAN off in the software mode in Settings - Receiver for the same reason. 12.8 The power amplifier of the tracking generator uses r. f.-transistors which may be destroyed by high voltage spikes. If it is to be connected to a L.I.S.N. a pulse limiter must be used (please ask for information), otherwise the generator might be damaged.

Manual FCVU 1534 Page 21
13 Meter and Meter Reading 13.1 Basics Let us consider an EMI-receiver as a frequency selective voltage meter. Frequency selective means, that only a. c.-voltages of the tuned frequency are measured (within the specified bandwidth). Using the FCVU-receiver in the frequency range from 20 MHz-1049,99 MHz, the bandwidth is 120 kHz (-6 dB).
A common analogue or digital multimeter also measures a. c.-voltages, but the measurement is not frequency selective in the specified frequency range. This frequency range is limited by the low (some Hz) and high (some kHz) frequency limit, depending on the qualification of the meter in use. The meters measure the sum, because all voltages within the range are fed to one rectifier. One single high voltage dominates the measurement. Weaker voltages on other frequencies don’t influence the reading significantly. The frequency selective EMI-receiver in contrast will show a multitude of voltages with different frequencies separately. A common multimeter has a basic dynamic range in which different voltages can be measured without changing the range. To extend the voltage range dividers are used to divide high voltages down to the basic range. Common multimeters for example have switch positions for 200 mV, 2 V, 20 V, 200 V, 1000 V. The smallest voltage to measure in the 200 mV - range is 0,1 mV, the highest 199,9 mV. Voltages < 0,1 mV are ignored, voltages > 199,9 mV show overflow. In contrast to common multimeters which are scaled in V, EMI-receivers use a scaling in dB V, which means dB over 1 V. The logarithmic dB-scaling is widely used in signal generators, pulse generators and receivers. It is for this reason that the attenuator steps of the FCVU are also in dB. Just like the multimeter the receiver has a basic dynamic range and an attenuator. If the attenuator is switched to zero attenuation, a noise floor of less than 0 dB V is measured using CISPR-Quasi-peak detector. 0 dB (centre of the meter scaling) is 3,162 V. The right edge of the linear scale is 16 dB V / 6,309 V. The right edge of the logarithmic scale is +26 dB over 10 dB V acc. to 36 dB V/63,1 V. The attenuator shifts this dB-range into higher voltages, the attenuation has to be added to the meter reading. This shift can also be made using Low noise. This attenuation is not added on the input, but near the output of the receiver and therefor reduces noise. This makes measurement easier because of reduced noise errors, but it increases receiver loading which can result in errors caused by overload (saturation, compression, intermodulation).

Manual FCVU 1534 Page 22
13.2 Meter and Scaling
13.2.1 Zeroing 13.2.1.1 Mechanic zeroing of the meter: The indicator (pointer) is adjusted to the N-point on the left side of the meter scaling by turning the screw below the meter window. 13.2.1.2 Electric zeroing: Even when no signal is coming into receiver (coaxial cable disconnected), there is small „idle“ measurement on the meter. It is caused by the internal noise of the receiver and is different for different receiver settings. This noise reading is absolutely correct and no error. Any method to avoid this basic noise would affect the measurement of small signals. In order to prevent misreading caused by noise in the very common case of CISPR-Quasi-peak detector and 0 dB i. f. attenuation (low distortion), there is a note on both linear and logarithmic scale to indicate internal receiver noise. Internal noise also depends on frequency. The noise level is not constant over the whole frequency range. The noise reading depends on : A) Linear or logarithmic scale. The logarithmic scale can show smaller signals than the linear one. This means that also the small "Noise Signal" shows more indicator angle on the left side of the scale. B) Low distortion / Low noise: Low distortion shows approx. 20 dB more noise than Low noise. Low noise gives a longer usable scale with the disadvantage of potential (non damage) receiver overload. C) The three different detectors differently convert receiver noise into noise reading. The Peak / Mil-detector shows the highest reading, followed by CISPR-Quasi-peak and Average.

Manual FCVU 1534 Page 23
Obviously a multitude of possible combinations lead to different noise readings. It has to be considered that the same noise leads to different scale angles on linear and logarithmic scale, even though this is same reading. The combination for the smallest noise reading is: Frequency range: 20 MHz-49,99 MHz (typically) Detector: Average I. F.-Attenuation: 20 dB I. F.-Attenuation (low noise) (Meter scale: Linear) The combination for the highest noise reading is: Frequency range: 800 MHz-1049,99 MHz Detector: Peak I.F.-Att.: 0 dB I. F.-Attenuation (low distortion) (Meter scale: Logarithmic) Usually CISPR-Quasi-peak is the standard detector. The tables below show some characteristic noise readings for this detector. Linear scale Logarithmic scale low noise approx. 3 mm left of
10 dB - Point left of -10 dB - point, frequency dependent *
low dist. very small very small * Using this setting, there may be a possible misreading caused by noise indication. It is a good practice to listen to the sound coming from the receiver’s loudspeaker. Usually there is a difference between receiver noise and an interference signal. If you are unsure, disconnect the input coaxial cable to see and hear the difference. Measuring near receiver noise floor should be avoided whenever possible, because the noise and interference to be measured add up to a higher reading. Whenever possible reduce input attenuation to shift the indicator near the 0 dB (centre of meter) position. This means best precision because of best compromise between noise and overload. 13.2.2 Scales The upper scale is the logarithmic scale, the lower the linear scale. Both of them have the 0 dB centre of meter. On this point the receiver has optimum precision, which is derived from the internal pulse standard by substitution. To the left precision is reduced because of receiver's internal noise. To the right precision is reduced because of potential overload (pulse compression especially with slow pulses / clicks).

Manual FCVU 1534 Page 24
13.2.2.1. Linear scale Obviously the linear scale has no linear scaling (equal distances for dBs), which seems to be a contradiction. The explanation for this strange behaviour is that the scale behaves linearly concerning voltages in V or V, not dB V. The receiver converts the voltage on is input connector into proportional readings on the meter. If we would make a scale in V or V, this scale would be a linear scale. However the scale used is a dB V-scale, according to a logarithmic law. Because of this logarithmic law the distances increase from left to right. The table below shows this for some characteristic values. Input voltage is in V and the attenuator setting is zero dB attenuation (10 dB indication).
Input voltage in V Meter reading on the linear scale 1,000 V -10 1,122 V -9 1,258 V -8 1,412 V -7 1,584 V -6 1,778 V -5 1,995 V -4 2,238 V -3 2,511 V -2 2,818 V -1 3,162 V 0 dB Centre of instrument 3,548 V +1 3,981 V +2 4,466 V +3 5,011 V +4 5,623 V +5 6,309 V +6
For the difference of 1 dB from -10 dB to -9 dB only an input voltage difference of 0,122 V is needed. For the difference between +5 dB and +6 dB we need 0,686 V, nearly 6 times more. This corresponds to the distances in the dB-scaling.

Manual FCVU 1534 Page 25
13.2.2.2 Logarithmic Scale This scale permits a wide overview in a dB-linear scaling. This is made using an analogue lin/log-converter. In its right part the logarithmic scale can indicate 20 dB higher voltages, in its left part 15 dB smaller voltages than the linear scale. Fast overview is easier this way, because switching of the attenuator is avoided. On the other hand there are some limitations and problems, which could cause errors. A) Errors caused by receiver noise: Measuring "low distortion" and Quasi-peak, a noise level of approx. -13 dB is present on the logarithmic scale, which might be considered as an interference signal caused by the equipment under test. It is good practice to listen to the loudspeaker to decide, if its noise or interference. Disconnecting the input coaxial cable shows clearly if the signal is produced inside or outside the receiver. B) Overloading the receiver: Even though the receiver is protected against damage especially in the protected input mode, there is a danger of wrong measurement especially when slow pulses are to be measured. The situation is even worse, when the spectrum shows big differences between maximum and minimum as this is the case with car ignition systems. Also local broadcast transmitters in a free area can produce voltages in the mV-region. Such spectrum "consumes" the dynamic range of the receiver to such a degree, that there is nothing left for the logarithmic scale or the low noise mode. Under these circumstances a superimposed slow pulse might be measured too low, because the receiver has no more „breath“ left for the pulse. On the other hand, the high voltage in the low frequency band might cause intermodulation distortion which could result in wrong measurement at higher frequencies, which are produced in the receiver itself. These problems occur far beyond the limits of standard measurement especially with high power, slow pulse equipment. Standard equipment such as PCs and microprocessors don’t show these characteristics. It is good practice to check measurements with the receiver on the safe side, which means low distortion on linear scale.

Manual FCVU 1534 Page 26
14 Function
14.1 Basics of development
It all began with manually operated in-terference measurement receivers with a conventional meter to read the measurement. These receivers dominated the market for several decades. Due to simplicity (few com-ponents) and concentration on the impor-tant features these receivers were relatively small, light weight, reliable, cheap and easy to use. Many of these Schwarzbeck receivers are still in use and estimated very high by the users. Recent electronic development however made front panel operation more convenient and introduced pc-control.
14.2 Basic function
The FCVU 1534 is an interference measuring receiver for the frequency range 30 MHz-1000 MHz. Two extended frequency ranges permit overviews down to 20 MHz and up to 1050 MHz. Using the automatic scanning procedure with xy-recorder the receiver records a spectrum in one range from 30 MHz-1000 MHz. The scan speed is automatically adapted to the spectrum ahead, so no further adjustments are needed. One single rotary switch determines manual tuning or automatic scanning and provides for setting of the corner frequencies to adjust the xy-recorder. The adjustment of the interference voltage ranges uses a programmable attenuator. It is adjustable between 10 dB V and 109 dB V. 129 dB V are reached when the power attenuator and low noise (20 dB i.f.-attenuation are active. In this way both high sensitivity (better than 1 V) and overload protection against spikes are achieved. The input protection is made by a 10 dB power attenuator directly at the receiver’s input.
The 3 digit display includes correction for power attenuator, i. f.-attenuation and optional r. f.-preamplifier. The optional r. f.-preamplifier can be mounted directly at the connector of the receiving antenna to eliminate all losses from here to the receiver’s front end. Especially at the high frequency edge near 1000 MHz this may be a big improvement. Any r. f.-preamplifier can contribute to intermodulation. By simply switching it on or off from the receiver’s front panel by remote control, potential spurious signal can be checked immediately. Power supply and remote control uses standard coaxial cable.
14.2.1 Receiver unit
The receiver unit of the FCVU 1534 begins at the input connector and ends at the active demodulator, The power attenuator, the step attenuator, the input selective amplifiers and the frequency synthesiser generating all frequencies belong to this unit.
14.2.2 Calibration generator
This unit generates the reference signal for the calibration in all standards.
14.2.3 Indication unit
It consists of the detectors, the measuring amplifiers, the automatic calibration and many other circuits.
14.2.4 Control logic
The control logic consists of the front panel board with all controls and displays and two back boards.
14.2.5 Power supply
The power supply provides for all volt-ages. + 12 V and - 12 V can be tapped on the rear side sub-d-connector for accessories.
14.2.6 IEEE interface
Converts the bus signals in control sig-nals for the control logic. Part of this unit is a 12 bit a/d converter. It converts directly the meter voltage for PC and software.
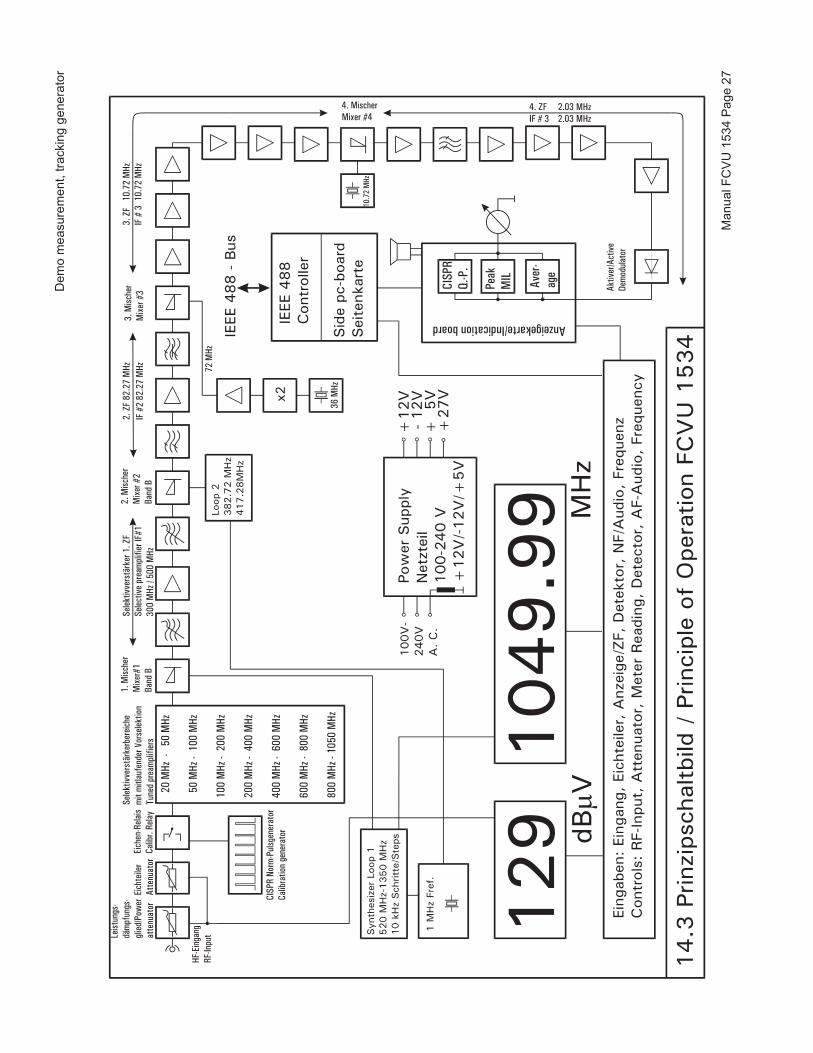
Dem
o m
easu
rem
ent,
track
ing
gene
rato
r
Man
ual F
CVU
153
4 Pa
ge 2
7

Han
dbuc
h FC
VU
1534 S
eite
28
30M
50M
100
M20
0M30
0M40
0 M
500M
(-25
dB re
l.)
(-20
dB re
l.)
(-15
dB re
l.)
(-10
dB re
l.)
(- 5
dB re
l.)
( 0
dB re
l.)
( +5
dB re
l.)
(+10
dB
rel.)
(+15
dB
rel.)
(+20
dB
rel.)
(+25
dB
rel.)
Ref
.
teile
r dBdB
V
B
Eich
-
AC
Sch
war
zbec
k M
ESS-E
LEKTRO
NIK
FC
VU
1534
Log.
Fre
quen
cyLo
g. V
olta
ge 1
6.1
Dia
gr.
1
1000
M70
0M

Han
dbuc
h FC
VU
1534 S
eite
29
30M
100M
200M
400M
500M
700M
900M
(-10
dB re
l.)
(-4 d
B re
l.)(-3
dB
rel.)
(- 1
dB re
l.)
( 0 d
B re
l.)
(+2
dB re
l.)
(+3
dB re
l.)
(+4
dB re
l.)
(+5
dB re
l.)dB
V
Ref
.
Eich
-te
iler
dB
B AC
Sch
war
zbec
k M
ESS-E
LEKTRO
NIK
FC
VU
1534
Lin.
Fre
quen
cyLi
n. V
olta
ge16.2
Dia
gr.
2
1000
M80
0M300M
600M
(+1
dB re
l.)
(- 2
dB re
l.)
(-5 d
B re
l.)


![Informatik / G. Graubnerinformatik.freie-schule-prerow.de/Lehrerfortbildung Kl9/Schall... · nur noch bedingt ... 10 MByte/Minute (Stereo), Kapazität: 650 MByte = 74 Minuten 3 ]](https://img.dokumen.tips/doc/110x75/5b9fa7f409d3f26e288d2d0d/informatik-g-kl9schall-nur-noch-bedingt-10-mbyteminute-stereo.jpg)


![PDF format [1.8 Mbyte ]](https://img.dokumen.tips/doc/110x75/58776af01a28abec758b8659/pdf-format-18-mbyte-.jpg)
