Embed Size (px)
Citation preview

Schroder UK Real Estate FundAnnual Report and Consolidated Financial Statements For the year ended 31 March 2018
Schroder UK
Real Estate Fund Annual Report and C
onsolidated Financial Statements for the year ended 31 M
arch 2018
For professional advisers and employee benefits consultants only.
C M Y K : 208 P P I

Overview
About us
The Schroder UK Real Estate Fund (‘SREF’ or ‘the Fund’), is an award-winning fund which was launched in 1971. It provides investors with diversified exposure to £2.5 billion of UK commercial real estate and is managed by our highly experienced team.
Fund summarySREF is an open-ended investment company which is a Property Authorised Investment Fund (‘PAIF’) and is authorised by the Financial Conduct Authority. The Fund is a Qualified Investor Scheme (‘QIS’) open to eligible investors. The Fund is an Alternative Investment Fund for the purposes of the Alternative Investment Fund Managers Directive (‘AIFMD’).
Since the conversion of the Fund to a PAIF in 2012, the investor base has become increasingly diversified across institutional types and geographies. From 2015, the Fund has held an international marketing passport to 12 European countries: Belgium, Denmark, Finland, France, Germany, Ireland, Italy, the Netherlands, Norway, Spain, Sweden and Switzerland. This supports interest and investment from international institutions and enhances Fund liquidity.
The Fund is available to a broad range of domestic and international professional investors seeking to benefit from Schroders’ real estate expertise.
Overview*1 Highlights4 Portfolio Overview
Strategic Report*6 Fund Manager’s Statement8 Investment Approach10 Our Strategic Objectives12 Market Overview14 Portfolio Performance16 Strategy in Action24 Portfolio Statement27 Purchases and Sales30 Sustainable Investment
Governance34 Report of the Authorised
Corporate Director and Statement of Responsibilities*
35 AIFMD Remuneration Disclosures
36 Investment Manager’s Statement of Responsibility
37 Independent Property Valuers’ Report
38 Depositary’s Report and Statement of Responsibilities
Financial Statements39 Independent Auditors’
Report41 Statements of Total Return41 Statements of Changes
in Net Assets Attributable to Shareholders
42 Balance Sheets43 Cash Flow Statements44 Notes to the Financial
Statements54 Distribution Table56 Unaudited Environmental
Data Report64 Unaudited General
Information70 Key Service Providers71 Fund Structure
Contents
* Collectively these comprise the Authorised Corporate Director’s Report.
C H E C K CO N T E N T S L I S T

1 Schroder UK Real Estate Fund Annual Report and Consolidated Financial Statements for the year ended 31 March 2018
OverviewStrategic ReportGovernanceFinancial Statements
Highlights
1 AREF/IPD UK Quarterly Property Fund Index – All Balanced Fund Index Weighted Average.
SREF seeks to provide investors with a blend of income and capital growth through investment in UK real estate. Its aim is to return 0.5% per annum (net of fees) above its benchmark1 over rolling three-year periods.
In April 2018, SREF received MSCI’s ‘UK Property Investment Award for best performing unlisted pooled balanced funds, for funds with a capital value of more than £1.5 billion in the UK market’. Performance was measured over a three-year period to December 2017. SREF has also outperformed its benchmark over five and ten years.
Total return of
10.9%
Average unexpired lease term
9.1 years
One-year outperformance relative to benchmark**
+0.9%Three-year outperformance relative to benchmark**
+1.4%p.a.
Portfolio valued at
£2.5bn
Number of assets in portfolio
64Number of tenants
744Gross distribution yield
3.2%
Award-winning fund
Compliant with AREF Code of Practice
Global Real Estate Sustainability Benchmark
Award-winning fund performance*
All data correct as 31 March 2018.
* MSCI 2018 Property Investment Award for best performing unlisted pooled balanced funds, with a capital value of greater than £1.5bn in the UK market.
** AREF/IPD UK Quarterly Property Fund Index – All Balanced Fund Index Weighted Average.

2 Schroder UK Real Estate FundAnnual Report and Consolidated Financial Statements for the year ended 31 March 2018
Overview
%
12
10
8
6
4
2
0BenchmarkSREF
%
12
10
8
6
4
2
0BenchmarkSREF
%
12
10
8
6
4
2
0BenchmarkSREF
%
12
10
8
6
4
2
0BenchmarkSREF
96%
3.2%
9.1years
7.5%
Highlights
PerformanceStrategic
Allocation to UK Winning Cities
(2017: 95%)
3 years
9.5% p.a.
(2017: 11.8% p.a.)
Portfolio total return 1 year
10.9%(2017: 6.3%)
5 years
11.9% p.a.
(2017: 10.0% p.a.)
10 years
4.7% p.a.
(2017: 2.1% p.a.)
Contracted rental income growth
(2017: 0.6%)(2017: 3.2%)
Gross distribution yield*
(2017: 8.9 years)
Weighted average unexpired lease length
* Distributions paid in 12 months to 31 March 2018 as a percentage of 31 March 2018 NAV. Note: All above charts show SREF performance vs. benchmark (AREF/IPD UK Quarterly Property Fund Index – All Balanced Fund Index Weighted Average).
C M Y K : 254 P P I

3 Schroder UK Real Estate Fund Annual Report and Consolidated Financial Statements for the year ended 31 March 2018
OverviewStrategic ReportGovernanceFinancial Statements
Bracknell Town Centre 6.4%Building 1, Ruskin Square, Croydon 6.3%King’s Mall, Hammersmith, W6 4.0%Matrix, Park Royal, London NW10 3.3%One Lyric, Hammersmith, W6 3.3%Acorn Industrial Estate, Crayford 3.3%City Tower, Manchester 3.3%Hartlebury Trading Estate, Worcs 2.8%Electra Industrial Estate, London E16 2.8%Battersea Studios, London SW8 2.6%54 other holdings 61.9%
The Secretary of State 8.3% Tata Steel 3.0% The Office Group* 2.8%Lloyds TSB Bank 2.5%Kaplan Estates 2.3%Care UK 2.0%Stay City 1.7%University of Law 1.6%B&Q Plc 1.6%Universal Music 1.6%734 other tenants 72.6%
Portfolio
Asset concentration (%) Tenant concentration (%)
* Agreement for lease.

4 Schroder UK Real Estate FundAnnual Report and Consolidated Financial Statements for the year ended 31 March 2018
Overview
Weighting (%)Sector weightings by value SREF Benchmark
Retail Standard retail – South East 6.7 7.4
Standard retail – Rest of UK 4.1 4.5
Shopping centres 4.7 3.0
Retail warehouses 7.9 15.8
Office Offices – Central London 11.0 13.0
Offices – South East 23.1* 10.4
Offices – Rest of UK 4.6 5.5
Industrial Industrial – South East 15.9 17.0
Industrial – Rest of UK 4.6 8.9
Other Other 11.8 8.9
Cash 5.7 5.4
* Includes Rest of London (16.3%) and Rest of South East Offices (6.8%).
Portfolio Overview
Diversified high-quality UK real estate fundSREF owns a diversified portfolio of commercial real estate across the UK. The Fund invests across retail, office and industrial sectors and increasingly in other sectors where structural demand is distinct from wider economic growth.
SectorsRetail
Industrial
Offices
Other
The Fund is underweight to the retail sector. The retail assets in the portfolio are split between well-managed convenience retail such as King’s Mall, Hammersmith and good quality retail such as Bracknell. The rents in our retail assets are affordable and therefore attractive to retailers.
SREF owns a number of large multi-let industrial estates around London which are positively impacted by structural trends and where there are significant asset management opportunities to capture rental growth. The Fund also owns two large industrial estates in the West Midlands.
The Fund is overweight to offices compared with its MSCI benchmark. The focus is on buildings with good fundamentals in Winning Cities – that attract a diverse occupier base. SREF has exposure to offices in emerging London sub-markets where rents are affordable for occupiers, and in regional cities.
Other sectors include residential, hotels, self-storage, healthcare and leisure properties. SREF has a growing portfolio of assets which often benefit from long leases and structural drivers of return which are independent of the wider economy.
C M Y K : 250 0 P P I
C M Y K : 2308 P P I
C M Y K : 2435 P P I
C M Y K : 1815 P P I
I M AG E I S A M O N TAG E W I T H G H O S T I N G

5 Schroder UK Real Estate Fund Annual Report and Consolidated Financial Statements for the year ended 31 March 2018
OverviewStrategic ReportGovernanceFinancial Statements
London
Edinburgh
Bristol
Cardiff
Newcastle
Glasgow
LeedsManchester
Birmingham
Retail Offices Industrials Other
10 Battersea Studios, London SW8 Office
1 Bracknell Town Centre Retail and Office
2 Building 1, Ruskin Square, Croydon Office
3 King’s Mall, Hammersmith, W6* Shopping Centre
4 Matrix, Park Royal, London NW10 Industrial
5 One Lyric, Hammersmith, W6* Office
6 Acorn Industrial Estate, Crayford Industrial
7 City Tower, Manchester Office
8 Hartlebury Trading Estate, Worcs Industrial
9 Electra Industrial Estate, London E16 Industrial
Property Sector NAV %
6.4
6.3
4.0
3.3
3.3
3.3
3.3
2.8
2.8
2.6
10 Universal Music
1 The Secretary of State
2 Tata Steel
3 The Office Group**
4 Lloyds TSB Bank
5 Kaplan Estates
6 Care UK
7 Stay City
8 University of Law
9 B&Q Plc
Tenants % contracted portfolio income
8.3
3.0
2.8
2.5
2.3
2.0
1.7
1.6
1.6
1.6
Note: Map shows the location of assets owned directly and via collective investment schemes.
Top ten properties
Top ten tenants
Assets
64Tenants
744
Fund gross asset value
£2,520.6mFund net asset value
£2,515.2m
* Ignores intercompany loan within holding company.** Agreement for lease.

6 Schroder UK Real Estate FundAnnual Report and Consolidated Financial Statements for the year ended 31 March 2018
Strategic Report
Fund Manager’s Statement
Well positioned to outperformSince 1971, SREF has enabled institutions to gain exposure to good-quality UK commercial real estate which provides a balance of income, income growth and capital appreciation through the real estate cycle.
James LassFund Manager
Jessica BerneyDeputy Fund Manager
C M Y K : 373 P P I
7 Schroder UK Real Estate Fund Annual Report and Consolidated Financial Statements for the year ended 31 March 2018
OverviewStrategic ReportGovernanceFinancial Statements
SREF produced another strong performance for the year to 31 March 2018. This marks an eight-year record of outperforming its benchmark and investment objective. We were delighted to receive MSCI’s UK Property Investment Award for best performing unlisted pooled balanced funds in its category, but we remain focused on continuing to achieve our performance objectives through a disciplined investment approach.
Strategy SREF owns a diversified portfolio of good-quality UK commercial properties which provide a balance of sustainable and growing income with the potential for capital appreciation. Our annual fund strategy statement, which defines our activities over the coming 3–5 years, identifies key objectives at both a fund and an asset level which are forecast to deliver incremental outperformance year on year.
Our annual fund strategy statement identifies key objectives at both a fund and an asset level which are forecast to deliver incremental outperformance year on year.
Our starting point is to have a high proportion of the portfolio invested in Winning Cities across the UK which have above average economic growth rates. These centres have a number of common characteristics such as diverse economies, good and improving infrastructure and high levels of job creation. They are also likely to offer good cultural amenities and to be places where people want to live and work.
Using the insights of our dedicated research team, the portfolio is tilted towards those sectors and assets where total returns are likely to be driven more by technological, demographic or structural change than purely by economic growth. Properties benefiting from these factors are likely to have enduring occupier appeal and to provide reliable and resilient rental income streams which form the basis of strong long-term returns.
In a period of lower expected returns, we believe it will be particularly important to add value through continuing our active management approach. SREF’s portfolio includes a number of properties into which we can invest capital to meet occupier needs and thereby generate new and growing income streams.
Portfolio activityOver the past 12 months, one acquisition has been completed, a portfolio of five purpose-built self-storage facilities in areas of high residential density around London and the M25, known as The Self-Storage Company. We see clear demand in the sector fuelled by demographic and social trends complemented by the restriction in the delivery of new supply. Having acquired the intellectual property rights associated with the brand, including an easy-to-use technology platform, the acquisition allows for further expansion. Five smaller properties were sold during the year at above valuation where we had completed our business plan or where the assets were regarded as not being central to the Fund’s strategy.
SREF remains heavily underweight its peer group in the ownership of retail property. Where the Fund does hold retail, the assets are relevant and fit for purpose for the modern retailing landscape. At the forefront of this is Bracknell, where a major phase of development completed with the opening of the Lexicon, Bracknell town centre in September 2017. Most occupiers report store turnover is well above budget since the centre opened. Importantly, the affordability of its retail space relative to neighbouring centres underpins retailers’ profitability and the potential for rental growth. We have also invested in King’s Mall at King’s Quarter, Hammersmith, W6, including the provision of a new food court and lifestyle fitness operator. This has transformed the centre into a vibrant and appealing micro-environment that provides aspirational convenience for the local population.
Further investment at King’s Quarter saw the wholesale refurbishment and extension of the One Lyric office building. Following the year end, but prior to practical completion in June 2018, the offices were fully let for a term of 20 years.
These examples perfectly illustrate the execution of our business planning process which we believe will continue to drive SREF’s performance relative to its benchmark. Further case studies can be found on pages 16–23.
Team changeWith effect from 1 September 2018 Jessica Berney will replace James Lass as the Lead Fund Manager of SREF. Jessica has been Deputy Fund Manager since 2016 during which time she has developed a detailed understanding of the fund strategy, the portfolio and our investors. Jessica is a Chartered Surveyor with 13 years’ experience of managing diversified UK portfolios and, prior to becoming Deputy Fund Manager for SREF, was also responsible for overseeing the management of Schroders’ UK retail portfolio. This includes responsibility for managing key SREF assets such as Bracknell and Hammersmith.
James Lass has been Lead Fund Manager of SREF for five years and has made a significant positive contribution to the management of the Fund. James has supported Jessica in her role as Deputy Fund Manager over the last two years and will continue to support her through the transition process along with the Real Estate Investment Committee which will remain unchanged. James will move in 2019 to focus on a specialist value-add role. Jessica also has the continued support from the SREF team and wider business including specialist real estate, accounting and product expertise.
OutlookIn a more uncertain economic environment, SREF’s portfolio of properties, which are let on affordable rents, offer both growth and defensive characteristics. We therefore believe that SREF is well positioned to outperform its benchmark in the period ahead.
At an investor level we are heartened by the interest seen from international investors for SREF’s style of investment. We regard the further diversification of SREF’s already diverse investor base as being a benefit to existing investors, by providing additional liquidity and asset diversification, while providing SREF with a more stable capital base.
James LassFund Manager
Jessica BerneyDeputy Fund ManagerSchroder Real Estate Investment Management Limited
June 2018

8 Schroder UK Real Estate FundAnnual Report and Consolidated Financial Statements for the year ended 31 March 2018
Strategic Report
W E
Investment Approach
A disciplined approach to investmentSchroder UK Real Estate Fund aims to provide shareholders with an attractive level of income with potential for income and capital growth from owning a diversified portfolio focused on higher growth assets benefiting from structural change. The portfolio is managed in accordance with an investment philosophy centred on consistent principles which are to invest in strong asset fundamentals and active real estate management.
Mega themes
1 2 4 53
40 global cities by 2025 with 10 million+ populations. The focus on Winning Cities with faster growth in jobs and locations where people wish to live and work.
We are living longer and moving closer to cities. The focus is on real estate which attracts multiple types of uses and benefits from structural changes e.g. hotels, care homes, office and retail.
The locations which attract the TMT sector and demand for e-commerce will capture high growth.
The shift of economic growth from West to East is changing demand. The focus is on locations that attract businesses which benefit from increasing demand from the East, such as luxury goods and education.
Global demand for power and infrastructure is increasing. Locations with better infrastructure and resources/power will thrive.
Rapid urbanisation
Demographics Technology Resources and infrastructure
Shift West to East
Long-term performance of real estate assets will be driven by structural changes or ‘mega themes’ arising from demographic, technological, environmental and other factors that are outside of the normal real estate market cycle.

9 Schroder UK Real Estate Fund Annual Report and Consolidated Financial Statements for the year ended 31 March 2018
OverviewStrategic ReportGovernanceFinancial Statements
Differentiated economyGlobally facing, financial services and TMT hubs, value-add manufacturing
Infrastructure improvementsTransport, distribution, energy, technology
Employment growthHigh-value new jobs, wealth effect, population growth
EnvironmentLive and work, tourism and amenities, universities, cathedral cities, dominant retail and leisure
Winning Cities
1 2 3 4
Sustainable investmentSustainability and environmental, social governance (‘ESG’) considerations are integral to good investment management and should generate better long-term returns, contribute to our tenants’ business performance and create tangible benefits for the communities where we are invested. SREF’s work in this area was recognised by a Green Star award for ESG performance by GRESB in 2017.
Business plan-led approachEvery asset is managed to a detailed business plan that is the focal point for identifying and implementing active management strategies that will maximise returns.
High-quality research Research is focused on cyclical and structural trends in order to determine market strategy and exploit mispricing. In addition, to better understand real estate fundamentals, our research focuses on occupational demand at a town and city level and other factors such as construction starts, infrastructure investment and pricing relative to other assets.
Winning Cities
Demand is increasingly concentrated in Winning Cities, offering a competitive advantage in terms of higher levels of GDP, employment and population growth; differentiated local economies with higher value industries; well-developed infrastructure; and places where people want to live and work. Winning Cities will change over time and investments will be made in other locations where we see above-average rates of future growth that could lead to mispricing opportunities.
Investment approach

expe
riencing higher levels
populatio
n growth
of G
DP, employment and
Expo
sure
to W
inning Cities
Increasing exposure to
strong fundamentals
assets and sectors with
defensive qualitie
s
Managing portfolio
risk
in
order to enhance th
e port
folio
’sasset management
Increasing net income
through transactions and
Strategic priorities
10 Schroder UK Real Estate FundAnnual Report and Consolidated Financial Statements for the year ended 31 March 2018
Strategic Report
Our Strategic Objectives
Focusing on ourkey objectives
96% of the Fund’s assets are located in higher growth regions. The strategy will continue to focus on Winning Cities and Regions which offer a competitive advantage in terms of higher levels of GDP, employment and population growth; differentiated local economies with higher value industries; well-developed infrastructure; and places where people want to live and work.
Our acquisition strategy is focused on investing primarily in Winning Cities and Regions and sectors/assets where the structural drivers are independent of the wider economy. Disciplined execution of asset management initiatives drive net income growth and distribution yield while maintaining the portfolio’s defensive qualities.

1
3
2
4
11 Schroder UK Real Estate Fund Annual Report and Consolidated Financial Statements for the year ended 31 March 2018
OverviewStrategic ReportGovernanceFinancial Statements
Our focus on fundamentals is essential at this stage in the cycle. Post-completion of asset business plans, the Fund Manager will seek to dispose of assets that are expected to underperform and to reinvest in assets with stronger fundamentals.
The Fund has a diversified tenancy base of over 740 occupiers and a weighted average unexpired lease term of 9.1 years. Our priority is to continue to reduce the vacancy rate, improve covenants and maintain an above-benchmark average lease length through new lettings and lease regears.
Continue to grow net operating income of the Fund through intensive portfolio management based on a disciplined business plan-led approach.
Continue to invest in the portfolio to achieve above-benchmark returns while minimising transaction costs.
Maintain a high-quality portfolio which has a resilient income profile through the economic cycle.
Complete selected acquisitions which are accretive to the Fund’s income profile and which meet target return objectives.
Delivery of our strategy is intended to increase net income in the near term. The key strategic steps are:

12
Strategic Report
Schroder UK Real Estate FundAnnual Report and Consolidated Financial Statements for the year ended 31 March 2018
The UK economy is expected to deliver modest growth through to 2019. The low rate of unemployment and the possibility of wage inflation are likely to lead to tighter monetary policy. All asset classes are exposed to rising rates, but the large gap between real estate yields and gilts means that we believe they are unlikely to rise in parallel. Structural trends such as rapid urbanisation, technological innovation and demographics are likely to drive the continued divergence of real estate returns, with some locations capturing strong growth and some disproportionately suffering economic weakness.
Market Overview
Structural trends likely to drive real estate returns
Rapid urbanisation, technological innovation and demographics are likely to drive the continued divergence of real estate returns.

13
OverviewStrategic ReportGovernanceFinancial Statements
Schroder UK Real Estate Fund Annual Report and Consolidated Financial Statements for the year ended 31 March 2018
We see potential in new concepts such as serviced apartments and retirement villages and there is buoyant demand for data centres.
RetailRetailers’ profits are being reduced by a combination of higher import prices, the increase in the national minimum wage and intense competition from online sales. A number of retailers, as well as food and beverage operators, fell into administration in the first quarter of 2018. We also saw some businesses deliberately enter into voluntary administrations (Company Voluntary Arrangements) in order to reduce their cost of rent and the number of stores from which they trade. Secondary retail locations continue to be most exposed to this type of activity, while prime and those properties which offer a mix of retail and leisure experiences and convenience stores remain more resilient.
IndustrialIndustrial assets are the beneficiaries of these key structural themes as the changes increase demand for warehousing. Large logistics warehousing is experiencing strong rental growth and vacancy is low. While developers have begun to build more, the high cost of bank debt for speculative development means that 75% of schemes are pre-let before construction begins. This compares with only 40% of logistics schemes previously being pre-let in 2007. We remain attracted to the sector, particularly multi-let industrial estates which cater for ‘last mile delivery’. Rents are growing strongly in this sector and the returns are currently the highest across the UK real estate market.
OfficesThe office sector is similarly polarised with differing returns from alternative parts of the markets. City of London offices have seen a bigger decline in prime office rents over the last two years than the West End of London. However, prime offices in some micro-locations such as Shoreditch, Bloomsbury, Hammersmith, Stratford and the South Bank still have good interest from occupiers, which is underpinning rental levels. We expect that the City, where the Fund has very limited exposure, will continue to be the weakest sub-market over the next couple of years due to the growing amount of vacant space and the potentially negative impact of Brexit on financial services. The West End should be more resilient due to a wider range of occupiers and limited supply with very few new office buildings. Locations from Hayes in the West through Bloomsbury and Farringdon to Stratford in the East will gain from the start of Crossrail services in December 2018.
OtherIn addition to the three main commercial sectors, there are a number of other niche sub-sectors which should provide diversification. The self-storage market is starting to mature, as consumer awareness grows and both occupancy and rental rates increased in 2017, according to the UK Self Storage Association. We also see potential in new concepts such as serviced apartments and retirement villages and there is buoyant demand for data centres, driven by the rapid growth in cloud computing. By contrast, we are cautious of the private rented housing sector, given net yields below 4% and student accommodation, where there is a risk of over-supply in several towns and cities.
C M Y K : 29 0 P P I

14 Schroder UK Real Estate FundAnnual Report and Consolidated Financial Statements for the year ended 31 March 2018
Strategic Report
Components of return Attribution of relative return
Portfolio returnsFund 12.4Benchmark 11.2Relative 1.0
Property1.4
Structure(0.4)
Capital growthFund 7.8Benchmark 6.2Relative 1.5
Income returnFund 4.3Benchmark 4.8Relative (0.5)
Rental growthFund 2.9Benchmark 2.2Relative 0.6
Yield impactFund 7.5Benchmark 5.2Relative 2.1
Income residualFund (2.2)Benchmark (1.2)Relative (1.0)
Portfolio Performance
Performance analysis
Sources of relative return – 12 months to 31 March 2018 (%)The principal drivers and detractors of performance have been independently calculated by MSCI. Please note that ‘Fund’ refers to property level returns.
Total return for the portfolio and benchmark is calculated as the change in capital value, less any capital expenditure incurred, plus net income, expressed as a percentage of capital employed over the period concerned. Performance is calculated gross of fund fees. Multi-period capital growth and income return may not sum perfectly to total return due to the cross product that occurs when capital and income returns are combined within compounded total returns.

15 Schroder UK Real Estate Fund Annual Report and Consolidated Financial Statements for the year ended 31 March 2018
OverviewStrategic ReportGovernanceFinancial Statements
Weighted contribution to relative return (%)
Standard Retail – South East
Standard Retail – Rest of UK
Shopping Centres
Retail Warehouses
Offices – City
Offices – West End
Offices – Inner London & South East
Offices – Rest of UK
Industrial – South East
Industrial – Rest of UK
Other Commercial
All segments
Property Structure
Negative contribution Positive contribution
-0.6 -0.3 0.0 0.3 0.6 0.9 1.2 1.5
Performance attribution over past yearIncomeOver the past year SREF generated less income than the benchmark owing to the quality of the portfolio and to a number of capital investment projects such as at Bracknell and Hammersmith. The completion of the first phase of Bracknell in September 2017 provided additional portfolio income from September and this will increase as rent-free periods expire and new lettings are completed. The completion of the office development at Hammersmith, W6 will also increase portfolio income following SREF’s financial year end. Our strategy is to target an income return in line or above benchmark.
Property-level total return % relative to benchmark
SREF total return p.a. (%) MSCI Index total return p.a. (%) Relative p.a. (%)Period 12 months 3 years 5 years 12 months 3 years 5 years 12 months 3 years 5 years
Retail 10.6 6.9 7.5 6.7 5.4 7.6 3.7 1.5 (0.0)
Offices 8.3 11.3 15.6 8.0 8.4 13.0 0.3 2.6 2.2
Industrial 23.1 16.7 18.2 21.4 15.4 16.7 1.3 1.2 1.2
Other 12.9 12.0 13.9 12.4 10.9 11.5 0.5 1.0 2.1
Total 12.4 11.3 13.7 11.2 9.2 11.6 1.0 2.0 1.8
Total return for the portfolio and benchmark is calculated as the change in capital value, less any capital expenditure incurred, plus net income, expressed as a percentage of capital employed over the period concerned. Performance is calculated gross of fund fees. Multi-period capital growth and income return may not sum perfectly to total return due to the cross product that occurs when capital and income returns are combined within compounded total returns.
Attribution by property and structure: One year to 31 March 2018
Rental growthSREF has generated higher rental growth than its benchmark over the past 12 months. Rents across the portfolio are generally low and therefore affordable for tenants. Our preference for multi-let properties allows us to capture rental growth at lease expiry or at rent review. Strong rental growth was achieved at Electra Industrial Estate, E16 and Battersea Studios, W8.
Yield impactThe portfolio has benefited from greater yield improvement than the benchmark. SREF’s active management approach has enabled the
Fund to capture yield improvements as capital projects are completed, such as at Bracknell, and where leases have been regeared, such as at Palace House, SE1 and Jubilee House, E15.
Income residualIncome residual is the change in capital value that is not attributable to either rental growth or yield impact. This is normally due to unanticipated changes in income (from new lettings or vacancies), abnormal lease terms or over-renting that may distort the impact of changes in market rental values.

Strategic Report
16 Schroder UK Real Estate FundAnnual Report and Consolidated Financial Statements for the year ended 31 March 2018

17 Schroder UK Real Estate Fund Annual Report and Consolidated Financial Statements for the year ended 31 March 2018
OverviewStrategic ReportGovernanceFinancial Statements
Strategy in Action
Croydon
Resilient income and growth opportunity
Ruskin Square is a nine-acre mixed-use scheme adjacent to East Croydon railway station. The site benefits from outline planning permission for two million sq ft of offices in five buildings and four residential blocks.
Contracted rental income
£6.2m% NAV Average lease length
SREF has owned Ruskin Square, Croydon for over 15 years. As long-term holders of this important gateway site, we are committed to creating a vibrant mixed-use environment where people want to live, work and spend their leisure time.
The first 181,000 sq ft office building was pre-let during construction to HM Revenue & Customs on a 25-year lease from November 2016. The UK Government is
SREF’s largest tenant. The second phase office building comprises 200,000 sq ft and has detailed planning consent. Further phases of development will only be started subject to a significant pre-let.
The first residential building of 161 units completed in 2016 in partnership with Places for People and 97% of the units have been sold. Further phases of residential development will be brought forward with
a focus on the private rented sector, which we feel is complementary to the ownership in its entirety.
In 2016 SREF opened BOXPARK, the food, beverage and events destination, on the final office development site. This popular venue promotes place making and has become an important part of Croydon’s community identity.
6.3% 23years
C M Y K : 271 P P I

Schroder UK Real Estate FundAnnual Report and Consolidated Financial Statements for the year ended 31 March 2018
18
Strategic Report
Strategy in Action
Bracknell
Creating places where people want to live and work
SREF owns a half share of the freehold of the 40-acre town centre at Bracknell. This comprises the newly opened 580,000 sq ft Lexicon shopping centre, further retail space including Waitrose and Sainsbury’s supermarkets, four office buildings totalling 200,000 sq ft and residential.
The Lexicon successfully opened in September 2017 and is anchored by Fenwicks (its first new store in 15 years), M&S, a 14-screen 4DX Cineworld Cinema and Primark. At March 2018, the scheme was 87% pre-let by floor area, rising to 92% including lettings in solicitors’ hands.
The majority of retailers are trading ahead of expectations and footfall is anticipated to reach 16 million per annum. The Lexicon moves Bracknell from the 243rd to 33rd best retailing destination within the UK, according to Colliers.
The town centre’s appearance and desirability are now in line with Bracknell’s affluent catchment. The Lexicon’s success in creating an environment where people want to live and work will now act as a catalyst for future performance. Plans are under consideration for a leisure extension to the Lexicon and for refurbishment and reletting of the offices.
Contracted rental income
£6.2m% NAV Number of tenants
6.4% 142

Schroder UK Real Estate Fund Annual Report and Consolidated Financial Statements for the year ended 31 March 2018
19
OverviewStrategic ReportGovernanceFinancial Statements
C M Y K : 343 P P I

Schroder UK Real Estate FundAnnual Report and Consolidated Financial Statements for the year ended 31 March 2018
20
Strategic Report
21
OverviewStrategic ReportGovernanceFinancial Statements
Schroder UK Real Estate Fund Annual Report and Consolidated Financial Statements for the year ended 31 March 2018
Strategy in Action
Hartlebury Trading Estate
Digitalisation underpins demand for industrials
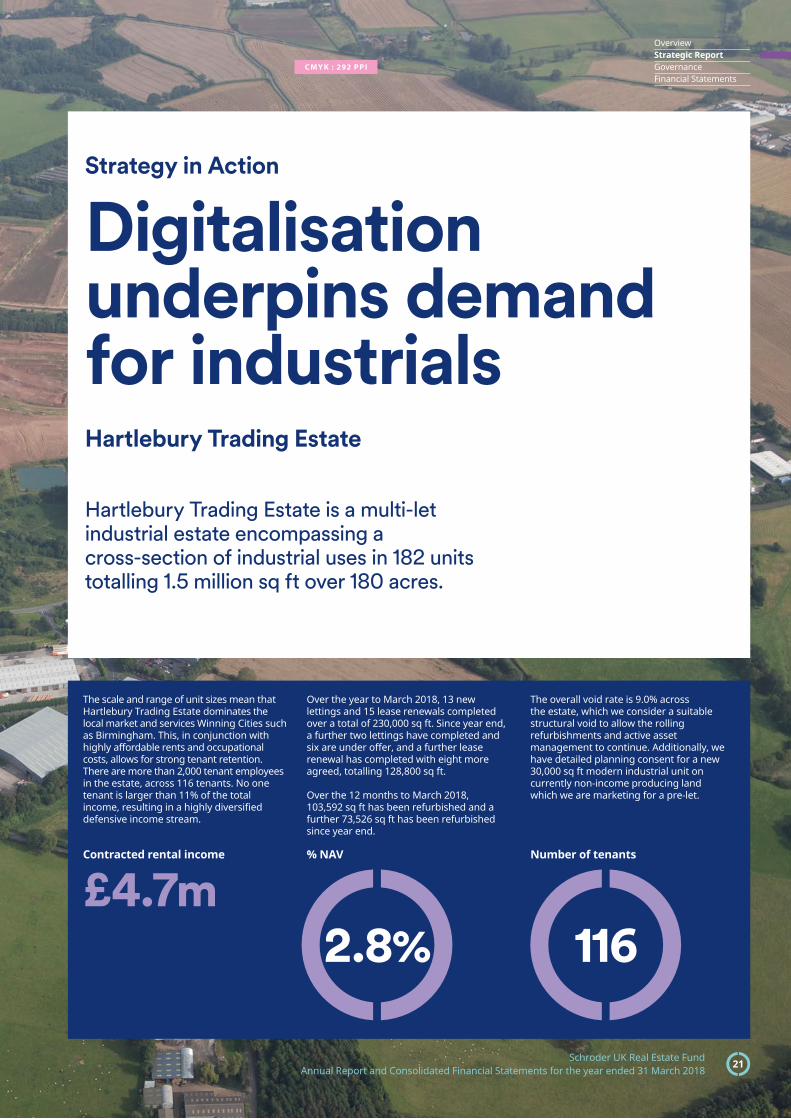
Hartlebury Trading Estate is a multi-let industrial estate encompassing a cross-section of industrial uses in 182 units totalling 1.5 million sq ft over 180 acres.
The scale and range of unit sizes mean that Hartlebury Trading Estate dominates the local market and services Winning Cities such as Birmingham. This, in conjunction with highly affordable rents and occupational costs, allows for strong tenant retention. There are more than 2,000 tenant employees in the estate, across 116 tenants. No one tenant is larger than 11% of the total income, resulting in a highly diversified defensive income stream.
Over the year to March 2018, 13 new lettings and 15 lease renewals completed over a total of 230,000 sq ft. Since year end, a further two lettings have completed and six are under offer, and a further lease renewal has completed with eight more agreed, totalling 128,800 sq ft.
Over the 12 months to March 2018, 103,592 sq ft has been refurbished and a further 73,526 sq ft has been refurbished since year end.
The overall void rate is 9.0% across the estate, which we consider a suitable structural void to allow the rolling refurbishments and active asset management to continue. Additionally, we have detailed planning consent for a new 30,000 sq ft modern industrial unit on currently non-income producing land which we are marketing for a pre-let.
Contracted rental income
£4.7m% NAV Number of tenants
2.8% 116
C M Y K : 292 P P I

Schroder UK Real Estate FundAnnual Report and Consolidated Financial Statements for the year ended 31 March 2018
Strategic Report
22
Strategy in Action
Manchester
Investing in Winning Cities
Our overall strategy is to improve the office accommodation to take advantage of healthy levels of occupational demand and reposition the retail and leisure offer.
Over the past year, 14 rent reviews were completed, generating a combined rental uplift of 23% (SREF’s share: £167,000 p.a.).
In addition, six office lettings and two retail lettings were completed, generating new income to SREF of £356,000. The retail offer has been repositioned with a new letting exchanged with Lidl on a long lease with inflation-linked uplifts which will generate an additional £22,500 p.a. to SREF over the prior lease.
A phased capital expenditure programme of the building is currently underway which will see SREF commit £2.25 million over the coming year. This will be used to refurbish vacant space prior to letting and to improve the tenant experience by enhancing the building’s facilities.
City Tower is a landmark 615,429 sq ft office, retail, leisure and hotel investment on a three-acre island site in Manchester city centre. City Tower is owned 50% by SREF in a joint venture with two other Schroder-managed funds.
Contracted rental income
£4.8m% NAV Number of tenants
3.3% 64

Schroder UK Real Estate Fund Annual Report and Consolidated Financial Statements for the year ended 31 March 2018
23
OverviewStrategic ReportGovernanceFinancial Statements
C M Y K : 24 6 P P I

24 Schroder UK Real Estate FundAnnual Report and Consolidated Financial Statements for the year ended 31 March 2018
Strategic Report
£m
1,000
800
600
400
200
020172018
Market value at 31 March
78.7 80.0
£m
1,000
800
600
400
200
020172018
Market value at 31 March
289.9243.4
%
50
40
30
20
10
020172018
% net asset value
3.3 3.4
%
50
40
30
20
10
020172018
% net asset value
12.510.2
Portfolio Statement
Direct properties total market value up to £10m
Lowestoft – Roman Hill Chatham – Maritime
Direct properties total market value from £10m–£25m
Sector
Crayford – Crayford Industrial Park Industrial
Croydon – Ruskin Square Other – Residential
Framlingham – Mills Meadow Other – Care Homes
Mildenhall – Great Heath Other – Care Homes
Haverhill – Chalkstone Other – Care Homes
Ipswich – Asterbury Place Other – Care Homes
Livingston – Limefields, second land site Industrial
London UB6 – Greenford, land site Industrial
Loughton – 195–200 High Road Standard Retail
Lowestoft – Roman Hill Other – Care Homes
Shipley – 20–40 Market Square Standard Retail
Southsea – 2–42 Palmerston Road Standard Retail
Sector
Bristol – Maggs House Standard Retail
Croydon – Car Park Other – Car Park
Slough – Capital Point, 33 Bath Road Offices
Loughton – 202–226 High Road Standard Retail
Bracknell – Bracknell Beeches Offices
London WC2 – 53 Parker Street Offices
Dunstable – Chiltern Park Industrial
Chatham – Maritime Other – Leisure
Croydon – Sites 2–4 (Residential), Ruskin Square Other – Residential
Chelmsford – Meadows Retail Park Retail Warehouse
Spalding – Retail Parks Retail Warehouse
Dunstable – Arenson Centre Industrial
Glenthorne Road, W6 – Car Park Other – Car Park
London EC2 – 11/12 Appold Street Offices
C M Y K : 16 0 0 P P IC M Y K : 342 P P I

25 Schroder UK Real Estate Fund Annual Report and Consolidated Financial Statements for the year ended 31 March 2018
OverviewStrategic ReportGovernanceFinancial Statements
£m
1,000
800
600
400
200
020172018
Market value at 31 March
566.5635.0
£m
1,000
800
600
400
200
020172018
Market value at 31 March
829.0
997.4
%
50
40
30
20
10
020172018
% net asset value
35.742.0
%
50
40
30
20
10
020172018
% net asset value
24.426.7
Sector
London UB6 – Greenford Industrial
Colchester – Turner Rise Retail Warehouse
Colchester – Hythe Riverside Park Retail Warehouse
London E15 – Jubilee House Offices
Croydon – Sites 2–5 (Commercial), Ruskin Square Offices
Cardiff – St William House Office
Norwich – Hall Road Retail Park Retail Warehouse
StayCity – Serviced Apartments Other – Hotel
London EC1 – 4–7 Chiswell Street Offices
London E1 – Mile End Road Offices
Croydon – AMP House Offices
Hackbridge – Felnex Trading Estate Industrial
Wolverhampton – Steel Park Industrial
Truro – Lemon Quay Standard Retail
Woking – Woking Business Park Industrial
Self-Storage portfolio Other – Self-Storage
London SE1 – Palace House Offices
Sector
London N1 – Shepherdess Walk Offices
London W1 – Chenies Street Offices
Reading – Davidson House Offices
Cardiff – Mermaid Quay Other – Leisure
London W14 – Kensington Village Offices
London SW8 – Battersea Offices
London E16 – Electra, Canning Town Industrial
Hartlebury Trading Estate Industrial
Crayford – Acorn Industrial Estate Industrial
London W6 – One Lyric Offices
London NW10 – Matrix, Park Royal Industrial
London W6 – King’s Mall Shopping Centre
Croydon – Building 1, Ruskin Square Offices
Direct properties total market value from £25m–£50m
Direct properties total market value greater than £50m
StayCity – Serviced Apartments London E16 – Electra, Canning Town
C M Y K : 120 0 P P I C M Y K : 1055 P P I

26 Schroder UK Real Estate FundAnnual Report and Consolidated Financial Statements for the year ended 31 March 2018
Strategic Report
£m
2,500
2,000
1,500
1,000
500
020172018
Total direct properties
1,9541,765
Wholly owned properties
Joint ventures
Collective investment schemes
Net assets 31 March 2018
1.0%
82.2%16.8%
£m
2,500
2,000
1,500
1,000
500
020172018
Portfolio of investments
2,1362,377
£m
500
400
300
200
100
020172018
Market value at 31 March
355.3399.8
%
50
40
30
20
10
020172018
% net asset value
16.8 15.3
Portfolio Statement continued
Joint ventures
Summary
Sector
City Tower Unit Trust Offices
Bracknell Property Unit Trust Retail and Offices
West India Quay Unit Trust Other – Leisure
Motor Retail LP Standard Retail
Gilbran Property Unit Trust Standard Retail
Store Unit Trust Offices
York – Monks Cross Retail Warehouse
Collective investment schemesSector
City of London Office Unit Trust (CLOUT) Offices
Henderson UK Retail Warehouse Fund (HRWF) Retail Warehouse
Percentage of contracted rent expiring
SREF Benchmark
Up to five years 45.4 51.6
Five to ten years 27.6 26.3
Ten–15 years 7.7 10.4
15–20 years 3.0 4.8
Over 20 years 15.8 6.1
Note: Net assets exclude cash and other assets

27 Schroder UK Real Estate Fund Annual Report and Consolidated Financial Statements for the year ended 31 March 2018
OverviewStrategic ReportGovernanceFinancial Statements
Purchases
Quarter Purchases Sector Price in £ Yield %
Q3 2017 Self-Storage Unit Trust Other 44.6 million –
Sales
Quarter Disposals Sector Price in £ Yield %
Q1 2018 Reading – Woodley, Crockhamwell Road Standard Retail 6.9 million 7.3
Q4 2017 Livingston – Limefields Industrial 6.5 million N/A
Q4 2017 Truro – Lemon Quay House Standard Retail 5.1 million 5.5
Q4 2017 Bracknell – Eagle House Office 4.5 million N/A
Q3 2017 Exeter – Pearl Assurance House, High Street Standard Retail 11.4 million 5.4
Purchases and Sales
Self-Storage Unit Trust
C M Y K : 20 0 P P I

Strategic Report
Schroder UK Real Estate FundAnnual Report and Consolidated Financial Statements for the year ended 31 March 2018
28
Case Study – Purchase
Self-Storage Unit Trust
Structural trends underpin strong demand
SREF’s only acquisition during the year was a portfolio of five self-storage assets for £44.6 million. This represents the first investment into a sector which can benefit from strong structural drivers of demand and low levels of supply.
The portfolio was acquired from The Self-Storage Company, a privately owned company with five purpose-built properties around the M25, and provides a total of 230,000 sq ft of storage space. The transaction also included the intellectual property rights, company brand, sophisticated operating platform and management team (via an exclusive contract with SREF) for nil consideration.
SREF’s investment in the self-storage market was driven by our research team’s fundamental analysis which identified this as an attractive sector. Demographic trends, particularly in highly urbanised areas, alongside technological shifts which facilitated more start-up businesses and online traders, strongly underpin the sector. Aside from a small number of larger self-storage operators, the sector is highly fragmented and offers attractive acquisition opportunities.
At purchase the majority of the properties were newly completed and therefore not let. Our strategy is to grow the portfolio’s net operating income and, within three years, our business plan envisages that rental income will be equivalent to a yield-on-cost of 9%, which is highly attractive in today’s market. Longer term we may seek to aggregate the portfolio to allow the business to benefit from scale which would in turn be reflected in an increased real estate valuation.
Projected rental income when fully let
£3.4m% NAV Number of assets in portfolio
1.8% 5

Schroder UK Real Estate Fund Annual Report and Consolidated Financial Statements for the year ended 31 March 2018
29
OverviewStrategic ReportGovernanceFinancial Statements
246 PPI

30 Schroder UK Real Estate FundAnnual Report and Consolidated Financial Statements for the year ended 31 March 2018
Strategic Report
Sustainable Investment
At the heart of our investment philosophyWe believe that a successful responsible investment programme should deliver enhanced returns to investors, improved business performance to tenants and tangible benefits to local communities and wider society.
The changes in markets as a consequence of environmental and social issues are simply investment risks that Schroders must understand to protect our clients’ assets from depreciation.
Offering occupiers resource-efficient and flexible space is critical to ensure our investments are fit for purpose and sustain their value over the long term. As a landlord, we have the opportunity to help reduce running costs for our occupiers, increase employee productivity and well-being, and contribute to the prosperity of a location through building design and management. If we ignored such issues when considering asset management and investments, we would risk the erosion of income and value as well as missing opportunities to enhance investment returns.
Through its construction, use and demolition, the built environment accounts for more than one-third of global energy use and is the single largest source of greenhouse gas emissions in many countries.
The industry’s potential to cost-efficiently reduce emissions and the consumption of depleting resources, combined with the political imperative to tackle issues such as climate change, means the property sector will remain a prime target for policy action. This presents new challenges and opportunities for the real estate industry with profound implications for both owners and occupiers.
A good investment strategy must incorporate ESG issues alongside traditional economic considerations. At Schroders we believe a complete approach should be rewarded by improved investment decisions and performance.
A copy of Schroders’ Responsible Real Estate Investment Strategy can be found at www.schroders.com/en/uk/realestate
The Lexicon, Bracknell
I M AG E I S A M O N TAG E W I T H G H O S T I N G
789 PPI
31 Schroder UK Real Estate Fund Annual Report and Consolidated Financial Statements for the year ended 31 March 2018
OverviewStrategic ReportGovernanceFinancial Statements
Environmental Management SystemOver 2017 Schroder Real Estate, led by our Head of Sustainability, has continued to work with sustainability and energy management consultancy Evora Global to develop our Environmental Management System (‘EMS’) which is aligned with the internationally recognised standard ISO14001. The EMS provides the framework for how sustainability principles (environmental and social) are managed throughout all stages of our real estate investment process including acquisition due diligence, asset management, property management provided by third parties, refurbishments and developments, through to disposal.
The Investment Manager sets a Sustainability Policy annually approved by the Investment Committee which confirms the commitments and targets for the year. Key aspects of the Policy and its objectives are set out below.
Property manager sustainability requirementsProperty managers play an integral role in supporting the sustainability programme. Schroder Real Estate has established a set of Sustainability Requirements for property managers to adhere to in the course of delivering their property management services. This includes a set of key performance indicators to help improve the property managers’ sustainability-related services to the Fund and which are assessed on a six-monthly and annual basis at December and June respectively. Schroder Real Estate is pleased to report that Knight Frank and Jones Lang LaSalle, principal property managers to the Fund, have performed in line with targets set for 2017.
Energy Energy is an important element of landlords’ responsibilities for buildings where the landlord has operational control. Schroder Real Estate has continued to develop the monitoring of the Fund’s energy usage and efficiency as well as water and waste with analysis and reporting on a quarterly and annual basis.
In the first quarter of 2016 Schroder Real Estate introduced an energy reduction target of 6% across its UK managed assets over a two-year period to March 2018 from a baseline of the 2016 reporting year. Alongside this, Schroder Real Estate continues to work with Evora Global and the Fund’s property managers to achieve further reductions on a cost-effective basis. As part of this, all managed assets within the Fund have been reviewed and sustainability objectives identified for the year to March 2018.
Initiatives include building management systems, LED lighting and boiler optimisation programmes. Improving energy efficiency and reducing energy consumption will benefit tenants’ occupational costs and should help tenant retention and attract new tenants.
Analysis of how the Fund has performed against the target has not yet been finalised, however, an indication of recent progress can be taken from the 10% reduction in like-for-like landlord procured energy over the 2018 reporting year against the previous year and reported in the Unaudited Environmental Data Report. For the analysis of the Fund’s performance against the Schroder Real Estate energy target, the actual target baseline year of 2016 will be applied. Furthermore, the analysis will incorporate adjustments to remove the impact of external factors on consumption, such as occupancy changes and weather patterns (and therefore heat demand). The results of this analysis will be incorporated in Fund reporting later in 2018.
Energy Performance Certificates (EPC) for the portfolio are regularly reviewed in light of the 2015 Minimum Energy Efficiency Standards (England and Wales) legislation. Schroder Real Estate is actively managing the potential risk of this legislation to the portfolio. This legislation brings in a minimum EPC standard of ‘E’ for new leases and renewals for non-domestic buildings from 1 April 2018; this minimum standard applies to all leases from 1 April 2023.
The EPC profile for the portfolio is set out within the Environmental Data report on page 63.
Refurbishments and green building certificationsSchroder Real Estate seeks to deliver developments and refurbishments to sustainable standards and deliver good performance against building certifications, including EPCs and BREEAM (the Building Research Establishment Environmental Assessment Methodology, an environmental assessment method and rating system for buildings). Standards required are set for each project in context for the asset and Schroder Real Estate’s guiding principles for projects of minimum D-rated EPCs and BREEAM ‘Very Good’.
WaterSchroder Real Estate monitors water consumption where the landlord has supply responsibilities and encourages asset-level improvements. A 0.9% increase in like-for-like water consumption, for assets where the Fund had supply responsibilities, was reported between the 2017 and 2018 reporting periods.
Environmental and social issues are simply investment risks that Schroders must understand to protect our clients’ assets.

32 Schroder UK Real Estate FundAnnual Report and Consolidated Financial Statements for the year ended 31 March 2018
Strategic Report
The Lexicon, Bracknell
Sustainable Investment continued
WasteWaste management and disposal activities are responsible for considerable negative environmental and societal impact. As a result, waste should be minimised and disposal should be as sustainable as possible. To this end, Schroder Real Estate has set an objective to send zero waste to landfill and to achieve optimal recycling. During 2017 the Fund achieved close to 100% diversion from landfill.
Global Real Estate Sustainability Benchmark (GRESB) The Fund has participated in GRESB since 2013. We are pleased to report that in 2017 the Fund was again awarded a ‘Green Star’ (this rating is achieved where scores for the two dimensions of Management and Policy and Implementation and Measurement are at least 50 out of 100 points). A submission will be made for the 2018 GRESB survey for which results are due in September 2018.
GRESB is the dominant global standard for assessing ESG performance for real estate funds and companies.
Environmental dataThis year the Sustainability Report has again been aligned with the INREV Sustainability Reporting Guidelines 2016 and therefore includes an Environmental Data Report for the portfolio presented using GRESB methodology. The Environmental Data Report is included from page 56.
Carbon Reduction Commitment (CRC)The Fund qualified for Phase II of the CRC Energy Efficiency Scheme and the purchase of allowances. The Fund complies with the CRC Scheme requirements and a submission for the 2018 reporting year will be made. It was announced in the March 2016 Budget that the CRC Scheme will not continue beyond Phase II which ends 31 March 2019.
Energy Savings Opportunity SchemeThe Fund was in scope of the Energy Savings Opportunity Scheme and a completed notification was submitted in 2015. The audits required under the scheme support our programme to implement improvement initiatives across the portfolio. The second phase of reporting is required in 2019.
The Investment Manager monitors policy and legislation relating to ESG issues to develop its EMS and manage risk and compliance.
Health, well-being and productivityThe real estate industry is beginning to gain a new perspective on the importance of the built environment on human health, well-being and productivity. A number of schemes have emerged which seek to identify the impacts of spaces and places on people and provide new ways of certifying buildings. Case studies demonstrate the benefit of reflecting well-being in good design. Schroder Real Estate is working to embed this aspect into its investment process.
Stakeholder engagement and communitySchroder Real Estate seeks active engagement with tenants to ensure a good occupational experience to help retain and attract tenants. As the day-to-day relationship is with the property manager, the Property Manager Sustainability Requirements include a key performance indicator on tenant engagement. Schroder Real Estate believes in the importance of understanding a building’s relationship with the community and its contribution to the well-being of society.
Schroder Real Estate seeks active engagement to ensure a good occupational experience to help retain and contract tenants.
C M Y K : 275 P P I

33 Schroder UK Real Estate Fund Annual Report and Consolidated Financial Statements for the year ended 31 March 2018
OverviewStrategic ReportGovernanceFinancial Statements
Positively impacting on local communities helps create successful places that foster community relationships, contribute to local prosperity, attract building users and ultimately, lead to better, more resilient investments. Schroder Real Estate looks to understand and develop the community relationship to ensure investments provide sustainable social solutions for the long term.
Industry participationSchroder Real Estate is a member of a number of industry bodies including the European Public Real Estate Association (‘EPRA’), INREV (European Association for Investors in Non-Listed Real Estate Vehicles), British Council for Offices and the British Property Federation. It was a founding member of the UK Green Building Council in 2007 and in 2017 became a member of the Better Buildings Partnership and a Fund Manager Member of GRESB.
EmployeesThe Fund has no direct employees. The Investment Manager is part of Schroders plc which has responsibility for the employees that support the Company. Schroders believes diversity of thought and an inclusive workplace are key to creating a positive environment for its people. Schroder Real Estate’s real estate team have a sustainability objective within their annual objectives.
Further information on Schroders’ principles in relation to people, including diversity, gender pay gap, values, employee satisfaction survey, well-being and retention, can be found at www.schroders.com/en/sysglobalassets/global-assets/global/annual-report/documents/schroders-ar17-peoplesociety.pdf
www.schroders.com/en/people/diversity-and-inclusion/gender-equality-at-schroders/
Corporate responsibilitySchroders’ commitment to corporate responsibility is to ensure that its commitment to act responsibly, support clients, deliver value to shareholders and make a wider contribution to society is embedded across its business in all that it does.
Full information on Schroders’ Corporate Responsibility approach, including its economic contribution, environmental impacts and community involvement, can be found at www.schroders.com/en/about-us/corporate-responsibility/
Slavery and Human Trafficking StatementThe Fund is not required to produce a statement on slavery and human trafficking pursuant to the Modern Slavery Act 2015 as it does not satisfy all the relevant triggers under that Act that required such a statement.
Schroder Real Estate, the Investment Manager to the Fund, is part of Schroders plc and whose statement on Slavery and Human Trafficking has been published in accordance with the Modern Slavery Act 2015 (the ‘Act’). It sets out the steps that Schroders plc and other relevant Group companies (‘Schroders’ or the ‘Group’) have taken during 2017 and will be taking in 2018 to prevent slavery and human trafficking from taking place in its supply chains or any part of its business. Schroder Real Estate is part of the Schroders Group.
Schroders’ statement can be found at www.schroders.com/en/about-us/corporate-responsibility/slavery-and-human-trafficking-statement/
Ruskin Square, Croydon
C M Y K : 1195 P P I

34 Schroder UK Real Estate FundAnnual Report and Consolidated Financial Statements for the year ended 31 March 2018
Governance
Report of the Authorised Corporate Director and Statement of Responsibilities
The Financial StatementsWe are pleased to present the Audited Consolidated Financial Statements of the Schroder UK Real Estate Fund for the year ended 31 March 2018.
The FundSchroder UK Real Estate (the ‘Fund’) is an investment Fund with variable capital incorporated in England and Wales under registered number IC000945 and authorised by the Financial Conduct Authority (‘FCA’) with effect from 31 July 2012. The Fund has an unlimited duration. The shareholders are not liable for any debts of the Fund.
The investment objective of the Fund is to undertake real estate investment business and to manage cash raised from investors for investment in the real estate investment business, with the intention of achieving a blend of income and capital growth. The Fund’s target return is to achieve 0.5% per annum (net of all fees and expenses) above the benchmark (the AREF/IPD UK Quarterly Property Fund Index – All Balanced Property Fund Index Weighted Average) over rolling three-year periods. The Fund will seek to diversify risk by holding a mixed portfolio of retail, office, industrial and other real estate throughout the UK.
The policy for achieving these objectives is that the Fund will invest in UK real estate. The Fund may also invest in transferable securities (including REITs, government bonds and unquoted companies), units in collective investment schemes, units in unregulated collective investment schemes (which may include unauthorised property unit trusts and limited partnerships), money market instruments, deposits, cash and cash equivalents.
Authorised statusFrom 31 July 2012 the Fund was authorised as an Open-Ended Investment Fund under Regulation 12 of the Open-Ended Investment Companies Regulations 2001.
Annual General MeetingsThe Fund will not be holding any Annual General Meetings.
Statement of Responsibilities of the Authorised Corporate DirectorThe FCA’s Collective Investment Schemes sourcebook (‘COLL’) requires the Authorised Corporate Director (‘ACD’) to prepare accounts for each annual and half-yearly accounting period, in accordance with United Kingdom Generally Accepted Accounting Practice, which give a true and fair view of the financial position of the Fund and of its net revenue and the net capital gains on the property of the Fund for the year. In preparing the accounts the ACD is required to:
— select suitable accounting policies and then apply them consistently;
— comply with the disclosure requirements of the Statement of Recommended Practice for UK Authorised Funds issued by the IMA in May 2014;
— follow generally accepted accounting principles and applicable accounting standards;
— prepare the accounts on the basis that the Fund will continue in operation unless it is inappropriate to do so;
— keep proper accounting records which enable it to demonstrate that the accounts as prepared comply with the above requirements; and
— make judgements and estimates that are prudent and reasonable.
The ACD is responsible for the management of the Fund in accordance with its Instrument of Incorporation, Prospectus and COLL and for taking reasonable steps for the prevention and detection of fraud, error and non-compliance with law or regulations.
So far as the ACD is aware, there is no relevant audit information of which the Group and the Fund’s Auditors are unaware, and the ACD has taken all the steps that he or she ought to have taken as an ACD in order to make himself or herself aware of any relevant audit information and to establish that the Group and the Fund’s Auditors are aware of that information.
The ACD’s Report and Accounts for the year ended 31 March 2018 were signed on 18 July 2018 on behalf of the ACD by:
J. Walker-Hazell,
P. ChislettSchroder Unit Trusts Limited
18 July 2018

35 Schroder UK Real Estate Fund Annual Report and Consolidated Financial Statements for the year ended 31 March 2018
OverviewStrategic ReportGovernanceFinancial Statements
AIFMD Remuneration Disclosures for Schroder Unit Trusts Limited (‘SUTL’) for the year to 31 December 2017
These disclosures form part of the non-audited section of this Annual Report and Accounts and should be read in conjunction with the Schroders plc Remuneration Report on pages 62 to 90 of the 2017 Annual Report & Accounts (available on the Group’s website – www.schroders.com/ir), which provides more information on the activities of our Remuneration Committee and our remuneration principles and policies.
The AIF Material Risk Takers (‘AIF MRTs’) of SUTL are individuals whose roles within the Schroders Group can materially affect the risk of SUTL or any AIF fund that it manages. These roles are identified in line with the requirements of the AIFM Directive and guidance issued by the European Securities and Markets Authority.
The Remuneration Committee of Schroders plc has established a remuneration policy to ensure the requirements of the AIFM Directive are met for all AIF MRTs. The Remuneration Committee and the Board of Schroders plc review remuneration strategy at least annually. The directors of SUTL are responsible for the adoption of the remuneration policy, for reviewing its general principles at least annually, for overseeing its implementation and for ensuring compliance with relevant local legislation and regulation. During 2017 the remuneration policy was reviewed and changes were made to ensure compliance with the UCITS/AIFMD remuneration requirements.
The implementation of the remuneration policy is, at least annually, subject to independent internal review for compliance with the policies and procedures for remuneration adopted by the Board of SUTL and the Remuneration Committee. The most recent review found no fundamental issues but resulted in a range of more minor recommendations, principally improvements to process and policy documentation.
The total spend on remuneration is determined based on a profit share ratio, measuring variable remuneration charge against pre-bonus profit, and from a total compensation ratio, measuring total remuneration expense against net income. This ensures that the interests of employees are aligned with Schroders’ financial performance. In determining the remuneration spend each year, the underlying strength and sustainability of the business is taken into account, along with reports on risk, legal and compliance matters from the heads of those areas.
The remuneration data that follows reflects amounts paid in respect of performance during 2017.
— The total amount of remuneration paid by SUTL to its staff was nil as SUTL has no employees. SUTL has an independent Non-Executive Director who receives fees in respect of his role on the Board of SUTL1. Employees of other Schroders Group entities who serve as Directors of SUTL receive no additional fees in respect of their role on the Board of SUTL.
— The following disclosures relate to AIF MRTs of SUTL. Most of those AIF MRTs were employed by and provided services to other Schroders Group companies and clients. As a result, only a portion of remuneration for those individuals is included in the aggregate remuneration figures that follow, based on an objective apportionment to reflect the balance of each role using relevant regulated AUM as a proportion of the total AUM within the scope of each role. The aggregate total remuneration paid to the 147 AIF MRTs of SUTL in respect of the financial year ended 31 December 2017, and attributed to SUTL or the AIF funds that it manages, is £6.3 million, of which £2.0 million was paid to senior management, £4.0 million was paid to MRTs deemed to be taking risk on behalf of SUTL or the AIF funds that it manages and £0.3 million was paid to other AIF MRTs.
For additional qualitative information on remuneration policies and practices, see www.schroders.com/rem-disclosures
1 The fee is not disclosed due to confidentiality and data protection considerations. The amount is not material to SUTL.
36 Schroder UK Real Estate FundAnnual Report and Consolidated Financial Statements for the year ended 31 March 2018
Governance
Investment Manager’s Statement of Responsibility
The ACD has delegated to the Investment Manager the function of managing the investment and reinvestment of the assets of the Fund.
On 31 July 2012, the ACD appointed Schroder Property Investment Management Limited to provide investment management, property management and advisory services to the ACD. On 24 November 2014, Schroder Property Investment Management Limited was renamed to Schroder Real Estate Investment Management Limited (‘Schroder Real Estate’). Schroder Real Estate is a member of the same Group (Schroders plc) as the ACD.
The Investment Manager has discretionary responsibility for implementing investment policy and is responsible to investors for the performance of the Fund. Adherence to such policies is monitored quarterly through reporting by the Investment Manager to the Real Estate Investment Risk Committee which is an integral part of the Schroders Investment Risk Framework (‘SIRF’). The Investment Manager is also responsible for marketing the Fund, pricing and accounting for the Fund, providing all relevant information to valuers, managing agents and for providing performance information to IPD (Investment Property Databank). All delegated appointments by the Investment Manager are on an advisory basis.
Subject to the investment objectives and restrictions contained in the OEIC Regulations and COLL (Collective Investment Schemes sourcebook) and the investment and borrowing guidelines contained in the Prospectus, the Investment Manager has discretion to take decisions in relation to the management of the Fund, without prior reference to the ACD. As required by COLL, the Investment Manager must obtain the consent of the Depositary for the acquisition or disposal of immovable property.
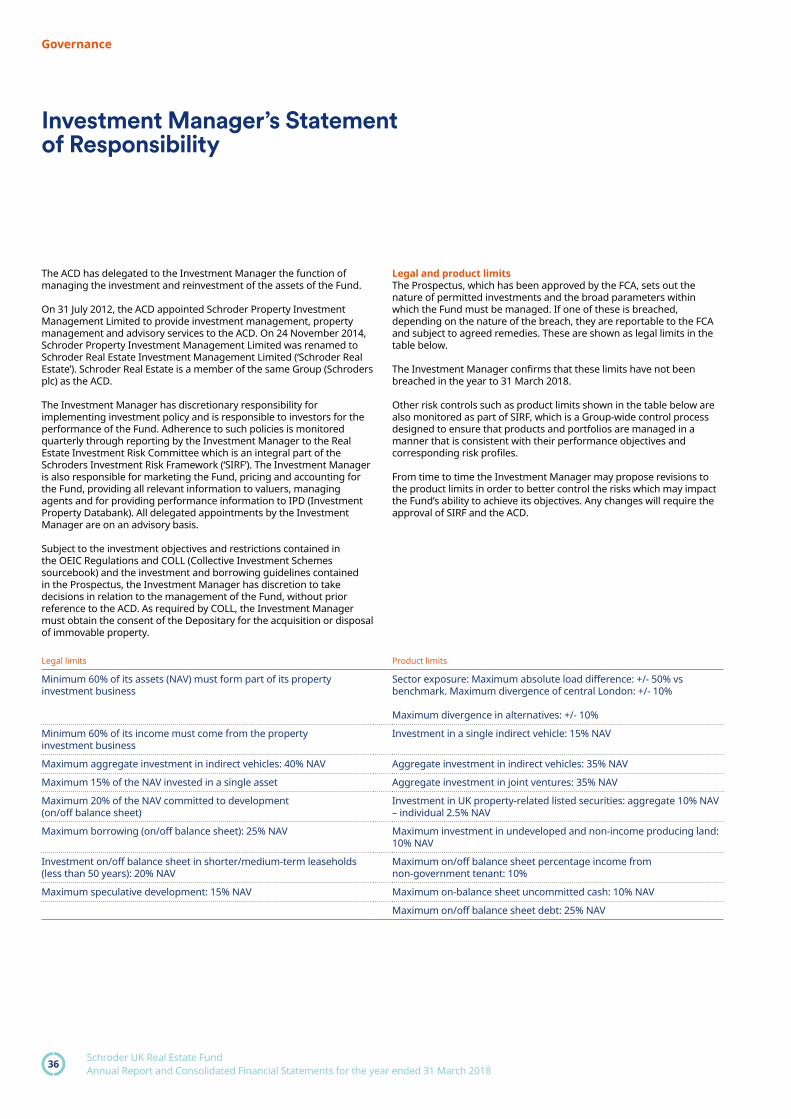
Legal limits Product limits
Minimum 60% of its assets (NAV) must form part of its property investment business
Sector exposure: Maximum absolute load difference: +/- 50% vs benchmark. Maximum divergence of central London: +/- 10%
Maximum divergence in alternatives: +/- 10%
Minimum 60% of its income must come from the property investment business
Investment in a single indirect vehicle: 15% NAV
Maximum aggregate investment in indirect vehicles: 40% NAV Aggregate investment in indirect vehicles: 35% NAV
Maximum 15% of the NAV invested in a single asset Aggregate investment in joint ventures: 35% NAV
Maximum 20% of the NAV committed to development (on/off balance sheet)
Investment in UK property-related listed securities: aggregate 10% NAV – individual 2.5% NAV
Maximum borrowing (on/off balance sheet): 25% NAV Maximum investment in undeveloped and non-income producing land: 10% NAV
Investment on/off balance sheet in shorter/medium-term leaseholds (less than 50 years): 20% NAV
Maximum on/off balance sheet percentage income from non-government tenant: 10%
Maximum speculative development: 15% NAV Maximum on-balance sheet uncommitted cash: 10% NAV
Maximum on/off balance sheet debt: 25% NAV
Legal and product limitsThe Prospectus, which has been approved by the FCA, sets out the nature of permitted investments and the broad parameters within which the Fund must be managed. If one of these is breached, depending on the nature of the breach, they are reportable to the FCA and subject to agreed remedies. These are shown as legal limits in the table below.
The Investment Manager confirms that these limits have not been breached in the year to 31 March 2018.
Other risk controls such as product limits shown in the table below are also monitored as part of SIRF, which is a Group-wide control process designed to ensure that products and portfolios are managed in a manner that is consistent with their performance objectives and corresponding risk profiles.
From time to time the Investment Manager may propose revisions to the product limits in order to better control the risks which may impact the Fund’s ability to achieve its objectives. Any changes will require the approval of SIRF and the ACD.

37 Schroder UK Real Estate Fund Annual Report and Consolidated Financial Statements for the year ended 31 March 2018
OverviewStrategic ReportGovernanceFinancial Statements
Independent Property Valuers’ Report
Knight Frank LLPAs Independent Valuer for the Fund, we have valued immovables held by the Fund as at 1 April 2018 in accordance with RICS Valuation – Global Standards 2017, incorporating International Valuation Standards and RICS Valuation – Professional Standards UK January 2014 (revised April 2015) and in accordance with the COLL 8.4.13R of the Collective Investment Schemes sourcebook. Schroder Unit Trusts Limited, as ACD of the Fund, has been provided with a full valuation certificate and report. The immovables have been valued on the basis of market value as defined by the RICS Valuation Standards subject to existing leases.
We have been provided with information from the relevant property managers including tenancy schedules and floor areas and assumed that the Fund’s interests are not subject to any onerous restrictions, to the payment of any unusual outgoings or to any charges, easements or rights of way, other than those to which we have referred in our reports. We rely upon the property manager to keep us advised of any changes that may occur in the investments. We are not instructed to carry out structural surveys nor test any of the service installations. Our valuations therefore have regard only to the general condition of the properties evident from our inspections. We have assumed that no materials have been used in the buildings which are deleterious, hazardous or likely to cause structural defects. We are not instructed to carry out investigations into pollution hazards which might affect the properties and our valuations assume the properties are not adversely affected by any form of pollution.
In our opinion the aggregate of the market values of the five immovables owned by the Fund as at 1 April 2018 is £39.555 million. This figure represents the aggregate of the values attributable to the individual immovables and should not be regarded as a valuation of the portfolio as a whole in the context of a sale as a single lot.
No allowance is made in our valuations for the costs of realisation, any liability for tax which might arise on the event of disposal or for any mortgage or similar financial encumbrance over the property. Our valuations exclude VAT.
Knight Frank LLP – 1 April 2018
BNP Paribas Real EstateAs Standing Independent Valuer for the Fund, we have valued immovables held by the Fund as at 3 April 2018 in accordance with IFRS 13, FRS 102 and the RICS Valuation – Global Standards 2017 (the ‘Red Book’) and in accordance with the COLL 8.4.13R of the Collective Investment Schemes sourcebook. Schroder Unit Trusts Limited, as Authorised Corporate Director of the Fund, has been provided with a full valuation certificate and report. The immovables have been valued on the basis of market value as defined by the RICS Valuation Standards subject to existing leases.
Details of the nature and extent of the immovables, the tenure and tenancies, permitted uses, town planning consents and related matters, have been supplied by the Investment Manager, Schroder Real Estate Investment Management Limited. We have generally been provided with copies of leases but we have not examined the title documents and we have therefore assumed that the Fund’s interests are not subject to any onerous restrictions, to the payment of any unusual outgoings or to any charges, easements or rights of way, other than those to which we have referred in our reports. We rely upon the Investment Manager to keep us advised of any changes that may occur in the investments. We are not instructed to carry out structural surveys nor test any of the service installations. Our valuations therefore have regard only to the general condition of the properties evident from our inspections. We have assumed that no materials have been used in the buildings which are deleterious, hazardous or likely to cause structural defects. We are not instructed to carry out investigations into pollution hazards which might affect the properties and our valuations assume the properties are not adversely affected by any form of pollution.
In our opinion the aggregate of the market values of the 42 immovables owned by the Fund as at 3 April 2018 is £1,450,760 million. This figure represents the aggregate of the values attributable to the individual immovables and should not be regarded as a valuation of the portfolio as a whole in the context of a sale as a single lot.
In the case of the immovables in the course of development, our valuations reflect the stage reached in construction and the costs already incurred at the date of valuation. We have had regard to the contractual liabilities of the parties involved in the developments and any cost estimates which have been prepared by professional advisers.
No allowance is made in our valuations for the costs of realisation, any liability for tax which might arise on the event of disposal or for any mortgage or similar financial encumbrance over the property. Our valuations exclude VAT.
BNP Paribas Real Estate

38 Schroder UK Real Estate FundAnnual Report and Consolidated Financial Statements for the year ended 31 March 2018
Governance
Depositary’s Report and Statement of Responsibilities
Statement of ResponsibilitiesStatement of the Depositary’s Responsibilities and Report of the Depositary to the Shareholders of Schroder UK Real Estate Fund (‘the Company’) for the year ended 31 March 2018.
The Depositary must ensure that the Company is managed in accordance with the Financial Conduct Authority’s Collective Investment Schemes sourcebook, the Open-Ended Investment Companies Regulations 2001 (SI 2001/1228) (the OEIC Regulations), as amended, the Financial Services and Markets Act 2000, as amended, (together ‘the Regulations’), the Company’s Instrument of Incorporation and Prospectus (together ‘the Scheme documents’) as detailed below.
The Depositary must in the context of its role act honestly, fairly, professionally, independently and in the interests of the Company and its investors.
The Depositary is responsible for the safekeeping of all custodial assets and maintaining a record of all other assets of the Company in accordance with the Regulations.
The Depositary must ensure that:
— the Company’s cash flows are properly monitored and that cash of the Company is booked into the cash accounts in accordance with the Regulations;
— the sale, issue, redemption and cancellation of shares are carried out in accordance with the Regulations;
— the value of shares of the Company is calculated in accordance with the Regulations;
— any consideration relating to transactions in the Company’s assets is remitted to the Company within the usual time limits;
— the Company’s income is applied in accordance with the Regulations; and
— the instructions of the Authorised Fund Manager (‘the AFM’) are carried out (unless they conflict with the Regulations).
The Depositary also has a duty to take reasonable care to ensure that the Company is managed in accordance with the Regulations and the Scheme documents in relation to the investment and borrowing powers applicable to the Company.
Having carried out such procedures as we consider necessary to discharge our responsibilities as Depositary of the Company, it is our opinion, based on the information available to us and the explanations provided, that in all material respects the Company, acting through the AIFM:
(i) has carried out the issue, sale, redemption and cancellation, and calculation of the price of the Company’s shares and the application of the Company’s income in accordance with the Regulations and the Scheme documents of the Company; and
(ii) has observed the investment and borrowing powers and restrictions applicable to the Company.
NatWest PLC – 1 April 2018

39 Schroder UK Real Estate Fund Annual Report and Consolidated Financial Statements for the year ended 31 March 2018
OverviewStrategic ReportGovernanceFinancial Statements
Independent Auditors’ Report to the Shareholders of Schroder UK Real Estate Fund
Report on the audit of the financial statementsOpinionIn our opinion, Schroder UK Real Estate Fund Group and Fund financial statements (‘the financial statements’):
— give a true and fair view of the financial position of the Group and the Fund as at 31 March 2018 and of the net revenue and the net capital gains on the scheme property of the Group and the Fund for the year then ended; and
— have been properly prepared in accordance with United Kingdom Generally Accepted Accounting Practice (United Kingdom Accounting Standards, comprising FRS 102 ‘The Financial Reporting Standard applicable in the UK and Republic of Ireland’, and applicable law), the Statement of Recommended Practice for UK Authorised Funds, the Collective Investment Schemes sourcebook and the Instrument of Incorporation.
Schroder UK Real Estate Fund (the ‘Fund’) is an Open Ended Investment Company (‘OEIC’). We have audited the financial statements, included within the Annual Report and Consolidated Financial Statements (the ‘Annual Report’), which comprise: the Consolidated and Fund Balance Sheets as at 31 March 2018; the Consolidated and Fund Statements of Total Return, the Consolidated and Fund Statements of Changes in Net Assets Attributable to Shareholders, and the Consolidated and Fund Cash Flow Statements for the year then ended; the Distribution Table; and the Notes to the Financial Statements, which include a description of the significant accounting policies and other explanatory information.
Basis for opinionWe conducted our audit in accordance with International Standards on Auditing (UK) (‘ISAs (UK)’) and applicable law. Our responsibilities under ISAs (UK) are further described in the Auditors’ responsibilities for the audit of the financial statements section of our report. We believe that the audit evidence we have obtained is sufficient and appropriate to provide a basis for our opinion.
IndependenceWe remained independent of the Group in accordance with the ethical requirements that are relevant to our audit of the financial statements in the UK, which includes the FRC’s Ethical Standard, and we have fulfilled our other ethical responsibilities in accordance with these requirements.
Conclusions relating to going concernWe have nothing to report in respect of the following matters in relation to which ISAs (UK) require us to report to you when:
— the Authorised Corporate Director’s use of the going concern basis of accounting in the preparation of the financial statements is not appropriate; or
— the Authorised Corporate Director has not disclosed in the financial statements any identified material uncertainties that may cast significant doubt about the Group’s and the Fund’s ability to continue to adopt the going concern basis of accounting for a period of at least 12 months from the date when the financial statements are authorised for issue.
However, because not all future events or conditions can be predicted, this statement is not a guarantee as to the Group’s and the Fund’s ability to continue as a going concern.
Reporting on other information The other information comprises all of the information in the Annual Report other than the financial statements and our Auditors’ Report thereon. The Authorised Corporate Director is responsible for the other information. Our opinion on the financial statements does not cover the other information and, accordingly, we do not express an audit opinion or, except to the extent otherwise explicitly stated in this report, any form of assurance thereon.
In connection with our audit of the financial statements, our responsibility is to read the other information and, in doing so, consider whether the other information is materially inconsistent with the financial statements or our knowledge obtained in the audit, or otherwise appears to be materially misstated. If we identify an apparent material inconsistency or material misstatement, we are required to perform procedures to conclude whether there is a material misstatement of the financial statements or a material misstatement of the other information. If, based on the work we have performed, we conclude that there is a material misstatement of this other information, we are required to report that fact. We have nothing to report based on these responsibilities.
Report of the Authorised Corporate Director In our opinion, the information given in the Report of the Authorised Corporate Director and Statement of Responsibilities for the financial year for which the financial statements are prepared is consistent with the financial statements.
Responsibilities for the financial statements and the auditResponsibilities of the Authorised Corporate Director for the financial statementsAs explained more fully in the Report of the Authorised Corporate Director and Statement of Responsibilities set out on page 34, the Authorised Corporate Director is responsible for the preparation of the financial statements in accordance with the applicable framework and for being satisfied that they give a true and fair view. The Authorised Corporate Director is also responsible for such internal control as they determine is necessary to enable the preparation of financial statements that are free from material misstatement, whether due to fraud or error.
In preparing the financial statements, the Authorised Corporate Director is responsible for assessing the Group’s and the Fund’s ability to continue as a going concern, disclosing as applicable, matters related to going concern and using the going concern basis of accounting unless the Authorised Corporate Director either intends to wind up or terminate the Group or the Fund, or has no realistic alternative but to do so.
Auditors’ responsibilities for the audit of the financial statementsOur objectives are to obtain reasonable assurance about whether the financial statements as a whole are free from material misstatement, whether due to fraud or error, and to issue an Auditors’ Report that includes our opinion. Reasonable assurance is a high level of assurance, but is not a guarantee that an audit conducted in accordance with ISAs (UK) will always detect a material misstatement when it exists. Misstatements can arise from fraud or error and are considered material if, individually or in the aggregate, they could reasonably be expected to influence the economic decisions of users taken on the basis of these financial statements.
A further description of our responsibilities for the audit of the financial statements is located on the Financial Reporting Council’s website at: www.frc.org.uk/auditorsresponsibilities. This description forms part of our Auditors’ Report.
40 Schroder UK Real Estate FundAnnual Report and Consolidated Financial Statements for the year ended 31 March 2018
Financial Statements
Use of this reportThis report, including the opinions, has been prepared for and only for the Fund’s shareholders as a body in accordance with paragraph 4.5.12 of the Collective Investment Schemes sourcebook as required by paragraph 67(2) of the Open-Ended Investment Companies Regulations 2001 and for no other purpose. We do not, in giving these opinions, accept or assume responsibility for any other purpose or to any other person to whom this report is shown or into whose hands it may come save where expressly agreed by our prior consent in writing.
Other required reportingOpinion on matter required by the Collective Investment Schemes sourcebookIn our opinion, we have obtained all the information and explanations we consider necessary for the purposes of the audit.
Collective Investment Schemes sourcebook exception reportingUnder the Collective Investment Schemes sourcebook we are also required to report to you if, in our opinion:
— proper accounting records of the Fund have not been kept; or
— the financial statements of the Fund are not in agreement with the accounting records.
We have no exceptions to report arising from this responsibility.
PricewaterhouseCoopers LLPChartered Accountants and Statutory AuditorsLondon
18 July 2018
Independent Auditors’ Report to the Shareholders of Schroder UK Real Estate Fund continued

41 Schroder UK Real Estate Fund Annual Report and Consolidated Financial Statements for the year ended 31 March 2018
OverviewStrategic ReportGovernanceFinancial Statements
Notes
Consolidated Year Ended
31 March 2018£000
Fund Year Ended
31 March 2018£000
Consolidated Year Ended
31 March 2017£000
Fund Year Ended
31 March 2017£000
Income
Net capital gains 4 176,920 176,920 69,007 69,007
Revenue 5 119,148 108,416 114,006 105,096
Gain/(Loss) attributable to non-controlling interest 80 – (2) –
Expenses 6 (46,656) (35,844) (45,858) (36,950)
Net revenue before taxation 72,572 72,572 68,146 68,146
Taxation – – – –
Net revenue after taxation 72,572 72,572 68,146 68,146
Total return before distribution 249,492 249,492 137,153 137,153
Finance costs: distributions 7 (80,642) (80,642) (75,172) (75,172)
Change in net assets attributable to shareholders from investment activities 168,850 168,850 61,981 61,981
Consolidated and Fund Statements of Changes in Net Assets Attributable to ShareholdersFor the year ended 31 March 2018
Consolidated Year Ended
31 March 2018£000
Fund Year Ended
31 March 2018£000
Consolidated Year Ended
31 March 2017£000
Fund Year Ended
31 March 2017£000
Opening net assets attributable to shareholders 2,320,418 2,320,418 2,228,584 2,228,584
Amounts receivable on creation of shares 25,967 25,967 29,853 29,853
Change in net assets attributable to shareholders from investment activities 168,850 168,850 61,981 61,981
Closing net assets attributable to shareholders 2,515,235 2,515,235 2,320,418 2,320,418
Consolidated and Fund Statements of Total ReturnFor the year ended 31 March 2018
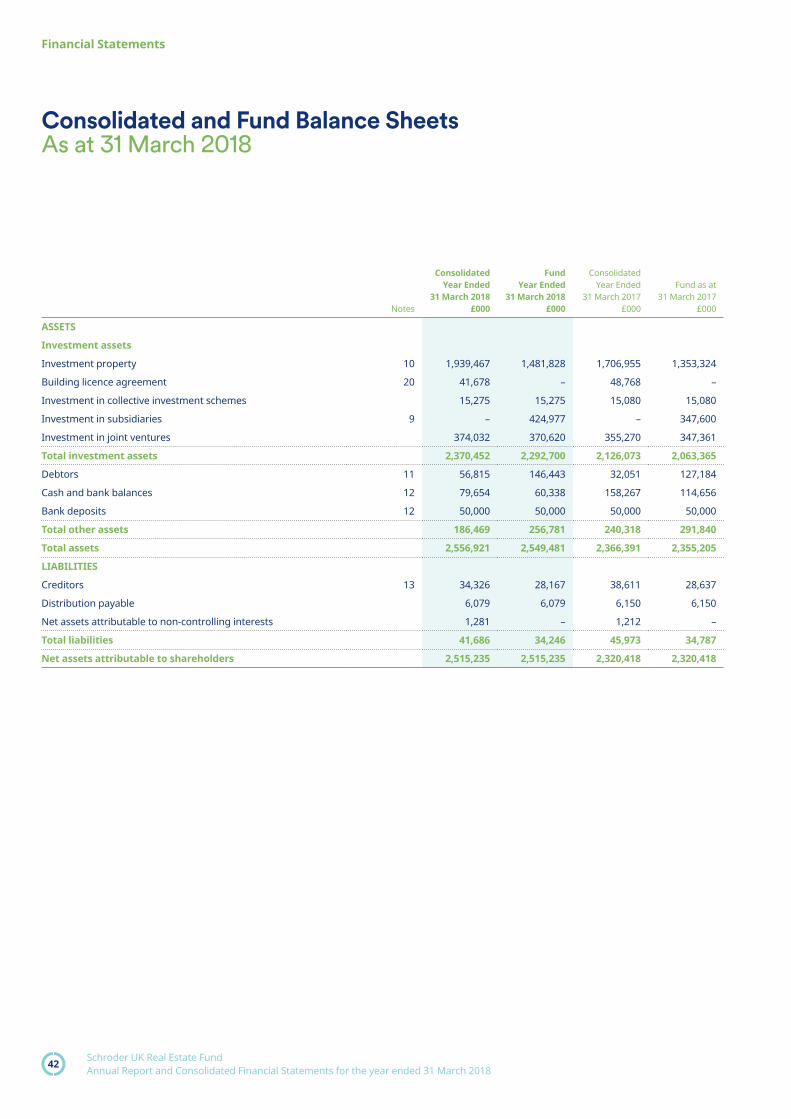
42 Schroder UK Real Estate FundAnnual Report and Consolidated Financial Statements for the year ended 31 March 2018
Financial Statements
Notes
Consolidated Year Ended
31 March 2018£000
Fund Year Ended
31 March 2018£000
Consolidated Year Ended
31 March 2017£000
Fund as at 31 March 2017
£000
ASSETS
Investment assets
Investment property 10 1,939,467 1,481,828 1,706,955 1,353,324
Building licence agreement 20 41,678 – 48,768 –
Investment in collective investment schemes 15,275 15,275 15,080 15,080
Investment in subsidiaries 9 – 424,977 – 347,600
Investment in joint ventures 374,032 370,620 355,270 347,361
Total investment assets 2,370,452 2,292,700 2,126,073 2,063,365
Debtors 11 56,815 146,443 32,051 127,184
Cash and bank balances 12 79,654 60,338 158,267 114,656
Bank deposits 12 50,000 50,000 50,000 50,000
Total other assets 186,469 256,781 240,318 291,840
Total assets 2,556,921 2,549,481 2,366,391 2,355,205
LIABILITIES
Creditors 13 34,326 28,167 38,611 28,637
Distribution payable 6,079 6,079 6,150 6,150
Net assets attributable to non-controlling interests 1,281 – 1,212 –
Total liabilities 41,686 34,246 45,973 34,787
Net assets attributable to shareholders 2,515,235 2,515,235 2,320,418 2,320,418
Consolidated and Fund Balance SheetsAs at 31 March 2018

43 Schroder UK Real Estate Fund Annual Report and Consolidated Financial Statements for the year ended 31 March 2018
OverviewStrategic ReportGovernanceFinancial Statements
Notes
Consolidated Year Ended
31 March 2018£000
Fund Year Ended
31 March 2018£000
Consolidated Year Ended
31 March 2017£000
Fund as at 31 March 2017
£000
Net cash inflow from operating activities 17 43,523 52,842 96,330 82,754
Interest received 11 3,134 97 4,785
Total cash generated from operating activities 43,534 55,976 96,427 87,539
Investing activities
Purchases of investments (48,776) (87,932) (46,697) (96,697)
Litigation proceeds 8,686 8,686 – –
Sales of investments 33,625 33,625 158,642 158,642
Capital expenditure (60,883) (9,874) (72,838) (18,731)
Net cash (used in)/from investing activities (67,348) (55,495) 39,107 43,214
Financing activities
Amounts received on issue of shares 25,967 25,967 29,853 29,853
Distributions paid (80,766) (80,766) (74,829) (74,829)
Net cash outflow from financing activities (54,799) (54,799) (44,976) (44,976)
(Decrease)/increase in cash in the year (78,613) (54,318) 90,558 85,777
Net cash at the start of the year 208,267 164,656 117,709 78,879
Net cash at the end of the year 16 129,654 110,338 208,267 164,656
Consolidated and Fund Cash Flow StatementsAs at 31 March 2018

44 Schroder UK Real Estate FundAnnual Report and Consolidated Financial Statements for the year ended 31 March 2018
Financial Statements
Notes to the Financial Statements
1. Accounting policies(a) Basis of accountingThe accounts have been prepared under the historic cost basis, as modified by the revaluation of investment assets, and in accordance with the Statement of Recommended Practice for UK Authorised Funds (‘SORP’) issued by the Investment Management Association (‘IMA’) in May 2014 and in accordance with the Scheme and the Collective Investment Scheme sourcebook and United Kingdom Generally Accepted Accounting Practice, including Financial Reporting Standard 102 (The Financial Reporting Standard Applicable in the UK and Republic of Ireland (FRS 102)).
ConsolidationConsolidated financial statements have been prepared in accordance with FRS 102 ‘Accounting for Subsidiary Undertakings’. The Consolidated Statement of Total Return, Consolidated Statement of Change in Net Assets Attributable to Shareholders’, Consolidated Balance Sheet and Consolidated Cash Flow Statement include the financial statements of each sub-fund and its subsidiary undertakings. Intra-Group transactions are eliminated fully on consolidation.
The interest of non-controlling interest shareholders in the acquiree is measured at their proportion of the net fair value of the assets, liabilities and contingent liabilities recognised.
Business combinationsBusiness combinations are accounted for by applying the purchase method. The cost of a business combination is the fair value of the consideration given, liabilities incurred or assumed and of equity instruments issued plus the costs directly attributable to the business combination. Where control is achieved in stages the cost is the consideration at the date of each transaction.
Going concernThe financial statements have been prepared on a going concern basis in accordance with the historical cost convention, as modified by the revaluation of investment asset, and in accordance with applicable United Kingdom accounting standards and the Prospectus.
The Authorised Corporate Director (‘ACD’) has examined significant areas of possible financial risk and has not identified any material uncertainties which would cast significant doubt on the Group’s and Fund’s ability to continue as a going concern for a period of not less than 12 months from the date of the approval of the consolidated financial statements. The ACD has satisfied themselves that the Group and Fund has adequate resources to continue in operational existence for the foreseeable future.
After due consideration, the ACD believes it is appropriate to adopt the going concern basis in preparing the consolidated financial statements.
Use of estimates and judgementsThe preparation of financial statements in conformity with FRS 102 requires management to make judgements, estimates and assumptions that affect the application of policies and the reported amounts of assets and liabilities, income and expenses. These estimates and associated assumptions are based on historical experience and various other factors that are believed to be reasonable under the circumstances, the results of which form the basis of making judgements about the carrying values of assets and liabilities that are not readily apparent from other sources. Actual results may differ from these estimates. The estimates and underlying assumptions are reviewed on an ongoing basis. Revisions to accounting estimates are recognised in the year in which the estimates are revised and in any future years affected.
The most significant estimates made in preparing these financial statements relate to the carrying value of investment properties, collective investment schemes and building licence agreements. The Group uses external professional valuers to determine the fair value of investment properties. Collective investment schemes are valued at the bid price as provided by the relevant managers and building licence agreements are fair valued using a discounted cash flow. Judgements made by management in the application of FRS 102 that have a significant effect on the financial statements and estimates with a significant risk of material adjustment in the next year are disclosed in note 20 under the heading ‘Fair value measurement’.
(b) Basis of valuation of investments(i) Properties owned by the Fund, including investments in properties owned through partnerships and trusts for land, are independently valued on
a market value basis in accordance with Royal Institute of Chartered Surveyors guidance. Development properties in the course of development are independently valued having regard to the stage reached in the construction and taking account of any agreed letting and of any contractual liabilities to advance further monies. Where legal completion of a purchase is not fully executed at the date of the Consolidated Balance Sheet, but takes place subsequently, or in the case of development properties purchased for development where no work has yet taken place, the property is shown at cost unless, in the opinion of the manager, there may be a material difference between cost and valuation on completion.
(ii) Collective investment schemes are valued at the bid price as provided by the relevant managers, in accordance with industry practice.(iii) Subsidiaries and joint ventures are valued at the net asset value (‘NAV’) price as provided by the relevant managers, which is the best estimate of
fair value in accordance with industry practice.(iv) Building licence agreements are fair valued using a discounted cash flow, based on valuations provided by the pricing risk department internally,
and approved by the Real Estate Local Pricing Committee.
(c) Property purchases and salesAcquisitions and disposals of investment properties and collective investment schemes are recognised where, by the end of the accounting period, there is a legally binding, unconditional and irrevocable contract.

45 Schroder UK Real Estate Fund Annual Report and Consolidated Financial Statements for the year ended 31 March 2018
OverviewStrategic ReportGovernanceFinancial Statements
(d) Recognition of revenue and expensesRental revenue, service charge revenue, deposit interest, income from collective investment schemes and other revenue is accounted for on an accruals basis. The cost of any upfront lease incentives offered is recognised as a reduction in rental income and allocated over the lease term. Service charge income and expenses are included in revenue and other property operating expenses respectively. Interest receivable and payable are accounted for on an accruals basis. Provisions for doubtful debts are taken as a reduction to rental revenue and recognised where debts are outstanding for greater than six months.
(e) Treatment of management expensesFees are recognised on an accruals basis and are charged in full to the Statement of Total Return. The Manager has allocated 50% of the management fees to income and the remaining 50% to capital for the calculation of distributable income.
(f) Treatment of development and acquisition expensesIn accordance with Generally Accepted Accounting Practice in the UK, development and acquisition expenses have been treated as costs of purchasing property investments and are accordingly treated as capital.
(g) Receivables and creditorsDebtors and creditors with no stated interest rate and receivable or payable within one year are recorded at transaction price. An impairment provision is created for receivables when there is objective evidence that the Group will not be able to collect in full.
(h) Intercompany loan receivablesIntercompany loan receivables are booked at fair value and subsequently measured at amortised cost using the effective interest method. An impairment provision is created for intercompany loan receivables where there is objective evidence that the Group will not be able to collect in full.
(i) Cash flow statementIn accordance with the requirements of FRS 102 (Revised) and the SORP as issued by IMA, a consolidated cash flow statement has been provided.
(j) TaxThe Fund qualifies as a Property Authorised Investment Fund (‘PAIF’) for tax purposes. Accordingly, the income generated by its property investment business will be exempt from tax. Any dividend income it receives from United Kingdom companies or, in general, from non-United Kingdom companies will also be exempt from tax.
The Fund would, however, be subject to corporation tax in the event that there should be a net balance of other income, which will generally consist of interest but could include other property income, less deductible expenses (including interest distributions).
Under the PAIF regulations, the Fund makes distributions gross to the sole share class in an issue during the year.
(k) Cash and cash equivalentsCash and cash equivalents include cash in hand, deposits held at call with banks, other short-term highly liquid investments with original maturities of three months or less.
2. Distribution policies(a) Basis of distributionRevenue is generated by the Fund’s investments during each accounting period. Where revenue exceeds expenses, the net income of the Fund is available to be distributed to shareholders. All income is distributed, at share class level, to the shareholders in accordance with the Fund’s Prospectus on a monthly basis. Income equalisation will not apply to the Fund as it is not a daily dealing Fund. Revenue attributable to accumulation shareholders is retained at the end of the distribution period and represents a reinvestment of revenue.
(b) Apportionment to multiple share classesThe allocation of revenue and expenses to each share class is based on the proportion of the Fund’s assets attributable to each share class on the day the revenue is earned or the expenses are suffered.
(c) ExpensesIn determining the net revenue available for distribution, expenses related to the purchase and sale of investments are capitalised and do not reduce distributions.
3. Risk management policies(a) Market risk and valuations of propertyThe exposure to market risk arising from the prevailing general economic conditions and market sentiment may affect the balance sheet and total return of the Fund. Immovable property and immovable property-related assets are inherently difficult to value due to the individual nature of each property. As a result, valuations are subject to uncertainty and are a matter of an independent valuer’s opinion. There is no assurance that the estimates resulting from the valuation process will reflect the actual sales price even where a sale occurs shortly after the valuation date.
Market risk is reduced through holding a geographically diversified portfolio that invests across various property sectors. The Manager adheres to the investment guidelines and investment and borrowing powers established in the Prospectus, scheme particulars and in the rules governing the operation of open-ended investment companies.
1. Accounting policies continued
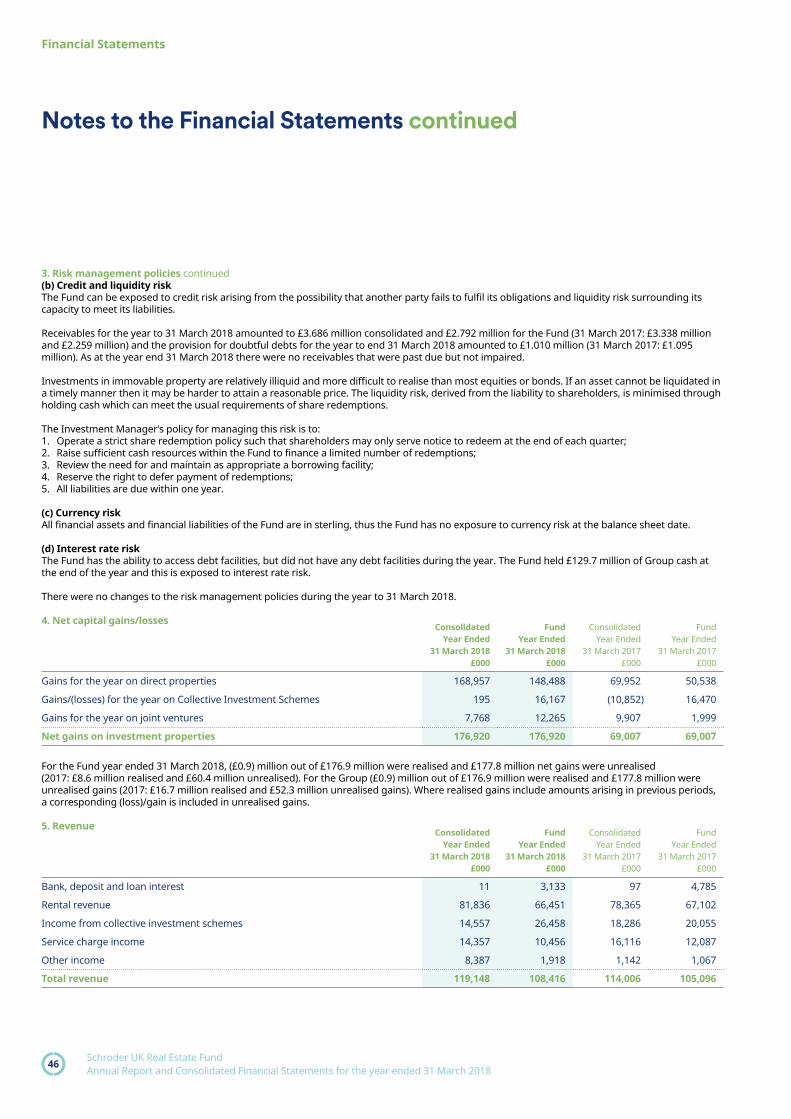
46 Schroder UK Real Estate FundAnnual Report and Consolidated Financial Statements for the year ended 31 March 2018
Financial Statements
3. Risk management policies continued(b) Credit and liquidity riskThe Fund can be exposed to credit risk arising from the possibility that another party fails to fulfil its obligations and liquidity risk surrounding its capacity to meet its liabilities.
Receivables for the year to 31 March 2018 amounted to £3.686 million consolidated and £2.792 million for the Fund (31 March 2017: £3.338 million and £2.259 million) and the provision for doubtful debts for the year to end 31 March 2018 amounted to £1.010 million (31 March 2017: £1.095 million). As at the year end 31 March 2018 there were no receivables that were past due but not impaired.
Investments in immovable property are relatively illiquid and more difficult to realise than most equities or bonds. If an asset cannot be liquidated in a timely manner then it may be harder to attain a reasonable price. The liquidity risk, derived from the liability to shareholders, is minimised through holding cash which can meet the usual requirements of share redemptions.
The Investment Manager’s policy for managing this risk is to:1. Operate a strict share redemption policy such that shareholders may only serve notice to redeem at the end of each quarter;2. Raise sufficient cash resources within the Fund to finance a limited number of redemptions;3. Review the need for and maintain as appropriate a borrowing facility;4. Reserve the right to defer payment of redemptions;5. All liabilities are due within one year.
(c) Currency riskAll financial assets and financial liabilities of the Fund are in sterling, thus the Fund has no exposure to currency risk at the balance sheet date.
(d) Interest rate riskThe Fund has the ability to access debt facilities, but did not have any debt facilities during the year. The Fund held £129.7 million of Group cash at the end of the year and this is exposed to interest rate risk.
There were no changes to the risk management policies during the year to 31 March 2018.
4. Net capital gains/lossesConsolidated
Year Ended 31 March 2018
£000
Fund Year Ended
31 March 2018£000
Consolidated Year Ended
31 March 2017£000
Fund Year Ended
31 March 2017£000
Gains for the year on direct properties 168,957 148,488 69,952 50,538
Gains/(losses) for the year on Collective Investment Schemes 195 16,167 (10,852) 16,470
Gains for the year on joint ventures 7,768 12,265 9,907 1,999
Net gains on investment properties 176,920 176,920 69,007 69,007
For the Fund year ended 31 March 2018, (£0.9) million out of £176.9 million were realised and £177.8 million net gains were unrealised (2017: £8.6 million realised and £60.4 million unrealised). For the Group (£0.9) million out of £176.9 million were realised and £177.8 million were unrealised gains (2017: £16.7 million realised and £52.3 million unrealised gains). Where realised gains include amounts arising in previous periods, a corresponding (loss)/gain is included in unrealised gains.
5. RevenueConsolidated
Year Ended 31 March 2018
£000
Fund Year Ended
31 March 2018£000
Consolidated Year Ended
31 March 2017£000
Fund Year Ended
31 March 2017£000
Bank, deposit and loan interest 11 3,133 97 4,785
Rental revenue 81,836 66,451 78,365 67,102
Income from collective investment schemes 14,557 26,458 18,286 20,055
Service charge income 14,357 10,456 16,116 12,087
Other income 8,387 1,918 1,142 1,067
Total revenue 119,148 108,416 114,006 105,096
Notes to the Financial Statements continued
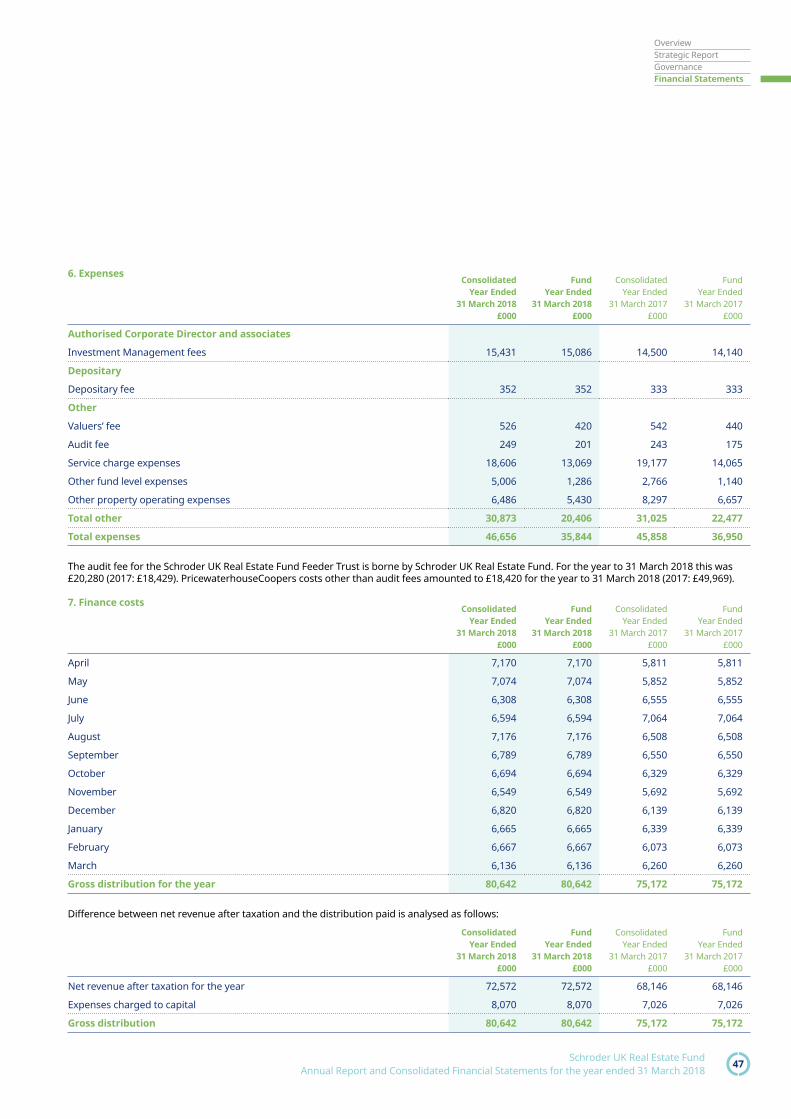
47 Schroder UK Real Estate Fund Annual Report and Consolidated Financial Statements for the year ended 31 March 2018
OverviewStrategic ReportGovernanceFinancial Statements
6. ExpensesConsolidated
Year Ended 31 March 2018
£000
Fund Year Ended
31 March 2018£000
Consolidated Year Ended
31 March 2017£000
Fund Year Ended
31 March 2017£000
Authorised Corporate Director and associates
Investment Management fees 15,431 15,086 14,500 14,140
Depositary
Depositary fee 352 352 333 333
Other
Valuers’ fee 526 420 542 440
Audit fee 249 201 243 175
Service charge expenses 18,606 13,069 19,177 14,065
Other fund level expenses 5,006 1,286 2,766 1,140
Other property operating expenses 6,486 5,430 8,297 6,657
Total other 30,873 20,406 31,025 22,477
Total expenses 46,656 35,844 45,858 36,950
The audit fee for the Schroder UK Real Estate Fund Feeder Trust is borne by Schroder UK Real Estate Fund. For the year to 31 March 2018 this was £20,280 (2017: £18,429). PricewaterhouseCoopers costs other than audit fees amounted to £18,420 for the year to 31 March 2018 (2017: £49,969).
7. Finance costsConsolidated
Year Ended 31 March 2018
£000
Fund Year Ended
31 March 2018£000
Consolidated Year Ended
31 March 2017£000
Fund Year Ended
31 March 2017£000
April 7,170 7,170 5,811 5,811
May 7,074 7,074 5,852 5,852
June 6,308 6,308 6,555 6,555
July 6,594 6,594 7,064 7,064
August 7,176 7,176 6,508 6,508
September 6,789 6,789 6,550 6,550
October 6,694 6,694 6,329 6,329
November 6,549 6,549 5,692 5,692
December 6,820 6,820 6,139 6,139
January 6,665 6,665 6,339 6,339
February 6,667 6,667 6,073 6,073
March 6,136 6,136 6,260 6,260
Gross distribution for the year 80,642 80,642 75,172 75,172
Difference between net revenue after taxation and the distribution paid is analysed as follows:
Consolidated Year Ended
31 March 2018£000
Fund Year Ended
31 March 2018£000
Consolidated Year Ended
31 March 2017£000
Fund Year Ended
31 March 2017£000
Net revenue after taxation for the year 72,572 72,572 68,146 68,146
Expenses charged to capital 8,070 8,070 7,026 7,026
Gross distribution 80,642 80,642 75,172 75,172

48 Schroder UK Real Estate FundAnnual Report and Consolidated Financial Statements for the year ended 31 March 2018
Financial Statements
8. TaxationThe Fund qualifies as a PAIF for tax purposes. Accordingly, the income generated by its real estate investment business will be exempt from tax. Any dividend income it receives from United Kingdom companies or, in general, from non-United Kingdom companies will also be exempt from tax.
The Fund would, however, be subject to corporation tax in the event that there should be a net balance of other income, which will generally consist of interest but could include other real estate income, less deductible expenses.
Under the PAIF regulations, the Fund makes real estate income distributions and interest distributions net of basic rate income tax except where the investor is entitled to gross payment. As at 31 March 2018 and 2017 the Fund had two authorised share classes: the gross share class on which distributions were made without deduction of income tax, and the net share class of which distributions were made with deduction of income tax.
(a) Analysis of charge in yearConsolidated
Year Ended 31 March 2018
£000
Fund Year Ended
31 March 2018£000
Consolidated Year Ended
31 March 2017£000
Fund Year Ended
31 March 2017£000
Analysis of charge in year – – – –
Corporation tax at 20% – – – –
Current tax charge – – – –
(b) Factors affecting the current tax charge for the yearTaxable income is charged at the standard rate of corporation tax for authorised funds (20%).
The reconciliation of the income statement tax charge to the standard rate on profits before tax is set out below:Consolidated
Year Ended 31 March 2018
£000
Fund Year Ended
31 March 2018£000
Consolidated Year Ended
31 March 2017£000
Fund Year Ended
31 March 2017£000
Total return before distribution 249,492 249,492 137,153 137,153
Corporation tax at 20% 49,898 49,898 27,431 27,431
Effects of:
Revenue not subject to taxation (49,898) (49,898) (27,431) (27,431)
Current tax charge – – – –
(c) Provision for deferred taxThere was no provision required for deferred tax at the balance sheet date.
9. Investment in subsidiariesOwnership by SREF at
31 March 2018%
Valuation at 1 April 2017
£000
Capital contributions
£000
Capital distributions
£000
Net capital gains/(losses)
£000
Valuation at 31 March 2018
£000
Croydon Gateway Unit Trust 99.4 211,746 – – 13,464 225,210
Hackbridge Unit Trust 99.0 48,866 – (7,556) 1,252 42,562
Lombard Street Unit Trust 99.0 33 – – (33) 0
Capital Point Slough Unit Trust 99.0 11,389 – – 450 11,839
Hackbridge Limited 100.0 – – – – –
MP Kings Lyric Sarl 100.0 45,226 20,296 – 5,216 70,738
MP Kings Retail Sarl 100.0 16,879 11,667 – 632 29,178
MP W6 Car Parks Ltd 100.0 13,461 – (10,826) (2,635) 0
Self-Storage Unit Trust 99.0 – 44,600 – 850 45,450
347,600 76,563 (18,382) 19,196 424,977
Notes to the Financial Statements continued

49 Schroder UK Real Estate Fund Annual Report and Consolidated Financial Statements for the year ended 31 March 2018
OverviewStrategic ReportGovernanceFinancial Statements
9. Investment in subsidiaries continuedAt 31 March 2018, SREF’s holding in each of Hackbridge Unit Trust (HackUT), Capital Point Slough Unit Trust (CPSUT) and Self-Storage Unit Trust (Self-Storage) stood at 99%. The Fund owns two shares in Hackbridge Limited representing 100.0% of the shares in issue. Hackbridge Limited is a Jersey-registered limited company incorporated on 1 May 2005. Hackbridge Limited holds the remaining 1.0% interests in HackUT and CPSUT. The Fund’s holding in Croydon Gateway Unit Trust stood at 99.4%, with a minority interest of 0.6% held by an external investor. The Fund holds 100% of the shares in MP Kings Lyric Sarl and MP Kings Retail Sarl, which are Luxembourg-registered companies, and 100% of the shares in MP W6 Car Parks Ltd which is a UK Registered Company.
On 8 August 2017, Self Storage Unit Trust was set up to acquire all the shares in Meadow Holdings Limited. These were acquired on 10 August 2017 for a consideration of £44.4 million. Meadow Holdings Limited owned five self-storage units across London and the South East. There was no goodwill recognised as the consideration equalled the fair value of the investment properties.
10. Investment propertyConsolidated Fund
Development Property
Investment Property
Development Property
Investment Property
Opening balance as at 1 April 2017 235,115 1,471,840 6,350 1,346,974
Glenthorne Road Car Park Inspecied – – – 10,888
Purchases – 44,772 – –
Disposals at cost (2,438) (28,330) (2,438) (28,330)
Additions to existing property 39,275 23,118 – 9,620
Unrealised gains 1,138 154,977 1,138 137,626
Transfer to investment property (217,265) 217,265 – –
Ending balance as at 31 March 2018 55,825 1,883,642 5,050 1,476,778
Unamortised tenant incentives – 11,296 – 8,487
Market valuation as at 31 March 2018 55,825 1,894,938 5,050 1,485,265
11. DebtorsConsolidated
Year Ended 31 March 2018
£000
Fund Year Ended
31 March 2018£000
Consolidated Year Ended
31 March 2017£000
Fund Year Ended
31 March 2017£000
Rent receivable net of provision for doubtful debts 3,686 2,792 3,338 2,259
Distributions due from property-related investments 3,920 5,525 3,113 5,935
Tenant deposits 5,082 4,977 5,431 5,326
Accrued rents receivable 6,102 6,169 4,340 4,436
Unamortised lease incentives 5,196 2,318 5,054 2,176
Monies due from managing agents 10,297 8,145 5,683 4,894
Intercompany loans and interest receivable – 97,989 – 98,438
VAT receivable 251 – – –
Monies due from associates – – 7 –
Other debtors and prepayments 22,281 18,528 5,085 3,720
Total debtors 56,815 146,443 32,051 127,184
Monies due from associates relates to loans between Croydon Gateway Limited Partnership and Ruskin Square Phase One LLP. Intercompany loans and interest receivable relate to loans between MP Kings Retail Sarl and MP Kings Lyric Sarl, and Schroder UK Real Estate Fund. The intercompany loans are repayable on demand. Interest rates are spilt into tranches of interest, ranging from LIBOR plus 2.5375% to 12%.

50 Schroder UK Real Estate FundAnnual Report and Consolidated Financial Statements for the year ended 31 March 2018
Financial Statements
12. Cash and bank balancesConsolidated
Year Ended 31 March 2018
£000
Fund Year Ended
31 March 2018£000
Consolidated Year Ended
31 March 2017£000
Fund Year Ended
31 March 2017£000
Cash and bank balances 79,654 60,338 158,267 114,656
Deposits 50,000 50,000 50,000 50,000
Total cash and bank balances 129,654 110,338 208,267 164,656
13. CreditorsConsolidated
Year Ended 31 March 2018
£000
Fund Year Ended
31 March 2018£000
Consolidated Year Ended
31 March 2017£000
Fund Year Ended
31 March 2017£000
Trade creditors 148 – 146 –
Deferred rental income 16,099 13,548 14,561 13,448
Tenant deposits 5,082 4,977 5,431 5,326
VAT payable – 857 1,585 1,500
Amounts due on properties 5,296 5,090 6,314 4,813
Accrued SREF investment management fee 1,673 1,673 1,420 1,420
Other creditors and accruals 6,028 2,022 9,154 2,130
Total creditors 34,326 28,167 38,611 28,637
14. Long-term liabilities – loansThe Fund has a £100 million loan facility with Royal Bank of Scotland. As at 31 March 2018 it has not drawn down any of this facility (31 March 2017: none).
15. Contingent liabilities and commitmentsNil as at 31 March 2018 (31 March 2017: nil).
16. Reconciliation of movement in net cashConsolidated
Year Ended 31 March 2018
£000
Fund Year Ended
31 March 2018£000
Consolidated Year Ended
31 March 2017£000
Fund Year Ended
31 March 2017£000
Cash and cash equivalents
As at 1 April 2017 208,267 164,656 117,709 78,879
(Decrease)/increase in cash (78,613) (54,318) 90,558 85,777
As at 31 March 2018 129,654 110,338 208,267 164,656
17. Reconciliation of net revenue before taxation to net cash inflow from operating activities
Consolidated Year Ended
31 March 2018£000
Fund Year Ended
31 March 2018£000
Consolidated Year Ended
31 March 2017£000
Fund Year Ended
31 March 2017£000
Net revenue before taxation 72,572 72,572 68,146 68,146
(Increase)/decrease in debtors (24,764) (19,259) 26,113 12,056
(Decrease)/increase in creditors (4,285) (471) 2,071 2,552
As at 31 March 2018 43,523 52,842 96,330 82,754
Notes to the Financial Statements continued

51 Schroder UK Real Estate Fund Annual Report and Consolidated Financial Statements for the year ended 31 March 2018
OverviewStrategic ReportGovernanceFinancial Statements
18. Related parties(a) Fees receivable by the DepositaryAs depositary, National Westminster Bank plc is entitled to a fee equivalent to 0.0224% per annum on the first £500 million of the Fund’s NAV and 0.0125% per annum on any excess over £500 million of the Fund’s NAV (2017: no change).
(b) Fees receivable by the ACD and the Investment ManagerThe remuneration of the ACD (Schroder Unit Trusts Limited) and the Investment Manager (Schroder Real Estate Investment Management Limited) is set out within the Company Prospectus. These fees are charged in full to the Statement of Total Return. 50% of such fees are allocated to capital and not deducted from distributions for the purpose of determining the value of such distributions.
The Investment Manager also earns commission from individual shareholders of the Company which utilise its matched bargain service. Such commission is not included in these financial statements.
(c) Outstanding balances were due to the following which are considered to be related parties:There is no difference between the Fund and the Consolidated level.
Consolidated and Fund as at 31 March 2018
£000
Consolidated and Fund as at 31 March 2017
£000
National Westminster Bank plc 57 28
Schroder Real Estate Investment Management Ltd 1,389 1,145
Schroder Unit Trusts Limited 284 275
(d) Distributions:Gross distributions were receivable in the year from the following investments which are considered related under FRS 102 as they are managed or administered by an associate of the ACD. There is no difference between the Fund and Consolidated level.
Consolidated and Fund as at 31 March 2018
£000
Consolidated and Fund as at 31 March 2017
£000
Bracknell Property Unit Trust 1,438 1,998
Croydon Gateway Property Unit Trust 12,224 1,172
Motor Retail Limited Partnership 1,797 1,787
Lombard Street Unit Trust – 1,424
Capital Point Slough Unit Trust 858 779
West End of London Property Unit Trust – 522
City Tower Unit Trust 2,960 4,099
Store Unit Trust 1,218 1,283
Gilbran Property Unit Trust 1,341 1,557
(e) Schroder UK Real Estate Fund Feeder TrustThe Manager of the Schroder UK Real Estate Fund Feeder Trust, which invests solely into the SREF, is part of the same group as the ACD of the SREF. During the year to 31 March 2018, the Schroder UK Real Estate Fund Feeder Trust was paid gross distributions totalling £12.1 million (2017: £4.9 million). The Schroder UK Real Estate Fund Feeder Trust incurred an audit fee during the year to 31 March 2018 of £20,280 (2017: £18,427), which is borne in full by the Schroder UK Real Estate Fund.
19. Financial instrumentsThe primary financial instruments held by the Fund and at a Group level at 31 March 2018 were property-related investments, cash, short-term assets and liabilities to be settled in cash. The Fund did not hold, and was not a counterparty to, any derivative instruments either during the year or at the year end.
The policies applied to the management of the financial instruments are set out in note 3. The fair values of the Fund’s and the Group’s assets and liabilities are represented by the values shown in the balance sheets on page 42. There is no material difference between the carrying value of the financial assets and liabilities, as shown in the balance sheets, and their fair value.

52 Schroder UK Real Estate FundAnnual Report and Consolidated Financial Statements for the year ended 31 March 2018
Financial Statements
2018Assets Level 1 Level 2 Level 3 Total
Collective investment schemes – – 15,275 15,275
Building licence agreement – – 41,678 41,678
Investment property – – 2,370,452 2,370,452
– – 2,427,405 2,427,405
2017Assets Level 1 Level 2 Level 3 Total
Collective investment schemes – – 15,080 15,080
Building licence agreement – – 48,768 48,768
Investment property – – 2,126,073 2,126,073
– – 2,189,921 2,189,921
Fair value measurementThe fair values of financial assets and liabilities are not materially different from their carrying values in the financial statements.The fair value hierarchy levels are as follows:Level 1 – quoted prices (unadjusted) in active markets for identical assets and liabilities;Level 2 – inputs other than quoted prices included within Level 1 that are observable for the asset or liability, either directly (i.e. as prices) or indirectly (i.e. derived from prices); andLevel 3 – inputs for the assets or liability that are not based on observable market data (unobservable inputs).
Investment property – Level 3Fair value is based on valuations provided by an independent firm of chartered surveyors and registered appraisers. These values were determined after having taken into consideration recent market transactions for similar properties in similar locations to the investment properties held by the Trust. The fair value hierarchy of investment property is Level 3.
Increases (decreases) in the ERV (per sq m p.a.) and rental growth p.a. in isolation would result in a higher (lower) fair value measurement. Increases (decreases) in the long-term vacancy rate and discount rate (and exit or yield) in isolation would result in a lower (higher) fair value measurement.
Collective investment schemes – Level 3The inputs for the values of the assets are not based on observable market data and are estimated using valuation techniques. These techniques rely on the underlying property valuations received from the independent valuers and the asset managers of the underlying funds. The fair value hierarchy of property-related investments is Level 3.
Building licence agreement – Level 3Fair value is based on valuations provided by the pricing risk department within Schroders, and approved by the Real Estate Local Pricing Committee. These values were determined after having taken into consideration the future value of capital and the interest rate and credit risk associated with the building licence. The fair value hierarchy of investment property is Level 3.
21. Portfolio transaction costs
£0002018
PurchasesStamp
duty %Legal
fees %Agents’
fees %Other
fees %Total costs %
Direct property – – – – – – – – – – –
Property holding vehicles – – – – – – – – – – –
Collective investment schemes 76,040 273 0.28 – – 250 0.26 – – 523 0.54
Joint ventures 20,042 – – – – – – – – – –
Total 96,082 273 – – 250 – – 523
Total including transaction costs 96,605
20. Fair value hierarchy
Notes to the Financial Statements continued

53 Schroder UK Real Estate Fund Annual Report and Consolidated Financial Statements for the year ended 31 March 2018
OverviewStrategic ReportGovernanceFinancial Statements
£0002018 Sales
Legal fees %
Agents’ fees %
Other fees %
Total costs %
Direct property 29,875 104 0.31 264 0.79 – – 368 1.1
Property holding vehicles – – – – – – – – –
Collective investment schemes – – – – – – – – –
Joint ventures 3,750 9 0.03 17 0.05 – – 26 0.08
Total 33,625 113 281 – – 394
Total including transaction costs 33,231
£0002017
PurchasesStamp
duty %Legal fees %
Agents’ fees %
Other fees %
Total costs %
Direct property – – – – – – – – – – –
Property holding vehicles – – – – – – – – – – –
Collective investment schemes 36,641 – – – – – – – – – –
Joint ventures 60,056 – – – – – – – – – –
Total 96,697
Total including transaction costs 96,697
£0002017 Sales
Legal fees %
Agents’ fees %
Other fees %
Total costs %
Direct property 53,141 102 0.19 738 1.39 4 0.01 844 1.59
Property holding vehicles 72,501 – – – – – – – –
Collective investment schemes – – – – – – – – –
Joint ventures 33,000 28 0.08 165 0.50 – – 193 0.58
Total 158,642 130 903 4 1,037
Total including transaction costs 157,605
Total direct transaction costs as a percentage of the Fund’s NAV is as follows:
Consolidated year ended 31 March 2018 0.036%
Schroder UK Real Estate Fund year ended 31 March 2018 0.015%
Consolidated year ended 31 March 2017 0.045%
Schroder UK Real Estate Fund year ended 31 March 2017 0.036%
No transaction costs were incurred on purchase or sales of collective investment schemes and joint ventures.
As at the balance sheet date the average portfolio dealing spread was 0.05% (2017: 0.05%).
22. Units in issue reconciliationNumber of units
in issue at 31.03.17
Number of units issued
Number of units redeemed
Number of units converted
Number of units in issue at
31.03.18
Schroder UK Real Estate Fund Gross units 48,736,612.23 538,724.30 – 91,045.77 49,366,382.30
Schroder UK Real Estate Fund Net units 4,667,133.82 20,087.44 – (91,045.77) 4,596,175.49
21. Portfolio transaction costs continued
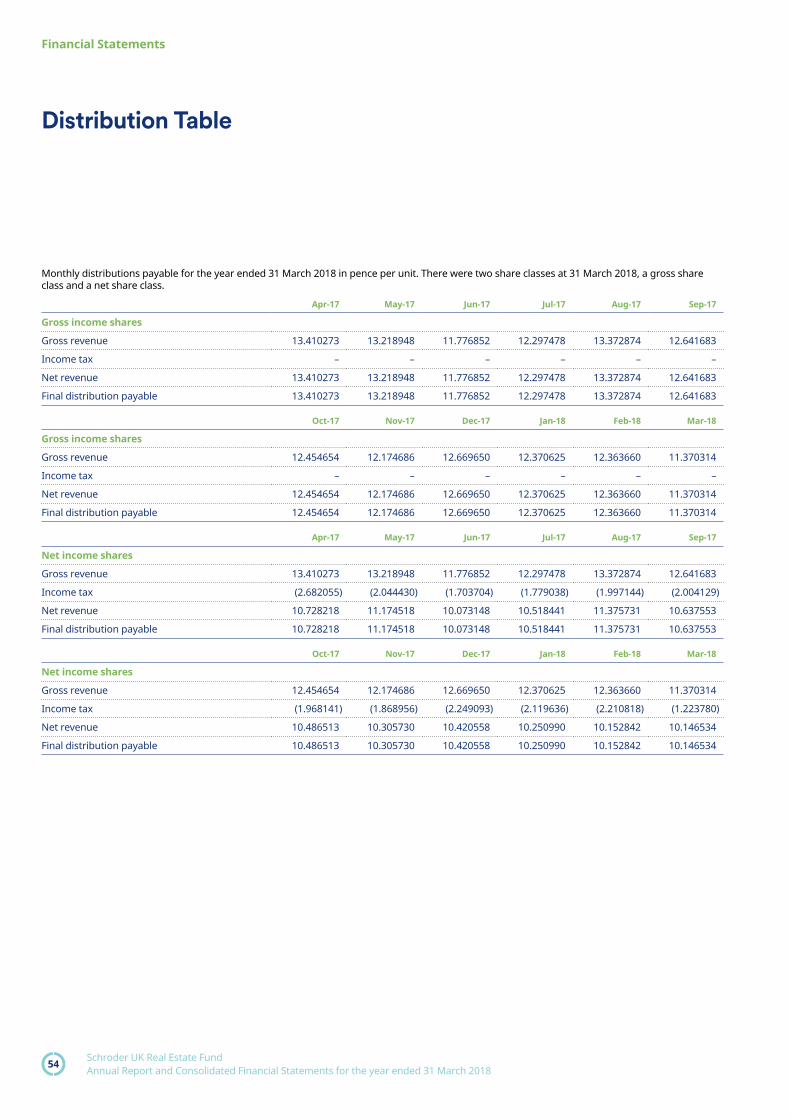
54 Schroder UK Real Estate FundAnnual Report and Consolidated Financial Statements for the year ended 31 March 2018
Financial Statements
Monthly distributions payable for the year ended 31 March 2018 in pence per unit. There were two share classes at 31 March 2018, a gross share class and a net share class.
Apr-17 May-17 Jun-17 Jul-17 Aug-17 Sep-17
Gross income shares
Gross revenue 13.410273 13.218948 11.776852 12.297478 13.372874 12.641683
Income tax – – – – – –
Net revenue 13.410273 13.218948 11.776852 12.297478 13.372874 12.641683
Final distribution payable 13.410273 13.218948 11.776852 12.297478 13.372874 12.641683
Oct-17 Nov-17 Dec-17 Jan-18 Feb-18 Mar-18
Gross income shares
Gross revenue 12.454654 12.174686 12.669650 12.370625 12.363660 11.370314
Income tax – – – – – –
Net revenue 12.454654 12.174686 12.669650 12.370625 12.363660 11.370314
Final distribution payable 12.454654 12.174686 12.669650 12.370625 12.363660 11.370314
Apr-17 May-17 Jun-17 Jul-17 Aug-17 Sep-17
Net income shares
Gross revenue 13.410273 13.218948 11.776852 12.297478 13.372874 12.641683
Income tax (2.682055) (2.044430) (1.703704) (1.779038) (1.997144) (2.004129)
Net revenue 10.728218 11.174518 10.073148 10.518441 11.375731 10.637553
Final distribution payable 10.728218 11.174518 10.073148 10.518441 11.375731 10.637553
Oct-17 Nov-17 Dec-17 Jan-18 Feb-18 Mar-18
Net income shares
Gross revenue 12.454654 12.174686 12.669650 12.370625 12.363660 11.370314
Income tax (1.968141) (1.868956) (2.249093) (2.119636) (2.210818) (1.223780)
Net revenue 10.486513 10.305730 10.420558 10.250990 10.152842 10.146534
Final distribution payable 10.486513 10.305730 10.420558 10.250990 10.152842 10.146534
Distribution Table

55 Schroder UK Real Estate Fund Annual Report and Consolidated Financial Statements for the year ended 31 March 2018
OverviewStrategic ReportGovernanceFinancial Statements
Monthly distributions payable for the year ended 31 March 2017 in pence per unit. There were two share classes at 31 March 2017, a gross share class and a net share class.
Apr-16 May-16 Jun-16 Jul-16 Aug-16 Sep-16
Gross income shares
Gross revenue 11.004453 11.066554 12.378785 13.327614 12.268514 12.336461
Income tax – – – – – –
Net revenue 11.004453 11.066554 12.378785 13.327614 12.268514 12.336461
Final distribution payable 11.004453 11.066554 12.378785 13.327614 12.268514 12.336461
Oct-16 Nov-16 Dec-16 Jan-17 Feb-17 Mar-17
Gross income shares
Gross revenue 11.909597 10.701801 11.531362 11.896267 11.387259 11.721422
Income tax – – – – – –
Net revenue 11.909597 10.701801 11.531362 11.896267 11.387259 11.721422
Final distribution payable 11.909597 10.701801 11.531362 11.896267 11.387259 11.721422
Apr-16 May-16 Jun-16 Jul-16 Aug-16 Sep-16
Net income shares
Gross revenue 11.004453 11.066554 12.378785 13.327614 12.268514 12.336461
Income tax (2.200891) (2.180332) (2.295769) (2.481258) (2.266076) (2.290947)
Net revenue 8.803562 8.886222 10.083016 10.846356 10.002438 10.045514
Final distribution payable 8.803562 8.886222 10.083016 10.846356 10.002438 10.045514
Oct-16 Nov-16 Dec-16 Jan-17 Feb-17 Mar-17
Net income shares
Gross revenue 11.909597 10.701801 11.531362 11.896267 11.387259 11.721422
Income tax (2.206599) (1.936133) (2.123936) (2.127374) (2.277452) (2.344284)
Net revenue 9.702998 8.765668 9.407426 9.768893 9.109807 9.377138
Final distribution payable 9.702998 8.765668 9.407426 9.768893 9.109807 9.377138

56 Schroder UK Real Estate FundAnnual Report and Consolidated Financial Statements for the year ended 31 March 2018
Financial Statements
Unaudited Environmental Data Report
SREF reports sustainability information in accordance with INREV Sustainability Reporting Guidelines 2016 (‘INREV sBR’). The following data covers the 12-month period to 31 March 2018 (‘2018’) and is compared with the data for the one-year period ending 31 March 2017 (‘2017’). As permitted by the INREV Sustainability Reporting Guidelines, environmental data has been developed and presented in line with the Global Real Estate Sustainability Benchmark (‘GRESB’).
The reporting boundary has been defined to where SREF has operational control: managed properties where SREF is responsible for payment of utility invoices and/or the
arrangement of waste disposal contracts.For 2018 there were 38 such managed assets within the portfolio, the same number as in the prior year. Changes between the two reporting periods were:— In 2017 two office assets were sold.— In 2018 one asset was sold and landlord
responsibility was gained for three buildings.
All managed assets are included within the below data for 2018. Historic consumption data have been restated where more complete and or accurate records have become available. Energy and water consumption data is reported according to automatic meter
Consumption data relates to the managed portfolio only.
— Offices, mixed use and industrials: whole building and/or vacant tenant areas.
— Retail, high street: external areas and/or vacant tenant areas.
— Retail shopping centre: common areas and/or tenant spaces.
— Retail warehouse: whole building, external areas and vacant tenant areas.
— Leisure: common parts and/or whole building.
Coverage relates to the number of managed assets for which data is reported.
— Offices: operational control returned to landlord at two offices in 2018. These both report data from late 2017 to end March 2018.
— Retail, high street: additional retail, high street asset reported in 2018. This covers tenant void data from November 2017 to 31 March 2018.
— Leisure: one leisure asset has not been included due to data inconsistencies.
Total electricity consumption (kWh) Total fuel consumption (kWh)Sector 2018 2017 2018 2017
Offices 12,394,877 14,845,458 7,119,112 8,987,153
Coverage 14 15 10 12
Retail, high street 88,395 87,691
Coverage 4 3
Retail shopping centre 1,494,219 1,934,567 49,755 41,226
Coverage 2 2 2 2
Retail warehouse 440,597 522,700 102,417 82,969
Coverage 5 5 1 1
Industrial, business parks 724,344 743,993 191,483 263,990
Coverage 3 3 2 3
Industrial, distribution warehouse 2,599,800 2,595,012 32,569 –
Coverage 4 4 1 0
Leisure 256,004 295,753 979,480 940,350
Coverage 1 1 1 1
Mixed use 5,281,273 5,417,893 42,810 230,482
Coverage 3 3 1 1
Total 23,279,510 26,443,067 8,517,626 10,546,169
Coverage 36 36 18 20
Total electricity and fuel 31,797,136 36,989,236
Coverage 37 37
Renewable electricity % 50% 54%
Coverage 37 37
reads, manual meter reads or invoice estimates. Where required, missing consumption data has been estimated by pro-rating data from other periods. This report has been prepared by Evora Global, SREF’s sustainability consultant.
Total energy consumptionThe table below sets out total landlord obtained energy consumption from SREF’s managed portfolio by sector.
— Where appropriate (for relevant assets), consumption data has been adjusted to reflect the Fund’s share of asset ownership.
— Renewable electricity (%) is calculated according to the attributes of energy supply contracts as at 31 March 2018 and only reflects renewable electricity procured under a 100% ‘green tariff’ (i.e. where generation is from 100% renewable sources). The renewables % of standard (non ‘green tariff’) energy supplies are not currently known and therefore has not been included within this number.

57 Schroder UK Real Estate Fund Annual Report and Consolidated Financial Statements for the year ended 31 March 2018
OverviewStrategic ReportGovernanceFinancial Statements
The table below sets out the like-for-like landlord obtained energy consumption from SREF’s managed portfolio by sector.
Like-for-like energy consumption
Like-for-like excludes assets that were purchased, sold or under refurbishment during the two years reported.
— Consumption data relates to the managed portfolio only:
— Offices, mixed use and industrials: whole building and/or vacant tenant areas.
— Retail, high street: external areas and/or vacant tenant areas.
— Retail shopping centre: common areas and/or tenant spaces.
— Retail warehouse: whole building, external areas and vacant tenant areas.
— Leisure: common parts and/or whole building.
Coverage relates to the number of managed assets for which data is reported.
— Coverage: one leisure asset has not been included due to data inconsistencies.
— Where appropriate (for relevant assets), consumption data has been adjusted to reflect the Fund’s share of ownership.
— Intensity: an intensity measure is reported for assets within the like-for-like portfolio. Normalisation uses the Real Estate Environmental Benchmark (‘REEB’) 2017 methodology, which also aligns with INREV sBPR 2016.
— Office, mixed use: whole building energy consumption divided by net lettable area (NLA m2).
Total electricity (kwh) Total fuels (kwh) Energy intensity (kwh/m2)Sector 2018 2017 Change 2018 2017 Change 2018 2017
Offices 9,903,985 11,280,268 (12%) 6,104,563 7,466,869 (18%) 302 354
Coverage 9 8
Retail, high street 19,074 18,360 4% N/A N/A
Coverage 2
Retail shopping centre 358,387 321,806 11% 12,150 13,226 (8%) 94 88
Coverage 1 1
Retail warehouse 418,903 499,550 (16%) 102,417 82,969 23% 146 170
Coverage 4 1
Industrial, business parks 663,795 715,008 (7%) 148,771 137,800 8% 4 6
Coverage 3 1
Industrial, distribution warehouse 2,599,800 2,595,012 0.2% 3 2
Coverage 4
Leisure 256,004 293,041 (13%) 870,837 848,760 3% 119 134
Coverage 1 1
Mixed use 5,351,830 5,259,801 (2%) 181 185
Coverage 2
Total 19,479,749 21,197,958 (8%) 7,238,739 8,549,623 (15%)
Coverage 26 12
Total electricity and fuel 26,718,488 29,624,498 (10%)
Coverage 27
— Retail warehouse: external areas energy consumption divided by the number of car park spaces.
— Leisure/shopping centres: common parts energy consumption divided by common parts area (m2). As common parts area is not typically measured and therefore known, we have taken the known net lettable area and applied an internal benchmark: 25% common part area for unenclosed centres and 35% for enclosed centres.
— Industrials: external areas energy consumption divided by external area (m2). As external areas are not typically measured and therefore known we have taken the known net lettable area and applied an internal benchmark: 58% external area.

58 Schroder UK Real Estate FundAnnual Report and Consolidated Financial Statements for the year ended 31 March 2018
Financial Statements
The table below sets out SREF’s greenhouse gas emissions by sector.
Greenhouse gas emissions
Absolute emissions (tonnes CO2e) Like-for-like emissions (tonnes CO2e) Intensity (kg CO2e/m2)Sector 2018 2017 2018 2017 Change 2018 2017
Office
Scope 1 1,311 1,655 1,124 1,375 (18%) 87 101
Scope 2 4,358 5,219 3,482 3,966 (12%)
Coverage 14 15 9 9
Retail, high street
Scope 1 – – – – – N/A N/A
Scope 2 31 31 7 6 4%
Coverage 4 3 2 2
Retail shopping centre
Scope 1 9 8 2 2 (8%) 32 30
Scope 2 525 680 126 113 11%
Coverage 2 2 1 1
Retail warehouse
Scope 1 19 15 19 15 23% 51 60
Scope 2 155 184 147 176 (16%)
Coverage 5 5 4 4
Industrial, business parks
Scope 1 35 49 27 25 8% 1.86 1.94
Scope 2 255 262 233 251 (7%)
Coverage 3 3 3 3
Industrial, distribution warehouse
Scope 1 – – – – N/A 3 4
Scope 2 914 912 914 912 0.2%
Coverage 4 4 4 4
Leisure
Scope 1 180 173 160 156 3% 46 51
Scope 2 90 104 90 103 (13%)
Coverage 2 2 2 2
Unaudited Environmental Data Report continued

59 Schroder UK Real Estate Fund Annual Report and Consolidated Financial Statements for the year ended 31 March 2018
OverviewStrategic ReportGovernanceFinancial Statements
Absolute emissions (tonnes CO2e) Like-for-like emissions (tonnes CO2e) Intensity (kg CO2e/m2)Sector 2018 2017 2018 2017 Change 2018 2017
Mixed use
Scope 1 8 42 – – – 97 98
Scope 2 1,857 1,905 1,849 1,881 (2%)
Coverage 3 3 2 2
Total
Scope 1 1,569 1,942 1,333 1,574 (15%)
Scope 2 8,184 9,296 6,848 7,409 (8%)
Scope 1 & 2 9,753 11,239 8,181 8,984 (9%)
Coverage 37 37 27 27
Greenhouse gas emissions
Methodology.
— Fuels/electricity GHG emissions factors taken from UK Government’s Greenhouse Gas Reporting Factors for Company Reporting (2017).
— GHG emissions from electricity (Scope 2) are reported according to the ‘location-based’ approach.
— GHG emissions are presented as kilograms of carbon dioxide equivalent (kg CO2e).
Emissions data relates to the managed portfolio only.
— Offices, mixed use and industrials: whole building and/or vacant tenant areas.
— Retail, high street: external areas and/or vacant tenant areas.
— Retail shopping centre: common areas and/or tenant spaces.
— Retail warehouse: whole building, external areas and vacant tenant areas.
— Leisure: common parts and/or whole building. One leisure asset has not been included due to data inconsistencies.
— Like-for-like excludes assets that were purchased, sold or under refurbishment during the two years reported.
— Where appropriate (for relevant assets), emissions data has been adjusted to reflect the Fund’s share of asset ownership.
— Coverage relates to number of managed assets for which data is reported.
Intensity: An intensity measure is reported for assets within the like-for-like portfolio. Normalisation uses the REEB 2017 methodology, which also aligns with INREV sBPR 2016.
— Office, mixed use: whole building energy consumption divided by net lettable area (NLA m2).
— Retail warehouse: external areas energy consumption divided by the number of car park spaces.
— Leisure/shopping centres: common
parts energy consumption divided by common parts area (m2). As common parts area is not typically measured and therefore known, we have taken the known net lettable area and applied an internal benchmark: 25% common part area for unenclosed centres and 35% for enclosed centres.
— Industrials: external areas energy consumption divided by external area (m2). As external areas are not typically measured and therefore known we have taken the known net lettable area and applied an internal benchmark: 58% external area.

60 Schroder UK Real Estate FundAnnual Report and Consolidated Financial Statements for the year ended 31 March 2018
Financial Statements
The table below sets out water consumption for assets managed by SREF.
Water
Absolute water consumption (m3) Like-for-like water consumption (m3) Intensity (m3/m2)Sector 2018 2017 2018 2017 Change 2018 2017
Office 59,955 66,140 52,320 50,922 3% 0.99 0.96
Coverage 11 13 9
Retail shopping centre 9,736 7,786 3,684 3,069 20% – –
Coverage 2 2 1
Retail warehouse 3,139 3,544 3,139 3,544 (11%) – –
Coverage 1 1 1
Industrial, business parks 494 534 494 534 (7%) – –
Coverage 2 2 2
Industrial, distribution warehouse 5,004 5,079 5,004 5,079 (1%) – –
Coverage 1 1 1
Leisure 11,199 12,618 1,218 1,284 (5%) 0.75 0.79
Coverage 2 2 1
Mixed use 14,863 15,928 14,650 15,330 (4%) 0.38 0.39
Coverage 3 3 2
Total 104,390 111,628 80,509 79,762 0.9%
Coverage 22 24 22
Unaudited Environmental Data Report continued
Consumption data relates to:
— Office, retail warehouse: whole building.
— Leisure, mixed use and retail shopping centre: whole building, and vacant tenant areas.
— Coverage: one leisure asset has not been included due to data inconsistencies.
— Industrials: common areas, external areas and vacant tenant areas
— Where appropriate (for relevant assets), consumption data has been adjusted to reflect the Fund’s share of ownership.
— Like-for-like excludes assets that were purchased, sold or under refurbishment during the two years reported.
Intensity: m3/m2 intensity is reported for assets within the like-for-like portfolio. Normalisation uses the REEB 2017 methodology.
— Office, mixed use: whole building consumption divided by NLA (NLA m3).
— Leisure: common parts consumption divided by common parts area (m3). As common parts area is not typically measured and therefore known, we have taken the known net lettable area and applied an internal benchmark: 25% common part area for unenclosed centres and 35% for enclosed centres.

61 Schroder UK Real Estate Fund Annual Report and Consolidated Financial Statements for the year ended 31 March 2018
OverviewStrategic ReportGovernanceFinancial Statements
The table below sets out waste managed by the Company by disposal route and sector.
Waste
Absolute tonnes Like-for-like tonnes2018 2017 2018 2017 % change
Tonnes % Tonnes % Tonnes % Tonnes %
Office
Recycled 381 50% 504 56% 379 51% 493 56% (23%)
Incineration with energy recovery 375 50% 395 44% 371 49% 383 44% (3%)
Landfill – – – – – – –
Total 755 899 750 876 (14%)
Coverage 7 7 6 6
Retail shopping centre
Recycled 121 38% 87 62% – – – – –
Incineration with energy recovery 197 62% 54 38% – – – – –
Landfill – – – – – – –
Total 317 141 – – –
Coverage 1 1
Retail warehouse
Recycled – – 0.2 14% – – – – –
Incineration with energy recovery – – 1 86% – – – – –
Landfill – – – – – – – – –
Total 1
Coverage 1
Industrial, business parks
Recycled 3 2% 3 2% 3 2% 2 2% 28%
Incineration with energy recovery 146 98% 132 98% 146 98% 132 98% 11%
Landfill – – – – – – – – –
Total 149 135 149 134 11%
Coverage 1 2 1 1
Leisure
Recycled 439 46% 460 48% 439 46% 460 48% (5%)
Incineration with energy recovery 507 54% 506 52% 507 54% 506 52% 0.2%
Landfill – – – – – – – – –
Total 946 966 946 966 (2%)
Coverage 2 2 2 2

62 Schroder UK Real Estate FundAnnual Report and Consolidated Financial Statements for the year ended 31 March 2018
Financial Statements
Absolute tonnes Like-for-like tonnes2018 2017 2018 2017 % change
Tonnes % Tonnes % Tonnes % Tonnes %
Mixed use*
Recycled 342 82% 136 63% 342 82% 136 63% 151%*
Incineration with energy recovery 78 18% 79 37% 78 18% 79 37% (1%)
Landfill – – – – – – – – –
Total 420 215 420 215 95%
Coverage 2 2 2 2
Overall total
Recycled 1,286 50% 1,191 51% 1,164 51% 1,092 49% 7%
Incineration with energy recovery 1,301 50% 1,167 49% 1,101 49% 1,099 51% 0.2%
Landfill – – – – –
Total 2,587 2,358 2,264 2,191 3%
Coverage 13 15 11 11
Unaudited Environmental Data Report continued
— Like-for-like excludes assets that were purchased, sold or under refurbishment during the two years reported.
— Coverage relates to the number of managed assets for which data is reported.
— Where appropriate (for relevant assets), consumption data has been adjusted to reflect the Fund’s share of asset ownership.
— Industrial, distribution warehouse has been excluded from waste reporting due to data inconsistencies with the one asset reporting in this sector.
— The Fund had no waste management responsibilities for retail warehouse in 2018.
Waste continued
* Waste data at mixed use asset was reported via a different data source until August 2016, which did not report on granular MRF breakdowns. Therefore, a significant increase in recycling tonnage is expected to be due to a change in data reporting format, rather than an actual increase in the tonnage.

63 Schroder UK Real Estate Fund Annual Report and Consolidated Financial Statements for the year ended 31 March 2018
OverviewStrategic ReportGovernanceFinancial Statements
Rating
Portfolio by floor area
(%)
BREEAM New Construction 10.80%
BREEAM Retail 0.32%
BREEAM Refurbishment and Fit Out 0.02%
Coverage 8
Energy Performance Certificate rating
Portfolio by floor area
(%)
A 3%
B 11%
C 26%
D 18%
E 8%
F 2%
G 2%
Exempt 11%
Coverage 81%
— Sustainability Certification records for the Fund are provided as at May 2018 against portfolio floor area for assets held at 31 March 2018.
— Data provided includes managed and non-managed assets (i.e. the whole portfolio).
— Where appropriate (for relevant assets), floor area coverage data has been adjusted to reflect the Fund’s share of ownership.
— Energy Performance Certificate records for the Fund are provided as at May 2018 against portfolio floor area for assets held at 31 March 2018.
— Data provided includes managed and non-managed assets (i.e. the whole portfolio).
— Where appropriate (for relevant assets), floor area coverage data has been adjusted to reflect the Fund’s share of asset ownership.
Sustainability Certification: BREEAM
Sustainability Certification: Energy Performance Certificates

64 Schroder UK Real Estate FundAnnual Report and Consolidated Financial Statements for the year ended 31 March 2018
Financial Statements
Unaudited General InformationComparative tableNet share class
Change in net assets per unit 2018 2017 2016
Opening net asset value per unit £43.45 £42.26 £39.26
Return before operating charges* £5.06 £2.94 £4.78
Operating charges (£0.40) (£0.34) (£0.34)
Return after operating charges* £4.66 £2.60 £4.44
Distribution on income units (£1.50) (£1.41) (£1.44)
Closing net asset value per unit £46.61 £43.45 £42.26
Retained distributions on accumulation units*after direct transaction costs of (£000) £0.02 £0.02 £0.10
Performance
Return after charges 10.9% 6.3% 11.5%
Other information
Closing net asset value (£000) £214,229,615 £202,767,150 £204,818,796
Closing number of units 4,596,175.49 4,667,133.82 4,846,288.68
Operating charges 0.86% 0.77% 0.80%
Direct transaction costs 0.04% 0.04% 0.25%
Prices
Highest unit price £46.61 £43.45 £42.51
Lowest unit price £43.47 £42.01 £39.59
Gross share class
Change in net assets per unit 2018 2017 2016
Opening net asset value per unit £43.45 £42.26 £39.26
Return before operating charges* £5.06 £2.94 £4.78
Operating charges (£0.40) (£0.34) (£0.34)
Return after operating charges* £4.66 £2.60 £4.44
Distribution on income units (£1.50) (£1.41) (£1.44)
Closing net asset value per unit £46.61 £43.45 £42.26
Retained distributions on accumulation units*after direct transaction costs of (£000) £0.02 £0.02 £0.10
Performance
Return after charges 10.9% 6.3% 11.5%
Other information
Closing net asset value (£000) £2,301,005,674 £2,117,650,777 £2,023,729,178
Closing number of units 49,366,382.30 48,736,612.23 47,884,159.21
Operating charges 0.86% 0.77% 0.80%
Direct transaction costs 0.04% 0.04% 0.25%
Prices
Highest unit price £46.61 £43.45 £42.51
Lowest unit price £43.47 £42.01 £39.59

65 Schroder UK Real Estate Fund Annual Report and Consolidated Financial Statements for the year ended 31 March 2018
OverviewStrategic ReportGovernanceFinancial Statements
Portfolio ProfileFor the years to 31 March 2018, 31 March 2017 and 31 March 2016, the Fund had two share classes: net and gross. These classes have price parity and the summary information in the table below applies to both class of shares.
As at/for the year to
31-Mar-18
As at/for the year to
31-Mar-17
As at/for the year to
31-Mar-16
Financial information
Gross asset value (GAV) £2,520.6m £2,326.7m £2,237.5m
Net asset value (NAV) £2,515.2m £2,320.4m £2,228.6m
NAV per share £46.61 £43.45 £42.26
Number of shares in issue 53,962,557.79 53,403,746.05 52,730,448.89
Gross annual distribution per share £1.50481 £1.41030 £1.44006
Distribution yield 3.20% 3.20% 3.40%
Total NAV of scheme property £2,381.3m £2,134.8m £2,119.0m
Highest price per share in the year £46.61 £43.45 £42.51
Lowest price per share in the year £43.47 £42.01 £39.59
Portfolio details
Gearing (% NAV) 0.30% 0.40% 1.30%
Average unexpired lease length to first break 8.1 years 8.0 years 6.2 years
Average unexpired lease length 9.1 years 8.9 years 7.5 years
Void rate 7.10% 6.20% 5.60%
Benchmark – void rate 7.10% 7.10% 6.70%
Net initial yield 4.60% 4.60% 4.70%
Reversionary yield 5.70% 6.10% 6.40%
Portfolio turnover ratio 3.20% 7.10% 13.00%
Performance
Annual total return 10.90% 6.30% 11.50%
Benchmark total return 10.00% 3.70% 10.60%
Total expense ratio 0.86% 0.84% 0.84%
Liquidity
Annual number of shares subscribed for 558,812 673,298 3,414,880
Annual value of subscriptions £26.0m £29.7m £147.0m
Annual number of shares redeemed 0 0 0
Annual value of shares redeemed 0 0 0
Annual number of shares matched on the secondary market 1,950,179 3,239,837 2,096,214

66 Schroder UK Real Estate FundAnnual Report and Consolidated Financial Statements for the year ended 31 March 2018
Financial Statements
Unaudited General Information continued
General InformationSCHRODER UK REAL ESTATE FUND (the ‘Fund’) is an investment company with variable capital incorporated in England and Wales under registered number IC000945 and authorised by the FCA with effect from 31 July 2012. The Fund has an unlimited duration. Shareholders are not liable for the debts of the Fund.
Accordingly, the information in this document is directed at eligible counterparties, authorised persons, professional clients, existing investors in the Fund and clients and newly accepted clients of other firms within the Schroder Group, where appropriate steps have been taken to ensure that investment in the Fund is suitable, where necessary. This material should not be relied upon by persons of any other description. In any case, a recipient who is in any doubt about investment in the Fund should consult an authorised person who specialises in investments of this nature.
The Fund’s past performance is not a guide to the future.
LiquidityThe Fund invests in real estate, the value of which is generally a matter of a valuer’s opinion. There is no recognised market for shares in the Fund and an investment is not readily realisable. It may be difficult to trade in the shares or to sell them at a reasonable price. The price of shares and the income from them may fluctuate upwards or downwards and cannot be guaranteed.
Purchase of sharesShares can be purchased in the Fund through the primary or secondary market. Depending on the type of investor, the purchase of shares will be through either the Schroder UK Real Estate Fund or the Schroder UK Real Estate Fund Feeder Trust. Corporate bodies (excluding nominees acquiring shares) may only invest in the Schroder UK Real Estate Fund indirectly through the Feeder Fund. Shares in the Schroder UK Real Estate Fund can be transferred between corporate and non-corporate bodies through the Feeder Fund on the secondary market.
The dealing day for subscription for shares is the first business day of each month. Application forms, top-up forms and cleared funds must be received by the Registrar before the cut-off point for subscriptions. Forms received after this time will be carried forward to the following dealing day for subscription. Applicants may amend or withdraw an application form or a top-up form at any time up until the cut-off point for subscriptions. Thereafter, applicants have no right to amend or withdraw their application. Settlement is due by midday on the business day before the relevant dealing day for subscription.
Applicants are required to transfer funds via CHAPS or another form of electronic payment unless the Registrar agrees to an alternative method of payment. The Investment Manager has the power to limit the creation of new shares having regard to the amount of unallocated cash being held in the Fund from time to time.
Details of how the investor waiting list is managed can be found in the SREF Prospectus in section 2.1. These are summarised below:
Applicants may be placed on a waiting list prior to the issue of shares. The ACD may elect to limit the number of shares issued on any dealing day for subscription, and if so, shares will be allocated to valid applicants pro rata to the number of shares applied for. Where applicants do not receive shares to satisfy their full application the unallocated application will be carried forward to the next dealing day for subscription at which shares are issued.
Where the issue of shares is limited at any dealing day for subscriptions, applicants may instruct the ACD to seek to arrange for the shortfall in the application to be met on the secondary market for such time until the next dealing day for subscription.
If the shortfall in shares applied for is not met on the secondary market, shares will be issued in line with the allocation made at the dealing day for subscription on which shares are issued, with orders carried over from previous dealing days taking priority.
Redemption of sharesRedemption forms must be received by the Registrar before the relevant cut-off point for redemptions, that is midday on the date falling three months prior to the business day before the relevant dealing day for redemption. Once a redemption form has been received, this can be settled either by cancelling shares or placing on the secondary market. Either way, redeeming shareholders will receive the prevailing bid price. Valid instructions will be processed by the Registrar at the bid price on the relevant dealing day for redemption (that falls three months after the relevant cut-off point for redemption), except in the case where dealing has been suspended as set out in section 2.21 of the Prospectus.
Where the ACD considers it to be in the best interests of the shareholders, the ACD may defer redemptions on a dealing day to any one or more of the subsequent eight dealing days for redemption i.e. the deferral period is a maximum of 24 months from the original dealing day for redemption. A redemption will be deferred within this timeline to a dealing day for redemption when the Fund has sufficient liquidity to enable it to meet the redemption, providing it is in the best interests of the shareholders to do so.
The ACD can, in extreme market circumstances, as set out within section 6.5 of the Prospectus, fair value any assets within the Fund to a realisable value.
There were no redemption notices received at 31 March 2018 that were not settled. Further, there were no suspension of valuations and/or redemptions at 31 March 2018.
Secondary marketThe ACD has appointed the Secondary Market Facilitator, (‘SMF’) (Schroder Real Estate Investment Management Limited) to facilitate transfers of shares on the secondary market in accordance with the following:
— Shareholders or potential investors wishing to buy shares on the secondary market should complete an application form (potential investors) or top-up form (existing shareholders), detailing their secondary market requirement in the investment details section;
— Shareholders wishing to sell shares should complete a redemption form specifying they wish to sell via the secondary market. All completed forms should be provided to the SMF via the Registrar; and
— Potential investors should also provide the Registrar with any documents required for anti-money laundering purposes. The forms are available from www.schroders.com/sref or from the Investment Manager.
The SMF will not charge a redeeming shareholder commission, but the redeeming shareholder will be responsible for costs in connection with the transfer of its shares such as the preparation and execution of relevant documentation and any taxation.
The SMF, at its discretion, has the right to charge the buyer commission at a rate of 0.20% applied to the net consideration, subject to a minimum of £50 for each and every trade. Where applicable, stamp duty reserve tax is payable by the buyer on the net consideration at the prevailing rate.

67 Schroder UK Real Estate Fund Annual Report and Consolidated Financial Statements for the year ended 31 March 2018
OverviewStrategic ReportGovernanceFinancial Statements
2009
2008
2018
2017
2016
2015
2014
2013
2012
2011
2010
13.4
55.9
102.1
135.2
86.4
97.1
157.6
100.6
50.7
64.9
82.8
Year ended 31 March – Value of units traded (£m)
The SMF operates a share matching service between sellers and buyers of shares. A waiting list of sellers and buyers is kept and matching operated on the following basis:
a. First, price: shares available from sellers seeking the lowest price per share will be offered to buyers by order of the date of receipt of the relevant form.
b. Second, notification date: where there are multiple sellers looking to sell for any given price, preference will be given to sellers by order of the date of receipt of the relevant form.
Where there are multiple buyers looking to buy at the same price, for which relevant forms were received on the same date, matching will be allocated pro rata to the number of shares applied for. In all cases matching will be allocated subject to any minimum trade requirements stipulated by a party.
The SMF, when matching shares, may apply a minimum economic trade at its discretion which is shares to the value of £50,000 or such other amount as the SMF determines from time to time.
The SMF will arrange the exchange of shares between sellers and buyers in the first 12 business days of every month. The SMF will contact the seller and buyer to obtain confirmation that the terms of the arrangement are acceptable before proceeding with the transaction. The seller and buyer are required to confirm acceptance of the terms by return email within 24 hours.
Investors may wish to note that other matching services are provided by third-party brokers. All trades are, however, subject to registration on the terms set out above.
DistributionsThe income of the Fund, after deduction of all expenses and liabilities (actual, estimated or contingent) of the Fund including any deductions in respect of taxes, is distributed to shareholders in proportion to the number of shares held by them. Distributions are calculated on a monthly basis, with the distributions paid to shareholders on the last working day of the following month.
During the period all distributions were paid gross of UK tax to investors in the gross share class and net of the applicable UK basic rate income tax to investors in the net share class.
The Prospectus does not provide the ability for either the ACD or Investment Manager to defer or suspend distributions.
Schroder UK Real Estate Fund Feeder TrustThe Schroder UK Real Estate Fund Feeder Trust is an umbrella unit trust whose objective is to achieve a blend of income and capital growth by investing solely in the Schroder UK Real Estate Fund. Investors into the Feeder Trust receive monthly distributions. The Feeder Trust is subject to corporation tax on property and interest distributions it receives from the Schroder UK Real Estate Fund at a rate of 20%.
Management fees and other expensesDetails of fees and expenses incurred by the Fund are set out within Section 5 of the Fund Prospectus and further in notes 6 and 18 of the audited Report and Financial Statements. In summary:
From 1 October 2017 the Annual Management Charge was 0.70% NAV per annum. For prior periods, the Annual Management Charge was 0.30% of NAV and 0.40% of the gross asset value (GAV) of directly held property and capital monies, made up of 0.05% of NAV payable to the ACD and 0.25% of NAV and 0.40% of GAV payable to the Investment Manager. The new fee rate is the same as the prior effective fee rate and consequently the Financial Conduct Authority agreed that no investor approval was required.
The Annual Management Charge is allocated 50% to income and 50% to capital.
The Depositary receives 0.0224% per annum of the first £500 million of NAV and 0.0125% of the balance.
The Standing Independent Valuer will receive an initial fee of 0.03% of the first valuation of a property on purchase, capped at £20,000, and thereafter a fee of 0.03% of the valuation per annum.
The Registrar is paid a transaction-based fee subject to a minimum of £75,000 per annum.
The Investment Manager bears the cost of employing managing agents to collect rents and perform the usual property manager’s duties as delegated by the Investment Manager.
Bid/offer spreadsAs at 31 March 2018, the offer spread was set at a 3.77% premium to NAV. The bid spread was set at a 1.59% discount to NAV. Our key principles when setting bid and offer prices are to review prices regularly, to treat shareholders equitably and to adopt a consistent approach.
Our assumption, when calculating the offer price, is that new money will be invested in line with strategy, principally into direct property at full purchase cost. An allowance is made for capital expenditure to maintain the existing portfolio. Capital expenditure may vary from time to time. The bid price assumes full sale costs are incurred on direct assets, while indirect assets are marked to market. Cash is priced at a zero spread.
Fees payable to the ManagerDuring the past year, Schroder Real Estate has been entitled to receive fees of £162,211 in relation to its role as Secondary Market Facilitator. Schroder Real Estate has an agreement with GFI Brokers Limited to share all fees earned on secondary market transfers facilitated by either party.
Units valued at £102.1 million were traded on the secondary market over the 12-month period. This represents 4.1% of the shares in issue at the end of the period under review.
Expense ratios (as defined by AREF Code of Practice) at March 2018Fees and expenses % NAV(A) Fund Management Fees 0.72%(B) Fund Operating Fees 0.14%(C) Total Expense Ratio (A+B) 0.86%(D) Property Expense Ratio 0.52%(E) Real Estate Expense Ratio (C+D) 1.38%(F) Transaction Costs 0.04%(G) Performance Fees N/A%
68 Schroder UK Real Estate FundAnnual Report and Consolidated Financial Statements for the year ended 31 March 2018
Financial Statements
Insurance and service charge rebatesThe managing agents, as employed by the Investment Manager, receive service charge remuneration as part of their overall remuneration. Insurance commission rebates (if any) are calculated on an annual basis and distributed to tenants and shareholders as applicable.
Valuation and pricing policyA detailed explanation of our pricing methodology is contained within the Prospectus and further information is available upon request from the Investment Manager. The Fund Prospectus, along with the notes to the financial statements, sets out:
— the methodology used to value the properties and other investments of the Fund; and
— the valuation of direct properties having to be undertaken monthly.
It should further be noted that the Fund’s investment in the UK Retail Warehouse Fund is held at a stale price one month in arrears on account of the receipt of the NAV of this investment being received after the valuation date of the Fund.
Co-investmentThere are no express terms in the Fund’s Prospectus concerning shareholders’ rights over co-investments. However, the Manager’s policy is to treat all investors fairly and, at its discretion, it may offer shareholders the opportunity to participate in co-investments.
Key personsThere are no named key individuals.
Preferential terms and fee rebatesSREF’s management fee is applied at the same rate to all shareholders and no rebates of this fee have been agreed with any investor.
Capital gains tax (‘CGT’)Following detailed consultation with the real estate industry, an announcement issued by HMRC in early July 2018 provided further guidance on the proposals to introduce CGT for non-UK resident investors in UK commercial real estate from April 2019. Schroders has taken a leading role in discussions with the government, and while we have yet to see the final legislation as it affects real estate funds, the intended outcome of policymakers appears to be in line with the industry’s preferred outcome. As a Property Authorised Investment Fund, SREF is not directly impacted by these regulations, although these proposals would ensure that investors in SREF do not suffer double taxation on the sale of properties which are owned by SREF through offshore holding vehicles after April 2019. Schroders does not provide tax advice and investors should seek advice from professional advisers.
Fund documentationA copy of all Fund documentation including the Prospectus and regular reports is available at www.schroders.com/sref or available from the Investment Manager upon request.
A copy of Schroders’ AAF controls report which has been externally audited is available from the Investment Manager upon request.
Conflicts of interestThe Investment Manager is responsible for identifying all conflicts of interest and for referring such matters to Schroder Group Compliance or such other parties in accordance with the Group’s conflict of interest policy.
Disaster recoveryThe Schroder Group has a disaster recovery plan which is audited, externally, on an annual basis as part of the AAF controls report.
AREF Code of PracticeThe Fund is a member of the Association of Real Estate Funds (‘AREF’). The aim of the Code of Practice is to achieve high standards of transparency across the unlisted sector and promote consistency of reporting to allow investors to compare different funds. The Fund completes the AREF/IPD Pooled Property Questionnaire each quarter, which is made available to all investors and which forms the basis of its entry in IPD Property Fund Vision handbook. SREF’s page on the AREF website can be found at www.aref.org.uk/funds/schroder-uk-real-estate-fund
During 2017 the Manager completed and submitted the annual self-certification form to AREF to confirm that SREF is in compliance with the latest AREF Code of Practice. The Investment Manager believes that this Report and the Financial Statements, together with supporting documents referred to herein, achieve the AREF standard of best practice for reporting.
In June 2018 AREF introduced a Kitemark to provide assurance to investors that AREF members are in compliance with the Code of Practice. We are pleased to attach the Kitemark to the Annual Report and Accounts.
Fund codesGross share classBloomberg: SCEXPUT LNISIN: GB00B8215Z66Sedol: B8215Z6
Net share classISIN: GB00B8FPXR30Sedol: B8FPXR3
Prices for the Schroder UK Real Estate Fund can be obtained from www.schroders.com/sref
Additional informationThe Fund may be suitable for professional investors who wish to hold a direct property portfolio but do not want to commit the considerable executive time and expertise necessary to organise and supervise such a portfolio and/or are not of a sufficient size to obtain a viable property portfolio with an appropriate spread of risk. The property in the Fund is professionally and actively managed by chartered surveyors employed by the Investment Manager, Schroder Real Estate Investment Management Limited.
We welcome the opportunity to meet shareholders, potential shareholders and their advisers to explain more fully the strategy and progress of the Fund. Please contact the Investment Manager, who can also provide copies of the Prospectus, application forms and latest share prices, at the address on the opposite page.
Unaudited General Information continued

69 Schroder UK Real Estate Fund Annual Report and Consolidated Financial Statements for the year ended 31 March 2018
OverviewStrategic ReportGovernanceFinancial Statements
Schroder UK Real Estate FundSchroder Real Estate Investment Management Limited31 Gresham StreetLondon EC2V 7QATel: +44 (0)20 7658 6000
Schroder Real Estate Investment Management Limited is authorised and regulated by the Financial Services Authority.
In August 2018, Schroder Real Estate Investment Management Limited will move to 1 London Wall Place, London EC2M 5PP. Schroders phone numbers and other contact details will remain unchanged.
Manager contactsFor general information and queries on secondary market availability, please contact:
Tom DoreyHead of Real Estate [email protected]: +44 (0)20 7658 3020
James LassFund [email protected]: +44 (0)20 7658 3980
Jessica BerneyDeputy Fund [email protected]: +44 (0)20 7658 3728
For valuations, to place trades, tax reclaims, dividend/distribution information, please contact the Registrar:
Northern Trust Global Services Ltd. Schroder Unit Trusts Limited Schroder UK Real Estate FundPO Box 3733Wootton BassettSwindonSN4 4BGTel: +44 (0)870 870 8059Fax: +44 (0)20 7643 [email protected]
70 Schroder UK Real Estate FundAnnual Report and Consolidated Financial Statements for the year ended 31 March 2018
Financial Statements
Key Service Providers
Authorised Corporate DirectorSchroder Unit Trusts Limited 31 Gresham StreetLondon EC2V 7QA
Investment ManagerSchroder Real Estate Investment Management Limited31 Gresham Street LondonEC2V 7QA
Schroder Unit Trusts Limited and Schroder Real Estate Investment Management are authorised and regulated by the FCA.
RegistrarNorthern Trust Global Services Limited 50 Bank StreetCanary Wharf LondonE14 5NT
DepositaryNational Westminster Bank plc 280 Bishopsgate London EC2M 4RB
Standing Independent ValuersBNP Paribas Real Estate Advisory & Property Management Limited90 Chancery LaneLondon WC2A 1EU
Knight Frank LLP 55 Baker Street LondonW1U 8AN
Legal AdviserEversheds LLP One Wood StreetLondonEC2V 7WS
Independent AuditorsPricewaterhouseCoopers LLP 7 More London RiversideLondonSE1 2RT
Real Estate ManagersJones Lang LaSalle Austin HouseSt Crispens Road NorwichNR3 1YF
Knight Frank LLP55 Baker Street LondonW1U 8AN
The terms of all appointments including remuneration and termination provisions can be made available upon request.

71 Schroder UK Real Estate Fund Annual Report and Consolidated Financial Statements for the year ended 31 March 2018
OverviewStrategic ReportGovernanceFinancial Statements
Fund Structure at 31 March 2018
49 Directly Owned
Properties
Schroder UK Real Estate Fund
Feeder Trust
Schroder UK Real Estate Fund
(Property Authorised Investment Fund)
100.0%
Hackbridge Unit Trust*
100.0%
One property
Self-Storage Unit Trust*
100.0%
Five properties
MP Kings Lyric
100.0%
One property
MP Kings Retail
100.0%
One property
Capital Point Slough Unit
Trust*
100.0%
One property
Croydon Gateway Property
Unit Trust
99.4%
One property
Bracknell Property
Unit Trust
50.0%
One property
West India Quay Unit
Trust
50.0%
One property
Motor Retail Limited
Partnership
50.0%
14 properties
Store Unit Trust
50.0%
One property
City Tower Unit Trust
50.0%
One property
Gilbran Property
Unit Trust
50.0%
13 properties
City of London Office
Unit Trust
25.0%
One property
York – Monks Cross
(Trust for Land)
25.0%
One property
TH Retail Warehouse
Fund
2.2%
13 properties
* Unit Trusts owned by two unitholders: SREF (99.0%) and British Overseas Nominees Limited, acting as SREF’s nominee (1.0%).

72 Schroder UK Real Estate FundAnnual Report and Consolidated Financial Statements for the year ended 31 March 2018
Financial Statements
Notes


Schroder UK
Real Estate Fund Annual Report and C
onsolidated Financial Statements for the year ended 31 M
arch 2018
Schroder Investment Management Limited31 Gresham Street, London EC2V 7QA, United KingdomTel: +44 (0)20 7658 6000

Schroder UK
Real Estate Fund Annual Report and C
onsolidated Financial Statements for the year ended 31 M
arch 2018