Embed Size (px)
Citation preview

1
School Turnaround EffortsWhat’s Been Tried, Why Those Efforts Failed, and What to Do Now
July 2019
Brian Backstrom

2
ABOUT THE AUTHORS
Brian Backstrom is director of education policy studies at the Rockefeller Institute of Government
3
No one likes bad schools. Yet the public policy response to fixing failing public schools has a track record little better than the performance of those schools themselves.
Over the past half-century, billions of dollars have been spent across the nation on efforts to transform persistently low-performing public schools — most of them urban, most of them low-income, and most of them disproportionately enrolled with students of color — into models of success. It hasn’t worked.
No school should be allowed to ever become “persistently failing” or to continue to exist that way. Serious underperformance in a school’s student achievement typically grows from a pattern of smaller, earlier problems that are — or can be — routinely detected and often are widely known. Left unfixed, however, these deficiencies grow to deprive children of a basic quality education for decades. In these instances, the fix needs to be as radical as the problem. Policymakers opting to avoid rocking the boat enact education “reforms” that, by design, provide at best only marginal and temporary improvement. Bold problems require bold solutions.
The failure of attempts to remedy the state of urban public education across the nation has led some reformers to call for a sweeping closure of low-performing schools. Often, however, school closures have been carried out without first assuring that each displaced child has a better choice of school available, and sometimes such policies have resulted in students actually being relegated to worse-performing schools than they were previously attending.
All this needs to change if schoolchildren are to be better served.
School Turnaround EffortsWhat’s Been Tried, Why Those Efforts Failed, and What to Do Now
4
While a tremendous amount of taxpayer and private philanthropic money has been spent on attempts to transform failing schools into something better, the vast majority of these attempts have failed because they lacked three criteria fundamental for the program to be a success:
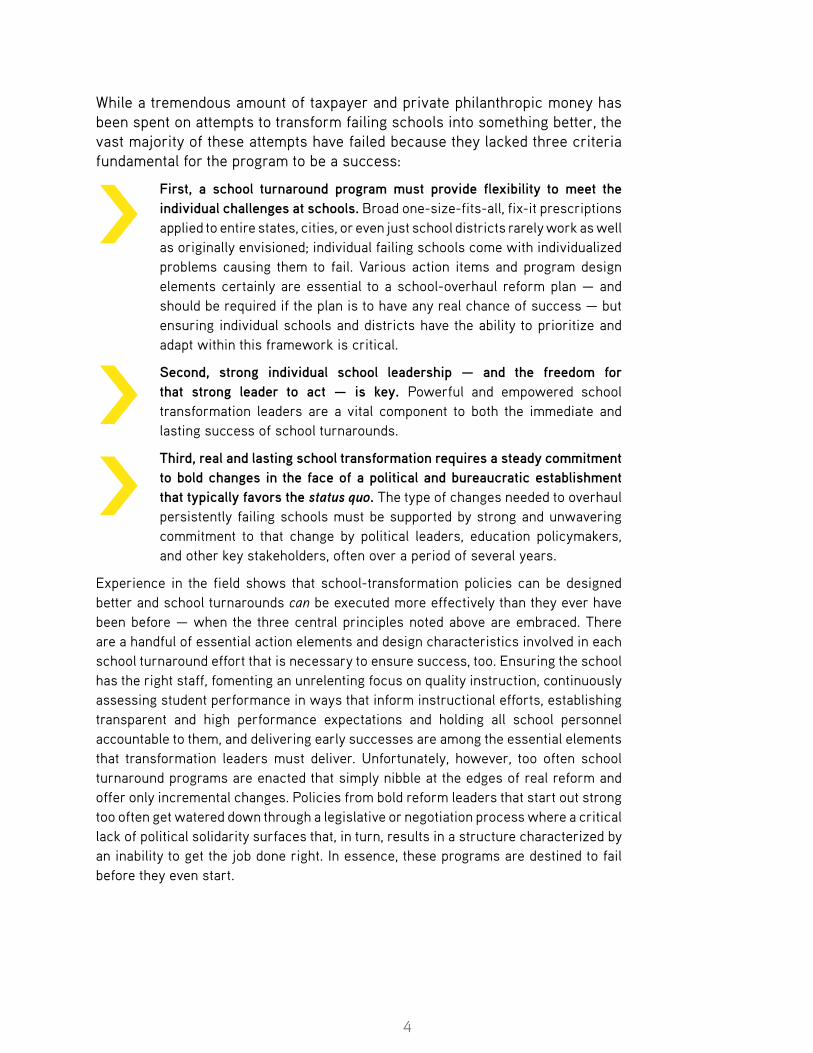
First, a school turnaround program must provide flexibility to meet the individual challenges at schools. Broad one-size-fits-all, fix-it prescriptions applied to entire states, cities, or even just school districts rarely work as well as originally envisioned; individual failing schools come with individualized problems causing them to fail. Various action items and program design elements certainly are essential to a school-overhaul reform plan — and should be required if the plan is to have any real chance of success — but ensuring individual schools and districts have the ability to prioritize and adapt within this framework is critical.
Second, strong individual school leadership — and the freedom for that strong leader to act — is key. Powerful and empowered school transformation leaders are a vital component to both the immediate and lasting success of school turnarounds.
Third, real and lasting school transformation requires a steady commitment to bold changes in the face of a political and bureaucratic establishment that typically favors the status quo. The type of changes needed to overhaul persistently failing schools must be supported by strong and unwavering commitment to that change by political leaders, education policymakers, and other key stakeholders, often over a period of several years.
Experience in the field shows that school-transformation policies can be designed better and school turnarounds can be executed more effectively than they ever have been before — when the three central principles noted above are embraced. There are a handful of essential action elements and design characteristics involved in each school turnaround effort that is necessary to ensure success, too. Ensuring the school has the right staff, fomenting an unrelenting focus on quality instruction, continuously assessing student performance in ways that inform instructional efforts, establishing transparent and high performance expectations and holding all school personnel accountable to them, and delivering early successes are among the essential elements that transformation leaders must deliver. Unfortunately, however, too often school turnaround programs are enacted that simply nibble at the edges of real reform and offer only incremental changes. Policies from bold reform leaders that start out strong too often get watered down through a legislative or negotiation process where a critical lack of political solidarity surfaces that, in turn, results in a structure characterized by an inability to get the job done right. In essence, these programs are destined to fail before they even start.
>
>>
5
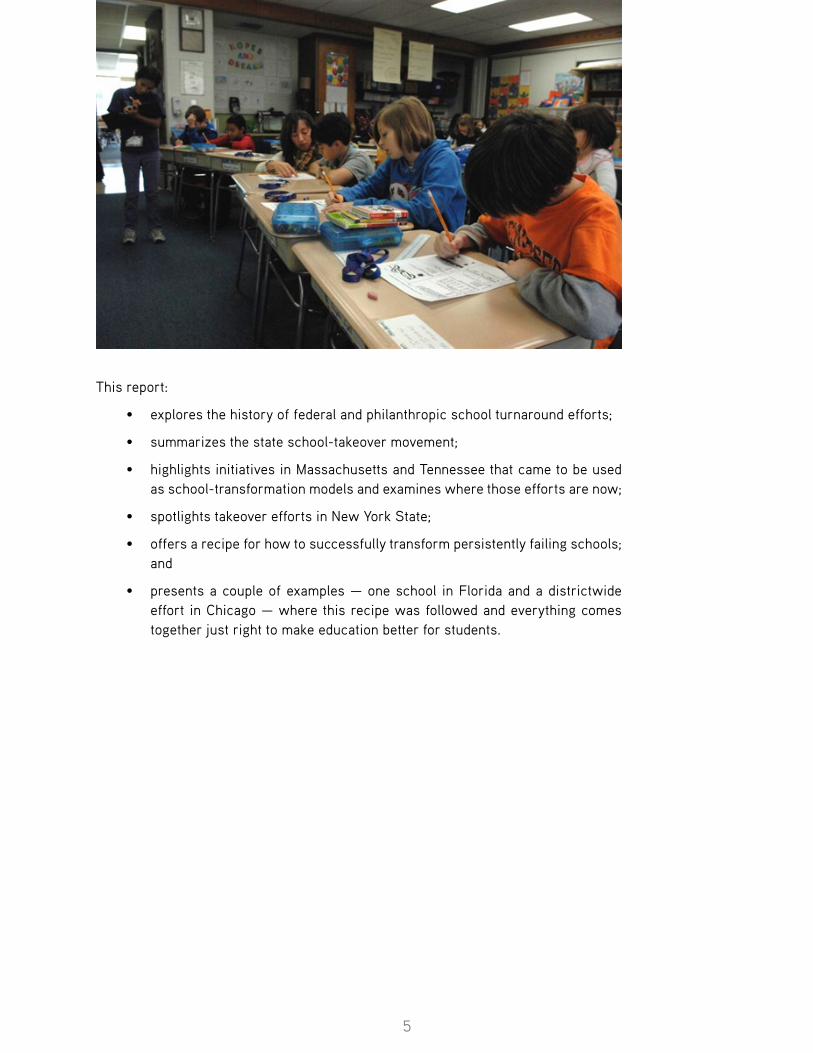
This report:
• explores the history of federal and philanthropic school turnaround efforts;
• summarizes the state school-takeover movement;
• highlights initiatives in Massachusetts and Tennessee that came to be used as school-transformation models and examines where those efforts are now;
• spotlights takeover efforts in New York State;
• offers a recipe for how to successfully transform persistently failing schools; and
• presents a couple of examples — one school in Florida and a districtwide effort in Chicago — where this recipe was followed and everything comes together just right to make education better for students.
6
A Failure of Billions: 50 Years of Costly School Turnaround AttemptsEfforts over the past 50 years to turn low-performing, high-poverty schools into models of achievement have not succeeded — whether through the infusion of billions of dollars in federal government programs from the Elementary and Secondary Education Act to the School Improvement Grant (SIG) program; or by billions more in incentivized philanthropic investments by some of country’s largest private foundations; or by smaller state-level innovations. Each of these efforts failed because they did not require those in charge of failing schools to make the bold changes needed to quickly improve; did not empower transformative leaders with the authority and freedom to take these actions; eroded the political and public support for the dramatic and ongoing changes that were necessary; or some combination of all of these. These attempts are explored below.
The Federal School Turnaround Kick-Off: Elementary and Secondary Education Act of 1965
The Elementary and Secondary Education Act (ESEA), signed by President Lyndon Johnson in 1965, marks the first significant federal effort to improve educational outcomes for disadvantaged students.1 Based on the principle of redress, the educational pillar of the administration’s “War on Poverty” initiative massively increased federal spending on schools serving high concentrations of low-income students, and the new Title I provision allocated $1 billion in new spending to these schools.2
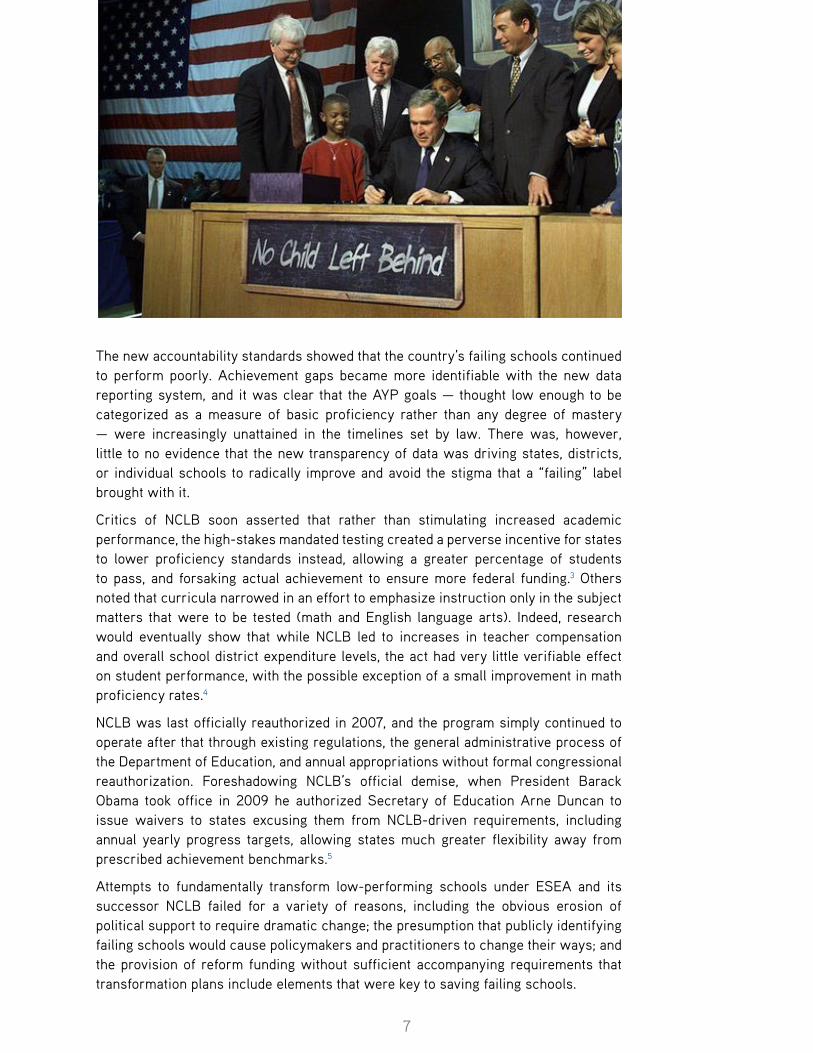
ESEA was scheduled to be reauthorized every five years, providing federal lawmakers a regular opportunity to review and modify the law. Probably the most notable reauthorization of the act came in 2001 when, largely in response to the lack of improvement in targeted schools over the prior 35 years, President George W. Bush spearheaded a significant policy overhaul and added substantial new accountability provisions to the act. Renamed the No Child Left Behind Act (NCLB), this iteration expanded the target population beyond economically disadvantaged students to those defined to be “at-risk” of failing. Importantly, NCLB required states to administer annual mathematics and English language arts assessments for all students in grades 3 through 8 as a requirement to be eligible to receive Title I federal funding. A primary intent of these assessment requirements was that the public reporting of achievement scores would spur transparency, instill accountability, and motivate improvement. Annual yearly progress (AYP) thresholds became a metric for determining state progress based on student test scores, with sanctions to be imposed if goals were unmet. Additionally, states and districts began publishing disaggregated results to better track the performance of student subgroups, such as low-income and ethnic minority students.
7
The new accountability standards showed that the country’s failing schools continued to perform poorly. Achievement gaps became more identifiable with the new data reporting system, and it was clear that the AYP goals — thought low enough to be categorized as a measure of basic proficiency rather than any degree of mastery — were increasingly unattained in the timelines set by law. There was, however, little to no evidence that the new transparency of data was driving states, districts, or individual schools to radically improve and avoid the stigma that a “failing” label brought with it.
Critics of NCLB soon asserted that rather than stimulating increased academic performance, the high-stakes mandated testing created a perverse incentive for states to lower proficiency standards instead, allowing a greater percentage of students to pass, and forsaking actual achievement to ensure more federal funding.3 Others noted that curricula narrowed in an effort to emphasize instruction only in the subject matters that were to be tested (math and English language arts). Indeed, research would eventually show that while NCLB led to increases in teacher compensation and overall school district expenditure levels, the act had very little verifiable effect on student performance, with the possible exception of a small improvement in math proficiency rates.4
NCLB was last officially reauthorized in 2007, and the program simply continued to operate after that through existing regulations, the general administrative process of the Department of Education, and annual appropriations without formal congressional reauthorization. Foreshadowing NCLB’s official demise, when President Barack Obama took office in 2009 he authorized Secretary of Education Arne Duncan to issue waivers to states excusing them from NCLB-driven requirements, including annual yearly progress targets, allowing states much greater flexibility away from prescribed achievement benchmarks.5
Attempts to fundamentally transform low-performing schools under ESEA and its successor NCLB failed for a variety of reasons, including the obvious erosion of political support to require dramatic change; the presumption that publicly identifying failing schools would cause policymakers and practitioners to change their ways; and the provision of reform funding without sufficient accompanying requirements that transformation plans include elements that were key to saving failing schools.
8
Private Philanthropy Takes a Shot at School Turnarounds
Over the past quarter-century, the philanthropic community has become particularly active in education reform, including in efforts to stimulate the transformation of poorly performing schools. Philanthropic foundations — notably those run by Walter Annenberg, Bill and Melinda Gates, Eli Broad, and the Walton Family — have made extensive contributions to research, program design, and implementation to school turnaround efforts. Despite the funders’ best intentions, however, for the most part these efforts also failed to broadly stimulate the improvement of persistently failing public schools.
The Annenberg Challenge
One of the largest and earliest public-private endeavors at school turnarounds came in 1993 with the announcement of the Annenberg Challenge. Rooted in the idea that reform innovation needed to be stimulated and supported by an infusion of funding, the Challenge aimed to create systemic change through community-based efforts. A $500 million gift from Walter H. Annenberg, publishing mogul of TV Guide and Philadelphia Inquirer fame and the US Ambassador to the United Kingdom under President Richard Nixon, jumpstarted the project. The program sought to spur systemic change and improve the worst schools in America, with grants going to the nine largest city school systems in a five-year cycle from 1995 to 2000.6
Each site created an evaluation plan designed to measure the impact of the Challenge’s theory of change, including on student outcomes, instructional practices, and school culture. Ultimately, the Challenge was a failure, creating the envisioned local support only in a few places and resulting in little to no improvements in student achievement. For example, a final report summarizing the impact of the Chicago Annenberg Challenge program, a collaborative that received an initial $49.2 million investment and was led by a handful of local leaders including then-attorney Barack Obama, noted: “The Challenge had little impact on school improvement and student outcomes, with no statistically significant differences between Annenberg and non-Annenberg schools in rates of achievement gain, classroom behavior, student self-efficacy, and social competence.”7
Despite little to no improvement in persistently failing schools, the overall expenditure of more than a billion dollars under the Annenberg Challenge framework did result in a few lessons learned about why the effort failed. First, there was not enough support from program managers given to those implementing the effort on the ground. This lack of guidance and community created a gap between original design and implementation. Second, the lack of oversight of the implementation of the program limited its impact. With few strings or stipulations attached to the funding, and in a system of collaboration, this led to weak implementation and accountability.8 Third, the structure of the Challenge was too diffuse.9 The Challenge sites had big money trying
Philanthropic foundations have made extensive contributions to school turnaround efforts. Despite the funders’ best intentions, however, for the most part these efforts failed to broadly stimulate the improvement of persistently failing public schools.
9
to tackle an even bigger job. Funding was quickly absorbed by the school districts and spread across a large city school district, diluting the goals of the program.10 Sites were stretched too thin, weakening the impact of their programs.
Bill and Melinda Gates Foundation’s Small Schools Initiative
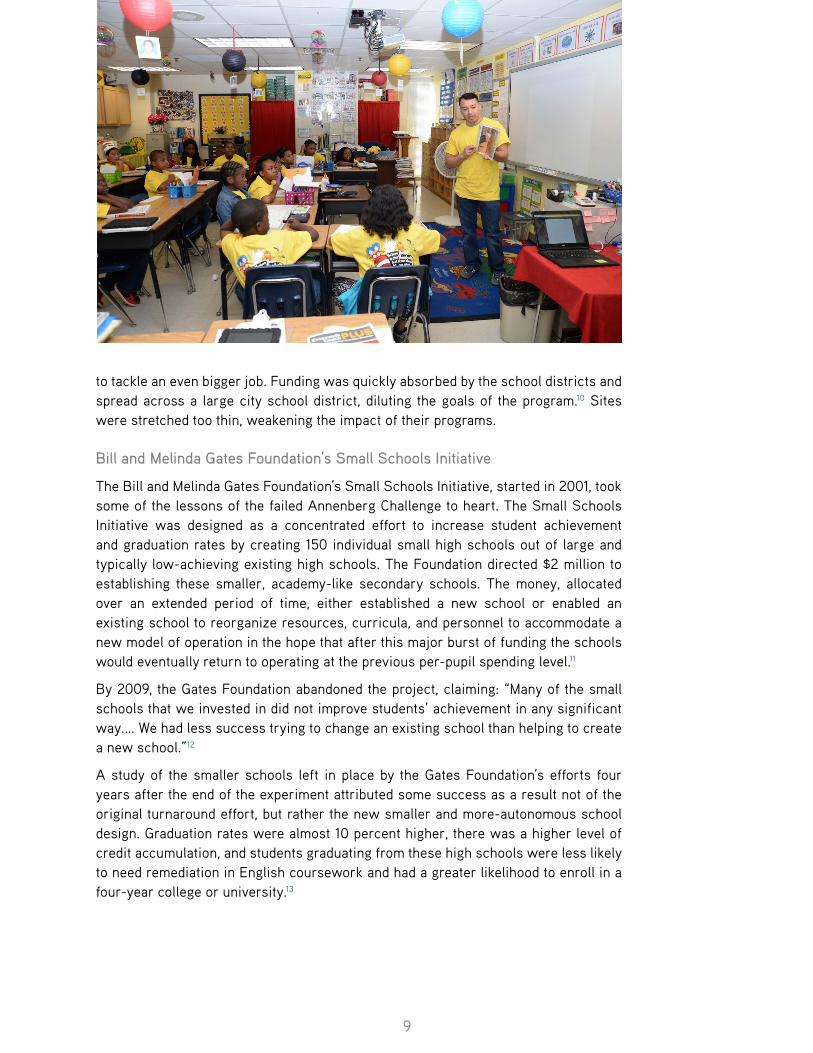
The Bill and Melinda Gates Foundation’s Small Schools Initiative, started in 2001, took some of the lessons of the failed Annenberg Challenge to heart. The Small Schools Initiative was designed as a concentrated effort to increase student achievement and graduation rates by creating 150 individual small high schools out of large and typically low-achieving existing high schools. The Foundation directed $2 million to establishing these smaller, academy-like secondary schools. The money, allocated over an extended period of time, either established a new school or enabled an existing school to reorganize resources, curricula, and personnel to accommodate a new model of operation in the hope that after this major burst of funding the schools would eventually return to operating at the previous per-pupil spending level.11
By 2009, the Gates Foundation abandoned the project, claiming: “Many of the small schools that we invested in did not improve students’ achievement in any significant way.… We had less success trying to change an existing school than helping to create a new school.”12
A study of the smaller schools left in place by the Gates Foundation’s efforts four years after the end of the experiment attributed some success as a result not of the original turnaround effort, but rather the new smaller and more-autonomous school design. Graduation rates were almost 10 percent higher, there was a higher level of credit accumulation, and students graduating from these high schools were less likely to need remediation in English coursework and had a greater likelihood to enroll in a four-year college or university.13

10
Broad Prize
In 2002, philanthropist Eli Broad announced an annual competition with a $1 million prize to any urban district that could show that it more effectively educated low-income minority students. Each year, the Eli and Edythe Broad Foundation would narrow the competitors down to four finalists, and then undertake a rigorous examination of each district’s data: (1) on student demographics and other basic information about the district and its students; (2) on its academic performance levels and improvement on state standard tests, including proficiency and advanced proficiency trends, achievement gap calculations, and comparisons of district and state performance; and (3) on its performance and improvement in college-readiness measures, including high school graduation rates and SAT/ACT scores and participation rate.14
Hoping that the richly rewarded competition would stimulate urban school districts to improve, Broad singlehandedly funded the prizes for more than a decade.
In February 2015, the Broad Foundation announced that it was suspending the prize indefinitely, with a New York Times article noting that the Foundation “cannot find school districts doing enough good work to merit the award.”15 The Foundation’s chief communications officer said that Broad “wanted the prize to mean something,” and reported that the lack of progress in urban public schools so disappointed the selection committee that not a single urban school district met its standard for recommendation. In 2014, only two school districts met the cut and they split the prize.16 The program, along with one recognizing excellence in the public charter school sector, was officially and finally discontinued in 2019.
These benevolent privately funded programs failed to achieve the envisioned large-scale fixes for failing schools, finding that simple financial incentives alone — no matter how generous — could not stimulate the political or policy support necessary to enact and sustain the bold, transformative changes to an entrenched educational bureaucracy that students truly needed.

11
Federal School Improvement Grant Program
The School Improvement Grant program was first created in 2002 as part of President George W. Bush’s landmark No Child Left Behind Act, the reincarnation of the original federal Elementary and Secondary Education Act. The SIG program component was not funded by Congress until 2007, however, and then only at a fairly insignificant — at least relative to typical nationwide education spending programs — $125 million.
In 2009, all that changed.
The signature program of his first two months in office, President Barack Obama won congressional approval for a massive “stimulus package,” officially the American Recovery and Reinvestment Act (ARRA), which called for a 10-year $800 billion-plus spending plan designed to address the country’s recessionary woes. Approximately $100 billion of that total was earmarked for new education spending, including $3 billion for efforts to turn around failing schools added to existing programmatic spending of more than $500 million. This new spending marked the largest investment in school-turnaround strategies in the country’s history, and the rollout of the revitalized SIG program by US Secretary of Education Arne Duncan personally provided the policy with its highest national profile up to that point in time.
It wasn’t just the overall funding of the SIG program that was huge; individual schools would get grants of as much as $2 million each year for three years.17
The Prescription
The program charged states with identifying the lowest-performing, persistently failing 5 percent of low-income schools (defined as schools that receive Title I funds), and selecting them for a turnaround effort. For the first round of grants, states could distribute through local school districts up to $2 million per school, subject to a competitive grant application process. The competition was designed to identify the worst-performing schools that demonstrated the greatest chance of rapidly improving student academic performance.18
TABLE 1. Federal School Improvement Grant Funding
Federal Fiscal Year Appropriations
FFY 2007 $125,000,000
FFY 2008 $491,265
FFY 2009 — Regular appropriations: $546,000,000
FFY 2009 — ARRA investment: $3,000,000,000
FFY 2010 $546,000,000
FFY 2011 $535,000,000
FFY 2012 $523,120,801
FFY 2013 $505,756,165
FFY 2014 $505,756,000
SIG Program Total: $6,287,124,231
SOURCE: U.S. Department of Education, Office of Elementary and Secondary Education, at https://www2.ed.gov/programs/sif/funding.html.

12
Districts were required to select one of four prescribed reform models (listed here from least radical to most radical reform type) for grant-receiving schools:
1. Transformation model: Replace the principal; develop a teacher-and-leader evaluation system that considers student progress; introduce significant instructional reforms; increase learning time; and provide flexibility and support.
2. Turnaround model: Replace the principal and no less than 50 percent of the staff; introduce significant instructional reforms; increase learning time; and provide flexibility and support.
3. Restart model: Reopen the school under the management of a charter school operator, a charter management organization, or an education management organization.
4. School closure: Close the school and reassign students to higher-achieving schools.19
Each of the models also had attached to them various prescribed practices thought to improve student outcomes. With the justification of granting local flexibility, many of these required practices were worded so broadly or necessitated minimal change to current practice as to offer little assurance of impactful reform: “Providing high-quality, job-imbedded professional development or supports”; “Using and integrating technology-based supports”; and “Conducting periodic reviews to ensure that the curriculum is being implemented with fidelity,” for example.20
An analysis of the SIG program sponsored by the U.S. Department of Education found that more than 1,600 schools in 41 different states and the District of Columbia were awarded school turnaround grants in the program’s first two recipient cohorts. On average, the award schools were comprised of about 70 percent free and reduced-price-lunch eligible students and about 75 percent nonwhite students.21
Expansion of the SIG program continued throughout President Obama’s first term, with annual appropriations of more than $500 million. Including the 2009 infusion from the ARRA, approximately $6.3 billion in total was committed to the program.22
Bigger Wasn’t Better
Growing reports of the continuing failure of broadscale turnaround efforts under the program gave pause to lawmakers, and Congress held the SIG program’s annual funding flat starting in the 2014-15 school year at a little more than $500 million. Among those critical reports was a notable one from the Center on Reinventing Public Education (CRPE) that offered this succinct summary:
The clear message from the DOE is that School Improvement Grants are intended to help districts make bold decisions in order to completely reinvent their schools. Many forces, however—including politics, fear of controversy, lack of knowledge, and the constraints of collective bargaining—have prevented districts from choosing controversial interventions for schools. In nearly every case, the districts studied treated the SIG as they do other grant programs: as
13
incremental additions to ongoing activities, rather than as a tool for completely reimagining what’s possible for students.23
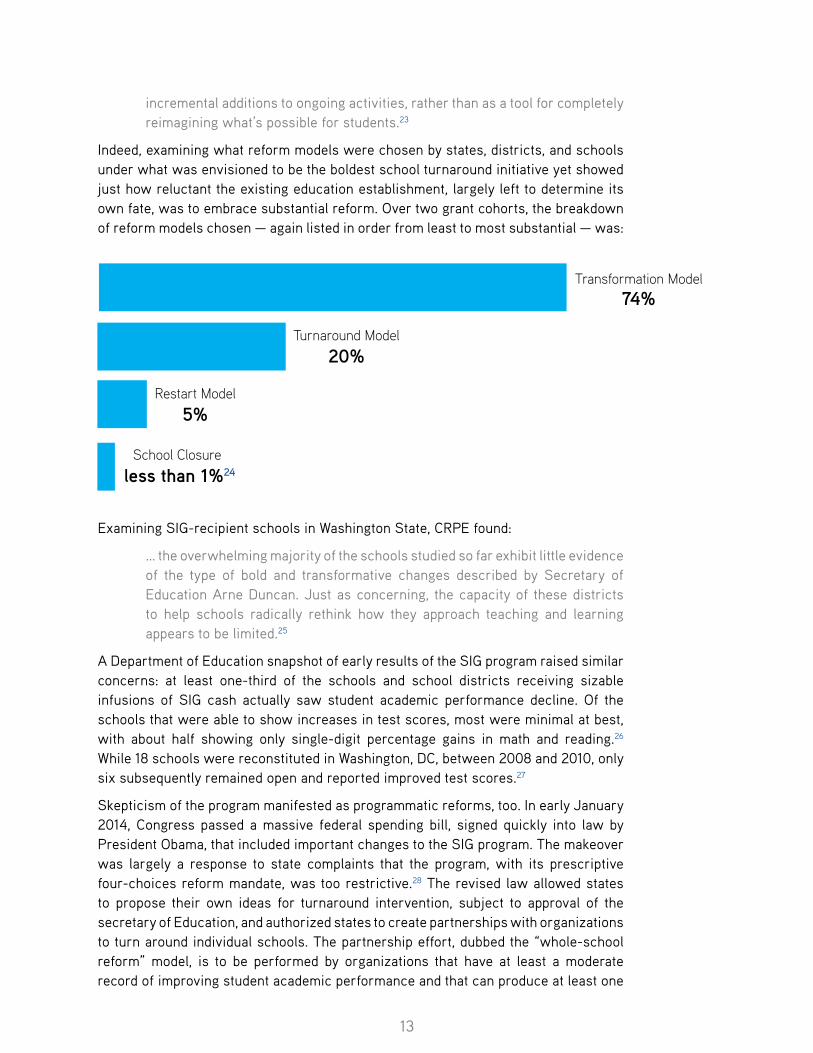
Indeed, examining what reform models were chosen by states, districts, and schools under what was envisioned to be the boldest school turnaround initiative yet showed just how reluctant the existing education establishment, largely left to determine its own fate, was to embrace substantial reform. Over two grant cohorts, the breakdown of reform models chosen — again listed in order from least to most substantial — was:
Examining SIG-recipient schools in Washington State, CRPE found:
… the overwhelming majority of the schools studied so far exhibit little evidence of the type of bold and transformative changes described by Secretary of Education Arne Duncan. Just as concerning, the capacity of these districts to help schools radically rethink how they approach teaching and learning appears to be limited.25
A Department of Education snapshot of early results of the SIG program raised similar concerns: at least one-third of the schools and school districts receiving sizable infusions of SIG cash actually saw student academic performance decline. Of the schools that were able to show increases in test scores, most were minimal at best, with about half showing only single-digit percentage gains in math and reading.26 While 18 schools were reconstituted in Washington, DC, between 2008 and 2010, only six subsequently remained open and reported improved test scores.27
Skepticism of the program manifested as programmatic reforms, too. In early January 2014, Congress passed a massive federal spending bill, signed quickly into law by President Obama, that included important changes to the SIG program. The makeover was largely a response to state complaints that the program, with its prescriptive four-choices reform mandate, was too restrictive.28 The revised law allowed states to propose their own ideas for turnaround intervention, subject to approval of the secretary of Education, and authorized states to create partnerships with organizations to turn around individual schools. The partnership effort, dubbed the “whole-school reform” model, is to be performed by organizations that have at least a moderate record of improving student academic performance and that can produce at least one
Transformation Model74%
Turnaround Model
20%
Restart Model
5%
School Closure
less than 1%24

14
reputable study that supports the organization’s claims of success. These options became available starting in the 2015-16 school year.
Dorie Nolt, press secretary for the U.S. Department of Education, noted, “What we’ve learned … is that there’s no single way to turn around a low-performing school.”29 Robert E. Slavin, director of the Center for Research and Reform in Education at Johns Hopkins University, noted of the revision to the SIG program: “… the [new] fifth option says ‘use what works.’ Wisely, it does not mandate the use of any specific programs.”30
Even the largest school turnaround program in the nation’s history essentially threw up its hands and said to districts, “just try something that will work.”
The End of the School Improvement Grant Program
In December 2015, the law that embodied NCLB and the SIG program was overhauled and renamed the Every Student Succeeds Act (ESSA). This reauthorization incorporated into statute much of the flexibility on academic performance granted to states under President Obama’s administration. ESSA also essentially scrapped the SIG program, flowing program funds through the Title I stream and instituting a general requirement that states spend 7 percent of their federal Title I funds on attempts to turn around their lowest-performing public schools.
In January 2017, the federal Department of Education issued its final report evaluating the SIG program. The main findings were particularly harsh:
SIG schools reported using more prescribed practices than other schools, but there was no evidence that SIG caused those schools to use more practices. There was also no evidence that SIG had significant impacts on math or reading test scores, high school graduation, or college enrollment.31
Additionally, a January 2018 review of state ESSA plans by the nonprofit education research organization Results for America found that there was little collateral benefit from the SIG investments, as only four states expect to study their use of federal school improvement funds “to deepen understanding of what works and build an evidence base for school improvement.”32
Some researchers claim that the U.S. Department of Education report used a methodology that created too small a sample size, pointing to several state and local studies that claimed improvements due to SIG investments.33 Others noted that because districts were largely left to their own devices on implementation, there was only spotty success, but there was some success nonetheless.34
In the end, however, the nearly $7 billon School Improvement Program was, for all intents and purposes, accepted as a very expensive failure.
SIG-Inspired School Turnaround Efforts
Other school turnaround reform efforts used the ambitious vision, rhetoric, and funding of the federal School Improvement Grant program as a platform on which to build. Below are a couple of examples.
15
Parent Trigger Laws
Parent Trigger Laws (sometimes called Parent Empowerment Laws) allow parents of children attending chronically failing schools to “pull the trigger” and force radical changes at underperforming schools. Since California began the movement in 2010, five more states have passed parent trigger laws,35 and similar legislative proposals have been proposed in dozens of other states. Under these laws, parents are empowered to coalesce, sign a petition, and force the district to implement one of the four reform models prescribed in the School Improvement Grant program (turnaround, transformation, restart, or closure).36
While parent trigger legislation certainly gives parents a direct avenue to force dramatic steps toward reform, the process typically provides only a brief opening for the turnaround to be triggered and often requires a very unwieldy process that makes it exceptionally difficult for parents to engage the school turnaround effort. Additionally, some school districts faced with parent trigger actions, including the nation’s second-largest, Los Angeles Unified School District, have stifled the demanded reforms by claiming exemptions written into NCLB guidelines that effectively protected districts from making these changes.37
Because turnaround reform options available under most parent trigger legislation were restricted to the SIG options, which have been shown to be less than ideal in driving real improvement in low-performing schools, it meant that even when parent trigger actions themselves work the resulting reforms almost always did not.
Public Charter Schools
Public charter schools, first authorized under state law in 1991 in Minnesota, were not originally envisioned as school-turnaround entities. Rather, these newly established choice-based schools were designed simply to be new alternatives to districts’ local failing schools. Optimistic reformers envisioned that parents with students trapped by geography in failing neighborhood district schools would quickly abandon the low-performing school for any new public school, and that all new charter schools
16
would fulfill their promise of excellence. Too often, however, nowhere near enough new seats have been created by good charter schools in neighborhoods plagued by low-performing district schools. Also, some charter schools in these neighborhoods fall short of the high academic achievement goals envisioned, offering parents and students only a similar option, not a better one.
Still, the design of public charter schools held promise for meaningful reform, promise that was not lost on SIG program administrators who included as one of the reform options to reconstitute a failing district school into a charter school. There is a reason why only 5 percent of SIG grantees have opted to restart as a charter school, however: the vast majority of charter school operators don’t like the deal they’re offered in a turnaround situation.
In his article “The Turnaround Fallacy,” former Deputy Assistant at the U.S. Department of Education and former New Jersey Deputy Commissioner of Education Andy Smarick offered the following:
A 2006 NewSchools Venture Fund study confirmed a widespread aversion to takeover-and-turnaround strategies among successful school operators. Only 4 of 36 organizations interviewed expressed interest in restructuring existing schools.…
Tom Torkelson, CEO of the high-performing IDEA network [says]: “I don’t do turnarounds because a turnaround usually means operating within a school system that couldn’t stomach the radical steps we’d take to get the school back on track. We fix what’s wrong with schools by changing the practices of the adults, and I believe there are few examples where this is currently possible without meddling from teacher unions, the school board, or the central office.”
Chris Barbic, founder and CEO of the stellar YES Prep network, says that “starting new schools and having control over hiring, length of day, student recruitment, and more gives us a pure opportunity to prove that low-income kids can achieve at the same levels as their more affluent peers. If we fail, we have only ourselves to blame, and that motivates us to bring our A-game every single day.”
KIPP co-founder Mike Feinberg says simply, “The best way we can look a child in the eye and say with confidence what kind of school and environment we will provide is by starting that school and environment from scratch.”38
Despite these challenges, several public charter school operator networks — including Democracy Prep (in the New York City, New Jersey, and Washington, DC, areas), Green Dot (in the Los Angeles area and starting in Tennessee and Washington State), Friendship Schools (in the Washington, DC, and Baltimore areas), Mastery Charter Schools (in Philadelphia, PA, and Camden, NJ), and UP Education Network (Massachusetts) — have moved solidly into the school turnover business and are posting some successful results. Still, however, this effort has occurred with only a handful of schools nationwide. The void between political leaders’ stated desires to transform persistently low-performing schools and the supply of those reformers who are willing to and have the talent to successfully remake those schools remains vast.

17
Mass Insight
In 2007, recognizing that big and bold moves were needed for improving persistently failing schools, the Mass Insight Turnaround Challenge called for a collaborative approach to organizing clusters of school within or across districts to create a pocket of high-performing high-poverty schools.39 The challenge called for a comprehensive, holistic approach with reforms grouped into three categories: “readiness to learn,” focused on student needs; “readiness to act,” focused on structural conditions; and “readiness to teach,” characterized by changes in the approach to, and culture of, instruction.40 Although the model did not gain much political endorsement and was infrequently used, it helped highlight the needed shift away from ineffective “light touch” reform efforts of the past and instead promoted dramatic, aggressive, and comprehensive school turnaround reform plans.
18
State “School Takeover” InitiativesThe boldest and most attention-getting school turnaround policies are state takeovers of persistently failing schools. Based in part on the SIG program’s vision, and on the prompting authority allowed under the federal NCLB statute, several states began identifying their lowest-performing public schools and targeting the bottom tier for state takeover. Dozens of laws now allow states to step in and assume control of individual failing schools, entire districts, or both, typically after years of persistent failure and a demonstrated inability of local districts to fix their schools on their own.
Directly taking control over persistently failing schools, states had the opportunity to ensure that transformation plans included the key actions needed to quickly and completely change course, install turnaround experts to lead each school, and ensure flexibility for individual schools to address individual issues within the framework of required actions, all supported by a campaign designed to win and sustain sufficient political and community support. Although many state plans were proposed as such, few ended up being enacted this way.
The state takeover movement began in May 1988 when, after three years of inadequate action by the Jersey City school board to correct multiple serious long-term educational deficiencies and administrative corruption, New Jersey’s state education commissioner directed that the state would be taking over all of Jersey City’s public schools for a minimum of five years as the state initiated and directed a dramatic corrective overhaul. It would be more than 20 years before the state turned Jersey City schools — the second largest school district in the state — back to local control.
The upper boundary of state takeover power was evidenced in the wake of Hurricane Katrina. Louisiana’s 2003 takeover law41 allowed the state Education Department to pull low-performing schools out of the control of local school districts and operate them through a new body, the Recovery School District (RSD). Alternatively, the state could grant operational authority over the school to a university or a charter school operator. Though the law applied statewide, the focus of takeover intentions and actions was on schools within the city of New Orleans, which had a long-standing record of abysmal academic performance. In 2004, the first school was taken over (and subsequently designated as a charter school); in 2005, just four more were added.
Then, in August 2005, the storm hit. The infrastructure supporting most of the public schools in New Orleans’ Orleans Parish, whether physical or administrative, was washed away and little innate capacity existed to get the schools quickly operating again. In response, the state’s charter school law was loosened in a way that worked with the RSD to allow school organizers to come into New Orleans and get schools up and running immediately. The state took oversight of all the schools under the jurisdiction of the Orleans Parish School Board (OPSB) and moved it to the RSD. Many were converted to charter-school status instantly. The changes to how schools operated parish-wide in the wake of Katrina were dramatic:
The boldest and most attention-getting school turnaround policies are state takeovers of persistently failing schools.
19
Attendance zones were essentially eliminated, creating open school choice for families. All educators were fired. The OPSB allowed its teacher union contract to expire and never replaced it. By virtue of becoming charter schools, tenure protections were also eliminated.42
Following New Jersey’s and Louisiana’s groundbreaking lead, more than 30 states enacted some form of school takeover law, some allowing the state to take over only persistently failing individual schools, some calling for the governance of entire districts to be transferred to the state or its designated entity, and some allowing a form of both.43 (New York’s school receivership program is described in the following section.)
The level of intervention by the state and the level of control retained by local education authorities under these laws varies significantly from state to state, though most have the roster of school reform models prescribed in the federal School Improvement Grant program as available options for action.
While bold sounding, and with exceptions such as in New Orleans, state takeover reform actions have typically mimicked the timid approach witnessed under the federal SIG program, similarly resulting in little improvement in the targeted low-performing schools. For example: state intervention and millions of dollars in new spending in Ohio resulted in only half of the 52 targeted failing schools increasing student achievement; and, after three years of state intervention in California’s lowest-performing schools, 90 percent of elementary schools and all but one middle school failed to make what the state classified as “exemplary progress.”44
In fact, most state takeover efforts have yet to produce any stellar examples of transformation, turning persistently failing schools into long-lasting, high-achieving ones. The trend may actually be stalling, if not reversing: in 2018 alone, Jersey City (October), Newark (February), Philadelphia (July), and New Orleans (July) ranked among the notable cities that were given back local authority over their traditional public schools after years of stewardship under state control. Virginia’s attempt at state takeovers was ruled unconstitutional, and Alaska and Colorado are among those states that have repealed their authority to take over failing schools.
However, not all state turnaround efforts were doomed to fail.
During the state-takeover phase of transforming low-performing schools, however, two models were often cited as examples that worked: Massachusetts’ takeover of the Lawrence city school district, and the creation of Tennessee’s Achievement School District, which focused its early efforts in Memphis. These models embraced the need for quick and bold reforms, and cleared away political resistance — at least initially — to get the job done. The experiences of these efforts are explored further below.
During the state-takeover phase of transforming low-performing schools, however, two models were often cited as examples that worked: Massachusetts’ takeover of the Lawrence city school district, and the creation of Tennessee’s Achievement School District, which focused its early efforts in Memphis.

20
Receivership of Lawrence, Massachusetts, Public School District
In November 2011, following 15 years of poor academic performance and scores on state exams in the bottom 1 percent in the state, a 52 percent graduation rate, and a 25 percent drop-out rate,45 Massachusetts took the unprecedented step of seizing control of the Lawrence Public Schools district. Jeff Riley, then the chief innovation officer for Boston city schools, was named the district’s receiver and was given sweeping powers to make reforms.
The Lawrence district, also notable for its ineffective leadership (the superintendent for nearly a decade was fired in 2010 amid charges of embezzlement and fraud46) served approximately 13,000 students at the time, more than two-thirds of whom were low-income and 91 percent of whom were Latino, proportions that have held fairly steady.47
Riley replaced 10 of the district’s 28 principals (36 percent) in his first year to strengthen leadership, and replaced another 20 percent the second year. Approximately 8 percent of teachers were terminated for low performance in the first year, with those and other vacancies filled through active recruitment of teachers with a record of high performance. The exiting of teachers continued for several years, with 57 teachers dismissed in 2015 alone.48
Educational and structural changes implemented included:
• Extended school days were made mandatory across the district.
• Intensive English language arts workshops, known as the Acceleration Academy, were established and held during all school holidays.
• A mix of school models was employed, including charter schools and traditional public schools; a school run directly by the teachers union was established.
• The progress of each student in the entire district was individually tracked under a new performance data system.
• Students who had dropped out were tracked down, their transcripts analyzed, and provided help to earn the handful of credits typically needed to graduate.
Despite an ongoing commitment to replace poorly performing teachers and leaders with better ones and unhesitating radical changes in the approach to how education was delivered in these schools, Riley approached the teachers unions in good faith, offering initiatives and support in attempts to bring them into the fold of these reforms as partners. Riley fully supported, for example, moving good teachers to leadership positions, an advancement avenue that previously was not nurtured. Eventually, a new collective bargaining contract was successfully negotiated for the schools under Riley’s control. Riley has since become commissioner of the Department of Elementary and Secondary Education in Massachusetts, a position that oversees K-12 education for the entire state.
Select charter school operators also were lured to take over some of the worst-performing schools. Though the requirement to operate within the district structure
21
— including having teachers belong to the local union and required to draw enrollment from a neighborhood zone — posed significant challenges, most charter takeovers initially showed solid signs of improvement.
By 2014, just three years after the state takeover, student test scores reached record highs and the district placed in the top quartile of urban school districts in the state. By 2018, the district was still improving in ELA and math proficiency, and graduation rates continued to increase.
RESULTS49
In the receivership’s first four years (from 2011 to 2015), the percentage of students scoring proficient in math increased from 28 percent to 44 percent, and proficiency in ELA rose from 41 percent to 45 percent. In 2016, Lawrence students took the Partnership for Assessment of Readiness for College and Careers (PARCC) assessment in accordance with implementation of the federal Common Core Standards before returning to a newly remodeled Massachusetts Comprehensive Assessment System (MCAS) in 2017. Since then, from 2017 to 2018, growth has continued under the new Next-Generation MCAS with math scores improving three percentage points and ELA scores improving one percentage point. At this rate, test score increases are continuing to resemble increases in the turnaround’s early years.
Massachusetts also measures academic progress using a metric called the student growth percentile (SGP), which measures individual students’ MCAS scores against the scores of other students with similar academic standing, aggregates SGPs throughout each district, and then compares median scores across districts.50 By 2014, median student growth percentiles in Lawrence had increased dramatically: in ELA by nine points (to 52) and in math by 17 points (to 57). By 2018, those numbers fell to 47 and 45 percent, respectively, which are the lowest measurements since 2013.
From 2011 to 2018, high school graduation rates increased from 52 percent to 72 percent.
RESULT 1:STATE MATH AND ELA SCORES RISE >
RESULT 2:INDIVIDUAL STUDENT PROGRESS GROWS DRAMATICALLY, THEN SLOWS
>
RESULT 3:GRADUATION RATE INCREASES >

22
In the first four years of receivership, the number of Level 1 schools — those that met the state’s performance targets — rose from just two to six schools. Students were shown to be making encouraging progress in schools classified as Level 3 or Level 4, too, although those schools still comprised a majority of the district’s 33 schools. As of May 2015, the district remained classified as Level 5, the lowest, which qualified it to fall under receivership initially. Overall student test scores reached record highs, however, placing the district in the top quartile of growth in the state for urban districts and signaling that progress was being made. By the end of the 2017-18 school year, though, the district was still classified as a Level 5.
Districtwide improvement in Lawrence clearly occurred because of a bold start to the turnaround effort, one that was strongly supported by state policymakers and political leaders. In the wake of the departure of Jeff Riley, the driving force of the initial receivership program, improvement rates seem to be slowing a bit. In 2018, when the state abandoned its comparative “level” district labeling system entirely, Lawrence was categorized as “in need of broad/comprehensive support,” the label given to chronically underperforming districts in Massachusetts.51
Tennessee Achievement School District
Tennessee created its Achievement School District (ASD) in January 2010, targeting for state takeover the lowest-performing 5 percent of its public schools. Three days later, the state included this initiative as a highlight of its application for the federal Race to the Top (RTTT) grant competition. Tennessee was one of two states to win the first round of RTTT grants, securing $500 million for school improvement, including $22 million to fund the new ASD.
In May 2011, the state education commissioner appointed as superintendent of the ASD Chris Barbic, head of the charter-led school turnaround effort of YES Prep in Houston, and in August 2012, the first six schools opened under ASD authority. In just three years, there were 29 schools serving approximately 10,000 students under ASD control. Most of the takeover schools were located in Shelby County, home of Memphis, the state’s second-largest city.
Early Results Promising52
In ASD’s first three years, academic indicators offered signs of hope for a successful turnaround. For the schools under its control:
RESULT 4:SOME CLASSIFICATION IMPROVEMENT >

23
• Proficiency on state math assessments in grades 3-8 increased from 16.3 percent to 27.0 percent, significantly greater than the state average increase of 8.4 percent. Similarly, science proficiency increased from 16.5 percent to 26.5 percent, a 10-point increase compared to a 4-point average increase for the state. During the same period, however, reading proficiency decreased from 18.1 percent to 13.8 percent, a 4.3-point drop that exceeded the state average 1.5-point decrease.
• Students in the ASD’s high schools made proficiency gains on end-of-course exams in every subject. Proficiency gains for students in ASD charter high schools exceeded those for their state peers in five out of six subjects.
• Every school in the ASD had a higher average proficiency rate across math, reading, and science than it did prior to when ASD interventions began. The average composite proficiency rate grew from 14 percent in 2012 to 24 percent in 2015. Still, the percentage of scoring “proficient” or “advanced” remained far lower than the average for non-ASD schools in Shelby County and the state.
• ASD schools in their second and third years — the first two cohorts of schools to join the ASD — earned the highest possible growth rating, averaging a Level 5 on the Tennessee Value-Added Assessment System.
Leadership Churns, Authority Weakens, and Reform Lessens
In July 2015, after just three years leading the reform effort, Barbic announced he was stepping down as ASD superintendent at the end of the year.53 Deputy Superintendent Malika Anderson was appointed to succeed Barbic, yet she stepped down from the role just two years later.54 In April 2018, the state announced that Dr. Sharon Griffin, who was finishing her first year as chief of schools for Shelby County after a 12-year tenure with district administration, would be ASD’s third leader in seven years.55 Griffin was not a candidate who appeared on the state’s list of finalists for the position, and did not go through a public interview process as did other candidates.
As tension grew primarily between the Shelby County public school district and ASD’s state reformers, in 2017, state legislators curbed the ASD’s authority and imposed limits on both takeovers and new-start schools.56 Although half of the district’s schools were managed directly by the ASD in its early years, today only 10 percent — three schools — are directly run.57 The remaining 27 schools are operated by one of 11 charter operators, which are required to be vetted and approved by the ASD and a community-based advisory council. ASD-operated schools now are led by state-appointed school leaders and teacher teams, too.58
The number of ASD schools peaked in 2017 with 34, but dropped to 30 schools in 2018 as four new-start schools couldn’t garner enough enrollment to remain viable — only one more school than the last year of Barbic’s tenure at the helm.
Overall, academic performance measures grew less impressive: although since 2012 ASD schools performed well in science, averaging a Level 5 on the Tennessee Value-Added Assessment, the highest possible rating, the schools are averaging only a

24
Level 3 in English Language Arts, and a Level 1 in math, the lowest possible level.59 Overall, ASD scored a Level 1, the lowest rank, in growth of student academic scores.
Comprehensive and more detailed comparative analysis of recent performance of ASD schools is significantly hindered because the Tennessee Comprehensive Achievement Program exams were not scored for the 2015-16 school year due to a glitch in the transition to an online test format; the 2016-17 ELA exam is available only for nine out of 23 ASD schools because of another online glitch; and the state changed its test score reporting methods in school year 2017-18. In general, however, ASD schools have showed minimal year-to-year gains; while that compares favorably to slippage in the average state year-to-year scores, ASD schools overall still significantly underperform the state average.
New York State and New York City Takeover-and-Fix-It AttemptsNew York State and New York City both recently implemented programs designed to transform persistently failing public schools, and each started with a clear vision of the bold reforms needed and a strong plan for fixing these schools. Each case study also offers an illustration of how these well-intended efforts slip when political support erodes and implementation of the programs aims short of the original goals, becomes overly bureaucratic, or enacts new restrictions that prevent the genuine and complete overhaul needed.
New York State Receivership
In January 2015, along with his Executive Budget proposal, New York State Governor Andrew Cuomo proposed a sweeping education reform proposal he called the Education Transformation Act of 2015. Among other things, the proposal sought to institute new requirements for evaluating classroom teachers and school principals, new requirements granting teachers tenure, and new standards for undertaking disciplinary actions on teachers and administrators.
Maybe most significant, however, was that the governor’s proposal created a program for the takeover of persistently failing public schools. The new law was modeled on the Massachusetts law used to place the Lawrence Public Schools district under state receivership.60 Highlighting the encouraging turnaround performance of schools in receivership in Lawrence, Governor Cuomo’s office cited statistics highlighting the desperate need to fix New York’s failing schools:
[O]ver the past decade more than 250,000 children attended failing schools — and nine out of ten of students in failing schools are minority or poor.
As you know, failing schools lag behind in virtually every category:
• The graduation rate for failing schools is 47.3 percent versus the state average of 76.4 percent.
• ELA proficiency in grades 3-8 at failing schools is 5.9 percent versus the state average of 31.4 percent.
• Math proficiency in grades 3-8 at failing schools is 6.2 percent versus the state average of 35.8 percent.61
The state legislature enacted the governor’s receivership proposal in April 2015, and the following month the New York State Board of Regents adopted regulations governing the implementation of that law.62
Opting to model New York’s new school takeover law on the Massachusetts receivership law as opposed to Tennessee’s Achievement School District model meant that, as in Lawrence, transformation efforts for takeover schools would continue to operate within a school district structure instead of under a new state-run and more autonomous structure. Both the union-friendly nature of this model and the successes that could be

25
New York State and New York City Takeover-and-Fix-It AttemptsNew York State and New York City both recently implemented programs designed to transform persistently failing public schools, and each started with a clear vision of the bold reforms needed and a strong plan for fixing these schools. Each case study also offers an illustration of how these well-intended efforts slip when political support erodes and implementation of the programs aims short of the original goals, becomes overly bureaucratic, or enacts new restrictions that prevent the genuine and complete overhaul needed.
New York State Receivership
In January 2015, along with his Executive Budget proposal, New York State Governor Andrew Cuomo proposed a sweeping education reform proposal he called the Education Transformation Act of 2015. Among other things, the proposal sought to institute new requirements for evaluating classroom teachers and school principals, new requirements granting teachers tenure, and new standards for undertaking disciplinary actions on teachers and administrators.
Maybe most significant, however, was that the governor’s proposal created a program for the takeover of persistently failing public schools. The new law was modeled on the Massachusetts law used to place the Lawrence Public Schools district under state receivership.60 Highlighting the encouraging turnaround performance of schools in receivership in Lawrence, Governor Cuomo’s office cited statistics highlighting the desperate need to fix New York’s failing schools:
[O]ver the past decade more than 250,000 children attended failing schools — and nine out of ten of students in failing schools are minority or poor.
As you know, failing schools lag behind in virtually every category:
• The graduation rate for failing schools is 47.3 percent versus the state average of 76.4 percent.
• ELA proficiency in grades 3-8 at failing schools is 5.9 percent versus the state average of 31.4 percent.
• Math proficiency in grades 3-8 at failing schools is 6.2 percent versus the state average of 35.8 percent.61
The state legislature enacted the governor’s receivership proposal in April 2015, and the following month the New York State Board of Regents adopted regulations governing the implementation of that law.62
Opting to model New York’s new school takeover law on the Massachusetts receivership law as opposed to Tennessee’s Achievement School District model meant that, as in Lawrence, transformation efforts for takeover schools would continue to operate within a school district structure instead of under a new state-run and more autonomous structure. Both the union-friendly nature of this model and the successes that could be
26
achieved under it were acknowledged by American Federation of Teachers President Randi Weingarten when she said that, while still generally opposed to the practice of state takeovers and receivership, “The only place where receivership is working is in Lawrence, Mass., and that’s because there is collective bargaining and the leadership believes that teachers should have a voice, and, as such, collaboration among all partners exists.”63
Program Details
New York’s receivership program targets the lowest-performing 5 percent of schools in the state, labeled by the State Education Department (NYSED) as “priority schools.” Two categories of failing schools within the priority designation were created. Those schools that have been in the state’s most severe accountability status for 10 years or more are deemed “persistently struggling,” and are given one year to show demonstrable improvement under the local school superintendent’s receivership or they become eligible to fall under the control of an independent receiver. “Struggling” schools are defined as those failing schools categorized as priority any three years since 2012-13, and these schools were given two years to show demonstrable improvement before an independent receiver could be assigned.64
In both instances, the local district superintendent is empowered with much of the same authority and powers as is the independent receiver, with the idea being that the one-year and two-year improvement timeline serves as a last warning of sorts for the local district to make the needed radical improvements on its own before an “outsider” is empowered to come in and make such changes. The independent receivers are appointed by the local district, but each appointment is subject to the approval of the State Education commissioner. Independent receivers are appointed for a three-year term and serve under contract with the commissioner, not the local district.
Districts could avoid making any changes to a school simply by instituting plans to close or merge any school that was scheduled to be put under state receivership.
The receivership program included many details on processes necessary to be followed, reporting procedures to be met, and other important steps in planning for the improvement of failing schools. Among these are the requirement to form a “Community Engagement Team” of specified stakeholders to develop recommendations for a school intervention plan, holding public hearings, notifying parents of affected schools, conducting a needs assessment to support the improvement plan, and the development of the plan itself. NYSED works with each district to establish target goals that will serve as measures of “demonstrable improvement” (DI), determining whether schools stay on or are removed from the performance watch list. DI indicators include not only academic performance measures, but can include such things as chronic absenteeism rates, safety measurements, suspension rates, teacher attendance patterns, and more.
Modifications to the program soon required each school in receivership to become a “community school,” which qualified them for new grant funds and called for them to make community partnerships for wraparound services. In its May 2017 efforts to develop an accountability plan to conform to requirements of the federal Every Student

27
Succeeds Act, NYSED established that all schools identified or reidentified as in need of “Comprehensive Support and Improvement,” a new term, will be categorized as receivership schools.65 The realignment of “demonstrable improvement” indicators with ESSA indicators began with the 2018-19 school year Receivership determinations based on the new methodology are scheduled to first take place using 2019-20 state test results.
Opposition
When Governor Cuomo first announced his proposal to allow the takeover of the state’s worst-performing public schools, Carl Korn, spokesman for New York State United Teachers, announced that the union is “strongly opposed” to receivership.66
In less than a year after its enactment, the intensity of teacher union opposition to New York’s state receivership program became even clearer.
In late 2015, in accordance with the new receivership statute and regulations, Buffalo Schools Superintendent Kriner Cash appealed to the State Education Commissioner MaryEllen Elia and the State Education Department when negotiations with the union on a new contract for schools in receivership reached an impasse. Among the reforms Superintendent Case was seeking was an extension of the school day and year, and involuntary staff transfers of selected teachers with those vacancies filled from transfers in from other schools. Also in accordance with the takeover law, Elia imposed on the union, with some modifications, the superintendent’s proposed agreement.67 On February 9, 2016, NYSUT and a local affiliate, the Buffalo Teachers Federation, filed suit claiming that the receivership law illegally contradicts laws protecting unionized workers and their contract provisions.68
On October 14, 2015, the State Assembly’s education committee heard more than six hours of testimony, with speakers from various education-establishment groups saying that the receivership program does not allow enough time for struggling schools to improve, there was insufficient state funding accompanying the mandates for reform,
28
and many provisions of the law, such as what is meant by the requirement to show “demonstrable improvement,” are too vague. The chair of the committee at the time, Assembly Member Cathy Nolan, vowed to revisit the program in the 2016 session, proposing new legislation if necessary to address these and other concerns.69
About two weeks after the legislative hearing, however, in a victory for reformers, New York State’s Supreme Court declared the law constitutional.70
Receivership Actions
On July 16, 2015, in New York’s first move on receivership, State Education Commissioner MaryEllen Elia announced that 144 schools located in 17 school districts across the state and serving nearly 94,000 students were classified as “Struggling” or “Persistently Struggling” and slated to fall into the new receivership process.71 The “Persistently Struggling” schools were required to show demonstrable improvement by the end of 2015-16; remaining “Struggling” schools were given an additional school year under local district control to improve.
But then, in February 2016, the State Education Department issued a new list based on revised calculations. The new list removed 10 of the 20 “Persistently Struggling” schools and 60 of the 124 “Struggling” schools as targets for receivership, even though no new state tests were administered since the initial list was issued seven months earlier and no new performance data were available.72
For the 2016-17 school year, 72 schools were in district receivership, with 10 designated as “Persistently Struggling” and 62 designated as “Struggling” schools. Eight schools in receivership either closed at the end of the 2016-17 school year or were in the process of phasing out and one additional school still had its data under review, so these schools were excluded from the receivership list that year.73 On October 31, 2017, NYSED announced that “more than 95 percent of schools in receivership made demonstrable improvement in the 2016-17 school year. A total of 61 of 63 schools in receivership showed progress on performance indicators jointly selected by the State Education Department and the districts in which the schools are located.”74 On December 1, 2017, NYSED removed 27 schools from priority status and eight schools from receivership status “based upon their 2015-16 and 2016-17 progress in improving state assessment results for students.”75
In the 2017-18 school year, there were a total of 60 schools in receivership, with seven designated as “Persistently Struggling” and 53 designated as “Struggling” schools. Eight schools in receivership either closed at the end of the 2017-18 school year or were in the process of phasing out. In December 2018, the New York State Education Department announced that 49 of the 52 schools (more than 94 percent) in receivership the previous school year had made sufficient “demonstrable improvement” and would not be targeted for control by an independent receiver.76
The state’s spotlighting of struggling schools, mandating district intervention, and the implementation of those interventions all surely impacted student performance at the target schools, reducing the number that were in danger of falling into control by an independent receiver. But so, too, did allowing nonacademic factors to count toward
29
school improvement, changing definitions, and shifting improvement targets. Year after year more than 90 percent of failing schools are deemed to have made sufficient improvement, yet statewide academic results barely move.
Backing Away from Change
NYSED noted that as of June 2019, not a single public school in the state has been placed under the control of an independent receiver.77 Any school that had been failing long enough to be placed on the state’s “Persistently Struggling” list and, despite district interventions, was unable to show demonstrable improvement, was closed, merged, or closed and restarted instead of being put into the hands of an independent leader.78
The New York State Senate took action in its 2019 legislative session to further neuter the state’s receivership law, moving out of committee and on to floor action a bill that prohibits an independent receiver from abolishing any school positions and removing the State Education Commissioner’s authority to make any changes to any provision of a collective bargaining agreement even if deemed to be an obstacle to needed reform.79
New York City Renewal Schools
In November 2014, New York City Mayor Bill de Blasio announced a new initiative, the Renewal Schools program, designed to turn around the city’s lowest-performing schools through new investment in supplies and curriculum, establishing links to local social services, increased teacher training, and other components deemed tied to improved student learning. The original program identified 94 poor-performing schools, labeled them as Renewal Schools, and enrolled them in the new program, noting that each had a demonstrated history of poor student performance and had been judged to have a low capacity for school improvement and growth on key progress measures.
The original budget for Renewal Schools was set at $150 million, but expenditures spiraled up quickly and by the program’s third year; total spending on Renewal Schools had reached an estimated $773 million — more than five times the originally projected amount for the program.80

30
The initiative struggled to show the dramatic and immediate turnaround in school performance originally promised, however, and the coming end of the program was confirmed when city officials emphasized that Renewal Schools was originally envisioned only as a three-year effort.81 Acknowledging that the program was in its end stages, Mayor de Blasio said the program was reaching its “natural conclusion,”82 but allowed the program to continue and receive funding through 2018, saying the extra year and additional investment “was worth it.”83 The mayor announced a new program for struggling schools for 2019 called Rise, and schools remaining in the Renewal Schools program were combined with others to form the new program, keeping their designation as community schools and continuing to be the beneficiary of additional social services and larger school budgets.84
In February 2019, and after extensive media coverage critical of the program, the NYC Department of Education (DOE) issued its wrap-up report and evaluation of the Renewal Schools initiative. The report noted that of the original 94 schools designated as Renewal Schools, 14 closed and nine were merged with other schools, meaning one-fourth of the initial low-performing schools were simply exited out of the program. Almost another one-fourth (21 schools) were deemed to have made sufficient progress to graduate from the program, though they still remained designated as Rise schools.85
The DOE claimed some successes attributable to the investment, noting that Renewal Schools: “outpaced citywide improvement in graduation [+19.6 percentage points vs. +7.5 points citywide] and dropout rates [-3.5 points vs. -2.2 points citywide], college readiness [+20.1 points vs. +19.3 points citywide], attendance [+4.2 points vs. +0.3 points citywide], and suspensions [-56.7 percent vs. -31.5% citywide] from 2014 to 2018.”86 This progress, however, was viewed by many as minimal and any direct causal ties to the Renewal Schools effort tenuous.87 An April 2019 study of the Renewal Schools program undertaken by the RAND Corporation found much lower levels of success in elementary and middle schools, noting that Renewal Schools “improved their average student attendance rate by around 1.5 percentage points [and status as a Renewal School] can be causally linked to a 5 percentage point reduction in the number of students who are chronically absent.” The report also notes, “We did not find any statistically significant effect of the RS program on any of the indicators that make up the Instructional Core or School Culture,” offering the caveat that it did not have “enough statistical power to say whether or not there is an effect.”88
In the end, the DOE itself noted significant problems with the Renewal Schools program. These problems included: an inability to find enough principals with sufficient strength to “simultaneously address a multitude of challenges while building support across the school community”; the DOE structure created a “too many cooks” approach, where school leaders got mixed feedback and conflicting demands from various offices; and labeling schools as “Renewal” led parents to believe that the schools were slated for closure no matter what city officials said.89
31
Destined to Fail?Are broadscale efforts to transform failing schools simply destined to fail? When every public school in a local district has underperformed for years, are districtwide fix-it attempts really just a waste of taxpayer dollars? Many reformers hope that the answer is not worse than a “maybe,” but if past attempts are any indication, it usually is.
School turnaround programs that start strong in their initial design phase too often are run through a political and bureaucratic process that renders even well-intentioned efforts impotent. Strong and innovative program proposals from a governor, for example, often become subject to a state legislative process heavily influenced by special interests and preferences for maintaining the status quo. Enacted laws and programs typically require and empower transformation efforts far more timid than originally proposed — and needed — as a result. Yet another round of weakening then often occurs when these initiatives become subject to regulation and practices of a state’s entrenched educational agency bureaucracy.
Insights from insiders-turned-reformers are particularly revealing.
Joe Graba brought to the education reform movement a solid education-establishment pedigree: a former biology teacher who went on to become vice president of the Minnesota Federation of Teachers, then became chair of the K-12 education finance committee in his second term as a member of the state House of Representatives. When he left the legislature, Graba was appointed deputy state commissioner of Education and, after heading a few other efforts, became founding dean of a graduate school of education. Having seen what wasn’t working from just about every angle, Graba caught the attention of many when in 2004, now with the reform group Education| Evolving, he said: “[I]f this country is going to come anywhere near meeting its escalated expectations for our schools, we’ve got to create significant numbers of schools that are different in fundamental ways from the schools we [have].… We [cannot] get the kinds of schools we need by changing the schools we have.”90
The institutions managing and maintaining the status quo in public education — everything from state education agencies to local school boards, from the political activity of teacher unions to tenure rules — was and remains an obstacle to the type of bold, truly transformative changes that are needed to turn around persistently failing schools in ways that achieve long-lasting academic success.91
32
Former federal and state education official Andy Smarick, cited earlier, echoed these sentiments, offering his take on the failure of past turnaround efforts and the continuing hopelessness of these programs: “Overall, school turnaround efforts have consistently fallen far short of hopes and expectations. Quite simply, turnarounds are not a scalable strategy for fixing America’s troubled urban school systems.… [The] fixation with fix-it efforts is misguided. Turnarounds have consistently shown themselves to be ineffective, and our relentless preoccupation with improving the worst schools actually inhibits the development of a healthy urban public-education industry.”92
Smarick advocates for a cleaner, quicker approach: close the failing schools completely and replace them with new school models. He notes that states’ charter school programs are well suited to accomplish the response for creating new schools, and cites some examples where education’s political leaders have had the strength and stamina to close failing traditional schools on a broad scale — New York City Schools Chancellor Joel Klein is one of these. Michelle Rhee in Washington, DC, and Andrés Alonzo in Baltimore also started their tenures as the head of an urban public education system by closing schools that were not working for kids, and encouraging alternatives such as new charter schools to sprout to help fill the resulting void.
But even where they’re working, public charter schools themselves have shown that they aren’t the complete answer; when they don’t perform as promised, they are not even part of the right answer. The discussion in the previous section highlights more fully some of these limitations.
Little Political Will for Large-Scale Reform
The reality of most public education systems is that there are simply too few Kleins or Rhees or Alonzos, and even gutsy and transformative leaders that do exist rarely remain in charge of their cities’ reform efforts for longer than a handful of years. More often than not, the disruption caused by widespread closure of existing public schools, even when shuttering schools with long track records of educational failure, is or becomes intolerable to city political leaders. The necessary political support for sweeping school closures by even the boldest of reformers rarely exists — at least not for as long as is needed to get the job done.
More than a half-decade ago, the Coalition for Student Achievement (reconfigured and now known as College and Career Ready America), a collective of both mainstream and reform education intelligentsia, called for the closure of the lowest-performing 5 percent of each state’s public schools and replacing them with new schools. Of course, the call was made for these new replacement schools to be “high-performing”
More often than not, the disruption caused by widespread closure of existing public schools, even when shuttering schools with long track records of educational failure, is or becomes intolerable to city political leaders.
33
ones, though little more was offered than a single school model or another that had reportedly worked well somewhere else. This “rank-and-yank” approach has a storied history with roots in legendary General Electric CEO Jack Welch’s approach to personnel management; while not without criticism for being too formulaic and structured to lack any context, the call for closure of the lowest-performing 5 percent of public schools was a fundamental and oft-repeated part of the School Improvement Grant program’s guiding philosophy.
But it didn’t happen.
It didn’t happen because school closures were not made a required condition of getting federal school improvement funds, and the lack of a closure requirement was due to a lack of political will to make it part of the SIG policy. A study of the implementation of the SIG program in 10 states by the Seattle-based Center on Reinventing Public Education documented that the most significant constraint faced by state education agencies to achieve the envisioned reform goals was a similar lack of administrative will. “We found that the will to act is often the biggest barrier for those trying to transform their agencies. Without strong leadership and commitment to improving low-performing schools, more resources or legislative changes are unlikely to bring about meaningful change.”93
Noting the legacy of failure in turning around failing urban schools, reformer Smarick calls for limiting the choice of transformation models under any program to one: closure.94 To date, however, while arguably a public sentiment that some school closures are eventually inevitable, advocating for sweeping closures based on performance thresholds has had little impact on changing a political climate that strongly resists that approach.

34
Transforming Failing Schools Still Worth Trying — But Do It Differently If broadscale turnaround efforts are destined to fail, why keep trying to transform failing schools?
Without Better Alternatives, Closing Schools Hurts Kids …
Eliminating a failing school simply by closing it seems like an easy solution — one less low-performing school in which kids are forced to enroll. But too often, school closure decisions are made without ensuring that students indeed have a better place to go. Even the country’s charter-school movement is becoming characterized by formula-driven school-closure decisions without sufficiently weighing the answer to the fundamental question: “What will happen to the kids?”
A December 2014 charter school forum, for example, presented a new report by the National Association of Charter School Authorizers that praised states that take an aggressive approach to closing low-performing charter schools. Black Alliance for Educational Options President Ken Campbell, however, noted that his efforts to improve school quality in Louisiana always included assuring that students had a better school option readily available to them before closing the school they currently attend. Of all the panelists, Campbell was the only one to mention the need to provide options for students when closing schools.
In the single school year before SIG program implementation began in earnest, more than 1,800 public schools were closed across the country, displacing well over one million students.95 No one knows whether any of those students are better off because of those school closings. “There is scant research examining whether closing a school and transferring students to another school causes educational harm,” noted one review of school-closure studies.96
The small amount of good research that does exist on the effect of school closures on student achievement paints, at best, an inconclusive picture.
Renaissance 2010, a reform effort in Chicago, called for the city school district to close between 60 and 70 schools while creating 100 new public schools by 2010. A study of the Renaissance program found few statistically significant differences in academic performance between Renaissance-supported schools and matched student samples from the sending schools. The researchers attributed the lack of better student performance to struggles faced by new start-up schools during their early years.97
Eliminating a failing school simply by closing it seems like an easy solution — one less low-performing school in which kids are forced to enroll. But too often, school closure decisions are made without ensuring that students indeed have a better place to go.
35
A study by the University of Chicago Consortium on Chicago School Research around the same time found that while student test scores for those attending closed schools dipped below their “expected learning trajectory,” scores tended to return to their expected level once students were situated at their new school. While there were other negative effects on students from closing schools, the authors concluded that such effects were short-term. But an important additional finding was that there were no significant positive effects, either: closing low-performing schools and transferring students did not result in increased academic achievement.98 “The lack of any positive effect is because the schools to which students transferred were no different academically or in student composition,” noted one review.99
In a study of a single urban district that was closing schools due to lower enrollment, and which sought to close low-performing schools and transfer students to higher-performing alternatives in the district, researchers affiliated with the RAND Corporation found that “students displaced by school closures can experience adverse effects on test scores and attendance, but these effects can be minimized when students move to schools that are higher-performing (in value-added terms).”100
One of the more comprehensive and more recent studies on the topic measured what happened to students from 200 closed schools in Michigan. Unlike much of the previous literature, some positive results were found: “After closure, students continue to perform at a low level in the first year in a new school but improve significantly within two to three years after displacement,” the study concluded, noting that displaced students from lower-performing closed schools posted greater improvements than students from other closed schools, given a few years for these students to grow in their new environments. The impact on receiving schools was negative but modestly so, the study concluded, with speculation that these effects “may mitigate much of the improvement in student achievement that results from the student leaving the low-performing school.”101
This research came with a warning of the impact on students of a broad school-closure policy that didn’t also guarantee that there were better alternatives readily available and accessible: “These results have important implications for policymakers.… It may be very hard for a policy that sought to close persistently low-performing schools and move students to higher-performing schools within the district to substantially help student achievement. There often may not be enough high-performing schools within the district to send students, and the influxes of new students may harm student achievement.”102
Finally, school closure decisions often raise equity questions because such closures fall disproportionately on schools with high percentages of low-income and minority students. Transforming failing schools — when done the right way to generate the promised academic improvement — offers policymakers an avenue of action that avoids such questions.
...[S]chool closure decisions often raise equity questions because such closures fall disproportionately on schools with high percentages of low-income and minority students.

36
… and Access to Enough Better Alternatives Isn’t Always Available
Reformers who endorse a broad policy of closure rather than transformation of persistently low-performing schools frequently state that closures make room for new replacement schools (typically including public charter schools) and that, on average, such new schools have a better track record of success than turnaround attempts.103 But among the justified reasons for political and policy leaders’ hesitation to close low-performing schools, on either a sweeping or smaller scale, is that too often a nonfailing alternative simply is not readily and/or immediately available.
In particular, public charter schools rarely are certified as excellent, or even “better” alternatives until sound evaluations of student performance scores can be performed well into a school’s first charter term, which usually spans five years. For proper growth and value-added analyses, the needed time often is several years into a school’s second charter term. Many start-up schools — whether charter, traditional, or an alternative design being piloted by a district — also have start-up challenges related to facilities, staffing, and other items that impact students and learning. Additionally, many new schools start out smaller and grow by adding a grade level each year until they reach their full planned configuration; to date, the practice of closing low-performing traditional schools has not been a phase-out that matches the planned expansion of a new school, but rather a shutdown that ceases instruction for all grade levels previously served. Taken together, these realities mean that the opening of a new school usually offers insufficient space to accommodate students that would be incoming from a closed district school.
Additionally, public charter schools in existence long enough to be certified as “good ones,” successful district magnet schools, and other high-performing public schools often operate at or near capacity enrollment. For charter schools, authorizers demand sound fiscal operations, which typically means operating with full classrooms. For a school to earn renewal of its charter, many are required to evidence sufficient parental demand by detailing enrollment waiting lists maintained at each grade level. Thus, there rarely are established, excellent charter schools that can quickly absorb the student body of a closing low-performing traditional district school.
With most new public schools not yet proven or soundly established, and with existing quality schools and programs more often than not fully enrolled, quality alternatives to a low-performing district school rarely exist immediately, within access to the affected community, and to the degree necessary to absorb the full enrollment of a low-performing district school. Creating a sufficiently coordinated “phase-out-the-bad, phase-in-the-good” policy presents complex issues that likely would seriously infringe upon the new school’s program administration or autonomy.
While it may sound promising, a simply stated plan to close the bad schools and open good ones in their place faces serious and real practical barriers.
37
Rethinking the Approach
While turnarounds have not worked as a transformative public education reform policy on a sweeping scale, they have worked in select individual instances. The lessons learned from past turnaround efforts do not call for a wholesale all-or-nothing response, just the right approach that includes several critical design features. While turnarounds may not be a scalable strategy on a nationwide, statewide, or citywide level, the turnaround of failing schools on an individual, school-by-school basis — when done right — can succeed.
If we are not to give up on such policies entirely, a new approach with a different and successful design is needed. We simply need to stop doing the stuff that has for years repeatedly failed and start doing more of what has worked and shown promise. It requires a radical rethinking of how to approach the problem.
38
Focus Only on Turnaround Strategies and Activities That WorkThere is no surefire recipe for transforming low-performing schools into success stories. Characteristics of low-income, high-achieving urban schools often used as examples of excellence are well-publicized, but more often than not these examples are of newly started schools, ventures tried in pockets of persistent academic failure. Multiple design features of these new models and new designs clearly contribute to the schools’ success with previously ineffectively served student populations, but these features are not necessarily ones that translate well when dropped into a currently failing school nor the ones that cause the transformation envisioned and often promised.
More often than not, the problems facing persistently low-performing schools are the result of a combination of various major factors — low-quality instruction, violence, low student attendance, apathetic school culture, and high teacher and leader turnover that leads to inconsistent academic direction. Different degrees of, or dominance by, any one of these ingredients of failure versus another requires a different mix of turnaround inputs to achieve a measure of successful transformation. One group of researchers “did not find any empirical studies that reached the rigor necessary to determine that specific turnaround practices produce significantly better academic outcomes,” and “research on school turnarounds … clearly indicates that there is no specific set of actions that applies equally well to every turnaround situation.”104
What Doesn’t Work
The experience of school turnaround efforts to date has given us information about what types of policy design approaches will likely continue to fail. Creating incentives that keep current school staff and leadership intact does not work. Bringing in district-sponsored or outside consultants to write up a reform plan and leave it in the hands of existing school or district staff does not work. Simply changing the curriculum, but shying away from fostering whole-school culture changes, does not work. Efforts to fix academics and culture while ignoring governance and operational dysfunctions do not work. While opening new public charter schools can provide nonfailing options for families and can stimulate local competition that drives districts to improve, the opening and growth of these alternative schools has not been sufficiently coordinated with the dismantling and closure of failing schools in ways that ensure all affected students are the ones being helped by these new schools.
The lessons of history, and most of the valid research on school transformations, support the conclusion that successfully turning around a low-performing school cannot be achieved by approaching reform in piecemeal fashion. “School turnaround is a process that fully reforms the environment and practices in the lowest performing schools,” one study notes. “Rather than changing one or two characteristics of the school, successful school turnarounds look at simultaneously improving leadership,
39
expectations, teaching and learning methods and cultures, school culture, and relationships with the wider community.”105
What Does Work
After diagnosing elements that caused the shortfalls of its $773 million Renewal Schools program — including an inability to recruit sufficient numbers of appropriately talented school leaders, fractured bureaucratic oversight, and lack of parent buy-in, as noted earlier — the New York City Department of Education outlined several important lessons it learned about “what actions and strategies promote school improvement,” including:
• Strength of the school principal is key.
• Communicate and execute a vision for change built on extensive collaboration among teachers, administrators, and community-school partners.
• Ensure a schoolwide embrace of data to identify problems, monitor programs, quickly develop solutions, and focus on intensely data-driven instruction.
• Leverage community-school partnerships to deepen relationships among schools, local service providers, and families.
• Concentrate as much on transforming school culture as strengthening academics.
• Form strong, supportive personal connections with students and their families, and with their community support and service networks, while encouraging administrators and teachers to build similar bonds.
• Use on-site teacher coaches deeply familiar with the materials used in each school and adept at working with teachers106
These lessons learned, plus numerous other lessons from past failed attempts at school turnarounds, research from the field on what works and what doesn’t, and the few successful and lasting school turnarounds that do exist clearly signal elements of reform that are vital to success. These include:107
• Sufficient Political Will. Too often, school transformation efforts have been hamstrung by state or local political leaders unwilling to both demand and allow the type of wholesale policies and actions necessary to achieve immediate and lasting change. School overhaul programs originally proposed to include all the key elements for success — such as those in this list — often become watered down as they go through the process of legislative negotiation, education agency regulation, and local implementation. Public and political support for bold change at all levels needs to persist for as long as such change is needed.
• Strong Leadership. A turnaround school leader — a new leader brought in specifically to change the course of the school108 — should effectively communicate a commitment to dramatic change and the urgency for that change. They must advocate for that change, support it, and have the capacity
40
to lead it. School turnarounds do not happen on their own — laser-focused, empowered transformation leaders drive such change.
• The Right Staff. Without exception, every member of the school staff must be committed to the dramatic change planned for the school and each must be ready to embrace both schoolwide and individual changes demanded by the school leader. This almost always requires the replacement of select staff, and thus rarely can be effectively and quickly accomplished within the confines of typical teacher and school staff collective bargaining contracts. In failing schools targeted for successful turnaround, the avoidance of existing contracts must be allowed, and the turnaround leader should be given the ability to rehire (or not) current staff, renegotiate a new contract, and establish a turnaround version of the school without being bound by the local teacher and staff contract.109
Importantly, the school takeover experience in Lawrence, Massachusetts, shows that transformation leaders empowered with this authority still can work successfully with local teacher unions to put in place redesigned collective bargaining agreements when all parties are committed to reform.
• Independence to Act. Turnaround schools should operate in an environment largely free from control of a governance structure other than a well-defined accountability framework that includes goals and timelines to achieve those goals. As with the freedom to select the best staff for the effort, flexibility also must exist in the ability to set daily schedules and the annual school calendar, select curriculum, and determine budgetary needs. Here, too, the early successes in Lawrence depended on the independence to take these actions.
If school district structures want to be directly supportive without “getting in the way” of the reform, central offices could make back-office functions, real estate services, school meal services, and similar systems support available on an as-requested basis.
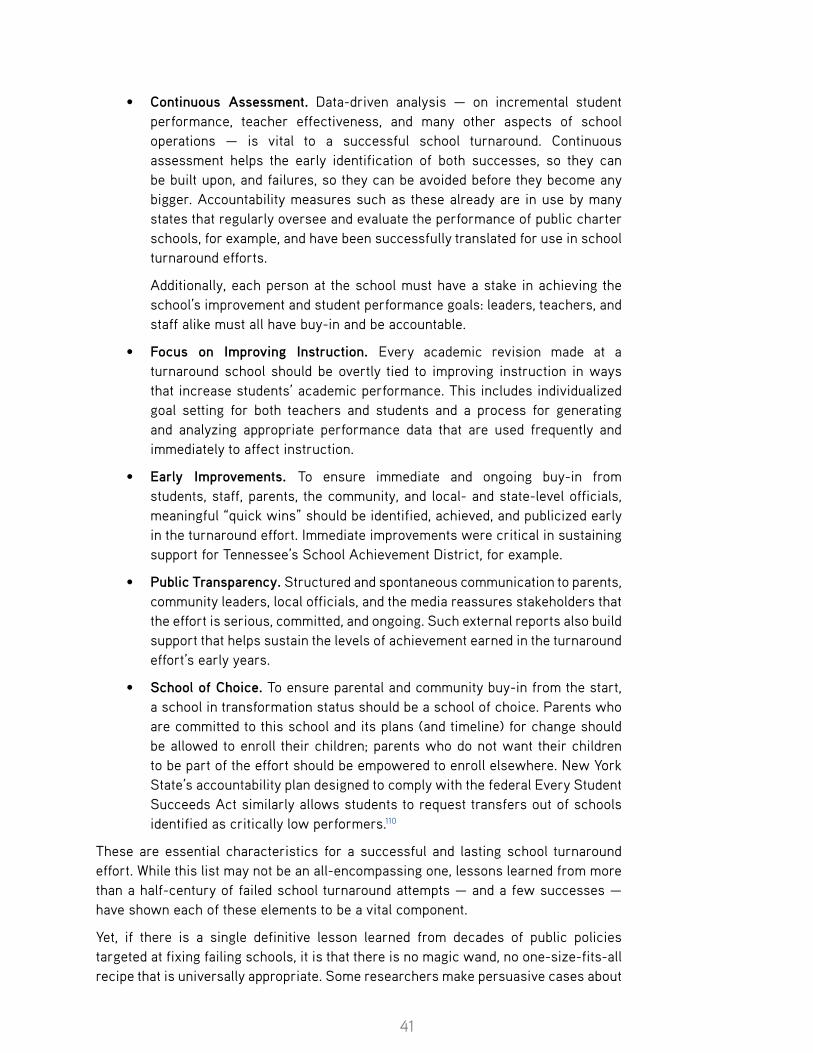
41
• Continuous Assessment. Data-driven analysis — on incremental student performance, teacher effectiveness, and many other aspects of school operations — is vital to a successful school turnaround. Continuous assessment helps the early identification of both successes, so they can be built upon, and failures, so they can be avoided before they become any bigger. Accountability measures such as these already are in use by many states that regularly oversee and evaluate the performance of public charter schools, for example, and have been successfully translated for use in school turnaround efforts.
Additionally, each person at the school must have a stake in achieving the school’s improvement and student performance goals: leaders, teachers, and staff alike must all have buy-in and be accountable.
• Focus on Improving Instruction. Every academic revision made at a turnaround school should be overtly tied to improving instruction in ways that increase students’ academic performance. This includes individualized goal setting for both teachers and students and a process for generating and analyzing appropriate performance data that are used frequently and immediately to affect instruction.
• Early Improvements. To ensure immediate and ongoing buy-in from students, staff, parents, the community, and local- and state-level officials, meaningful “quick wins” should be identified, achieved, and publicized early in the turnaround effort. Immediate improvements were critical in sustaining support for Tennessee’s School Achievement District, for example.
• Public Transparency. Structured and spontaneous communication to parents, community leaders, local officials, and the media reassures stakeholders that the effort is serious, committed, and ongoing. Such external reports also build support that helps sustain the levels of achievement earned in the turnaround effort’s early years.
• School of Choice. To ensure parental and community buy-in from the start, a school in transformation status should be a school of choice. Parents who are committed to this school and its plans (and timeline) for change should be allowed to enroll their children; parents who do not want their children to be part of the effort should be empowered to enroll elsewhere. New York State’s accountability plan designed to comply with the federal Every Student Succeeds Act similarly allows students to request transfers out of schools identified as critically low performers.110
These are essential characteristics for a successful and lasting school turnaround effort. While this list may not be an all-encompassing one, lessons learned from more than a half-century of failed school turnaround attempts — and a few successes — have shown each of these elements to be a vital component.
Yet, if there is a single definitive lesson learned from decades of public policies targeted at fixing failing schools, it is that there is no magic wand, no one-size-fits-all recipe that is universally appropriate. Some researchers make persuasive cases about

42
the need for other features to be included in turnaround efforts, including providing so-called wraparound social services (“… solutions for transforming persistently low-performing, high poverty schools into centers of academic excellence lie in addressing head-on the poverty-related barriers to learning,” notes Turnaround for Children111), and arts education (“At-risk students with access to the arts inside or outside classrooms, do better academically, aim higher in their career goals, and become more civically involved,” with four longitudinal studies finding “high school students who earned few or no arts credits were five times more likely not to have graduated than students who earned many credits”112), for example.
Even so, while the above list may not be an all-inclusive mix of ingredients needed for success, it is a safe bet that if any turnaround effort is missing one or two of these key elements — as has been the case in most of the turnaround attempts of the past 50 years noted earlier in this report — meaningful and lasting school improvement is likely to stay out of reach.
When a Turnaround Effort Embraces Essential Characteristics: Success
When a school turnaround effort embraces the characteristics essential for fundamental reform, dramatic success can follow.
Consider the example of Palmetto Elementary School in Orlando, Florida, a state that assigns letter grades to schools based on the performance of their students. In 2013-14, Palmetto Elementary was the only school in the entire state to jump from a grade of F the year before to an A. How was this significant and immediate transformation achieved?
After the 2012-13 school year, Palmetto Elementary was given a grade of “F” by the Florida State Education Department. The school earned it: only 28 percent of fourth-graders tested proficient on the state reading test and only 24 percent passed the math test.
43
The school’s new principal, Angela Murphy-Osborne, was determined to change things — and quickly. Murphy-Osborne came to Palmetto from a similar school in the county; in each of her last five years there, the school earned an A, and was one of only seven schools in the entire state to earn recognition as a “Title I Distinguished School” one of those years. She knew what she was doing.
Murphy-Osborne led the charge for wholesale transformation of the school. Among the changes instituted:
• New instructional staff was hired. At the beginning of 2013-14, about one-third of the teachers were brand new to the school and almost two-thirds had less than four years of experience. Murphy-Osborne took teachers with “a good attitude” who were willing to be trained.
• Expectations and the strategies necessary to meet those expectations were made a focal point.
• Individualized learning plans based on performance data were developed for each student.
• After-school tutoring was offered with incentives (reward field trips) for students who came to the optional program.
• A partnership with a neighborhood church was formed to provide clothes, basic household supplies, and support for the school’s low-income families.
• Student academic successes were rewarded and celebrated. Charts with the progress — or lack thereof — of each classroom were prominently displayed.
• Truancy was actively addressed and substantially reduced.
After just one year under Murphy-Osborne’s leadership, everything had changed. Palmetto was among the top elementary schools in the county on the state writing test. Pass rates on the fourth-grade reading test nearly doubled, and in math they almost tripled. On the fifth-grade science test, proficiency rates doubled.113 The school has received an A grade every year since (even after Murphy-Osborne’s transfer to a new school in 2016), and is now in the top 10 percent of all elementary schools in Florida for math and ELA performance.114
Sometimes a turnaround solution comes easier when the existing school bureaucracy, one that has failed to achieve turnaround success, significantly relinquishes control. Look to Chicago for such an example.
Under contract with Chicago Public Schools, the nonprofit organization Academy for Urban School Leadership (AUSL) undertakes a comprehensive overhaul of persistently low-performing neighborhood schools designated for turnaround by the city school district. AUSL installs new leadership, new curriculum, new school culture, a dependency on data-driven practices, and more. It runs the nation’s largest (and first) teacher residency program, specifically training classroom teachers in AUSL standards and practices, and then placing these teachers in its takeover schools. The staffing and programmatic changes happen between school years, with the same students returning to the same school in the fall. AUSL currently manages 31 public
44
schools in Chicago, and has serving nearly 17,000 students, nearly all of whom are black, Latino, and/or low-income.
Successes claimed by AUSL include promising statistic such as: 81 percent of schools are in “good standing” as of 2017 compared to 40 percent when the rating system was implemented in 2014, and none of the schools they serve now require intensive support from the Chicago public school district compared to 17 percent in 2014. AUSL also notes that 97 percent of students served at its schools are accepted into college, with 94 percent assessed to be “on track” as freshmen.115
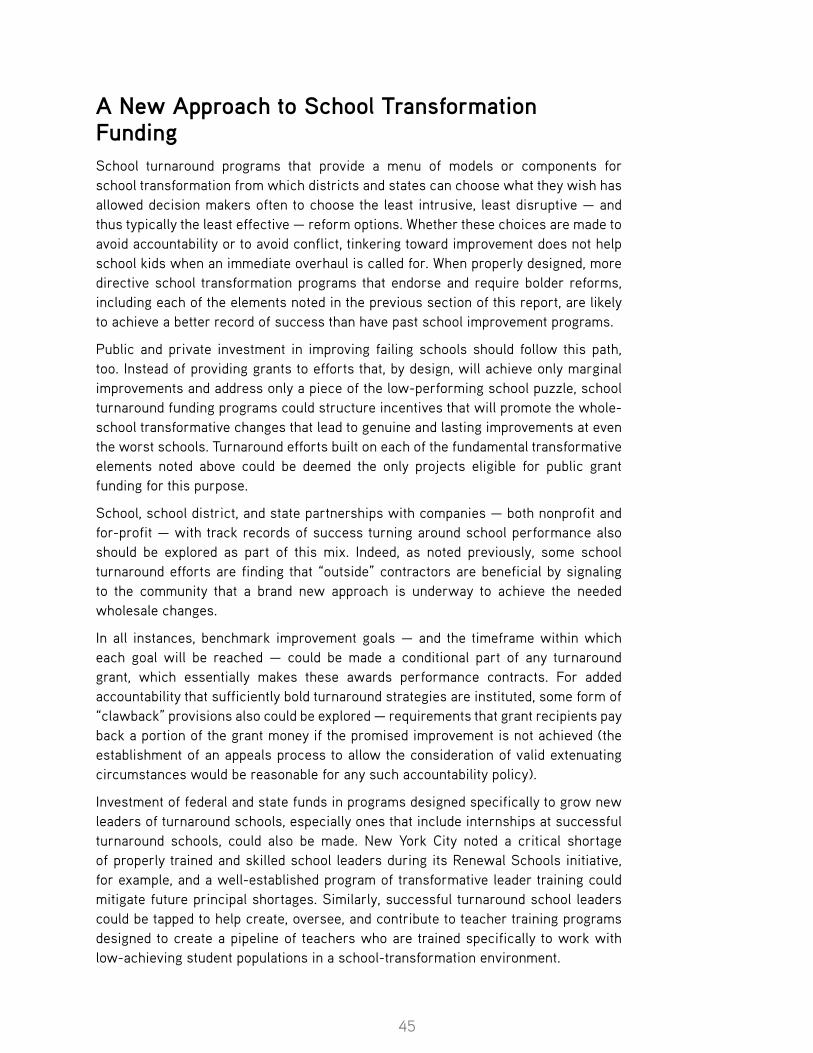
45
A New Approach to School Transformation FundingSchool turnaround programs that provide a menu of models or components for school transformation from which districts and states can choose what they wish has allowed decision makers often to choose the least intrusive, least disruptive — and thus typically the least effective — reform options. Whether these choices are made to avoid accountability or to avoid conflict, tinkering toward improvement does not help school kids when an immediate overhaul is called for. When properly designed, more directive school transformation programs that endorse and require bolder reforms, including each of the elements noted in the previous section of this report, are likely to achieve a better record of success than have past school improvement programs.
Public and private investment in improving failing schools should follow this path, too. Instead of providing grants to efforts that, by design, will achieve only marginal improvements and address only a piece of the low-performing school puzzle, school turnaround funding programs could structure incentives that will promote the whole-school transformative changes that lead to genuine and lasting improvements at even the worst schools. Turnaround efforts built on each of the fundamental transformative elements noted above could be deemed the only projects eligible for public grant funding for this purpose.
School, school district, and state partnerships with companies — both nonprofit and for-profit — with track records of success turning around school performance also should be explored as part of this mix. Indeed, as noted previously, some school turnaround efforts are finding that “outside” contractors are beneficial by signaling to the community that a brand new approach is underway to achieve the needed wholesale changes.
In all instances, benchmark improvement goals — and the timeframe within which each goal will be reached — could be made a conditional part of any turnaround grant, which essentially makes these awards performance contracts. For added accountability that sufficiently bold turnaround strategies are instituted, some form of “clawback” provisions also could be explored — requirements that grant recipients pay back a portion of the grant money if the promised improvement is not achieved (the establishment of an appeals process to allow the consideration of valid extenuating circumstances would be reasonable for any such accountability policy).
Investment of federal and state funds in programs designed specifically to grow new leaders of turnaround schools, especially ones that include internships at successful turnaround schools, could also be made. New York City noted a critical shortage of properly trained and skilled school leaders during its Renewal Schools initiative, for example, and a well-established program of transformative leader training could mitigate future principal shortages. Similarly, successful turnaround school leaders could be tapped to help create, oversee, and contribute to teacher training programs designed to create a pipeline of teachers who are trained specifically to work with low-achieving student populations in a school-transformation environment.

46
One practice to consider in this process may be simply for governmental structures — including state education departments, school district administrations, and public charter school authorizers — to stay out of the way once turnaround efforts are underway. A plan to transform a persistently failing school could be constructed as a performance contract, and periodic reporting on agreed-upon accountability standards focused on achievement goals may be the only critical element of government intervention needed. Services that a turnaround effort may find useful — back-office support by a local school district’s central office, or a regional special-education collaborative, for example — also could be made available by central school districts to turnaround schools when requested by the schools’ transformation leaders.
Transformation of persistently failing schools has been tried, and tried, and tried again. Most attempts have failed dramatically. Still, it is reasonable to view improving low-performing schools as a moral mandate: providing a quality public education to all students is an obligation, and so fixing those schools that are failing must be done. What we know, too, is that it can be done. The lessons learned from what has been far too many failed efforts need to be heeded now. Reformers and political leaders willing to steel themselves against political pushback and refuse to concede to those who want less than a full turnaround effort can get the job done.
Expecting anything less than an end to failing schools and designing a program that allows anything less than the overhaul needed to achieve that will result in another failed school turnaround attempt, another failure to help those students who need it the most.
47
Endnotes1 Richard J. Murnane, “Improving the Education of Children Living in Poverty,” Future of Children 17,
2 (2007): 161-82, https://files.eric.ed.gov/fulltext/EJ795871.pdf.
2 Elementary and Secondary Education Act of 1965, Section 201, https://innovation.ed.gov/files/2018/10/Elementary-And-Secondary-Education-Act-Of-1965_Update_August_2018.pdf; and ibid.
3 David Hursh, “The Growth of High-Stakes Testing in the USA: Accountability, Markets and the Decline in Educational Equality,” British Educational Research Journal 31, 5 (2005): 605-22.
4 A comparative analysis of student scores on the National Assessment of Educational Progress (NAEP) found NCLB positively impacted fourth-grade math scores for all students and for traditionally lower-performing subgroups eighth-grade math, but had no impact on fourth- or eighth-grade reading scores. See Thomas S. Dee and Brian Jacob, “The Impact of No Child Left Behind on Student Achievement,” Journal of Policy Analysis and Management 30, 3 (2011): 418-46; and Thomas Dee and Brian Jacob, “The Impact of No Child Left Behind on Students, Teachers, and Schools,” Brookings Papers on Economic Activity (Fall 2010): 149-207, https://www.brookings.edu/wp-content/uploads/2010/09/2010b_bpea_dee.pdf.
5 U.S. Department of Education, See, for example, “ESEA Flexibility,” December 8, 2015, https://www.ed.gov/category/keyword/esea-flexibility. Also, “Waiver Watch,” Center on Education Policy, accessed July 11, 2019, https://www.cep-dc.org/displayTopics.cfm?DocumentSubTopicID=48.
6 “The Annenberg Challenge,” Annenberg Foundation, accessed July 12, 2019, https://annenberg.org/initiatives/education/annenberg-challenge/. Matching funds were raised (estimated to have totaled about $600 million), and smaller grants were made to national school reform organizations and rural schools.
7 Mark A. Smylie and Stacy A. Wenzel, The Chicago Annenberg Challenge: Successes, Failures, and Lessons for the Future: Final Technical Report of the Chicago Annenberg Research Project (Chicago: Consortium of Chicago School Research, August 2003), https://files.eric.ed.gov/fulltext/ED482425.pdf.
8 Christine C. George, “The Chicago Annenberg Challenge: The Messiness and Uncertainty of Systems Change,” in Lessons in Philanthropy: A Case Study Approach, ed. Louis Delgado (Chicago: Loyola University, June 2007): 8-30, https://ecommons.luc.edu/cgi/viewcontent.cgi?referer=&httpsredir=1&article=1017&context=curl_pubs.
9 Deborah Meier, “The Collapse of the Annenberg Challenge,” Education Week Bridging Differences blog, July 17, 2008, http://blogs.edweek.org/edweek/Bridging-Differences/2008/07/dear_diane_every_few_days.html.
10 George, “The Chicago Annenberg Challenge.”
11 2009 Annual Letter from Bill Gates (Seattle: Bill & Melinda Gates Foundation, January 2009), https://docs.gatesfoundation.org/Documents/2009-bill-gates-annual-letter.pdf.
12 Ibid.
13 Atila Abdulkadiroğlu, Weiwei Hu, and Parag A. Pathak, Small High Schools and Student Achievement: Lottery-Based Evidence from New York City, NBER Working Paper 19576 (Boston: National Bureau of Economic Research, October 2013), https://www.nber.org/papers/w19576.pdf.
14 “The Broad Prize: Spotlighting excellence in districts and charter networks,” Eli and Edythe Broad Foundation, accessed July 12, 2019, http://www.broadprize.org/resources/75_districts.html; https://broadfoundation.org/grantees/the-broad-prize/.
15 Motoko Rich, “Billionaire Suspends Prize Given to Schools,” New York Times, February 9, 2015, http://www.nytimes.com/2015/02/10/education/billionaire-suspends-prize-given-to-schools.html?_r=1.
48
16 District winners of the Broad Prize include: Houston Independent (2002 and 2013); Long Beach Unified (2003); Garden Grove (2004); Norfolk (2005); Boston (2006); New York City Department of Education (2007); Brownsville Independent (2008); Alden Independent (2009); Gwinnett County (2010 and 2014); Charlotte-Mecklenburg (2011); Miami Dade County (2012); and Orange County FL (2014).
17 Greg Anrig, Lessons from School Improvement Grants that Worked, Issue Brief (New York: Century Foundation, July 23, 2015), https://tcf.org/assets/downloads/Anrig_LessonsFromSchoolImprovementGrants.pdf.
18 School Improvement Grants: Early Implementation Under Way, but Reforms Affected by Short Time Frames (Washington, DC: U.S. Government Accountability Office, July 2011), https://www.gao.gov/assets/330/321780.pdf.
19 Steven Hurlburt et al., School Improvement Grants: Analyses of State Applications and Eligible and Awarded Schools, NCEE 2012-4060 (Washington, DC: National Center for Education Evaluation and Regional Assistance, Institute of Education Science, October 2012), http://ies.ed.gov/ncee/pubs/20124060/pdf/20124060.pdf. An allowance for districts to try other options at reform sometimes is classified as a fifth option, and sometimes has been cited as a “loophole” in the NCLB-mandated restructuring approach.
20 SIG application, at https://www2.ed.gov/programs/sif/applicant.html.
21 Hurlburt et al., School Improvement Grants.
22 “School Improvement Grants: Funding,” U.S. Department of Education, last modified June 10, 2015, https://www2.ed.gov/programs/sif/funding.html.
23 Sarah Yatsko et al., Tinkering Toward Transformation: A Look at Federal School Improvement Grant Implementation (Seattle: Center on Reinventing Public Education, University of Washington, March 2012), http://files.eric.ed.gov/fulltext/ED532630.pdf.
24 Hurlburt et al., School Improvement Grants. The proportion of schools choosing less-drastic change models has increased slightly and the proportion of schools choosing more-drastic options has decreased slightly since the program’s earlier years. See “Turnaround Schools,” Education Week, accessed July 12, 2019, http://www.edweek.org/ew/collections/turnaround-schools/.
25 Hurlbut et al., School Improvement Grants.
26 U.S. Department of Education, “U.S. Department of Education Releases Early Snapshot of School Improvement Grants Data,” press release, November 19, 2012, http://www.ed.gov/news/press-releases/us-department-education-releases-early-snapshot-school-improvement-grants-data. Also, Greg Toppo, “Leaving no school behind: Can bad ones be turned around?,” USA Today, April 28, 2013, http://www.usatoday.com/story/news/nation/2013/04/28/failing-schools-turnaround-education/2116171/.
27 Emma Brown, “With ‘reconstitution,’ D.C. officials hope for school turnaround,” Washington Post, June 10, 2013, https://www.washingtonpost.com/local/education/with-reconstitution-dc-officials-hope-for-school-turnaround/2013/06/10/9c998a44-cb0a-11e2-9245-773c0123c027_story.html?noredirect=on&utm_term=.f98d6543b65e.
28 Michele McLaughlin, at the time an aide to the Senate Education Committee and now president of Knowledge Alliance, noted that states “… view[ed] the four models, which are based primarily on personnel and management changes, as too narrow.” In Alyson Klein, “SIG Program Gets Makeover in Newly Passed Budget: Flexibility for states, districts may grow under SIG program,” Education Week, January 28, 2014, http://www.edweek.org/ew/articles/2014/01/29/19budget-sig.h33.html.
29 Ibid.
30 Robert Slavin, “School Improvement Grants Embrace Evidence of Effectiveness,” Huffington Post, February 20, 2014, http://www.huffingtonpost.com/robert-e-slavin/school-improvement-grants_b_4822503.html.
31 Lisa Drajoset et al., “School Improvement Grants: Implementation and Effectiveness” (Washington, DC: U.S. Department of Education, Institute of Education Sciences, National Center for Education Evaluation and Regional Assistance, January 2017), https://ies.ed.gov/ncee/pubs/20174013/.

49
32 ESSA Leverage Points: 50-State Report on Promising Practices For Using Evidence to Improve Student Outcomes (Washington, DC: Results for America, January 2018), https://results4america.org/tools/essa-leverage-points-50-state-report-promising-practices-using-evidence-improve-student-outcomes/.
33 Alan Ginsburg and Marshall S. Smith, Revisiting SIG: Why Critics Were Wrong to Write Off the Federal School Improvement Grant Program (Washington, DC: FutureEd, Georgetown University, September 2018, https://www.future-ed.org/wp-content/uploads/2018/09/FutureEdSIGReport.pdf. See also Anrig, Lessons from School Improvement Grants that Worked.
34 Kerstin Carlson Le Floch of the American Institutes for Research, for example, notes: “At the state level, a rigorous study of SIG in Massachusetts demonstrated robust, statistically-significant impacts on student achievement at multiple grade levels, in both reading and math. And in Massachusetts, SIG funding proved to have a statistically significant effect on closing the achievement gap compared to other non-SIG schools. Another study of SIG in California suggested that schools that implemented the Turnaround Model that called for replacing half the teachers showed student achievement gains. In contrast, a study of SIG in Michigan detected no effect of SIG on student outcomes.” See Kerstin Carlson Le Floch, “Did School Improvement Grants Work Anywhere?,” American Institutes for Research Policy Center blog, May 11, 2017, https://www.air.org/resource/did-school-improvement-grants-work-anywhere.
35 These additional states include Indiana, Louisiana, Mississippi, Ohio (a pilot program in Columbus), and Texas.
36 See Josh Cunningham, “Parent Trigger Laws in the States,” National Conference of State Legislatures, October 15, 2013, http://www.ncsl.org/research/education/state-parent-trigger-laws.aspx. Also, “Implementation and Impact Evaluation of Race to the Top and Improvement Grants,” Institute of Education Sciences, National Center for Education Evaluation and Regional Assistance, accessed July 12, 2019, https://ies.ed.gov/ncee/projects/evaluation/other_racetotop.asp.
37 Howard Blume and Teresa Watanabe, “L.A. Unified schools chief to restore parent power to overhaul failing schools,” Los Angeles Times, November 11, 2014, http://www.latimes.com/local/lanow/la-me-ln-parent-trigger--20141111-story.html.
38 Andy Smarick, “The Turnaround Fallacy,” EducationNext 10, 1 (Winter 2010): 20-6, http://educationnext.org/the-turnaround-fallacy/.
39 Andrew Calkins et al., The Turnaround Challenge: Why America’s best opportunity to dramatically improve student achievement lies in our worst-performing schools (Boston: Mass Insight Education and Research Institute, 2007), https://files.eric.ed.gov/fulltext/ED538298.pdf.
40 Ibid.
41 RS 17 §1990 — Recovery school district; creation; governance; operation, Louisiana (2006), Act 9, https://law.justia.com/codes/louisiana/2006/143/211794.html.
42 Douglas N. Harris and Matthew F. Larsen, The Effects of the New Orleans Post-Katrina Market-Based School Reforms on Student Achievement, High School Graduation, and College Outcomes (New Orleans: Education Research Alliance for New Orleans, July 15, 2018): 3, https://educationresearchalliancenola.org/files/publications/Harris-Larsen-Effects-of-New-Orleans-Post-Katrina-Market-Based-School-Reforms.pdf.
43 States that enacted takeover laws for districts or schools (plain type = district; bold = schools; italics = both): Alabama, Alaska [repealed], Arizona, Arkansas, California, Connecticut, Colorado [repealed], Delaware, Illinois, Indiana, Iowa, Kentucky, Louisiana, Maryland, Massachusetts, Michigan, Mississippi, Missouri, Nevada, New Jersey, New Mexico, New York, North Carolina, Ohio, Oklahoma, Pennsylvania, Rhode Island, South Carolina, Tennessee, Texas, Vermont, West Virginia, and Wisconsin. Sources: 50-State Report on Accountability, State Intervention, and Takeover (Newark: Institute on Education Law and Policy, Rutgers University); Domingo Morel, Takeover: Race, Education, and American Democracy (New York: Oxford University Press, 2018); and Rockefeller Institute research.
44 William J. Mathis, “NCLB’s Ultimate Restructuring Alternatives: Do they Improve the Quality of Education?” (East Lansing: Great Lakes Center for Education Research & Practice, April 2009), https://greatlakescenter.org/docs/Policy_Briefs/Mathis_Restructuring.pdf. See also Smarick, “The Turnaround Fallacy.”

50
45 James Vaznis, “Jeffrey Riley, a Boston schools administrator, is named to oversee Lawrence’s struggling district,” Boston Globe, January 11, 2012.
46 Russell Contreras, “Lawrence ed chief indicted for fraud, embezzlement,” Boston.com, March 9, 2010, at http://archive.boston.com/news/local/massachusetts/articles/2010/03/09/lawrence_supt_charged_with_fraud_embezzlement/.
47 “Key Facts for Lawrence Public Schools,” Lawrence Public Schools, updated July 12, 2017, https://www.lawrence.k12.ma.us/index.php/key-facts.
48 Monica Disare, “Dismissed Lawrence teachers fault evaluations,” Boston Globe, August 16, 2015, https://www.bostonglobe.com/metro/2015/08/16/teachers-claim-unfair-evaluations-lawrence/yvoGyHx4tJoYbsZfFE0XcN/story.html.
49 Sources for information on results in Lawrence include: Denisa R. Superville, “State Takeover Gives Mass. District a Fresh Start,” Education Week, May 6, 2015, https://www.edweek.org/ew/articles/2015/05/06/state-takeover-gives-mass-district-a-fresh.html; Back from the Brink: Lawrence, MA (Watertown: Education Resource Strategies (ERS), April 2015). See also: A. Khalid, “Under Receiver’s Rule, Lawrence Schools Show Early Gains,” WBUR Boston, March 12, 2014, http://www.wbur.org/2014/03/12/lawrence-schools, and “MCAS scores soar in Lawrence,” Eagle-Tribune, September 19, 2014, http://www.eagletribune.com/news/local_news/mcas-scores-soar-in-lawrence/article_2144cf16-4317-5894-8792-278a4d236e28.html.
50 MCAS Student Growth Percentiles: State Report (Malden: Massachusetts Department of Elementary & Secondary Education, October 2009), http://www.doe.mass.edu/mcas/growth/StateReport.pdf.
51 “2017 Official School Accountability Data – Lawrence,” School and District Profiles, Massacusetts Department of Elementary & Secondary Education, accessed July 12, 2019, http://profiles.doe.mass.edu/accountability/report/district.aspx?linkid=30&orgcode=01490000&orgtypecode=5&&fycode=2017.
52 Sources for results of Tennessee ASD schools from 2012 to 2015 include “ASD Students Outpace State in Math and Science,” Achievement School District, July 2015; Kayleigh Skinner, “Six charts showing test scores in schools that Tennessee wants to turn around,” Chalkbeat, August 11, 2015, https://chalkbeat.org/posts/tn/2015/08/11/tennessees-school-turnaround-scores-show-mixed-results-in-memphis/; Lauren Walker, “The ASD: A Catalyst for Dramatic Improvement,” Achievement School District, August 2015; Achievement School District, Building the Possible: Year Three Results (Memphis, TN: Achievement School District), July 2015; and Public Impact: Juli Kim, Tim Field, and Elaine Hargrave, The Achievement School District: Lessons from Tennessee (Chapel Hill: Public Impact and New Orleans: New Schools for New Orleans, 2015), https://publicimpact.com/wp-content/uploads/2019/02/Achievement_School_District_Lessons_From_Tennesee-Public_Impact.pdf. Aditi Sen, State Takeover of Low-Performing Schools; A Record of Academic Failure, Financial Mismanagement & Student Harm (Brooklyn: The Center for Popular Democracy, February 2016), https://populardemocracy.org/sites/default/files/National%20Takeover%20Ed%20Report.pdf, p.8-9.
53 Arianna Prothero,“ Tenn. Gov. Names New Superintendent of State-Run Achievement School District,” Education Week Charters & Choice blog, November 3, 2015, https://blogs.edweek.org/edweek/charterschoice/2015/11/tennessee_gov_names_new_superintendent_of_state-run_achievement_school_district.html.
54 Caroline Bauman, “Anderson to exit as superintendent of Tennessee’s school turnaround district,” Chalkbeat, September 6, 2017, https://www.chalkbeat.org/posts/tn/2017/09/06/anderson-out-as-superintendent-of-tennessees-school-turnaround/.
55 Jennifer Pignolet, “Shelby County Schools’ Sharon Griffin to lead state-run Achievement School District,” Commercial Appeal, April 24, 2018, https://www.commercialappeal.com/story/news/education/2018/04/24/scss-sharon-griffin-lead-state-run-achievement-school-district/545791002/.
56 SB No. 1198 — AN ACT to amend Tennessee Code Annotated, Title 49, Chapter 1, Part 6 and Section 49-6-6001, relative to school accountability. Tennessee (2017), https://publications.tnsosfiles.com/acts/110/pub/pc0177.pdf.
57 “ASD Operators,” Achievement School District, accessed July 12, 2019, http://achievementschooldistrict.org/index.php/asd-operators/.
51
58 Sharon Kebschull Barrett, Christen Holly, and Bryan C. Hassel, “Extraordinary Authority Districts”: Design Considerations—Frameworks and Takeaways (Carrboro: Public Impact, 2014): 5, https://publicimpact.com/wp-content/uploads/2014/02/Extraordinary_Authority_Districts-Public_Impact.pdf.
59 “Achievement School District Performance Indicators,” Tennessee Department of Education, accessed July 12, 2019, https://reportcard.tnk12.gov/districts/985/page/DistrictOverall.
60 Jessica Bakeman, “Cuomo aide asks Tisch to study Massachusetts takeovers,” Politico, February 13, 2016, https://www.politico.com/states/new-york/albany/story/2015/02/cuomo-aide-asks-tisch-to-study-massachusetts-takeovers-019717.
61 Letter from Jim Malatras, director of State Operations for Governor Andrew M. Cuomo, to Merryl H. Tisch, chancellor, New York State Board of Regents, February 12, 2015, https://www.governor.ny.gov/sites/governor.ny.gov/files/atoms/files/LetterMalatrastoTisch_0.pdf.
62 NY Education Law §211-f and NYCRR §100.19. Subpart E of Part EE of Chapter 56 of the Laws of 2015.
63 Jessica Bakeman, “A test of Cuomo’s schools plan, in Massachusetts,” Politico, February 12, 2016, https://www.politico.com/states/new-york/city-hall/story/2015/02/a-test-of-cuomos-schools-plan-in-massachusetts-000000.
64 “Demonstrable improvement” is calculated by the State Education Department in accordance with its Demonstrable Improvement Index (DII). A school achieving a DII of 67 percent will be determined to have sufficiently improved; a school that achieves 40 percent or lower will be determined not to have shown sufficient improvement. Schools with a DII between 40 percent and 60 percent will be reviewed by the commissioner for a final determination. Schools falling below the 40 percent threshold have the opportunity to present data on extenuating circumstances. Also considered by the commissioner will be the number of years a school has been identified as a Priority school and the success of the local superintendent in using his or her powers as a receiver to achieve reform. See MaryEllen Elia, “Moving Forward with Receivership in New York State,” PowerPoint presentation, October 14, 2015, http://www.nysed.gov/common/nysed/files/receivership-testimony.pdf.)
65 “Summary of the July 2017 Meeting of the Board of Regents of the University of the State of New York, July 17, and 18, 2017, https://www.regents.nysed.gov/common/regents/files/917bra2_0.pdf.
66 Bakeman, “A test of Cuomo’s schools plan, in Massachusetts.”
67 Julie McMahon, “Buffalo teachers sue over receivership, law giving unprecedented power to supt.,” Syracuse Herald-Journal, February 9, 2016, https://www.syracuse.com/schools/2016/02/buffalo_teachers_sue_over_receivership_law_giving_unprecendented_power_to_supt.html; also, NYS Education Department, “Commissioner MaryEllen Elia Imposes Receivership Collective Bargaining Agreement in Buffalo’s Persistently Struggling Schools,” press release, November 9, 2015, http://www.nysed.gov/news/2015/commissioner-maryellen-elia-imposes-receivership-collective-bargaining-agreement-buffalo%E2%80%99s.
68 Tiffany Lankes, “Provision may save school receivership law even as reformers fear its demise,” Buffalo News, February 9, 2016, https://buffalonews.com/2016/02/09/provision-may-save-school-receivership-law-even-as-reformers-fear-its-demise/, and Tiffany Lankes, “School receivership law withstands court challenge,” Buffalo News, October 27, 2016, https://buffalonews.com/2016/10/27/state-receivership-law-withstands-court-challenge/.
69 Keshia Clukey, “‘Struggling’ schools legislation could come under review,” Politico, October 14, 2015, https://www.politico.com/states/new-york/albany/story/2015/10/struggling-schools-legislation-could-come-under-review-026724.
70 Lankes, “School receivership law withstands court challenge.”
71 NYS Education Department, “Commissioner Elia Identifies 144 Struggling and Persistently Struggling Schools to Begin Implementation of School Receivership in New York State,” press release, July 16, 2015, http://www.nysed.gov/news/2015/commissioner-elia-identifies-144-struggling-and-persistently-struggling-schools-begin.
52
72 NYS Education Department, “State Education Department Identifies 188 Priority Schools, 84 Focus Districts and 442 Focus Schools Under Federal Accountability Requirements; 70 Schools To Be Removed From Receivership Status At End of 2015-2016 School Year,” press release, February 26, 2016, http://www.nysed.gov/Press/State-Education-Department-Identifies-188-Priority-Schools%2C-84-Focus-Districts-and-442-Focus-Schools-Under-Federal-Accountability-Requirements%3B-70-Schools-To-Be-Removed-From-Receivership-Status-At-End-Of-2015-2016-School-Year.
73 NYS Education Department, “Vast Majority of Schools in Receivership Made Demonstrable Improvement in 2016-17,” press release, October 31, 2017, http://www.nysed.gov/news/2017/vast-majority-schools-receivership-made-demonstrable-improvement-2016-17.
74 Ibid.
75 NYS Education Department, “State Education Department Identifies 27 Schools to Be Removed from Priority School Status, 8 from Receivership Status,” press release, December 1, 2017, http://www.nysed.gov/news/2017/state-education-department-identifies-27-schools-be-removed-priority-school-status-8.
76 NYS Education Department, “Vast Majority of Schools in Receivership Made Demonstrable Improvement in 2016-17.” For a list of schools in receivership status in 2017-18 and their progress designations, see “Persistently Struggling and Struggling Schools Demonstrable Improvement Status for 2017-18,” NYS Education Department, accessed July 12, 2019, http://www.p12.nysed.gov/accountability/documents/2017-18DIStatusPressRelease.pdf.
77 Telephone conversion with representatives from NYSED’s Office of Accountability (Brooklyn office), June 18, 2019.
78 As of June 2019, the fate was not yet known of three persistently failing schools in Syracuse that had not yet improved enough to avoid becoming candidates to be placed under an independent receiver.
79 S5602 — Relates to the takeover and restructuring of failing schools, companion bill in the State Assembly of A8010 (Benedetto), remained in committee as of June 10, 2019.
80 Eliza Shapiro, “New York Knew Some Schools in Its $773 Million Plan Were Likely to Fail. It Kept Children in Them Anyway,” New York Times, October 26, 2018, https://www.nytimes.com/2018/10/26/nyregion/deblasio-school-renewal-bill.html.
81 Alex Zimmerman, “NYC will keep key aspects of Renewal schools ‘indefinitely,’ even as the turnaround program nears likely end,” Chalkbeat, December 6, 2018, https://www.chalkbeat.org/posts/ny/2018/12/06/nyc-will-keep-key-aspects-of-renewal-schools-indefinitely-even-as-the-turnaround-program-nears-end/.
82 Ibid.
83 Alex Zimmerman, “Mayor de Blasio says fate of 50 turnaround schools will be decided this year,” Chalkbeat, September 5, 2018, https://www.chalkbeat.org/posts/ny/2018/09/05/mayor-says-fate-of-renewal-schools-to-be-decided-this-year/.
84 Zimmerman, “NYC will keep key aspects of Renewal schools.”
85 New York City’s Renewal School Program: Lessons in School Turnaround (New York: NYC Department of Education, February 25, 2019): 12, https://cdn-blob-prd.azureedge.net/prd-pws/docs/default-source/default-document-library/renewalreport-25feb2019.pdf.
86 New York City’s Renewal School Program, 2 and 13. Improvement figures noted in the report text (p. 2) differ from those graphically displayed in the detail of the report (p. 13). The latter figures are cited here.
87 See, for example: Kevin Welner and Julia Daniel, “New York City offers some unpleasant truths about school improvement,” Washington Post, January 7, 2019, https://www.washingtonpost.com/education/2019/01/07/new-york-city-offers-some-unpleasant-truths-about-school-improvement/?utm_term=.932e650e40b6; Shapiro, “New York Knew Some Schools in Its $773 Million Plan Were Likely to Fail.”; Alex Zimmerman, “After report that New York City is ending its Renewal turnaround program, big questions remain,” Chalkbeat, October 26, 2018, https://www.chalkbeat.org/posts/ny/2018/10/26/after-report-that-new-york-city-is-ending-its-renewal-turnaround-program-big-questions-remain/.
53
88 Isaac M. Opper et al., “Assessing the Short-term Impact of the New York City Renewal Schools Program,” working paper WR-1303-NYCDOE, RAND Education and Labor, RAND Corporation, April 2019, 17-8, https://www.rand.org/content/dam/rand/pubs/working_papers/WR1300/WR1303/RAND_WR1303.pdf.
89 New York City’s Renewal School Program, 11.
90 Joe Graba, “We Cannot Get the Schools We Need by Changing the Schools We Have,” presentation to a meeting of foundations convened jointly by Grantmakers in Education and the Philanthropy Roundtable, May 26-27, 2004, Denver, CO, http://www.educationevolving.org/pdf/Graba-Must-Change-School-Denver.pdf.
91 Harvard Business School’s Clayton Christensen’s work in The Innovator’s Dilemma (http://claytonchristensen.com/books/the-innovators-dilemma/) that laid out a theory of “disruptive innovation” and Richard Foster and Sarah Kaplan’s (McKinsey Group) supporting findings in Creative Destruction (https://www.penguinrandomhouse.com/books/54982/creative-destruction-by-richard-foster-and-sarah-kaplan/9780385501347/) are cited by Graba and others in support of this position.
92 Smarick, “The Turnaround Fallacy.” Smarick wrote this article while serving as distinguished visiting fellow at the Thomas B. Fordham Institute and adjunct fellow at the American Enterprise Institute. Smarick also was a cofounder and COO of the National Alliance for Public Charter Schools, and currently is a partner at Bellwether Education Partners.
93 “Report finds state education agencies need more commitment, talent to improve low-performing schools,” CRPE: Reinventing Public Education, December 17, 2013, http://www.crpe.org/news/press-release-report-explores-primary-obstacles-state-education-agencies-school-improvement. Ashley Jochim and Patrick J. Murphy, The Capacity Challenge: What It Takes for State Education Agencies to Support School Improvement (Seattle: Center on Reinventing Public Education, December 2013), http://www.crpe.org/publications/capacity-challenge-what-it-takes-state-education-agencies-support-school-improvement.
94 “… the state could decide that districts have only one option – not five – for schools reaching NCLB-mandated restructuring: closure” in Smarick, “The Turnaround Fallacy.”
95 Chen-Su Chen, Numbers and Types of Public Elementary and Secondary Schools From the Common Core of Data: School Year 2009-2010. NCES 2011-345rev. (Washington, DC: National Center for Education Statistics, September 2012), https://nces.ed.gov/pubsearch/pubsinfo.asp?pubid=2011345rev.
96 Gail L. Sunderman and Alexander Payne, Does Closing Schools Cause Educational Harm? A Review of the Research, Information Brief (Durham: Mid-Atlantic Equity Center, University of New Hampshire, December 2009), https://files.eric.ed.gov/fulltext/ED543514.pdf.
97 Viki M. Young et al., “Renaissance Schools Fund-Supported Schools: Early Outcomes, Challenges, and Opportunities,” paper presented at “School Choice and School Improvement: Research in State, District and Community Contexts,” Vanderbilt University, October 25-27, 2009, http://citeseerx.ist.psu.edu/viewdoc/download?doi=10.1.1.477.1762&rep=rep1&type=pdf.
98 Marisa de la Torre and Julia Gwynne, When Schools Close: Effects on Displaced Students in Chicago Public Schools (Chicago: Consortium on Chicago School Research, Urban Education Institute, the University of Chicago, October 2009), https://files.eric.ed.gov/fulltext/ED510792.pdf.
99 Sunderman and Payne, “Does Closing Schools Cause Educational Harm?”
100 John Engberg et al.,“Closing Schools in a Shrinking District: Do Student Outcomes Depend on Which Schools Are Closed?,” Journal of Urban Economics 71, 2 (March 2012), http://www.rand.org/pubs/external_publications/EP20120009.html.
101 Quentin Brummet, The Effect of School Closings on Student Achievement, Job Market Paper (Lansing: Department of Economics, Michigan State University, September 23, 2012), http://econ.msu.edu/seminars/docs/SC_Draft9232012.pdf.
102 Ibid.
103 In 2012, Andy Smarick authored a book entitled The Urban School System of the Future: Applying the Principles and Lessons of Chartering (Lanham: Rowman & Littlefield, October 2012) which calls for replacement of the current urban school district model to more effectively deliver quality public education.

54
104 Rebecca Herman et al., Turning Around Chronically Low-Performing Schools, NCEE #2008-4020 (Washington, DC: U.S. Department of Education, National Center for Education Evaluation and Regional Assistance, Institute of Education Sciences, May 2008), https://ies.ed.gov/ncee/wwc/Docs/PracticeGuide/Turnaround_pg_04181.pdf.
105 Ben Jensen, The Five Critical Steps for Turnaround Schools (Sydney: United States Studies Centre at the University of Sydney; Singapore: Alliance 21; and Melbourne: Grattan Institute, March 2013), https://grattan.edu.au/wp-content/uploads/2014/05/904_jensen_alliance_21.pdf.
106 New York City’s Renewal School Program: Lessons in School Turnaround.
107 In addition to the author’s conclusions, this list includes information, findings, and recommendations drawn from, among other sources: Anrig, Lessons from School Improvement Grants that Worked; Herman et al., Turning Around Chronically Low-Performing Schools; Julia M. Kowal and Emily Ayscue Hassel, Turnarounds With New Leaders and Staff (Washington, DC: Learning Point Associates, 2005), https://files.eric.ed.gov/fulltext/ED502903.pdf; Victor Rivero, “Turning around Schools in Need,” District Administration 45, 8 (2009): 56-61, https://eric.ed.gov/?id=EJ857433; Daniel L. Duke, “Tinkering and Turnarounds: Understanding the Contemporary Campaign to Improve Low-Performing Schools,” Journal of Education for Students Placed at Risk 17, 1-2 (2012), https://www.tandfonline.com/doi/abs/10.1080/10824669.2012.636696; When Bold Steps Are Needed: What does it really take to turn around schools? (Boston: School Turnaround Group at Mass Insight Education, revised February 2011), http://www.massinsight.org/wp-content/uploads/2015/11/TheTurnaroundChallenge_PowerPoint.pdf.
108 Various research studies note that the extent to which “top managers are replaced ranges from 33 percent to 100 percent,” with a notable study of turnarounds in the business sector pegging that figure at 70 percent. See Richard C. Hoffman, “Strategies for Corporate Turnarounds: What do we Know about Them?,” Journal of General Management 14, 3 (1989): 44-66; Herman et al., Turning Around Chronically Low-Performing Schools.
109 One prominent school-turnaround study noted that teacher union contracts were such a powerful obstacle to the type of whole-school reform needed that the Transformation Model reform option under the SIG program, which includes the preservations of school staff, should be eliminated entirely or, at a minimum, the requirement for union sign off should be erased. See Yatsko et al., Tinkering Toward Transformation: A Look at Federal School Improvement Grant Implementation.
110 8 NYCRR §100.21(i)(1)(iii)(g)), https://govt.westlaw.com/nycrr/Document/I3652900bc22211ddb29d8bee567fca9f?transitionType=Default&contextData=(sc.Default).
111 Pamela A. Cantor, Deborah S. Smolover, and Joan L. Stamler, “Innovative Designs for Persistently Low-Performing Schools: Transforming Failing Schools by Addressing Poverty-Related Barriers to Teaching and Learning,” in Transforming America’s Education Through Innovation and Technology 25, 4 (2010): 21-8, https://assets.aspeninstitute.org/content/uploads/files/content/upload/2010_Education_CR-Whistler.pdf#page=25.
112 Amy Biancolli, “Art for graduation’s sake,” Times Union, February 15, 2015, https://m.timesunion.com/tuplus-features/article/Art-for-graduation-s-sake-6081539.php; and Douglas Israel, Staying in School: Arts Education and New York City High School Graduation Rates (New York: Center for Arts Education, October 2009), https://www.creativenz.govt.nz/assets/ckeditor/attachments/1029/staying_in_school.pdf?1410234540.
113 See Mike Thomas, “How a Great Florida Principal Turned Around a Failing School,” ExcelinEd, August 19, 2014, http://excelined.org/2014/08/19/great-florida-principal-turned-around-failed-school/.
114 “Florida School Accountability Reports,” Florida Department of Education, accessed July 15, 2019, http://www.fldoe.org/accountability/accountability-reporting/school-grades/.
115 “Our Results,” AUSL: Better Schools, Brighter Futures, accessed July 15, 2019, http://auslchicago.org/ausl-schools/ausl-schools-results/.

55
ABOUT THE ROCKEFELLER INSTITUTE
Created in 1981, the Rockefeller Institute of Government is a public policy think tank providing cutting-edge, evidence-based policy. Our mission is to improve the capacities of communities, state and local governments, and the federal system to work toward genuine solutions to the nation’s problems. Through rigorous, objective, and accessible analysis and outreach, the Institute gives citizens and governments facts and tools relevant to public decisions.
Learn more at www.rockinst.org.
ACKNOWLEDGMENTS
Special thanks for comments and edits by Rockefeller Institute Board of Advisors Chair Jim Malatras and Interim Executive Director Patricia Strach. Also thanks to Nicholas Simons, Alexander Morse, and Trevor Craft for their research assistance on this report.
In addition to his position at the Rockefeller Institute, Brian Backstrom is also a board member for the Albany Charter School Network and the Henry Johnson Charter School.
56
LEARN MORE
www.rockinst.org@rockefellerinst