Embed Size (px)
Citation preview

School of Distance Education
Statistical Inference Page 1
UNIVERSITY OF CALICUT
SCHOOL OF DISTANCE EDUCATION
B Sc. Mathematics (2011 Admn.)
III SEMESTER
COMPLEMENTARY COURSE
STATISTICAL INFERENCEQUESTION BANK
1. Random sample taken from a population then the function of sample values is known as:(i)Parameter (ii) Statistic (iii) population (iv) Nome of these.
2. The probability distribution of a statistic is,(i) Sampling distribution (ii) distribution function(iii) Mass function (iv) None of these
3. A population characteristic, such as a population mean, is called(i) A statistic (ii) A parameter (iii) A sample (iv) The mean deviation
4. Which of the following is a sampling distribution:(i) Binomial (ii) Poisson (iii) Chi-square (iv) None of these
5. A simple random sample of 100 observations was taken from a large population. Thesample mean and the standard deviation were determined to be 80 and 12 respectively.The standard error of the mean is(i) 1.2 (ii) 0.8 (iii) 12 (iv) 8
6. Since the sample size is always smaller than the size of the population, the sample mean(i) Must always be smaller than the population mean(ii) Must be larger than the population mean(iii) Must be equal to the population mean(iv) Can be smaller, larger, or equal to the population mean
7. For a population with any distribution, the form of the sampling distribution of thesample mean is,(i) Sometimes normal for large sample sizes(ii) Sometimes normal for all sample sizes(iii) Always normal for all sample sizes(iv) Always normal for large sample sizes
8. As the sample size increases, the(i) Standard deviation of the population decreases(ii) Population means increases(iii) Standard error of the mean decreases(iv) Standard error of the mean increases
School of Distance Education
Statistical Inference Page 2
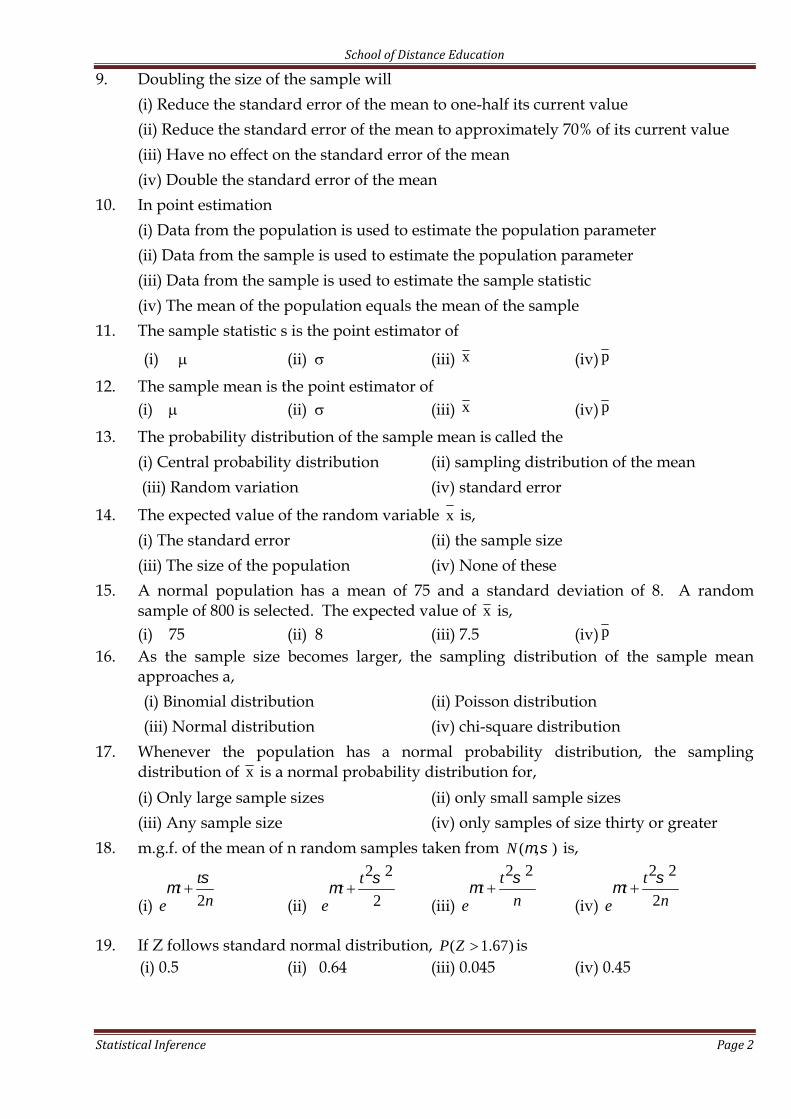
9. Doubling the size of the sample will(i) Reduce the standard error of the mean to one-half its current value(ii) Reduce the standard error of the mean to approximately 70% of its current value(iii) Have no effect on the standard error of the mean(iv) Double the standard error of the mean
10. In point estimation(i) Data from the population is used to estimate the population parameter(ii) Data from the sample is used to estimate the population parameter(iii) Data from the sample is used to estimate the sample statistic(iv) The mean of the population equals the mean of the sample
11. The sample statistic s is the point estimator of
(i) (ii) (iii) x (iv) p
12. The sample mean is the point estimator of(i) (ii) (iii) x (iv) p
13. The probability distribution of the sample mean is called the(i) Central probability distribution (ii) sampling distribution of the mean(iii) Random variation (iv) standard error
14. The expected value of the random variable x is,(i) The standard error (ii) the sample size(iii) The size of the population (iv) None of these
15. A normal population has a mean of 75 and a standard deviation of 8. A randomsample of 800 is selected. The expected value of x is,(i) 75 (ii) 8 (iii) 7.5 (iv) p
16. As the sample size becomes larger, the sampling distribution of the sample meanapproaches a,(i) Binomial distribution (ii) Poisson distribution(iii) Normal distribution (iv) chi-square distribution
17. Whenever the population has a normal probability distribution, the samplingdistribution of x is a normal probability distribution for,(i) Only large sample sizes (ii) only small sample sizes(iii) Any sample size (iv) only samples of size thirty or greater
18. m.g.f. of the mean of n random samples taken from ( , )N is,
(i) 2
tt
ne
(ii)
2 2
2
tt
e
(iii)
2 2tt
ne
(iv)
2 2
2
tt
ne
19. If Z follows standard normal distribution, ( 1.67)P Z is(i) 0.5 (ii) 0.64 (iii) 0.045 (iv) 0.45

School of Distance Education
Statistical Inference Page 3
20. The probability distribution of all possible values of the sample proportion p is the
(i) Probability density function of p
(ii) Sampling distribution of x
(iii) Same as p , since it considers all possible values of the sample proportion(iv) Sampling distribution of p
21. If X follow standard normal distribution, then 2Y X follows,(i) Normal (ii) Chi-square with 2 d.f.(iii) Chi-square with 1 d.f. (iv) Nome of these
22. The range of a chi-square variable is,(i) 0 to n (ii) 0 to (iii) to (iv) None of these
23. For random variable following chi-square distribution,(i) mean = 2(variance) (ii) 2(mean) = variance(iii) Mean = variance (iv) None of these
24. The mean of a chi-square random variable with ‘n’ d.f. is,(i) 2n (ii) n+2 (iii) n (iv) None of these
25. Variance of a chi-square random variable with ‘n’ d.f. is,(i) 2n (ii) n+2 (iii) n (iv) None of these
26. M.g.f. of a random variable following chi-square distribution with ‘n’ d.f. is,
(i) 2(1 2 )n
t (ii) 2(1 2 )n
t
(iii) 2(1 )n
t (iv) 2(1 )n
t
27. M.g.f. of the square of a standard normal random variable is,
(i)1
2(1 2 )t (ii)1
2(1 2 )t
(iii)1
2(1 )t (iv)1
2(1 )t
28. If X and Y are two independent ch-square variables with degrees of freedom 3 and 4respectively, then Z=X+Y follows,(i) Chi-square with 7 d.f. (ii) Chi-square with 12 d.f.(iii) Chi-square with 1 d.f. (iv) None of these
29. Chi–square table gives the values of 2( ) for a 2 variable with various degrees of
freedom and for various values of , such that,(i) 2 2
( ) )(P (ii) 2 2( ) )(P .
(iii) 2 2( ) )( | |P (iv) None of these
30. If 1 2, ,..., nX X X are n random samples taken from ( , )N , then2
1
ni
i
xY
follows,
(i) 2 ( 1)n (ii) 2 (1) (iii) 2 ( 1)n (iv) 2 ( )n

School of Distance Education
Statistical Inference Page 4
31. The probability distribution of the sum of squares of ‘n’ independent standard normalrandom variables is,(i) Normal (ii) Chi-square (iii) t (iv) None of these
32. If X is a uniform random variable over [0, ] , then 2 log ( )ex
Y
follow
(i) Normal (ii) Chi-square with ‘n’ d.f.(iii) Exponential (iv) None of these
33. If 2~ ( )X n , then mode of X is at,(i) n (ii) n-1 (iii) n-2 (iv) None of these
34. As n become large a chi-square variable with n degrees of freedom follows,(i) N (n, 2n ) (ii) N (n, 2n ) (iii) N (2n, 2n ) (iv) None of these
35. Given 2( (15) ) 0.80P k . Then the value of k is,
(i) -10.307 (ii) +10.307 (iii) 6.307 (iv) None of these
36. For two independent random variables X and Y, where ~ (0,1)X N and 2~ ( )Y n , thenZ follows t-distribution with n degrees of freedom, if Z is,(i) Y
Xn
(ii) XYn
(iii) XnY
(iv) None of these
37. ‘student’ is the penname of,(i) Newton (ii) Chebychev (iii) Laplace (iv) Gosset
38. The range of a t variable is,(i) 0 to n (ii) 0 to (iii) to (iv) None of these
39. The p.d.f. of a t-variable with n d.f. is,
(i)2
12
12 1
12
nnt
n
(ii)2
12
12 1
2
nnt
nnn
(iii)2
12
12 1
2
nnt
nnn
(iv) None of these
40. For a random variable t following t distribution with 7 d.f., the mode is,(i) 0 (ii) 7 (iii) 6 (iv) None of these
41. A statistic following t distribution with n-1 d.f. is,
(i) ( ) 1X n
S
(ii) ( ) 1X n
(iii) ( )X n
S
(iv) None of these

School of Distance Education
Statistical Inference Page 5
42. If 1X and 2X are two independent standard normal variables, then 1
2 21 2
2Xt
X X
follows,(i) Chi-square distribution (ii) t – distribution(iii) F- distribution (iv) None of these
43. Tables of t-distribution gives the values of t for various degrees of freedom and forvarious value of , such that,(i) (| | )P t t (ii) ( )P t t (iii) (| | )P t t (iv) None of these
44. The statistics1 2
1 2
2 21 2
1 2 1 1
1 12
X X
n S n S
n n n n
follows,
(i) t- Distribution with 1 2 1n n d.f.
(ii) t- Distribution with 1 2 2n n d.f.
(iii) F- distribution with ( 1 2,n n ) d.f.
(iv) None of these45. If t follow t-distribution with ‘n’ degrees of freedom, then 2Z t follows,
(i) F- distribution with (1,n) d.f. (ii) F- distribution with (n,1) d.f.(iii) Chi- distribution (iv) None of these
46. The ratio of the squares of two independent standard normal random variables is(i) An F- random variable with (1, 1) degree of freedom.(ii) An F- random variable with (n, 1) degree of freedom.(iii) An F- random variable with (1,n) degree of freedom.(iv) None of these
47. If F follow F distribution with (m, n) degrees of freedom then, 1/F follows ,(i) t- Distribution with m d.f. (ii) t- distribution with n d.f.(iii) F- distribution with (n, m) d.f. (iv) None of these
48. If ( )~ nt t , then as n , t follows,
(i) F- distribution with (1,n) d.f. (ii) F- distribution with (n,1) d.f.(iii) N(0,1) (iv) None of these
49. If (5)~t t , the value of ‘a’ such that, ( ) 0.98P a t a is
(i) 3.365. (ii) 2.365. (iii) 1.365. (iv) None of these50. Parameters are
(i) Function of sample values (ii) Function of population values(iii) The averages taken from a sample(iv) Function of either a sample or a population values

School of Distance Education
Statistical Inference Page 6
51. Sampling distribution of x is the(i) Probability distribution of the sample mean(ii) Probability distribution of the sample proportion(iii) Mean of the sample(iv) Mean of the population
52. If n increases, the student’s t distribution tends to(i) Normal (ii) F (iii) Cauchy (iv) None of these
53. The ratio of two independent standard normal random variables is,(i) t (1) (ii) F(1,1) (iii) N(0,1) (iv) None of these
54. F distribution was invented by(i) Fisher (ii) Snedecor (iii) Gosset (iv) None of these
55. The range of F variable is,(i) 0 to n (ii) 0 to (iii) to (iv) None of these
56. Let independent samples of sizes 1 2n and n are taken from normal population withmean and standard deviation . Let 2
1S and 22S are the respective sample variance,
then2
1 1 22
2 2 1
( 1)
( 1)
n S nF
n S n
follows,
(i) 1 2( 1, 1)F n n (ii) 1 2( , )F n n (iii) (1,1)F (iv) None of these
57. Tables of F-distribution gives the values of F for various values of 1 2,n n and ,such that,(i) ,1 2
( )n nP F F (ii) ,1 2( )n nP F F
(iii) ,1 2n nP F F (iv) None of these
58. Mode of 1 2~ ( , )F F n n is ,
(i) F =
2 1
1 2
2
2
n n
n n
(ii) F =
1 1
1 2
2
2
n n
n n
(iii) F =
2 1
2 2
2
2
n n
n n
(iv) None of these
59. The ratio of the squares of two independent standard normal random variables is,(i) 1 2( , )F n n (ii) 2(1, )F n (iii) (1,1)F (iv) None of these
60. If X following F distribution with 1 2,n n degrees of freedom Y follow F distribution
with 2 1,n n degrees of freedom. Then,
(i) ( ) ( )P X c P Y c (ii) 1( ) ( )P X c P Y
c
(iii) ( ) ( )P X c P Y c (iv) 1( ) ( )P X c P Y
c

School of Distance Education
Statistical Inference Page 7
61. If X following F distribution with ,n n degrees of freedom. If , ( ) are suchthat ( ) ( )P X P X . Then the value of . is,
(i) 2 (ii) 1 (iii) 1/2 (iv) None of these
62. If X following F distribution with 1 2,n n degrees of freedom, then as 2n , Y= 1n Xfollows,
(i) 21n (ii) 2
2n (iii) 1t n (iv) None of these
63. For a random variable following F distribution, the mode is always,(i) one (ii) less than one (iii) greater than one (iv) None of these
64. If 1X and 2X are two independent standard normal variables, then 1
2 21 2
2Xt
X X
follows,
(i) 2t (ii) t n (iii) 1t (iv) None of these
65. The theory of estimation was founded by(i) Laplace (ii) Fermat (iii) Fisher (iv) None of these
66. A sample constant representing the population parameter is known as,(i) Expectation (ii) estimate (iii) Variance (iv) None of these
67. A single numerical value used as an estimate of a population parameter is known as,(i) A parameter (ii) a population parameter(iii) A mean estimator (iv) a point estimate
68. An unbiased estimator of a parameter is an estimator t with ,(i) ( )E t (ii) ( )E t (iii) ( )E t (iv) None of these
69. An estimator is biased, when,(i) ( )E t (ii) ( )E t (iii) ( )E t (iv) None of these
70. The estimator with smallest variance is;(i) Unbiased estimator (ii) consistent estimator(iii) Efficient estimator (iv) sufficient estimator
71. Any statistic suggested as an estimator for a population parameter is a,(i) Point estimator (ii) Interval estimator(iii) Unbiased estimator (iv) None of these
72. A property of a point estimator that occurs whenever larger sample sizes tend toprovide point estimates closer to the population parameter is known as,(i) Unbiasedness (ii) efficiency (iii) consistency (iv) None of these
73. For the random sample 1 2, ,..., nx x x taken from (1, )B p , show that s an unbiased
estimator 2p , where1
n
ii
T x
is,
(i) ( 1)T T
n
(ii) ( 1)
( 1)
T T
n
(iii) ( 1)
( 1)
T T
n n
(iv) ( 1)
( 1)
T
n n

School of Distance Education
Statistical Inference Page 8
74. ( ) ,nE t or as n and ( ) 0,nV t as n are sufficient conditionsfor,(i) Unbiasedness (ii) efficiency (iii) consistency (iv) None of these
75. For the random sample 1 2, ,..., nx x x taken from Poisson population with parameter ,
1
nx
n is ------------ estimator .
(i) Unbiased (ii) consistent (iii) efficient (iv) sufficient
76. If npt , then nt is a ----- estimator of .
(i) Unbiased (ii) consistent (iii) efficient (iv) sufficient77. For the random sample 1 2, ,..., nx x x taken from ( , )N , then sample variance is a --------
estimator of the population variance.(i) Unbiased (ii) consistent (iii) efficient (iv) sufficient
78. Let 1 2, ,..., nx x x be the random sample taken from a population with p.d.f.1
;( , ) 0 1, 0f x x x . Then a sufficient estimator for is,
(i)1
n
ii
x (ii)
1
n
ii
x (iii) 2
1
n
ii
x (iv) None of these
79. Sample variance is not a ----- estimator, but it is a ---- estimator for population variance(i) Unbiased, consistent (ii) biased, efficient(iii) Consistent, unbiased (iv) None of these
80. Let t be the most efficient estimator for the parameter , then efficiency of any otherunbiased estimator 1t of is defined as,
(i) 11
( )( )
var( )
SD tE t
t (ii) 1
1
( )( )
var( )
SD tE t
t (iii) 1
1
var( )( )
var( )
tE t
t (iv) 1
1
var( )( )
var( )
tE t
t
81. Given two unbiased point estimators of the same population parameter, the pointestimator with the smaller variance is said to have,(i) Smaller relative efficiency (ii) greater relative efficiency(iii) Smaller consistency (iv) larger consistency
82. MLE is always need not be,(i) Unbiased (ii) efficient (iii) consistent (iv) None of these
83. The MLE of for the following distribution | |1( ) ,
2xf x e x is,
(i) Mean of samples (ii) Maximum value of the samples(iii) Minimum value of the samples (iv) Median of the samples
84. The MLE of , based on random samples taken from Poisson population withparameter is,(i) x (ii) 2x (iii) nx (iv) None of these

School of Distance Education
Statistical Inference Page 9
85. The moment estimate of , if the probability masses are: 1 2 3 4
1 1 1 1( ) :
4 4 4 4
X
f x ; 0 1 , and the observed
frequencies are 1,5,7 and 7 respectively is,(i) 0.4 (ii) 0.5 (iii) 0.6 (iv) None of these
86. In case of finding the confidence interval for mean of a normal population with knownSD, the table values are taken from,(i)t - table (ii) standard normal table(iii) Chi-square table (iv) None of these
87. In case of finding the confidence interval for mean of a normal population withunknown SD, the table values are taken from,(i)t - table (ii) standard normal table(iii) Chi-square table (iv) None of these
88. If an estimator nT of population parameter converges in probability to as n tendsto infinity is said to be,(i) Unbiased (ii) efficient (iii) consistent (iv) None of these
89. The estimatorx
x
n of population mean is,
(i) Unbiased (ii) consistent (iii) both (iv) None of these90. A property of a point estimator that occurs whenever the expected value of the point
estimator is equal to the population parameter it estimates is known as(i) Unbiasedness (ii) efficiency (iii) consistency (iv) None of these
91. Factorization theorem for sufficiency is known as,(i)Fisher-Neyman theorem (ii) Cramer-Rao theorem(iii) Rao-Blackwell theorem (iv) None of these
92. If the expected value of an estimator ‘t’ is not equal to its parameter , then ‘t’ is(i) Unbiased estimator of (ii) biased estimator of
(iii) Sufficient estimator of (iv) None of these93. Sample median is always a ---- estimator of the population mean
(i) Biased (ii) efficient (iii) consistent (iv) None of these
94. If nt is a sufficient statistic for based on n random samples, then log L
is a
function of,(i) Only (ii) nt only (iii) nt and only (iv) None of these
95. In common the estimators obtained by the method of MLE are(i) More efficient (ii) less efficient(iii) can’t say about efficiency (iv) None of these

School of Distance Education
Statistical Inference Page 10
96. If sample mean is an estimator of population mean ,it is a --- estimator of populationmean(i) Unbiased and efficient (ii) biased and efficient(iii) Unbiased and inefficient (iv) None
97. The value taken by an estimator is known as,(i) Statistic (ii) Estimate (iii) size (iv) none of these
98. If a sufficient statistic exist for a parameter, then it will be a function of,(i)Moment estimator (ii) M L estimator (iii) Unbiased estimator (iv) None of these.
99. Bias of an estimator can be(i) Positive (ii) negative (iii) either (iv) None
100. For samples taken from ( , )N , unbiased estimator of 2 is
(i) 2S (ii)2
1
nS
n (iii) 21n S
n
(iv) None of these
101. An estimator 1t for the parameter is more efficient than another estimator 2t if,(i) 1 2( ) ( )V t V t (ii) 1 2( ) ( )V t V t (iii) 1 2( ) ( )V t V t (iv) Nome of these
102. An estimator nt which contains all information about the parameter contains in thesample is,(i) an unbiased estimator (ii) a consistent estimator(iii) a sufficient estimator (iv) None of these
103. If 1 2, ,.... nx x x be a random sample from a Bernoulli population 1(1 )x xp p . Then asufficient estimator for p is,(i) ix (ii) ix (iii) maximum of 1 2, ,.... nx x x (iv) None of these
104. Sample standard deviation is a ------- estimator of population standard deviation.(i) Unbiased (ii) biased (iii) sufficient (iv) efficient
105. If t is a consistent estimator of , then,(i) t is also a consistent estimator of 2(ii) 2t is also a consistent estimator of (iii) 2t is also a consistent estimator of 2(iv) None of these
106. The inequality helps us to obtain an estimator with minimum variance is,(i) Tchebycheve’s inequality (ii) Cramer- Rao inequality(iii) Jenson’s inequality (iv) None of these
107. The method of M.L.E. is established by,(i) Fisher (ii) Newton (iii) Bernoullie (iv) None of these
108. The set of equations obtained in the process of least square estimation are called(i) Normal equations (ii) Intrinsic equations(iii) Simultaneous equations (iv) All the above

School of Distance Education
Statistical Inference Page 11
109. The estimator obtained by the method of moments are ---- in comparison with theestimator obtained by the method of MLE
(i) Less efficient (ii) More efficient (iii) equally efficient (iv) None of these
110. MLE of , by the random samples 1 2, ,.... nx x x taken from the population with p.d.f.1
( , ) , 0f x x is,
(i) x (ii) max of 1 2, ,.... nx x x (iii) min of 1 2, ,.... nx x x (iv) 1
x
111. The probability that an interval contains the parameter value is called,(i)Confidence limit (ii) Confidence coefficient(iii) Confidence interval (iv) None of these
112. For finding the confidence interval for using samples 1 2, ,.... nx x x taken from ( , )N , when is unknown, we use the statistic following(i) Normal distribution (ii) F- distribution(iii) Chi- distribution (iv) t- distribution
113. MLE of using random samples 1 2, ,.... nx x x taken from Poisson distribution withparameter is,(i)Mode of 1 2, ,.... nx x x (ii) Median of 1 2, ,.... nx x x
(iii) Mean of 1 2, ,.... nx x x (iv) None of these
114. Confidence interval for the variance of a normal population involves
(i) Std. normal distribution (ii) Chi- distribution(iii) F- distribution (iv) None of these
115. If 1 2t and t be two unbiased estimators of a parameter , then, the efficiency of
1 2. .t w r to t is,
(i) 1 2( ) ( )V t V t (ii) 1
2
( )
( )
V t
V t(iii) 1 2( ) ( )V t V t (iv) 2
1
( )
( )
V t
V t
116. MLE of in a random sample of size n from (0, )U is,(i) The sample means (ii) The sample median(iii) The largest order statistics (iv) The smallest order statistics
117. If X is a Poisson variate with parameter , the unbiased estimator based on a singleobservation x for 3e is,(i) 3 x (ii) 2 x (iii) 3x (iv) 2x
118. The difference between estimate and parameter in a sample survey is known as,(i) Non-sampling error (ii) population variance(iii) Sampling error (iv) sampling variance

School of Distance Education
Statistical Inference Page 12
119. 2 2(2), (1)x y , x and y are independent, then x
x yfollows
(i) beta (2,1) (ii) beta(1,1/2) (iii) beta(1/2,1) (iv) None of these
120. The method of moments was invented by(i) Neyman (ii) Fisher (iii) Karl Pearson (iv) Snedecor
121. A population has a standard deviation of 16. If a sample of size 64 is selected from thispopulation, what is the probability that the sample mean will be within 2 of thepopulation mean?(i) 0.6826 (ii) 0.3413 (iii) -0.6826 (iv) -0.3413
122. If the variance of an estimator attains its Cramer-Rao lower bound for variance, thenthe estimator is(i) Most efficient (ii) sufficient (iii) unbiased (iv) All the above
123. From the following four unbiased estimators for the population mean, identify themost efficient
(i) 1 2
1
2x x (ii) 1 2
13
3x x (iii) 1 2
12 2
4x x (iv) 1 2
15
5x x
124. The MLE of using samples 1 2, ,.... nx x x from the p.d.f. 1( )
2xf x e is,
(i)Mean of 1 2, ,.... nx x x (ii) Median of 1 2, ,.... nx x x
(iii) Mode of 1 2, ,.... nx x x (iv) None of these
125. Estimator obtained by the method of MLE, are ----- than the estimator obtained by themethod of moments(i) More efficient (ii) Less efficient(iii) Equally efficient (iv) None of these
126. The hypothesis which is under test for possible rejection is(i) Null hypothesis (ii) Alternate hypothesis(iii) Simple hypothesis (iv) None of these
127. A hypothesis contrary to null hypothesis is,(i) Null hypothesis (ii) Alternate hypothesis(iii) Simple hypothesis (iv) None of these
128. Testing of hypothesis was introduced by(i) Fisher (ii) Neyman (iii) Snedecor (iv) Nome of these
129. A statistical hypothesis which completely specifies the population is called,(i) Null hypothesis (ii) Alternate hypothesis(iii) Simple hypothesis (iv) None of these
130. A statistical hypothesis which is not completely specifies the population is called,(i) Null hypothesis (ii) composite hypothesis(iii) Simple hypothesis (iv) None of these
131. The rejection region in testing of hypothesis is known as,(i) Critical region (ii) normal region (iii) acceptance region (iv) None of these

School of Distance Education
Statistical Inference Page 13
132. A wrong decision about null hypothesis lead to(i) Type I error (ii) Type II error (iii) both (iv) None of these
133. Significance level is,(i) P(type I error) (ii) P(type II error) (iii) 1- P(type I error) (iv) 1- P(type II error)
134. Power of a test is,(i) P(type I error) (ii) P(type II error)(iii) 1- P(type I error) (iv) 1- P(type II error)
135. Size of a test is(i) P (type I error) (ii) P (type II error)(iii) 1- P (type I error) (iv) 1- P (type II error)
136. Size of a test is also known as,(i) Power (ii) significance level (iii) type I error (iv) type II error
137. The most serious error in testing of hypothesis is,(i) Type I error (ii) Type II error (iii) Both are equally serious (iv) None of these
138. In a coin tossing experiment, let p be the probability of getting a head. The coin istossed 10 times to test the hypothesis 0 : 0.5H p against the alternative 1 : 0.7H p .Reject 0H , if 6 or more tosses out of 10 result in head. Significance level of the test is,
(i)10
386
2(ii)
10
186
2(iii)
10
286
2(iv) None of these
139. Power of a test is 2
3
e
, then the probability of type-II error is,
(i) 2
3
1 e
(ii) 2
3
1 e
(iii) 2
3
e
(iv) None of these140. In testing of hypothesis, critical region is
(i) Rejection region (ii) Acceptance region(iii) Neutral region (iv) None of these
141. The standard deviation of any statistic is called its,(i) Type II error (ii) Standard error(iii) type I error (iv) None of these
142. Critical region with minimum type II error among all critical regions with a specifiedsignificance level is,(i) Powerful critical region (ii) Minimum critical region(iii) Best critical region (iv) None of these
143. Degrees of freedom is related to(i) Number of observations in a set (ii) Hypothesis under test(iii) Number of independent observations in a set (iv) None of these
144. A test which minimizes the power of the test for a fixed significance level is known as(i) Optimum test (ii) randomized test(iii) Likelihood ratio test (iv) None of these

School of Distance Education
Statistical Inference Page 14
145. The distribution used for testing mean of a normal population when populationvariance is unknown with a large sample is,(i) Normal distribution (ii) t distribution(iii) F distribution (iv) None of these
146. In testing of equality of means of two normal population, if 1 , 2 are unknown and inaddition it is assumed that = 1 = 2 , then the value of is approximated by,
(i) 1 1 2 2
1 2
n S n S
n n
(ii)2 2 2 2
1 1 2 2
1 2
n S n S
n n
(iii)2 2
1 1 2 2
1 2
n S n S
n n
(iv) None of these
147. Test statistics used for testing proportion of a population is,
(i)0
0 0
xp
ntp q
n
(ii)
0
0 0 /
xp
ntp q n
(iii)
0
0 0
xp
ntp q
n
(iv) None of these
148. Chi square test of goodness of fit is introduced by,(i)James Bernoulli (ii) Jacob Bernoulli(iii) Karl Pearson (iv) WS Gosset
149. In Chi square test of goodness of fit, the degrees of freedom of the chi square statistic isn-r-1, where r denotes,(i) Number of parameters are estimated using the observations for the calculation of
the theoretical frequencies(ii) Number of observations used for the calculation of the theoretical frequencies(iii) Number of classes of observations(iv) None of these
150. In Chi square test of independence the expected number of observations in ,th
i j cellis,
(i) . .
..
i jNf f
f
(ii) . .
..
i jf f
Nf
(iii) . .
..
i jf f
f
(iv) None of these
151. For a 2 2 contingency table, where the frequencies are a, b, c and d, as given, the chisquare value for testing independence is,
(i)
2( )( )( )( )( )( )
a b c d ad bca b c d b d a c
(ii)
2( )( )( )( )( )( )
a b c d ad bca b c d b d a c
(iii)
2( ) ( )( )( )( )( )
a b c d ad bca b c d b d a c
(iv) None of these
152. The theorem supporting the statement that, When the number of sample is large,almost all test statistics follows normal distribution(i)Neyman-Pearson therorem (ii) Central limit theorem(iii) Bernoullie’s laws (iv) None of these

School of Distance Education
Statistical Inference Page 15
153. The test statistics used in testing standard deviation of a normal population is,
(i)2
1
nS
n (ii) 2
20
1n S
(iii)2 2
20
n S
(iv) None of these
154. Neymann-Pearson lemma is used for obtaining,(i)Most powerful test (ii) An unbiased test(iii) A randomized test (iv) None of these
155. A test is one-sided or two-sided depends on(i) Null hypothesis (ii) Alternate hypothesis(iii) Simple hypothesis (iv) None of these
156. Level of significance lies between,(i) 0 and 1 (ii) -1 and 1 (iii) -3 and 3 (iv)None of these
157. Student’s t test is applicable only when,(i) The variate values are independent(ii) The variable is normally distributed(iii) The sample is small(iv) All the above
158. To test 0 0:H , when population SD is unknown and the sample size is small is,(i) t-test (ii) F-test (iii) Normal test (iv) None of these
159. To test 0 0:H , when the population SD is known is,(i) t-test (ii) F-test (iii) Normal test (iv) None of these
160. The testing of hypothesis 0 :H k against 1 :H k leads to
(i) Right tailed test (ii) two tailed test(iii) Left tailed test (iv) None of these
161. The testing of hypothesis 0 :H k against 1 :H k leads to
(i) Right tailed test (ii) two tailed test (iii) Left tailed test (iv) None of these162. The testing of hypothesis 0 :H k against 1 :H k leads to
(i) Right tailed test (ii) two tailed test (iii) left tailed test (iv) None of these163. The hypothesis that the population variance has a specified value can be tested
(i) t-test (ii) F-test (iii) Normal test (iv) None of these
164. The statistics 2 to test 2 20 0:H based on a sample of size n, has degrees of
freedom,(i) n (ii) n+1 (iii) n-1 (iv) None of these
165. Degrees of freedom for a chi-square test of independent with contingency table oforder mXn is,(i) mXn (ii) m-1 X n-1 (iii) m+1 X n+1 (iv) None of these
166. Degrees of freedom for a chi square test of independence with contingency table oforder 3X4 is,(i) 12 (ii) 6 (iii) 7 (iv) 20

School of Distance Education
Statistical Inference Page 16
167. The testing of hypothesis 0 1 2:H against 1 1 2:H is,
(i) 2i i
i
O E
E
(ii) 2i i
i
O E
E
(iii)
2i i
i
O E
E
(iv) None of these
168. When the degree of freedom increases indefinitely, chi square distribution tends to(i) Normal distribution (ii) t distribution (iii) F distribution (iv) None of these
169. When the set of n expected and observed frequencies are same, the chi square valuebecomes ,(i) Infinity (ii) zero (iii) n (iv) None of these
170. The degree of freedom for statistic- t for paired t-test based on n pairs of observationsis,(i) 2(n-1) (ii) n-1 (iii) 2n – 1 (iv) None of these
171. The mean difference between 10 paired observations is 15 and the SD of differences is5. The value of statistic t is,(i) 27 (ii) 9 (iii) 3 (iv) None of these
172. Which of the following symbols represents a population parameter?(i) SD (ii) σ (iii) r (iv) None of these
173. What does it mean when you calculate a 95% confidence interval?(i) The process you used will capture the true parameter 95% of the time in the longrun(ii) You can be “95% confident” that your interval will include the populationparameter(iii) You can be “5% confident” that your interval will not include the populationparameter(iv) All of the above statements are true
174. What would happen (other things equal) to a confidence interval if you calculated a 99percent confidence interval rather than a 95 percent confidence interval?(i) It will be narrower (ii) it will not change(iii)The sample size will increase (iv) It will become wider
175. What is the standard deviation of a sampling distribution called?(i) Sampling error (ii) Sample error(iii) Standard error (iv) Simple error
176. A ______ is a subset of a _________.(i) Sample, population (ii) Population, sample(iii)Statistic, parameter (iv) Parameter, statistic
177. A _______ is a numerical characteristic of a sample and a ______ is a numericalcharacteristic of a population.(i)Sample, population (ii) Population, sample(iii)Statistic, parameter (iv) Parameter, statistic

School of Distance Education
Statistical Inference Page 17
178. A sampling distribution might be based on which of the following?(i)Sample means (ii) Sample correlations(iii)Sample proportions (iv) All of the above
179. _________ are the values that mark the boundaries of the confidence interval.(i) Confidence intervals (ii) Confidence limits(iii)Levels of confidence (iv) Margin of error
180. _____ results if you fail to reject the null hypothesis when the null hypothesis isactually false.(i) Type I error (ii) Type II error (iii)Type III error (iv) Type IV error
181. Good way to get a small standard error is to use a ________.(i) Repeated sampling (ii) Small sample(iii)Large sample (iv) Large population
182. The use of the laws of probability to make inferences and draw statistical conclusionsabout populations based on sample data is referred to as ___________.(i)Descriptive statistics (ii) Inferential statistics(iii)Sample statistics (iv) Population statistics
183. As sample size goes up, what tends to happen to 95% confidence intervals?(i) They become more precise (ii) They become narrower(iii) They become wider (iv) Both (i) and (ii)
184. __________ is the failure to reject a false null hypothesis.(i)Type I error (ii)Type II error (iii) Type A error (iv)Type B error
185. What is the key question in the field of statistical estimation?(i) Based on my random sample, what is my estimate of the population parameter?(ii)Based on my random sample, what is my estimate of normal distribution?(iii)Is the value of my sample statistic unlikely enough for me to reject the null
hypothesis?(iv)There is no key question in statistical estimation
186. Cramer Rao lower bound is for finding(i)Unbiased estimator (ii) Consistent estimator(iii) Minimum variance of unbiased estimator (iv) None of these
187. If nT is a consistent estimator of , then the consistent estimator of 2 is,
(i) 2nT (ii) nT (iii) nT (iv) None of these
188. ---- test is used for testing independence of attributes is a contingency table(i)Normal test (ii) chi-square test (iii) t-test (iv) None of these

School of Distance Education
Statistical Inference Page 18
189. The Neymaan-Pearson lemma is used to find ------- for testing simple 0H againstsimple 1H
(i) Test statistic (ii) best critical region(iii) Power of a test (iv) None of these
190. ----- Distribution is used for constructing confidence interval for the mean of thenormal distribution when sample size is large.(i)Normal distribution (ii) t distribution(iii) F distribution (iv) None of these
191. The MLE of in (1, )B is,
(i) x (ii) 2x (iii) ii
x (iv) 2i
i
x192. Fisher-Neyman factorization theorem is used for finding --- estimator
(i)Unbiased estimator (ii) Consistent estimator(iii) Minimum variance of unbiased estimator (iv) None of these
193. The value of 2 is zero if and only if,
(i) i ii i
O E (ii) i iO E for all i (iii) i iO E for all i (iv) None of these
194. A coin is tossed 600 times and we got 320 heads. Which is test to be used for testingthe unbiasedness of the coin?(i)Normal test (ii) chi-square test (iii) t-test (iv) None of these
195. Equality of variances of two normal population is tested by(i)Normal test (ii) chi-square test (iii) t-test (iv) None of these
196. In paired t test the statistic 1
u
u nt
S
follows:
(i) nt (ii) 1nt (iii) 1nt (iv) None of these
197. In a contingency table the expected frequencies are calculated under ----- hypothesis(i)Null (ii) Alternate (iii) Both (iv) None
198. In a chi square test of independence, we consider the attributes are independent if,(i)The calculated chi square value is equal to table chi square value(ii)The calculated chi square value is greater than the table chi square value(iii)The calculated chi square value is less than the table chi square value(iv)None of these
199. Area of critical region depends up on(i) Type –I error (ii) type –II error (iii) Power (iv) None of these
200. Paired t test is applicable when the observation in the two samples are(i) Paired (ii) correlated (iii) Uncorrelated (iv) None of these
***************

School of Distance Education
Statistical Inference Page 19
ANSWERS1. (ii) Statistic2. (i) Sampling distribution3. (ii) A parameter4. (iii) Chi-square5. (i) 1.26. (iv) Can be smaller, larger, or equal to the population mean7. (iv) Always normal for large sample sizes8. (iii) Standard error of the mean decreases9. (ii) Reduce the standard error of the mean to approximately 70% of its current value10. (ii) Data from the sample is used to estimate the population parameter11. (ii) 12. (i) 13. (ii) sampling distribution of the mean14. (iv) None of these15. (i) 7516. (iii) Normal distribution17. (iii) Any sample size
18. (iv)
2 2
2
tt
ne
19. (i) 0.520. (iv) Sampling distribution of p
21. (iii) Chi-square with 1 d.f.22. (ii) 0 to
23. (ii) 2(mean) = variance24. (iii) n25. (i) 2n
26. (ii) 2(1 2 )n
t
27. (ii)1
2(1 2 )t
28. (i) Chi-square with 7 d.f.29. (ii) 2 2
( ) )(P .
30. (iv) 2 ( )n31. (ii) Chi-square32. (iii) Exponential33. (iii) n-234. (i) N(n, 2n )35. (ii) +10.30736. (ii) X
Yn
School of Distance Education
Statistical Inference Page 20
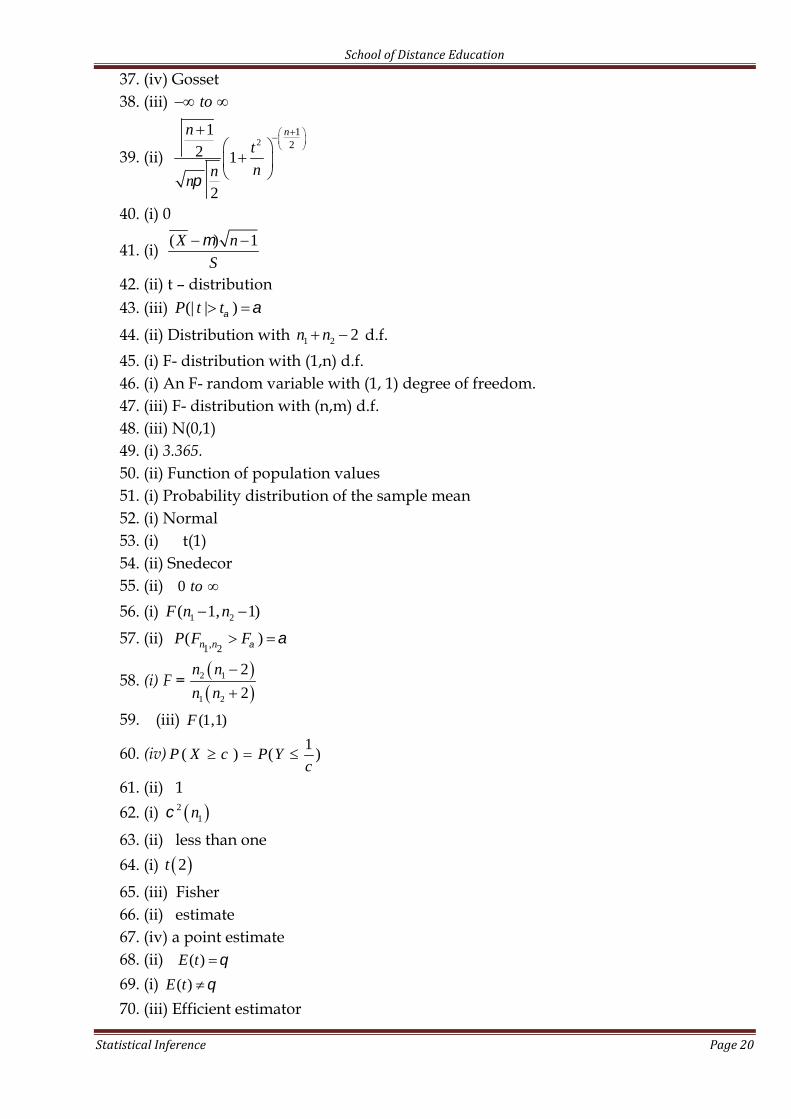
37. (iv) Gosset38. (iii) to
39. (ii)2
12
12 1
2
nnt
nnn
40. (i) 0
41. (i) ( ) 1X n
S
42. (ii) t – distribution43. (iii) (| | )P t t
44. (ii) Distribution with 1 2 2n n d.f.45. (i) F- distribution with (1,n) d.f.46. (i) An F- random variable with (1, 1) degree of freedom.47. (iii) F- distribution with (n,m) d.f.48. (iii) N(0,1)49. (i) 3.365.50. (ii) Function of population values51. (i) Probability distribution of the sample mean52. (i) Normal53. (i) t(1)54. (ii) Snedecor55. (ii) 0 to
56. (i) 1 2( 1, 1)F n n
57. (ii) ,1 2( )n nP F F
58. (i) F =
2 1
1 2
2
2
n n
n n
59. (iii) (1,1)F
60. (iv) 1( ) ( )P X c P Y
c
61. (ii) 162. (i) 2
1n
63. (ii) less than one64. (i) 2t
65. (iii) Fisher66. (ii) estimate67. (iv) a point estimate68. (ii) ( )E t
69. (i) ( )E t
70. (iii) Efficient estimator

School of Distance Education
Statistical Inference Page 21
71. (i) Point estimator72. (iii) consistency
73. (iii) ( 1)
( 1)
T T
n n
74. (iii) consistency75. (ii) consistent76. (ii) consistent77. (ii) consistent
78. (i)1
n
ii
x
79. (i) Unbiased, consistent
80. (iv) 11
var( )( )
var( )
tE t
t
81. (ii) greater relative efficiency82. (i) Unbiased83. (iv) Median of the samples84. (i) x
85. (ii) 0.586. (ii) standard normal table87. (i)t – table88. (iii) consistent89. (iii) both90. (i) Unbiasedness91. (i)Fisher-Neyman theorem92. (ii) biased estimator of 93. (i) Biased94. (iii) nt and only95. (i) More efficient96. (i) Unbiased and efficient97. (ii) Estimate98. (ii) M L estimator99. (iii) either
100. (ii)2
1
nS
n 101. (i) 1 2( ) ( )V t V t
102. (iii) a sufficient estimator103. (i) ix104. (ii) biased105. (iii) 2t is also a consistent estimator of 2106. (ii) Cramer- Rao inequality107. (i) Fisher

School of Distance Education
Statistical Inference Page 22
108. (i) Normal equations109. (ii) More efficient110. (ii) max of 1 2, ,.... nx x x
111. (ii) Confidence coefficient112. (iv) t- distribution113. (iii) Mean of 1 2, ,.... nx x x
114. (ii) Chi- distribution
115. (iv) 2
1
( )
( )
V t
V t
116. (iii) The largest order statistics117. (ii) 2 x
118. (iii) Sampling error119. (ii) beta(1,1/2)120. (iii) Karl Pearson121. (i) 0.6826122. (i) Most efficient
123. (i) 1 2
1
2x x
124. (ii) Median of 1 2, ,.... nx x x
125. (i) More efficient126. (i) Null hypothesis127. (ii) Alternate hypothesis128. (ii) Neyman129. (iii) Simple hypothesis130. (ii) composite hypothesis131. (i) Critical region132. (i) Type I error133. (i) P(type I error)134. (iv) 1- P(type II error)135. (i) P (type I error)136. (ii) significance level137. (ii) Type II error
138. (i)10
386
2
139. (ii) 2
3
1 e
140. (i) Rejection region141. (ii) Standard error142. (iii) Best critical region143. (iii) Number of independent observations in a set144. (iv) None of these145. (i) Normal distribution

School of Distance Education
Statistical Inference Page 23
146. (iii)2 2
1 1 2 2
1 2
n S n S
n n
147. (i)0
0 0
xp
ntp q
n
148. (iii) Karl Pearson149. (ii) Number of parameters are estimated using the observations for the calculation of
the theoretical frequencies
150. (iii) . .
..
i jf f
f
151. (ii)
2( )( )( )( )( )( )
a b c d ad bca b c d b d a c
152. (ii) Central limit theorem153. (iv) None of these154. (i)Most powerful test155. (i) Null hypothesis156. (i) 0 and 1157. (ii)All the above158. (i) t-test159. (iii) Normal test160. (ii) two tailed test161. (iii) Left tailed test162. (i) Right tailed test163. (iv) None of these164. (iii) n-1165. (ii) m-1 X n-1166. (ii) 6
167. (ii) 2i i
i
O E
E
168. (i) Normal distribution169. (ii) zero170. (ii) n-1171. (ii) 9172. (ii) σ173. (iv) All of the above statements are true174. (iv) It will become wider175. (iii) Standard error176. (i) Sample, population177. (iii)Statistic, parameter178. (iv) All of the above

School of Distance Education
Statistical Inference Page 24
179. (ii) Confidence limits180. (ii) Type II error181. (iii)Large sample182. (ii) Inferential statistics183. (iv) Both (i) and (ii)184. (ii)Type II error185. (i)Based on my random sample, what is my estimate of the population parameter?186. (iii) Minimum variance of unbiased estimator187. (i) 2
nT
188. (ii) chi-square test189. (ii) best critical region190. (i)Normal distribution191. K192. (iv) None of these193. (ii) i iO E for all i
194. (i)Normal test195. (iv) None of these196. (ii) 1nt
197. (iii)The calculated chi square value is less than the table chi square value198. (i)Null199. (i) Type –I error200. (i) Paired
©Reserved