Embed Size (px)
Citation preview
PUBLIC SCHOOLS OF NORTH CAROLINA State Board of Education | Department of Public Instruction
F I N A N C I A L A N D B U S I N E S S S E R V I C E S I N T E R N S H I P P R O G R A M
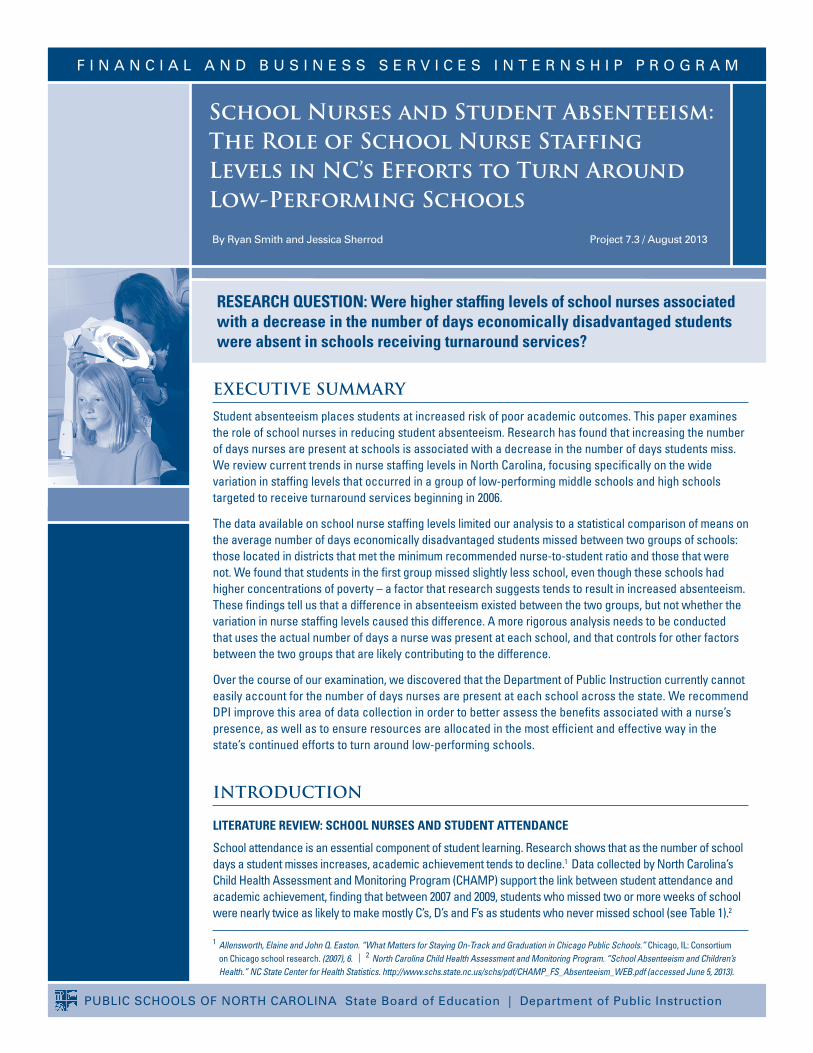
School Nurses and Student Absenteeism: The Role of School Nurse Staffing Levels in NC’s Efforts to Turn Around Low-Performing Schools
By Ryan Smith and Jessica Sherrod Project 7.3 / August 2013
ReseaRch Question: Were higher staffing levels of school nurses associated with a decrease in the number of days economically disadvantaged students were absent in schools receiving turnaround services?
EXECUTIVE SUMMARY
Student absenteeism places students at increased risk of poor academic outcomes. This paper examines the role of school nurses in reducing student absenteeism. Research has found that increasing the number of days nurses are present at schools is associated with a decrease in the number of days students miss. We review current trends in nurse staffing levels in North Carolina, focusing specifically on the wide variation in staffing levels that occurred in a group of low-performing middle schools and high schools targeted to receive turnaround services beginning in 2006.
The data available on school nurse staffing levels limited our analysis to a statistical comparison of means on the average number of days economically disadvantaged students missed between two groups of schools: those located in districts that met the minimum recommended nurse-to-student ratio and those that were not. We found that students in the first group missed slightly less school, even though these schools had higher concentrations of poverty – a factor that research suggests tends to result in increased absenteeism. These findings tell us that a difference in absenteeism existed between the two groups, but not whether the variation in nurse staffing levels caused this difference. A more rigorous analysis needs to be conducted that uses the actual number of days a nurse was present at each school, and that controls for other factors between the two groups that are likely contributing to the difference.
Over the course of our examination, we discovered that the Department of Public Instruction currently cannot easily account for the number of days nurses are present at each school across the state. We recommend DPI improve this area of data collection in order to better assess the benefits associated with a nurse’s presence, as well as to ensure resources are allocated in the most efficient and effective way in the state’s continued efforts to turn around low-performing schools.
INTRODUCTION
LiteRatuRe RevieW: schooL nuRses and student attendance
School attendance is an essential component of student learning. Research shows that as the number of school days a student misses increases, academic achievement tends to decline.1 Data collected by North Carolina’s Child Health Assessment and Monitoring Program (CHAMP) support the link between student attendance and academic achievement, finding that between 2007 and 2009, students who missed two or more weeks of school were nearly twice as likely to make mostly C’s, D’s and F’s as students who never missed school (see Table 1).2
1 Allensworth, Elaine and John Q. Easton. “What Matters for Staying On-Track and Graduation in Chicago Public Schools.” Chicago, IL: Consortium on Chicago school research. (2007), 6. | 2 North Carolina Child Health Assessment and Monitoring Program. “School Absenteeism and Children’s Health.” NC State Center for Health Statistics. http://www.schs.state.nc.us/schs/pdf/CHAMP_FS_Absenteeism_WEB.pdf (accessed June 5, 2013).

2 3
A child’s health is an important predictor of student attendance, as children in poor health are more likely to miss school.3 Asthma, the leading chronic health condition in the United States, results in more than 20 million days of missed school, or approximately 8 days per child with asthma. The relationship between poor health and increased absenteeism is again confirmed by data collected by CHAMP. For example, between 2007 and 2009, students in poor or fair health were three times as likely to miss two or more weeks of school (see Table 2).4 Additionally, student absenteeism is more likely to affect children from low-income households, whom research indicates are more likely to have vision and hearing problems, untreated cavities, asthma, and lead dust exposure, and are less likely to receive medical care than their middle class peers.5
The number of individual chronic health conditions among North Carolina’s student population has been on the rise (Appendix I). Between 2005 and 2011, the most recent year in which data are available, the number of chronic health conditions among children enrolled in public schools rose by 48%, from 197,052 to 292,288.6 The growth in chronic conditions is likely due to multiple factors, including an increase in the number of some conditions, like diabetes, among children, an increase in the number of conditions being tracked by school nurses, and a decrease in the number of children with chronic conditions going undetected as a result of improved access to health services. According to the most recent estimate, 12.8% of students have at least one chronic health condition.7
3 Telljohann, Susan K, Joseph A Dake, and James H Price. “Effect of Full-Time versus Part-Time School Nurses on Attendance of Elementary Students with Asthma.” JSN 20(2004), 331. | 4 North Carolina Child Health Assessment and Monitoring Program, 1. | 5 Rothstein, Richard. “Class and Schools: Using Social, Economic, and Educational Reform to Close the Black-White Achievement Gap.” Economic Policy Institute (2004), 37 – 42. | 6 NC DHHS. “Annual Reports of School Health Services.” SNANC. http://www.snanc.org/about-snanc/published-reports/138-north-carolina-annual-school-services-reports.html (accessed June 6, 2013). | 7 Ibid., 2012 report.
tabLe 3: heaLth counseLing sessions pRovided by schooL nuRses in nc, by condition (2010-2011)
0
10,000
20,000
30,000
40,000
50,00020102011
add/adhd asthma diabetes mental healthissues
severe allergies
tabLe 1: peRcent of students making mostLy c’s, d’s and f’s incReases With days absent
0%
5%
10%
15%
20%
25%
30%
neverabsent
absent1-2 weeks
absent 2 ormore weeks
Source: NC State Center for Health Statistics
tabLe 2: students absent 2 oR moRe Weeks aRe moRe LikeLy to have pooReR heaLth
0
5
10
15
20
25
absent < 2 weeks absent 2+ weeks
Fair/Poor HealthAsthma
Source: NC State Center for Health Statistics
Source: Annual School Health Services Report, NC DHHS

2 3
School nurses play an important role in addressing the health needs of children. School nurses do a lot more than put band-aids on scraped knees or check to see if children have a fever. In addition to providing health care to students, school nurses also: facilitate health screenings and ensure that students who are identified as having an unmet health need are referred to an appropriate provider and receive care; provide health counseling sessions for numerous health conditions (Table 3);8 provide programming in schools to promote health; and assist in developing individual education plans for children with special needs.9
schooL nuRse staffing LeveLs
The Centers for Disease Control and Prevention (CDC) recommends states provide, at a minimum, one nurse for every 750 students. For schools with a larger proportion of students with health needs, the CDC recommends even lower ratios. Research supports the CDC’s recommendation, demonstrating that lower ratios are beneficial for students and create school environments more conducive to learning. For example, a study of a 21-county region in eastern North Carolina found that lower ratios were associated with: • Increasedservicesprovidedtostudentswithchronic
health conditions; • Anincreasedlikelihoodofidentifyingchildrenwithchronic
health conditions; • Theprovisionofmorehealthcounselingsessions; • Anincreaseinthenumberofchildrenwhoreceivecareafter
in-school screenings have identified they have unmet needs. 10
Despite the important role school nurses play in addressing the health needs of students and the increase in the number of chronic health conditions, there are approximately 60% more students per nurse than the minimum level recommended by the CDC. The state has made significant progress in lowering the student-to-nurse ratio over the past decade; however, the current ratio of one nurse per 1,201 students far exceeds the recommended ratio of 1:750 (see Table 4).11 In 2010, North Carolina ranked 31st in the nation in nurse-to-student ratio, behind Alabama (12th), Maryland (18th), Louisiana (20th), South Carolina (21st), Texas (23rd), Virginia (24th), and Mississippi (29th).12
State and district level school nurse-to-student ratios, while a helpful benchmark for measuring statewide progress toward meeting CDC recommended staffing levels, do not tell policymakers all they need to know in determining the most efficient allocation of human resources. For example, based on a district level ratio, policymakers cannot easily determine how nurses are individually divided among schools within a district. Perhaps even more important, nurse-to-student ratios do not distinguish between the school nurse who is present at a school one day per week versus the school nurse present five days per week. To illustrate this point, in 2010 36% of LEAs (41 out of 115, charters not included) reported nurse-to-student ratios of 1:750 or better; however, in the same year, only 24% of high schools and middle schools reported having a full-time school nurse (where full-time is defined as a nurse present “during all school hours, 5 days per week”).13 From the 2010 School Health Education Profiles, we know high schools are more likely than middle schools to have a full-time nurse (27%
8 Please note that Table 3 does not report on all conditions for which a school nurse provided health counseling sessions in 2010 or 2011. For a complete list see the Annual School Health Services Report for the appropriate year. | 9 Troop, Tony, and Carol Tyson. “School nurses, counselors, and child and family support teams.” NC Med J 69(2008): 484. | 10 Guttu et al. “Does the School Nurse-to-Student Ratio Make a Difference?.” JSN 74(2004), 7. | 11 NC DHHS. “Annual Reports of School Health Services,” 2006 – 2012. | 12 National Association of School Nurses. “School Nurses Make A Difference. National School Nurse-to-Student Ratio Rankings.” NASN (2010), http://www.nasn.org/portals/0/about/press_room_faq.pdf (accessed June 7, 2013). | 13 2010 district level nurse-to-student ratios can be found in the NC DHHS 2009-10 Annual School Health Services Report. The percent of highs schools and middle schools with a full-time nurse can be found in the 2010 Health Education Profiles in North Carolina Middle and High Schools: http://www.nchealthyschools.org/docs/data/profiles/2010/2010profiles.pdf (accessed June 6, 2013).
tabLe 4: student-to-nuRse Ratio, 2005-2011
0
200
400
600
800
1,000
1,200
1,400
1,600
1,800
2005 2006 2007 2008 2009 2010 2011
cdc Recommended school nursestaffing Level
1,593
1,201
750
num
ber o
f stu
dent
s pe
r nur
se
Actual Student-to-Nurse RatioMinimum Recommended Ratio
Source: Annual School Health Services Report, NC DHHS
4 5
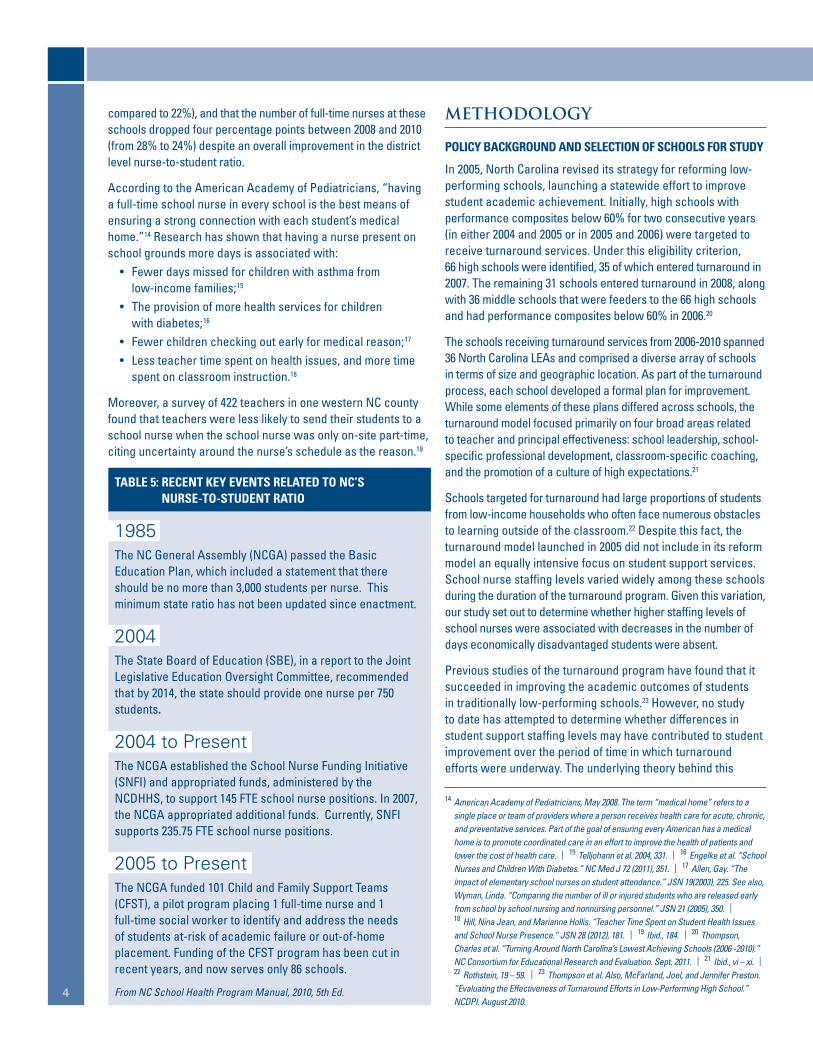
compared to 22%), and that the number of full-time nurses at these schools dropped four percentage points between 2008 and 2010 (from 28% to 24%) despite an overall improvement in the district level nurse-to-student ratio.
According to the American Academy of Pediatricians, “having a full-time school nurse in every school is the best means of ensuring a strong connection with each student’s medical home.”14 Research has shown that having a nurse present on school grounds more days is associated with: • Fewerdaysmissedforchildrenwithasthmafrom
low-income families;15 • Theprovisionofmorehealthservicesforchildren
with diabetes;16 • Fewerchildrencheckingoutearlyformedicalreason;17
• Lessteachertimespentonhealthissues,andmoretimespent on classroom instruction.18
Moreover, a survey of 422 teachers in one western NC county found that teachers were less likely to send their students to a school nurse when the school nurse was only on-site part-time, citing uncertainty around the nurse’s schedule as the reason.19
METHODOLOGY
poLicy backgRound and seLection of schooLs foR study
In 2005, North Carolina revised its strategy for reforming low-performing schools, launching a statewide effort to improve student academic achievement. Initially, high schools with performance composites below 60% for two consecutive years (in either 2004 and 2005 or in 2005 and 2006) were targeted to receive turnaround services. Under this eligibility criterion, 66 high schools were identified, 35 of which entered turnaround in 2007. The remaining 31 schools entered turnaround in 2008, along with 36 middle schools that were feeders to the 66 high schools and had performance composites below 60% in 2006.20
The schools receiving turnaround services from 2006-2010 spanned 36 North Carolina LEAs and comprised a diverse array of schools in terms of size and geographic location. As part of the turnaround process, each school developed a formal plan for improvement. While some elements of these plans differed across schools, the turnaround model focused primarily on four broad areas related to teacher and principal effectiveness: school leadership, school-specific professional development, classroom-specific coaching, and the promotion of a culture of high expectations.21
Schools targeted for turnaround had large proportions of students from low-income households who often face numerous obstacles to learning outside of the classroom.22 Despite this fact, the turnaround model launched in 2005 did not include in its reform model an equally intensive focus on student support services. School nurse staffing levels varied widely among these schools during the duration of the turnaround program. Given this variation, our study set out to determine whether higher staffing levels of school nurses were associated with decreases in the number of days economically disadvantaged students were absent.
Previous studies of the turnaround program have found that it succeeded in improving the academic outcomes of students in traditionally low-performing schools.23 However, no study to date has attempted to determine whether differences in student support staffing levels may have contributed to student improvement over the period of time in which turnaround efforts were underway. The underlying theory behind this
14 American Academy of Pediatricians, May 2008. The term “medical home” refers to a single place or team of providers where a person receives health care for acute, chronic, and preventative services. Part of the goal of ensuring every American has a medical home is to promote coordinated care in an effort to improve the health of patients and lower the cost of health care. | 15 Telljohann et al. 2004, 331. | 16 Engelke et al. “School Nurses and Children With Diabetes.” NC Med J 72 (2011), 351. | 17 Allen, Gay. “The impact of elementary school nurses on student attendance.” JSN 19(2003), 225. See also, Wyman, Linda. “Comparing the number of ill or injured students who are released early from school by school nursing and nonnursing personnel.” JSN 21 (2005), 350. | 18 Hill, Nina Jean, and Marianne Hollis. “Teacher Time Spent on Student Health Issues and School Nurse Presence.” JSN 28 (2012), 181. | 19 Ibid., 184. | 20 Thompson, Charles et al. “Turning Around North Carolina’s Lowest Achieving Schools (2006 -2010).” NC Consortium for Educational Research and Evaluation. Sept. 2011. | 21 Ibid., vi – xi. | 22 Rothstein, 19 – 59. | 23 Thompson et al. Also, McFarland, Joel, and Jennifer Preston. “Evaluating the Effectiveness of Turnaround Efforts in Low-Performing High School.” NCDPI. August 2010.
tabLe 5: Recent key events ReLated to nc’s nuRse-to-student Ratio
1985The NC General Assembly (NCGA) passed the Basic Education Plan, which included a statement that there should be no more than 3,000 students per nurse. This minimum state ratio has not been updated since enactment.
2004The State Board of Education (SBE), in a report to the Joint Legislative Education Oversight Committee, recommended that by 2014, the state should provide one nurse per 750 students.
2004 to PresentThe NCGA established the School Nurse Funding Initiative (SNFI) and appropriated funds, administered by the NCDHHS, to support 145 FTE school nurse positions. In 2007, the NCGA appropriated additional funds. Currently, SNFI supports 235.75 FTE school nurse positions.
2005 to PresentThe NCGA funded 101 Child and Family Support Teams (CFST), a pilot program placing 1 full-time nurse and 1 full-time social worker to identify and address the needs of students at-risk of academic failure or out-of-home placement. Funding of the CFST program has been cut in recent years, and now serves only 86 schools.
From NC School Health Program Manual, 2010, 5th Ed.

4 5
paper’s policy question is that the increased presence of school nurses in low-performing schools complemented and strengthened the turnaround efforts in the schools.
data
To analyze the impact of school nurses on student attendance, we collected panel data from each high school and middle school receiving turnaround services from 2005-06, one year prior to the first group of high schools receiving turnaround services, to 2011-12. Given the time constraints for this project, we limited our analysis to school-level data. We collected data on school size, percent of teachers with three years of experience or less, teacher turnover, percent of the student body living at or below poverty, number of short term suspensions per one hundred students, percent of economically disadvantaged students who were proficient in Algebra I, English I, Math EOG, and Reading EOG assessments, whether the school had a CFST team, and whether a school had a school-based health center (SBHC).
This project presented two major challenges in terms of data collection. The first challenge was identifying appropriate student outcome variables that may change due to the presence of a school nurse. In our analysis, we used data on the number of days a student was absent, as research indicates that student attendance may be correlated with the presence of the school nurse. However, a more ideal measure would have been the number of days a student checked out early due to health issues or the number of school days a student with chronic health conditions missed. Unfortunately, this level of detail is not available. The potential risk of using school level attendance data is two-fold: first, the number of days a student is absent includes reasons for absence that are unrelated to health. Second, the effect of a nurse’s presence may be diluted by the fact that not all children use nursing services over the course of a year. To help mitigate this possibility, we collected the number days absent only for economically disadvantaged students, as we know, based on research referenced above, that these students are more likely to have unmet health needs.24
The second, and more daunting, challenge was identifying the actual number of full-time equivalent (FTE) nurses present on-site at each school during the years of interest – the key independent or treatment variable upon which our study hinged. We initially attempted to collect this information from the North Carolina Department of Public Instruction’s (DPI) financial and personnel records. However, over the course of the project we learned that DPI’s records do not capture all nurses working in schools across the state. Obtaining an accurate and complete count of the FTE number of nurses working at NC’s schools is complicated by the fact that numerous sources fund school nurses and that these funds are administered by multiple agents (see Appendix V). For example, nurses funded through the Department of Health and Human Services (DHHS) or nurses on contract through a local department of health do not appear in DPI’s records.
Given that DHHS collects and reports on the state’s nurse-to-student ratio, our next step was to request nurse staffing levels at the schools in our study from the Division of Public Health. However, DHHS only reports the district level number of nurses. When asked if data was available disaggregated by school, we were informed that DHHS did not maintain school level data and that obtaining this level of data would require surveying each school. The information collected in the Annual School Health Services Report depends on the voluntary participation of LEAs and school officials. To encourage full participation, DHHS has agreed not to disaggregate the data beyond the LEA level, and in most cases the state level.
In a final effort to obtain the information we deemed critical to our analysis we surveyed HR directors at all 36 LEAs in our study. To date, we have collected FTE nurse staffing levels for 68 of the 101 schools in our study. At the time of publishing this report, we are still awaiting survey results from 9 LEAs (see Appendix VI for survey results). Interestingly, one LEA reported that they did not maintain school level records on nursing personnel because these positions are all contracted out through the county health department. An additional survey to each school in this LEA or to the county health department would be required.
The limited data available on nurse staffing levels precluded our original plan to analyze the effect of a nurse’s presence on student absences using regression models that incorporated school and year fixed effects. The benefit of a fixed effects model is that it would have controlled for unobserved differences between the schools that remained constant over time (e.g. differences between schools in the educational
24 Rothstein, 37-42.

6 7
attainment of students’ parents), or unobserved differences that changed over time but remained constant across the schools in any given year (e.g. a statewide policy that affected all schools in the same year). Such a model helps to mitigate the possible selection bias that can occur when programs or personnel are not placed at schools based on a random assignment. For example, in the absence of random assignment, programs may be placed at a school based on observed need. If a school with a program faces greater challenges than a school without a program, simply comparing outcomes between these two schools after the program has been implemented will not provide an accurate assessment of the program’s impact. Other differences between the two schools may be contributing to the difference in outcomes.
In the absence of school level data on the number of FTE nurses, we used the district level nurse-to-student ratio as a proxy for the actual variation that occurred in school nurse staffing levels over time between schools involved in turnaround. The use of a district level ratio has many limitations. All schools within the same district are coded as if they offered the same level of nursing services to their students, when in reality staffing levels differed within many of the districts, in some cases widely. For example, some schools have a nurse present one day a week, while other schools in the same district have a nurse present five days a week – a difference we hypothesize may result in significant differences in student outcomes.
We decided the benefits gained from a school level regression model with fixed effects would likely be nullified by the lack of precision introduced by the district level independent variable. Instead, we determined that the best we could do with currently available data set was to compare the mean number of days that economically disadvantaged (ED) students were absent in schools with a nurse-to-student ratio that met the CDC minimum recommended ratio versus in schools that did not meet this ratio. A statistical comparison of means does not demonstrate a causal relationship. The comparison simply identifies whether the difference, in this case of days absent, between two groups is statistically significant. At best a comparison of means may suggest the possibility of a relationship between a nurse’s presence and the number of days ED students are absent; however, without a more rigorous regression analysis, we cannot rule out other factors that are likely contributing to the difference.
FINDINGS
The school districts in which turnaround schools were located experienced significant variation in nurse staffing levels during the period this study examined (see Appendix II and III). In 2005-06, the year before turnaround services began, only three of the 36 LEAs had nurse-to-student ratios that met the recommended minimum level. By 2011, 12 out of the 36 LEAs met the recommended level.
tabLe 6: compaRison of chaRacteRistics betWeen tuRnaRound schooLs With distRict-LeveL nuRse-to-student Ratios ≤1:750 and >1:750 (2006 – 2011)
schooL pRofiLe
mean
Ratio met Recommended level
Ratio did not meet Recommended level p-value
school size 591 857 0.00**
teacher turnover 23.0% 21.8% 0.26
percent of students in poverty 77.1% 68.1% 0.00**
math proficiency (economically disadvantaged) 62.1% 74.3% 0.23
n 117 475
two sample t-tests with equal variance, stata version 12.1 *statistically significant at 0.05 level **statistically significant at 0.01 level
tabLe 7: compaRison of outcomes betWeen tuRnaRound schooLs With distRict-LeveL nuRse-to-student Ratios ≤1:750 and >1:750 (2006 – 2011)
schooL pRofiLe
mean
Ratio met Recommended level
Ratio did not meet Recommended level p-value
days absent, per year (economically disadvantaged) 10.9 11.6 0.03*
short-term suspensions per 100 56.5 55.6 0.796
n 117 472
two sample t-tests with equal variance, stata version 12.1 *statistically significant at 0.05 level **statistically significant at 0.01 level

6 7
We first divided the schools into two groups: those that met the minimum recommended nurse-to-student ratio and those that did not. Next we compared the difference between the two groups in school size, teacher turnover, percent of students living at or below poverty, and the percent of economically disadvantaged students who were proficient in math (measured by scores on either math EOG or Algebra I EOC assessments). On average, schools that met the recommended nurse-to-student ratio were smaller and had higher concentrations of students living in poverty. These differences are not especially surprising since nurses funded by the School Nurse Funding Initiative are assigned based on unmet need. As poverty is associated with greater health needs among children, and as many of NC’s rural counties have concentrations of poverty, we would expect the allocation of nurses based on need to prioritize communities with higher poverty and smaller schools. There were no statistically significant differences between the two groups in terms of teacher turnover or percent of ED students who were proficient in math, although these differences may have been significant with a larger sample size.
As the final step in our analysis, we compared the two groups of schools on the number of days, on average, ED students missed per year. We found that ED students attending schools located in districts with nurse-to-student ratios that met the recommended level missed less school (see Table 7). However, the difference of 0.7 days, while statistically significant, may not be materially significant. It is also worth noting that ED students in both groups of schools missed, on average, more than two weeks of school each year.
The findings point to a negative correlation between nurse staffing levels and the number of days a student is absent from school (i.e., as nurse staffing levels increased, students were absent less). That we find a statistically significant difference between the two groups is made more interesting by the fact that the schools located in districts with better ratios of nurses also had higher concentrations of poverty. From research, we would expect to find that higher concentrations of poverty are associated with higher rates of absenteeism. That we find the opposite to be the case in the above analysis could possibly suggest that higher levels of nurses may benefit schools with high concentrations of poverty, and that the size of this benefit may be underrepresented in the current analysis. However, given the limitations of this statistical approach, it is also possible that factors other than variation in nurse staffing levels are driving the differences in student absenteeism.
It is difficult to anticipate what relationship we would find if we were able to use the actual school level nurse FTEs in our analysis. Our initial survey results from 68 of the schools in our study reveal that there is significant variation in the number of days a nurse is present (see Appendix IV). Of these 68 schools, 55% had a nurse on site the equivalent of two days per week or less in 2006 compared to 27% that had a nurse on site five days a week. By 2011, school nurse staffing levels at these same schools had slightly improved. The percent of schools with a nurse on site two days per week or less decreased to 50% while the percent of schools with a full-time nurse increased to 32%.

8 9
RECOMMENDATIONS
Based on the above findings, we recommend that DPI and the State Board of Education take the following actions:
1. improve dpi’s collection of data pertaining to student support services.
Annually collect FTE staffing levels at each school for all school personnel, regardless of the funding source for the staff member or whether the staff member is employed on a contractual basis with a third party (e.g., local health department). Our report revealed that DPI currently lacks the data needed to identify the total number of FTE nurses working in public schools, where they work, or how many hours they are present on school grounds. Without such detailed information, DPI is limited in its ability to advocate for and recommend the most efficient allocation of human resources, given limited funding, for the purpose of maximizing student outcomes. Additionally, based on research that improved student outcomes are associated with the presence of nurses on school grounds more days per week, DPI should consider whether “nurse days on-site” is a more appropriate measure for future reporting and policy setting than district level nurse-to-student ratios.
Study the feasibility of collecting school level data on the number and type of health services provided, and student level data on days of early check out related to health and number of times a student visited the school nurse. These data fields, if required, would greatly increase the ability of researchers to analyze the impact of school nurses.
Partner with the Division of Public Health to ensure the above actions do not duplicate efforts and that information is shared appropriately and efficiently between agencies in order for the state to best meet the needs of its youngest and most vulnerable citizens.
2. conduct a more rigorous evaluation of the impact of school nursing levels on student outcomes.
Increase the accuracy and precision of the analysis by using school level data on the number of FTE nurses and student level data on outcomes more directly connected to the receipt of health services, including: • Thenumberofdaysthatstudentswithchronichealth
conditions checked out early for health related reasons; • Thenumberofservicesstudentswithchronichealth
conditions received from a school nurse; • Whetherstudentsreceivedfollowupcarewhenreferredtoa
provider as part of school-based health screening programs.
Use findings from the evaluation to conduct a cost-benefit analysis of increasing the number of nurses in North Carolina Public Schools.
3. Revisit the state board of education’s 2004 recommendation to ensure a statewide nurse-to-student ratio of 1:750 by 2014.
The state is unlikely to meet this goal by the timeline originally proposed by the SBE. Given the CDC’s recommendation, and the evidence from numerous research studies in support of a ratio of one nurse per 750 students, the SBE should determine: • Whatfactorshinderedthestatefromloweringtheratio
further than 1:1,200; • Whatpriorityshouldbegiventothisgoalinlightofother
priorities and competing financial considerations. According to the State Board of Education’s 2013-2015 Budget Expansion Request, the state can achieve the minimum school nurse ratio in all schools by committing $61,145,280 more per year to fund 960 additional school nurses.25
25 North Carolina Department of Public Instruction. “Expansion Requests to Consider for 2013-2015.” Oct. 23, 2012.

8 9
Appendix I – Number of identified individual chronic health conditions among NC children, 2005 - 2011Source: Annual School Health Services Reports, NC DHHS
Appendix II – District Level Nurse-to-Student Ratios, 2006
0
100,000
200,000
300,000
400,000
2005 2006 2007 2008 2009 2010 2011
197,052
292,288
Num
ber o
f Chr
onic
Hea
lth C
ondi
tions
0 1000 2000 3000 4000 5000
ForsythLexington City
DurhamCumberland
WilsonGuilford
WayneMartin
RockinghamHarnettRowanLenoir
HokeMecklenburg
AlamanceGastonBladen
CaswellRichmond
VanceNorthampton
WarrenColumbus
JonesHalifax
PasquotankRobesonFranklin
BrunswickDuplinBertieAnson
WashingtonHertford
Perquimans
CDC Recommended Staffing Level – 1: 750
3 LEAs met recommended
level
Source: Annual School Health Services Report, NC DHHS

10 11
Appendix III – District-Level Nurse-to-Student Ratios, 2011
0 500 1000 1500 2000 2500 3000 3500
Lexington cityguilford
cumberlandWilsonharnettforsyth
RockinghamRowangastonLenoir
durhambrunswick
mecklenburgWayne
franklinRobeson
hokepasquotank
columbusbladen
alamanceperquimans
Richmondcaswell
vancebertieduplinmartin
hertfordWarren
Washingtonnorthampton
Joneshalifaxanson
CDC Recommended Staffing Level – 1: 750
12 LEAs met recommended
level
Source: Annual School Health Services Report, NC DHHS

10 11
Appendix V – Administrative Agents for School Nurse Funding, 2011Source: Annual School Health Services Report, NC DHHS, 2011.
Appendix IV – FTE Nurse Staffing Levels at Schools Targeted for Turnaround Services, 2006 and 2011 (Results from 68 out of 101 schools surveyed)
Results from survey of LEA HR Directors, 2013 (n=68 schools per year). All turnaround LEAs surveyed (36). 67% response rate.
0
5
10
15
20
25
30
35
40
45
1 or less 23 45
equivalent number of days a nurse was present on-site
perc
ent o
f sch
ools
Rep
ortin
g
20062011

Works cited
•Allen,Gay.“Theimpactofelementaryschoolnursesonstudentattendance.”TheJournalofSchoolNursing19,no.4(2003):225-231.
•Allensworth,ElaineM.,andJohnQ.Easton.“WhatmattersforstayingontrackandgraduatinginChicagoPublicHighSchools.”Chicago,IL:ConsortiumonChicagoschoolresearch. Retrieved December 17 (2007): 2007.
•Engelke,MarthaKeehner,MelvinSwanson,MarthaGuttu,MichelleB.Warren,andSarahLovern.“SchoolNursesandChildrenWithDiabetes.”NCMedJ72(2011):351-358.
•Gifford,ElizabethJ.,RebeccaWells,YuBai,TonyO.Troop,ShariMiller,andLeslieM.Babinski.“PairingNursesandSocialWorkersinSchools:NorthCarolina’sSchool-BasedChild and Family Support Teams.” Journal of School Health 80, no. 2 (2010): 104-107.
•Guttu,Martha,MarthaKeehnerEngelke,andMelvinSwanson.“DoestheSchoolNurse-to-StudentRatioMakeaDifference?.”JournalofSchoolHealth74(2004):6-9.
•Hill,NinaJean,andMarianneHollis.“TeacherTimeSpentonStudentHealthIssuesandSchoolNursePresence.”TheJournalofSchoolNursing28(2012):181-186.
•McFarland,Joel,andJenniferPreston.“EvaluatingtheEffectivenessofTurnaroundEffortsinLow-PerformingHighSchool.”NCDPI(2010):http://www.ncpublicschools.org/docs/intern-research/reports/turnaround.pdf. (accessed June 5, 2013).
•Meyer,Robert.“RunningtheNumbers:SchoolHealthServicesReportsforNorthCarolinaPublicSchools.”NCMedJ72(2010),327-328.
•NationalAssociationofSchoolNurses,“SchoolNursesMakeADifference.NationalSchoolNurse-to-StudentRatioRankings.”NASN(2010):http://www.nasn.org/portals/0/about/press_room_faq.pdf (accessed June 7, 2013).
•NorthCarolinaChildHealthAssessmentandMonitoringProgram,“SchoolAbsenteeismandChildren’sHealth.”NCStateCenterforHealthStatistics.http://www.schs.state.nc.us/schs/pdf/CHAMP_FS_Absenteeism_WEB.pdf (accessed August 18, 2013).
•NorthCarolinaDepartmentofHealthandHumanServices.“AnnualReportsofSchoolHealthServices.”SNANC.http://www.snanc.org/about-snanc/published-reports/138-north-carolina-annual-school-services-reports.html (accessed June 6, 2013).
•NorthCarolinaDepartmentofPublicInstruction.“ExpansionsRequeststoConsiderfor2013-2015.”Oct.23,2012.
•NorthCarolinaHealthySchools.“2010SchoolHealthProfiles.”NCDPI(2011):http://www.nchealthyschools.org/docs/data/profiles/2010/2010profiles.pdf(accessedJune6,2013).
•NorthCarolinaSchoolHealthUnit.“NorthCarolinaSchoolHealthProgramManual.”5thEd.NCDHHS(2010):http://www.ncdhhs.gov/dph/wch/doc/lhd/nc_school_health_program_manual_2010.pdf (accessed July 5, 2013).
•Rothstein,Richard.“Classandschools:Usingsocial,economic,andeducationalreformtoclosetheachievementgap.”Washington,DC:EconomicPolicyInstitute(2004).
•Telljohann,Susan,JosephDakeandJamesPrice.“EffectsofFull-TimeversusPart-TimeNursesonAttendanceofElementaryStudentswithAsthma.”TheJournalofSchoolNursing 20 (2004): 331-334.
•Thompson,Charles,KathleenBrown,LatriciaTownsend,GaryHenry,andKevinFortner.“TurningAroundNorthCarolina’sLowestAchievingSchools(2006-2010).”NCConsortium for Educational Research and Evaluation. (2011): 1-82.
•Troop,Tony,andCarolP.Tyson.“Schoolnurses,counselors,andchildandfamilysupportteams.”NCMedJ69,no.6(2008):484-486.
•Viadero,D.“Absenteeism.”EducationWeek.31(2011):4.
•Wyman,LindaL.“Comparingthenumberofillorinjuredstudentswhoarereleasedearlyfromschoolbyschoolnursingandnonnursingpersonnel.”TheJournalofschoolnursing 21, no. 6 (2005): 350-355.
12
By Ryan Smith and Jessica Sherrod The Financial and Business Services Area is in its seventh year of the Research Intern Program. The Program is designed to help build a quality research program within NCDPI to supplement and supply data for discussions related to procedural, process, and policy changes. This year’s program included students from Duke University’s Master of Public Policy program as well as The University of North Carolina at Chapel Hill’s Master of Public Administration
programandDoctorateinEducationprogram.TheinternprogramismanagedbyEricMoore(919-807-3731)andKaylaSiler(919-807-3824)|[email protected]. NC DEPARTMENT OF PUBLIC INSTRUCTION : : June st. clair atkinson, ed.d., state superintendent : : 301 n. Wilmington street : : Raleigh, nc 27601-2825 In compliance with federal law, the NC Department of Public Instruction administers all state-operated educational programs, employment activities and admissions without discrimination because of race, religion, national or ethnic origin, color, age, military service, disability, or gender, except where exemption is appropriate and allowed by law. Inquiries or complaints regarding discrimination issues should be directed to: Dr. Rebecca Garland, Chief Academic Officer Academic Services and Instructional Support :: 6368 Mail Service Center, Raleigh, NC 27699-6368 :: Telephone: (919) 807-3200 :: Fax: (919) 807-4065